Embed Size (px)
Citation preview

SANDHILL CRANE MONITORING AT STATEN ISLAND,SAN JOAQUIN COUNTY, CALIFORNIA, 2002-03.
A survey for:The Nature Conservancy
13501 Franklin Blvd.Galt, CA 95632
As subcontractors for:May and Associates, Inc.
PO Box 1156Walnut Grove, CA 95690
Gary L. Ivey, PO Box 2213, Corvallis, OR 97333Caroline P. Herziger, PO Box 686, Florence, OR 97439
August 2003

TABLE OF CONTENTS
LIST OF TABLES AND FIGURES.............................................................................................. iii
ACKNOWLEDGMENTS ...............................................................................................................v
EXECUTIVE SUMMARY ........................................................................................................... vi
INTRODUCTION ...........................................................................................................................1
STUDY AREA ................................................................................................................................1
METHODS ......................................................................................................................................2 Field data collection...................................................................................................................2 Importance of Staten for cranes .................................................................................................5 Crane habitat use and preference assessment ............................................................................5
RESULTS AND DISCUSSION......................................................................................................6 The importance of Staten for sandhill cranes ............................................................................6 Connectivity of North Delta sites for cranes........................................................................6 Number of cranes.................................................................................................................7 Subspecies............................................................................................................................9 Origins of color-marked cranes .........................................................................................10 Winter biology of cranes..........................................................................................................11 Winter home ranges and movements of color-marked cranes...........................................11 Age ratios and recruitment.................................................................................................15 Use of habitats by sandhill cranes............................................................................................15 Chronological use ..............................................................................................................16 September to early October ....................................................................................... 16 Mid- to late October....................................................................................................16 Early November ..........................................................................................................17 Mid-November............................................................................................................17 Late November............................................................................................................17 Early December ..........................................................................................................18 Mid- to late December ................................................................................................18 Early to mid-January...................................................................................................18 Late January ................................................................................................................18 Early February ............................................................................................................19 Mid- to late February ..................................................................................................19 Early March ................................................................................................................19 Effects of Staten management practices on cranes ..................................................................19 Feeding sites ......................................................................................................................20 Roost sites ..........................................................................................................................24 Disturbance ........................................................................................................................25 Aircraft........................................................................................................................25

iii
TABLE OF CONTENTS (con’t)
Vehicles used for farming...........................................................................................26 Hunting .......................................................................................................................26 Recreation ...................................................................................................................28
MANAGEMENT CONSIDERATIONS.......................................................................................28 Management of crane use areas ...............................................................................................28 Crop selection ....................................................................................................................28 Crop treatment ...................................................................................................................30 Roost sites ..........................................................................................................................30 Disturbance ..............................................................................................................................31 Aircraft...............................................................................................................................31 Farming operations ............................................................................................................31 Hunting ............................................................................................................................. 32 Recreation and public education about cranes...................................................................32 Future crane monitoring and research......................................................................................32 Future monitoring ..............................................................................................................32 Future research...................................................................................................................33 Mitigation recommendations ...................................................................................................33
CONCLUSION..............................................................................................................................33
LITERATURE CITED ..................................................................................................................34
Appendix A. Roosting and feeding count totals of sandhill cranes at Staten Island, San Joaquin County, California, 2002-03.......................................................................................37
Appendix B. Sandhill crane feeding count totals at the North Sacramento-San Joaquin Delta, California, 2002-03 ..................................................................................................................38
Appendix C. Historic numbers of cranes counted at North Sacramento-San Joaquin Delta sites, California 1983-89, 1990-91, 1993, and 2000-01 ..........................................................39
Appendix D. Identity of color-marked cranes at the North Sacramento-San Joaquin Delta, Stone Lakes NWR, and Cosumnes River Floodplain, California, 2002-03 ............................40
Appendix E. Winter ranges of color-marked cranes at the North Sacramento-San Joaquin Delta and Cosumnes River Floodplain, California, 2002-03...................................................42
Appendix F. Sandhill crane adult:colt ratios and recruitment at the North Sacramento-San Joaquin Delta, Cosumnes River Floodplain, and Stone Lakes NWR, California, 2002..........52
Appendix G. Sandhill crane use-days for bi-weekly periods at Staten Island, San Joaquin County, California, 2002-03 ....................................................................................................54

iv
TABLE OF CONTENTS (con’t)
LIST OF TABLES AND FIGURES
Table 1. Winter home range sizes and distances moved during shifts in use areas ofcolor-marked cranes at the North Sacramento-San Joaquin Delta, Cosumnes River
Floodplain, and Cosumnes River Preserve, California, 2002-03.............................................12
Table 2. Bi-weekly Habitat Preference Indices for feeding sandhill cranes at Staten Island, San Joaquin County, California, 2002-03................................................................................24
Table 3. Distances between feeding and roost sites for marked greater sandhill cranes at theNorth Sacramento-San Joaquin Delta, Cosumnes River Floodplain, and Stone Lakes
NWR, California, 2002-03.......................................................................................................25
Figure 1. Areas surveyed for sandhill cranes in the North Sacramento-San Joaquin Delta,Stone Lakes NWR area, and Cosumnes and Mokelumne river floodplains, California,
2002-03 ......................................................................................................................................1
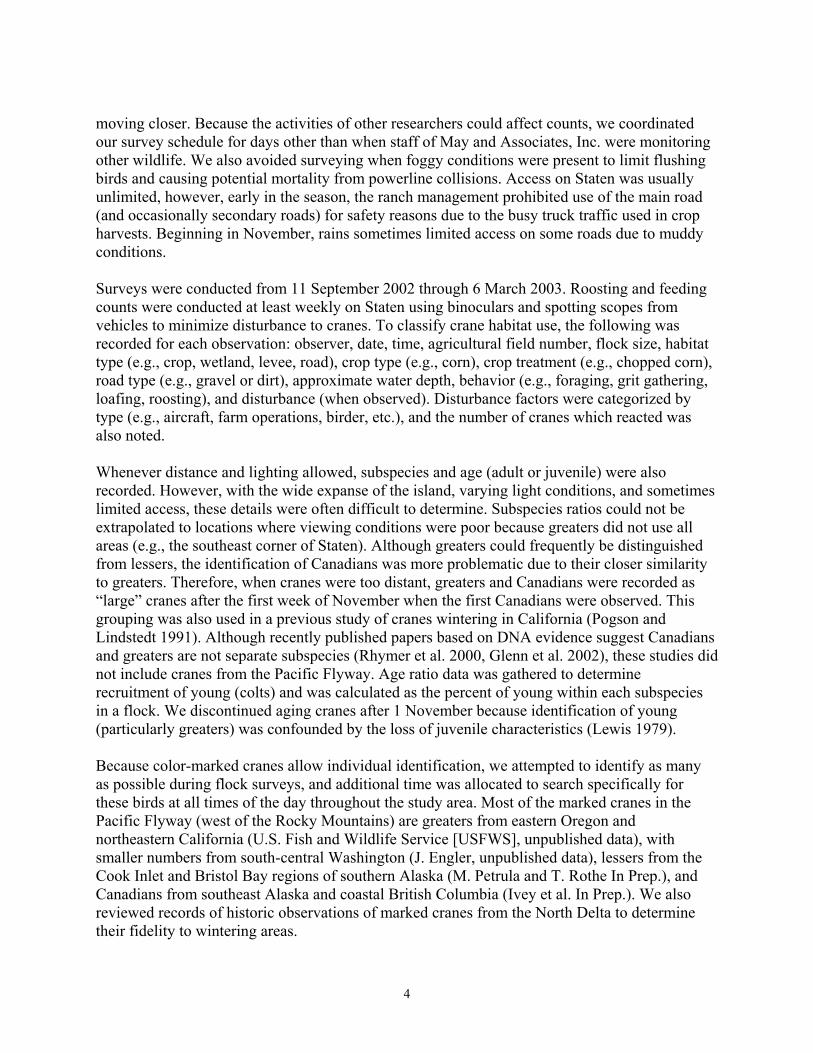
Figure 2. Crops on Staten Island, San Joaquin County, California, 2002-03 ..................................3
Figure 3. Flight patterns of feeding and roosting sandhill cranes using the North Sacramento- San Joaquin Delta, California, 2002-03.....................................................................................6
Figure 4. Roost and feeding counts of sandhill cranes at Staten Island, San Joaquin County,California, 2002-03 ....................................................................................................................7
Figure 5. Percentage of feeding sandhill cranes counted at North Sacramento-San Joaquin Delta sites, California, 2002-03 .................................................................................................8
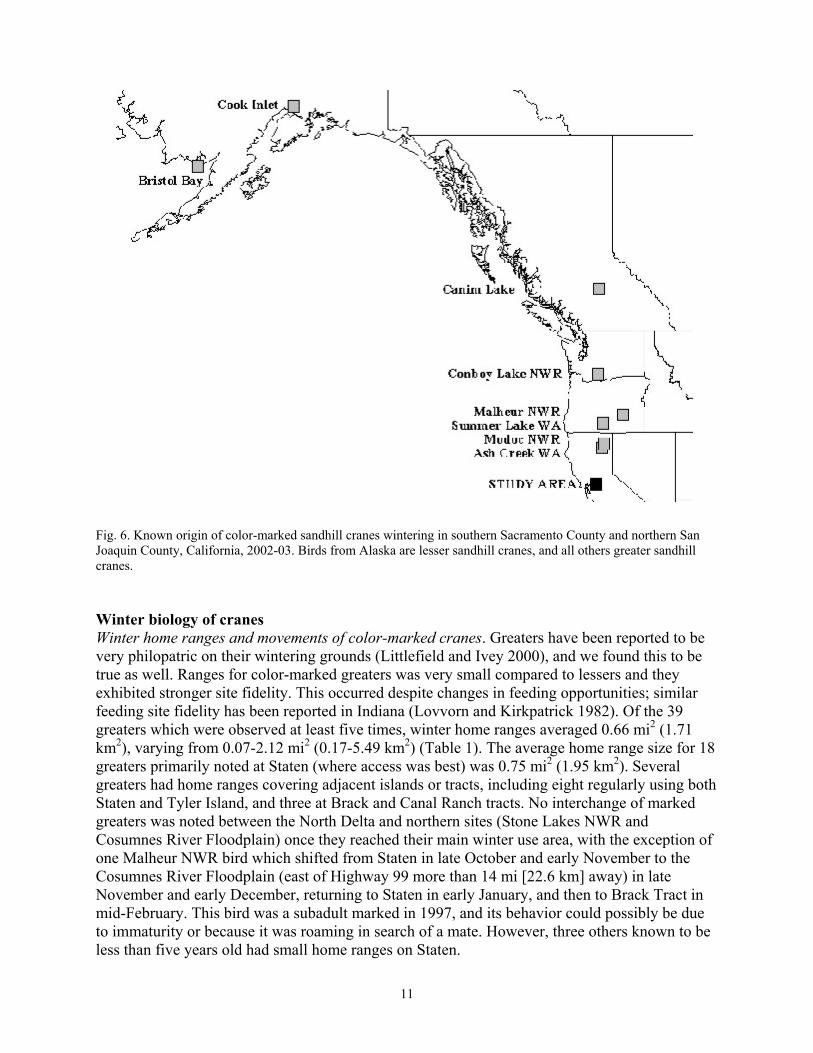
Figure 6. Known origin of color-marked sandhill cranes wintering in southern Sacramento County and northern San Joaquin County, California, 2002-03..............................................11
Figure 7. Shift in winter range of color-marked greater sandhill cranes from early roostwater on northeast Staten Island to north and central Staten Island, Tyler Island, and
Brack Tract, North Sacramento-San Joaquin Delta, California, 2002-03 ...............................14
Figure 8. Shift in winter range of color-marked greater sandhill cranes onto Brack Tractdue to lack of roost water on Staten and Tyler islands, North Sacramento-San Joaquin
Delta, California, 2002-03 .......................................................................................................14
Figure 9a. Percentages of feeding sandhill crane use-days in agriculture areas at Staten Island, San Joaquin County, California, 2002-03 ....................................................................22

v
TABLE OF CONTENTS (con’t)
Figure 9b. Percentages of feeding sandhill crane use-days in agriculture areas at Staten Island, San Joaquin County, California, 2002-03 ....................................................................22
Figure 10. Percentages of feeding sandhill crane use-days in non-agricultural areas at Staten Island, San Joaquin County, California, 2002-03 ....................................................................23
Figure 11. Overall percentages of feeding sandhill crane use-days by habitat type at Staten Island, San Joaquin County, California, 2002-03 ....................................................................23
vi
ACKNOWLEDGMENTSJim and Sally Shanks were invaluable during this study by providing housing and mail service,and sharing the history of the island and their knowledge of local wildlife. Keith Whitener of TheNature Conservancy served as the coordinator for this project and permitted access to theCosumnes River Preserve. Matt Gause of May and Associates, Inc. served as our liaison. TheCalifornia Department of Fish and Game allowed entry to Isenberg Crane Reserve, and wildlifebiologist Ron Schlorff assisted with obtaining a Memorandum of Understanding. The staff atStone Lakes National Wildlife Refuge provided access to the refuge and temporary housing.
Shannon Ludwig of Modoc National Wildlife Refuge, George Studinski (formerly of ModocNational Forest), Marty St. Louis of Summer Lake Wildlife Area, Mike Petrula of AlaskaDepartment of Fish and Game, and Joe Engler of Conboy Lake National Wildlife Refuge kindlyshared records of their color-marked cranes. Susan Lindstedt, Carroll Littlefield, Tom Pogson,and Ron Schlorff recorded most of the historic color-marked crane sightings from the area, andEsther Milnes and Sally Shanks provided observations from recent years.
Rick Cooper, Mike Eaton, Ramona Swenson, and Keith Whitener of the Cosumnes RiverPreserve, Jim and Sally Shanks of Conservation Farms and Ranches, Inc., and Matt Gause ofMay and Associates, Inc. provided suggestions on the draft manuscript. This project was fundedby a grant to The Nature Conservancy from CALFED.

vii
EXECUTIVE SUMMARYSurveys of wintering sandhill cranes (Grus canadensis) were conducted in the winter of 2002-03in the Sacramento-San Joaquin Delta (Delta) of California and other areas just north of the Delta,with Staten Island (Staten) being the focus of the study. Staten is one of the most important sitesfor sandhill cranes in California, including the greater subspecies (G. c. tabida) which is state-listed as Threatened. Crane use at Staten has dramatically increased since the 1980s due toconversion to crops with greater wildlife value and a reduction in disturbance from changes infarming and hunting operations which made these activities more conducive to crane use.
Sandhill cranes used Staten for a span of six months, from 7 September through at least 6 March,while individual color-marked greaters were recorded for nearly five months. Therefore,wintering sites are very important to the welfare of cranes as they provide a significant portion oftheir annual life history needs. Crane movements in the Delta throughout the winter illustratedthat Staten was a keystone feature of the crane habitat landscape, and was not used in isolationfrom other sites, however, many marked greaters used Staten exclusively. Peaks of 8,552 feedingand 7,987 roosting cranes were recorded, which represented 36.3% of the feeding crane use inthe North Delta (north of Highway 12) through the entire winter, and 52.5% for the corewintering period (November-January). Historical aerial surveys have reported high percentagesof crane use on Staten as well, ranking it second in importance to adjacent Brack Tract.However, for overall winter use in 2002-03, Staten exceeded Brack Tract since extensive areasof flooded rice have reduced the available foraging habitat.
Distribution of subspecies varied within the study area, but certain sites were critical to greaters(e.g., Staten Island, Brack Tract, and Stone Lakes National Wildlife Refuge [NWR]). Thissubspecies has strong philopatry to traditional use areas, with some individual color-markedbirds known to have used the same very local wintering areas for at least 18 years, highlightingthe importance of maintaining these areas. Marked greaters observed wintering on Staten nest instates where the subspecies is listed as Endangered (Washington), Threatened (California),Sensitive (Oregon), and Vulnerable (British Columbia, Canada). We estimated thatapproximately 1,500 greaters used Staten, which is a significant portion of those using thePacific Flyway, representing at least 15% of the entire Central Valley Population (CVP) ofgreater sandhill cranes.
Winter home ranges for marked greaters were relatively small, averaging less than one squaremile (0.66 mi2 [1.71km2]), despite the constant changing food availability through the season.Flight distances from roost sites to foraging areas also averaged less than one mile (0.88 mi [1.42km]), and were similar to previous crane surveys in the Delta, indicating the need for suitableroost sites in close proximity to feeding areas. Observations of movements of marked cranes alsodemonstrated the need for the presence of early and late season roost sites. In contrast, lessersandhill cranes (G. c. canadensis) had much larger winter ranges and foraged further from roostsites. Therefore, the needs of this subspecies can be provided for in a larger landscape.
Crops grown on Staten (e.g., corn, wheat and tomatoes) and non-agriculture areas (e.g., leveesand roads) were evaluated for importance to foraging cranes. Crane use and preference ofdifferent crop treatments shifted over time in response to changes in food availability, withchopped corn the most important for the entire season. However, harvested wheat with various

viii
treatments, newly-planted winter wheat fields, and a small wetland field were highly preferred attimes; it was generally only after wheat fields were apparently fed out that corn crops becamefavored. Regardless of the crop type, cranes were very attracted to newly-flooded fields and theexposure of fresh dirt from the pushing up levees which exposed rodents and invertebrate preyand provided crane foraging sites for short term periods.
With transition to The Nature Conservancy (TNC) ownership in 2003, the preservation of Statenas a feeding and roosting site for wintering sandhill cranes is imperative, as a substantial numberdepend on the island. Staten has become even more important for cranes as other use areas in theDelta and to the north are being lost to conversion to incompatible crops and urban development.If properly protected and managed, Staten will continue to significantly contribute to the welfareof Pacific Flyway sandhill cranes and serve as a demonstration area to show how farming andwildlife can coexist.

1
INTRODUCTIONIn 2001, TNC negotiated the purchase of the M & T Incorporated-Staten Ranch from PacificRealty Trust LP, and took possession in January 2003. It is currently a unit of the CosumnesRiver Preserve, operated by Conservation Farms and Ranches, Inc., an affiliate of TNC. During2002-03, extensive monitoring of sandhill cranes and their habitat use was conducted as part of ashort-term study in association with May and Associates, Inc. of Walnut Grove, California,under contract with TNC. The purposes of the study were to: 1) document baseline crane data forfuture management and projects, 2) determine the relative importance of wintering crane use onStaten compared with other sites in the region, and 3) assess how current and past agriculturalpractices have affected crane use and abundance.
STUDY AREACranes were surveyed at sites in the North Delta (Brack, Canal Ranch, New Hope andTerminous tracts, and Andrus, Dead Horse, Grand, Staten, and Tyler islands), and further northin southern Sacramento County at TNC’s Cosumnes River Preserve, the Cosumnes andMokelumne river floodplains, Stone Lakes NWR, Sun River Ranch (a mitigation parcel whichwill become part of Stone Lakes NWR), the Russell Road area, and surrounding agriculturalareas (Figure 1). Cranes are also known to use several other islands and tracts south of Highway12 (South Delta) in lower numbers, but these were not surveyed as they are difficult to access,and the North Delta region has historically been considered the primary crane use area (e.g.,California Department of Fish and Game [CDFG], unpublished data).
Fig. 1. Areas surveyed for sandhill cranes at the North Sacramento-San Joaquin Delta, Stone Lakes NWR area, andCosumnes and Mokelemne river floodplains, California, 2002-03.
2
Staten Island in San Joaquin County was the focus of the study area (Figure 2). It containsapproximately 9,200 acres (3,724.7 ha), and is bordered by the North and South Forks of theMokulumne River. A primary asphalt and gravel road runs down the center, a graveled leveeroad around the perimeter, and a few gravel and dirt roads connect the main road to the mainlevee. Elevations range from sea level to 20 feet (6 m) below due to peat soil subsidence andoriginal reclamation. There are 153 fields ranging from approximately 12-124 acres (4.9-50.2ha), and about 30 miles (48.4 km) of irrigation ditches and 81 miles (130.6 km) of drainageditches. Approximately 8,419 acres (3408.5 ha) were farmed in 2002-03, and a total of 2,271acres (919.4 ha) were flooded to provide fall and winter roosting and foraging sites for cranes,waterfowl, and shorebirds.
Three subspecies of sandhill cranes winter at Staten: greater, lesser, and the intermediate-sizedCanadian (G. c. rowani). The greater is of particular importance as it was listed as a Threatenedspecies in the state by the California Game Commission in 1983. Greaters which winter at theDelta belong to the CVP and breed in several western states and interior British Columbia(Pacific Flyway Council 1997). Recent breeding surveys have been conducted in Oregon (1,151pairs--Ivey and Herziger 2000), California (465 pairs--Ivey and Herziger 2001), and Washington(20 pairs--see Littlefield and Ivey 2002). At least 11 pairs have been reported from westernNevada (see Ivey and Herziger 2001), but numbers in British Columbia are unknown. All lessersthat winter in California are thought to nest in Alaska (Pacific Flyway Council 1983). Nestingareas for Canadians are less well known, but are presumed to be coastal British Columbia andthe southeast panhandle of Alaska (Ivey et al. In Prep.). The presence of a rare demoiselle crane(Anthropoides virgo) in the Delta in the winter of 2001-02 indicates some cranes could also befrom Siberia, Russia.
METHODSField data collectionWe focused our crane counts on feeding birds because foraging is primarily crop dependent androosting and loafing is less so. When gathering data, it was important to understand the dailybehavior patterns of the species. Cranes wintering in the Delta spent nights roosting in shallow-flooded fields or wetlands and flew out in the mornings to feed in nearby grainfields, pastures, orwetlands. During mid-day, they usually returned to their roost sites to loaf, but sometimesutilized alfalfa fields, pastures, or wetlands. They primarily rested and preened during thisperiod, but also occasionally fed. By late afternoon, cranes usually flew back to feeding areaswhere they remained until returning to roosts around sunset. However, during afternoons whenfog had lingered or during periods of high temperature, cranes often loafed rather than fed inafternoons. Therefore, observation of behavior was critical, for habitat use may not haverepresented that for feeding birds. In addition, feeding counts had to be carefully timed so thatsurveys began after cranes left roosts in early morning, yet ended before cranes began to loaf inthe late morning. For afternoon surveys, starting time began after cranes resumed feeding in theafternoon, but before flying out to roosts. Surveys of roosting cranes were also conducted beforethey left the roosts in mornings or as they flew into roost sites in the evening.
Cranes are not tolerant of excessive disturbance and will readily fly or walk away fromapproaching vehicles and abandon areas with regular human use. Therefore, we approachedcranes slowly and cautiously, allowing them to become accustomed to our presence before

3
Fig. 2. Crops on Staten Island, San Joaquin County, California, fall and winter 2002-03 (modified from Staten Ranch version).
WHEAT
FIELD CORN
TOMATOES
CORN PLANTED TO WHEAT
4
moving closer. Because the activities of other researchers could affect counts, we coordinatedour survey schedule for days other than when staff of May and Associates, Inc. were monitoringother wildlife. We also avoided surveying when foggy conditions were present to limit flushingbirds and causing potential mortality from powerline collisions. Access on Staten was usuallyunlimited, however, early in the season, the ranch management prohibited use of the main road(and occasionally secondary roads) for safety reasons due to the busy truck traffic used in cropharvests. Beginning in November, rains sometimes limited access on some roads due to muddyconditions.
Surveys were conducted from 11 September 2002 through 6 March 2003. Roosting and feedingcounts were conducted at least weekly on Staten using binoculars and spotting scopes fromvehicles to minimize disturbance to cranes. To classify crane habitat use, the following wasrecorded for each observation: observer, date, time, agricultural field number, flock size, habitattype (e.g., crop, wetland, levee, road), crop type (e.g., corn), crop treatment (e.g., chopped corn),road type (e.g., gravel or dirt), approximate water depth, behavior (e.g., foraging, grit gathering,loafing, roosting), and disturbance (when observed). Disturbance factors were categorized bytype (e.g., aircraft, farm operations, birder, etc.), and the number of cranes which reacted wasalso noted.
Whenever distance and lighting allowed, subspecies and age (adult or juvenile) were alsorecorded. However, with the wide expanse of the island, varying light conditions, and sometimeslimited access, these details were often difficult to determine. Subspecies ratios could not beextrapolated to locations where viewing conditions were poor because greaters did not use allareas (e.g., the southeast corner of Staten). Although greaters could frequently be distinguishedfrom lessers, the identification of Canadians was more problematic due to their closer similarityto greaters. Therefore, when cranes were too distant, greaters and Canadians were recorded as“large” cranes after the first week of November when the first Canadians were observed. Thisgrouping was also used in a previous study of cranes wintering in California (Pogson andLindstedt 1991). Although recently published papers based on DNA evidence suggest Canadiansand greaters are not separate subspecies (Rhymer et al. 2000, Glenn et al. 2002), these studies didnot include cranes from the Pacific Flyway. Age ratio data was gathered to determinerecruitment of young (colts) and was calculated as the percent of young within each subspeciesin a flock. We discontinued aging cranes after 1 November because identification of young(particularly greaters) was confounded by the loss of juvenile characteristics (Lewis 1979).
Because color-marked cranes allow individual identification, we attempted to identify as manyas possible during flock surveys, and additional time was allocated to search specifically forthese birds at all times of the day throughout the study area. Most of the marked cranes in thePacific Flyway (west of the Rocky Mountains) are greaters from eastern Oregon andnortheastern California (U.S. Fish and Wildlife Service [USFWS], unpublished data), withsmaller numbers from south-central Washington (J. Engler, unpublished data), lessers from theCook Inlet and Bristol Bay regions of southern Alaska (M. Petrula and T. Rothe In Prep.), andCanadians from southeast Alaska and coastal British Columbia (Ivey et al. In Prep.). We alsoreviewed records of historic observations of marked cranes from the North Delta to determinetheir fidelity to wintering areas.

5
Monitoring of marked individuals allowed us to determine daily activity patterns and calculatewinter home ranges for cranes which were observed five or more times. Pairs and adults withcolts were considered a single data record as they remained together through the winter. For twobirds noted at distinctly separate sites (Cosumnes River Floodplain and the North Delta), tworanges were calculated and combined, as it was not likely that they used all the area in betweenas much of the habitat was unsuitable. Winter home range could not be accurately determined forcranes primarily using the Stone Lakes NWR area as they often foraged in inaccessible areas andcould generally only be observed at refuge roosts. Because access was limited at other areas, ourdata is perhaps slightly biased towards smaller ranges, with the most accurate data from Statenwhere access was best.
Importance of Staten for cranesTo assess the importance of Staten for cranes, we conducted feeding counts at least twice amonth in other areas of the North Delta using the same protocol as for Staten. Although weattempted to survey all areas (including Staten) on the same day, lingering fog often made thisimpossible. Numbers at some other sites should be considered minimum estimates due to limitedaccess (e.g., Brack, Canal Ranch, and Terminous tracts). Roost counts were only completed atStaten and therefore could not be compared to other sites.
We also reviewed historic survey data of the study area from published literature andunpublished data. Ground surveys of Delta cranes were conducted in the winters of 1983-84 and1984-85 (Pogson 1990, Pogson and Lindstedt 1988, 1991). Aerial surveys specifically for craneswere flown by CDFG in the 1980s and 2000-01, and Ducks Unlimited, Inc. (DU) waterfowlsurveys also recorded cranes from 1990-91 and in December 1993 (CDFG and DU, unpublisheddata). Comparisons of these surveys with our data were confounded by variables includingdiffering habitat conditions, focal species, observer experience, and lack of continuity. Inaddition, although aerial surveys are somewhat more accurate in comparing sites as the Deltacould be counted in only a few hours with unlimited views, we could not directly compare themto our ground counts because they were conducted primarily mid-day because of fog whichprecluded safe flying conditions in the mornings. This resulted in cranes being recorded inloafing habitats, and therefore areas not flooded would diminish in importance when comparedto our feeding counts conducted in mornings or afternoons. Differences in survey times arereflected in that flights only recording cranes at New Hope Tract a few times, and in addition,Grand Island was not surveyed. However, on our counts, numbers were sometimes over 1,000 atboth sites (six times for New Hope Tract, and once for Grand Island). Despite discrepancies,these surveys are the best historic data available for cranes in the Delta.
Crane habitat use and preference assessmentTo assess crane foraging habitat importance and preferences, use-days and Habitat PreferenceIndices (HPIs) were calculated for 12 bi-weekly periods from feeding count data at Staten forboth agriculture (crops) and non-agriculture areas (e.g., dirt levees, sides of the main levee, anddirt and gravel roads). Use-days are a measure of crane use and habitat importance, and werecalculated by averaging counts in each habitat treatment per period, then multiplying by 14 (thenumber of days in the period). To determine percentage of use for each habitat, use-days perhabitat were divided by the total number for that period. HPIs took into account habitatavailability, and were calculated by dividing percentage of use in each habitat treatment by its

6
percent availability (dividing the area of a given habitat treatment by the total area of craneforaging habitats on the island). An HPI of 1 indicated that cranes were using a habitat inproportion to its availability, greater than 1 indicated preference, and less than 1 indicatedavoidance (Hoffman 1976). We also interviewed ranch managers J. and S. Shanks to determinehistoric information on crane use at Staten.
RESULTS AND DISCUSSION The importance of Staten for sandhill cranesConnectivity of North Delta sites for cranes. Staten was vital for North Delta cranes, especiallyin December and January when thousands flew in from all directions to feed. Cranes feeding orroosting on Staten were observed flying to and from Brack, Canal Ranch, and New Hope tracts,and Tyler, Bouldin, Dead Horse, Andrus, and southern Grand islands. Cranes feeding on thenorthern portion of Grand Island and New Hope Tract were seen flying toward Stone LakesNWR and the Cosumnes River Floodplain, respectively. Figure 3 illustrates crane flight patternsnoted through the season. These movements illustrate that Staten is a keystone feature of thecrane habitat landscape in the Delta, and although it is an island, it is not used in isolation fromother sites. Use of these areas is interdependent, particularly for lessers, however, many markedgreaters used Staten exclusively (see Winter biology of cranes).
Fig. 3. Flight patterns of feeding and roosting sandhill cranes using the North Sacramento-San Joaquin Delta,California, 2002-03.

7
Number of cranes. The first large increase in the number of cranes roosting at Staten was notedbetween 27 and 28 September when numbers jumped from 575 to 1,640, followed by afluctuation in the 1,000-2,000 range for several weeks. Totals grew from 1,297 to 2,787 (115%increase) after waterfowl season opened in late October and trended upward to a peak of 7,987on 7 December. Thereafter, a series of wet storms provided multiple roost areas at small pondsthroughout the Delta, and numbers at Staten decreased. This was the first time that feedingnumbers were higher than for roosting, and this pattern continued until the end of the season.With the drying of roosts in mid-January and the first major migrations at the end of the month,there were only 735 by 6 February, and by the 26th, only eight were using a moist area of 17B.
Feeding numbers at Staten slowly increased and fluctuated below 1,300 until 2,066 were countedon 7 November when the first rains softened the ground which made digging easier so that moreareas were utilized for feeding. An upward trend followed until the peak of 8,552 on 14 January,but by 31 January numbers had dropped to 5,614 as some birds left for northward migration andothers possibly dispersed to forage in areas which had been heavily hunted during waterfowlseason. Numbers continued to decrease until the last count on 6 March with 48 cranes remaining.Figure 4 illustrates roosting and feeding counts on Staten, with data in Appendix A.
Fig. 4. Roosting and feeding counts of sandhill cranes at Staten Island, San Joaquin County, California, 2002-03.

8
Numbers can vary at a site from year-to-year depending on forage and roost site availability,disturbance levels, and weather patterns. However, our data as well as historic surveysconsistently showed Staten to be among the most important sandhill crane wintering sites in theNorth Delta. During our surveys, Staten was the only area to consistently support high feedingnumbers of cranes in the North Delta, peaking at 69.9% on 11 January, when Canal Ranch had9.1% and the remaining sites supported less than 6.0%. For the entire winter, Staten averaged36.3% (range 6.2%-69.9%); Canal Ranch Tract 17.5% (range 3.7%-39.3%), Brack Tract 17.0%(range 1.0%-71.1%), and New Hope Tract 14.3% (range 0%-63.2%). Terminous Tract and TylerIsland averaged less than 8.0% (7.4% and 5.2%, respectively), and even fewer numbers werefound at Grand Island (average of 3.1% for December to the end of the season), Andrus Island(average 0.8% for October only), and Dead Horse Island (average 1.2% for January). During thecore wintering period (November to January), Staten averaged 52.5% (range 21.0%-69.9%),Brack Tract 14.2% (range 1.0%-55.4%), and Canal Ranch Tract 13.5% (range 4.6%-21.7%),with Tyler Island and Terminous and New Hope tracts less than 7.0%. Total counts for the entireNorth Delta peaked from mid-December to mid-January with over 12,000 cranes. Figure 5illustrates the importance of North Delta crane use sites through the winter and Appendix Bsummarizes survey data.
Fig. 5. Percentage of feeding sandhill cranes counted at North Sacramento-San Joaquin Delta sites, California, 2002-03

9
Crane numbers for Staten recorded during aerial surveys by CDFG and DU averaged 1,365 inthe 1980s (range 416-2,795), 1,463 in 1990-91 (range 670-2,000), and 8,150 in 1993 (4,300 andan exceptionally high 12,000). More recently in 2000-01, the average was 2,742 (range 2,440-3,220). These data indicate a slightly increasing trend on CDFG surveys, with higher numbersrecorded during DU surveys in 1993. For all North Delta sites, Brack Tract averaged 47.0%(range 0%-87.5%), Staten 33.1% (range 11.1%-83.5%), Canal Ranch Tract 18.1% (range 0%-44.5%), Terminous Tract 7.7% (range 0%-9.3%), and Tyler Island 5.2% (range 0%-14.7%)(Appendix C).
Although we did not survey the South Delta (south of Highway 12), the historic aerial surveys inthat region averaged only 3.3% of Delta cranes (Appendix C), and in 2002-03, ground surveys offour sites (Bacon and Bouldin islands and Holland and Webb tracts) showed that the highestweekly total was only 1,412 (J. P. Robles, unpublished data). These results illustrate that theSouth Delta is less valuable for cranes than North Delta sites.
Subspecies. Distribution of the three subspecies was uneven in the survey area. In the NorthDelta, lessers always outnumbered greaters, with most greaters observed at Brack Tract andStaten, moderate numbers at Tyler Island, and with restricted viewing, only a few on GrandIsland and New Hope and Canal Ranch tracts. To the north at Stone Lakes NWR, only greaterswere observed, although lessers were the more common subspecies at nearby Sun River Ranch,just a few miles south. Subspecies composition of flocks at Cosumnes River Preserve wereroughly 90% lessers and 10% large cranes (including about 3% Canadians).
At Staten, about 80% of the feeding cranes were lessers and 20% were large cranes (primarilygreaters, but including <1% Canadians). Both greaters and lessers were recorded on the firstsurveys on Staten in September, but Canadians were not observed until 12 November, althoughthey were noted as early as 6 November at Cosumnes River Preserve. Lessers were found on allareas of the island, while greaters were found everywhere except the very north and southeastportions. Canadians were noted scattered in small flocks north of the Lodi Gas Line Road. Whilethe number of large cranes using Staten remained relatively constant, numbers of lessers variedconsiderably as they responded to changing forage opportunities in the area (e.g., newly-plantedwinter wheat attracted Staten greaters, while drawing lessers from other areas). The peak countfor lessers was 6,828, and 1,506 for large cranes. However, not all birds could be classified tosubspecies and these numbers should be considered minimum.
Pogson and Lindstedt (1991) found 595-1,634 large cranes at Staten in 1983-1985, similar to ourestimate of 1,500. Percentages at North Delta sites in November and December (data wasincomplete in January) showed that Brack Tract ranked highest in importance for large cranes,supporting an average of 53.8% (57.5% and 50.0%), Staten was second with 29.0% (40.9% and17.1%), Canal Ranch Tract a distant third with 7.6% (1.7% and 13.5%), and Grand Island with19.4% (for December only). They also derived an estimate for the CVP of 6,000-6,800, however,this included an unknown number of the Canadian subspecies. For the U.S. portion of CVPgreaters, we estimated a population of 4,227 based on counts of pairs and nonbreeders recordedduring statewide surveys in 1999 and 2000 (Ivey and Herziger 2000, 2001). Although there is nocurrent estimate for the total CVP as numbers from British Columbia are unknown, we believe itis unlikely that the population exceeds a total of 10,000 individuals, and our estimate of 1,500

10
using Staten therefore is at least 15% of the entire CVP and about 35% of the U.S. segment.Therefore, Staten is one of the most important wintering sites for this Threatened subspecies.
Pogson and Lindstedt (1991) also estimated 5,000-6,000 lessers using the Delta. We recorded apeak of at least 6,800 at Staten, with our highest counts totaling over 12,000 cranes in the NorthDelta (primarily lessers). Therefore, we conclude that the number of lessers using the NorthDelta has likely increased, as well as the importance of Staten for this subspecies.
Origins of color-marked cranes. Color-marked greaters from Malheur NWR in southeast Oregonwere recorded at Staten Island and Brack Tract, with small numbers at Tyler Island and CanalRanch Tract, and only two were found using the Cosumnes River Floodplain. A majority ofcranes from Modoc NWR in northeast California were found at Stone Lakes NWR, the SunRiver Ranch and surrounding agricultural areas, and on the Cosumnes River Floodplain, withonly a few observed at Staten and Tyler Island, and none at other sites. Three marked cranesfrom Summer Lake WA in southeast Oregon were found at Staten, and another on the CosumnesRiver Floodplain. Two greaters from Ash Creek WA in northeast California were seeninfrequently at Stone Lakes NWR, and two from Conboy Lake NWR in southern Washingtonwere noted only one and two times at Staten and Tyler Island. Marked lessers from coastalAlaska were eventually noted at most areas. Generally, birds captured at these sites were localbreeders, but some were found to be migrants (e.g., two greaters captured at Malheur NWR onefall were reported on breeding grounds in central British Columbia). No marked migratingCanadians were found, however, only eight exist in the Flyway, and one active radio transmittershowed that this bird spent the 2002-03 winter in the Sacramento Valley southwest of Chico,California (Ivey et al. In Prep.). Figure 6 illustrates known breeding sites of cranes recorded inthe study area.
We identified 117 unique color-marked cranes and recorded more than 900 observations ofmarked individuals within the study area. For greaters, 55 were from Malheur NWR, 32 fromModoc NWR, four from Summer Lake WA, and two each from Conboy Lake NWR and AshCreek WA. Banding locations of some cranes could not be determined due to partial band loss,resulting in incomplete band combinations, however, they could be identified as individuals dueto their remaining colors or unique characteristics (15). Of the 42 marked greaters observed atStaten, 29 (69.0%) were from Malheur NWR, five (11.9%) from Modoc NWR, three (7.1%)from Summer Lake WA, two (4.8%) were from Conboy Lake NWR, and three (7.1%) ofunknown origin. Seven lessers marked in Alaska were also observed (including five on Staten).Appendix D lists the origin of the marked birds, if available. Individuals were identified by analpha-numeric code or a nickname given by the bander or us.
The fact that Staten and other study area sites supported cranes from these areas is particularlyimportant when considering that in addition to the greater subspecies being listed as Threatenedin California, it is considered Sensitive in Oregon (Oregon Department of Fish and Wildlife1997), the lesser subspecies is currently included on the draft California Bird Species of SpecialConcern List (Point Reyes Bird Observatory 2001), and all sandhill crane subspecies areconsidered Endangered in Washington (Littlefield and Ivey 2002) and Vulnerable on BritishColumbia’s “Blue List” (Blood and Backhouse 1999).
11
Fig. 6. Known origin of color-marked sandhill cranes wintering in southern Sacramento County and northern SanJoaquin County, California, 2002-03. Birds from Alaska are lesser sandhill cranes, and all others greater sandhillcranes.
Winter biology of cranesWinter home ranges and movements of color-marked cranes. Greaters have been reported to bevery philopatric on their wintering grounds (Littlefield and Ivey 2000), and we found this to betrue as well. Ranges for color-marked greaters was very small compared to lessers and theyexhibited stronger site fidelity. This occurred despite changes in feeding opportunities; similarfeeding site fidelity has been reported in Indiana (Lovvorn and Kirkpatrick 1982). Of the 39greaters which were observed at least five times, winter home ranges averaged 0.66 mi2 (1.71km2), varying from 0.07-2.12 mi2 (0.17-5.49 km2) (Table 1). The average home range size for 18greaters primarily noted at Staten (where access was best) was 0.75 mi2 (1.95 km2). Severalgreaters had home ranges covering adjacent islands or tracts, including eight regularly using bothStaten and Tyler Island, and three at Brack and Canal Ranch tracts. No interchange of markedgreaters was noted between the North Delta and northern sites (Stone Lakes NWR andCosumnes River Floodplain) once they reached their main winter use area, with the exception ofone Malheur NWR bird which shifted from Staten in late October and early November to theCosumnes River Floodplain (east of Highway 99 more than 14 mi [22.6 km] away) in lateNovember and early December, returning to Staten in early January, and then to Brack Tract inmid-February. This bird was a subadult marked in 1997, and its behavior could possibly be dueto immaturity or because it was roaming in search of a mate. However, three others known to beless than five years old had small home ranges on Staten.

12
Table 1. Winter home range sizes and distances moved during shifts in use areas of color-marked cranes at the NorthSacramento-San Joaquin Delta and Cosumnes River Floodplain (CRF), and Cosumnes River Preserve (CRP),California, 2002-03 (grouped by area used).Identity Area(s) observed Winter home range Shift distance in square mi (km) in miles (km)
GreatersBernice North Staten Island 1.04 (2.69) --Grinch North Staten Island 1.30 (3.37) 1.15 (1.85)3
Squakie North Staten Island 0.34 (0.87) --Flip North Staten Island 0.42 (1.10) --Lilly North Staten Island 0.63 (1.62) 1.18 (1.90)3
Troi North Staten Island 0.15 (0.39) --Elmo North Staten and Tyler islands 1.04 (2.69) 2.11 (3.40)3
Marco North Staten and Tyler islands 0.81 (2.11) 2.47 (3.98)3
Marco North Staten and Tyler islands, Brack Tract 4.68 (7.55)4
Sam North Staten and Tyler islands 2.12 (5.49) 2.76 (4.45)3
P043 North Staten and Tyler islands 0.85 (2.20) --P076 North Staten and Tyler islands 0.83 (2.15) --P115 North Staten and Tyler islands 0.96 (2.48) --Betsy Middle Staten Island 0.27 (0.69) 2.42 (3.90)3
Miles Middle Staten Island 0.25 (0.65) 5.31 (8.56)4
P146 Middle Staten and Tyler islands 0.29 (0.76) --Rod and Junior1 Middle Staten Island 0.32 (0.84) 3.35 (5.40)3
Rudy Middle Staten Island 1.43 (3.70) 2.72 (4.39)4
Zorro Middle Staten Island and west Brack Tract 0.50 (1.29) 2.10 (3.39)4
Cecil Middle Staten Island and Brack Tract 1.86 (4.82) --Picard5 North Staten, CRF, Staten and Brack Tract 1.07 (2.77) --Attilla Central Brack Tract 0.36 (0.94) --Cal Central Brack Tract 0.42 (1.10) 3.72 (6.00)3
Jackie Central Brack Tract 0.49 (1.26) --Lois Central Brack Tract 0.20 (0.52) --Oak and Sara2 Central Brack Tract 0.44 (1.13) --Rene Brack Tract 0.94 (2.43) --Shark Brack Tract 0.11 (0.29) --YB Central Brack Tract 0.13 (0.33) --Denise Southwest Brack Tract 0.38 (0.99) --Pam Southwest Brack Tract 0.15 (0.39) 3.18 (5.13)3
Steve and Clint2 Primarily southwest Brack Tract 0.07 (0.17) 3.35 (5.40)3
Chip East Brack Tract and Canal Ranch Tract 0.34 (0.88) --Madalen East Brack Tract and Canal Ranch Tract 1.41 (3.65) --Strugg and Yoyd2 East Brack Tract and Canal Ranch Tract 1.61 (4.17) --Jean-Claude CRP 0.68 (1.76) --Poppy CRP and CRF 0.56 (1.45) --P143 CRP and CRF 0.78 (2.01) --Ben CRP 0.07 (0.17) --P171 CRP 0.14 (0.37) --Mean 0.66 (1.71) 2.89 (4.66)
LessersA01 Brack and New Hope tracts, Staten & Tyler islands 13.52 (35.03) --A06 CRF, Staten Island, Brack Tract 1.21 ( 3.14)5 --Chernobyl CRF, Staten Island, Brack Tract 2.09 ( 5.41)5 --CJ24 Brack Tract and Staten Island 10.26 (26.58) --CJ30 Brack Tract, Staten Island, New Hope Tract 8.83 (22.88) --Mean 7.18 (18.60)1 Adult and colt.2 Pair.3 Shifted from early roost water on northeast Staten.4 Shifted to Brack Tract after Staten and Tyler Island roost water dried.5 Reasons for moving between the North Delta and Cosumnes River Floodplain are unknown.

13
Appendix E illustrates the mapped home ranges where each point usually represents multiplesightings. It should be noted that where these cranes were recorded do not represent all use areas,and that the number of points at an area is not indicative of importance, as these maps onlyinclude marked birds seen or more five times. Nearly all agriculture areas of Staten wereimportant for cranes at various times of the season, but curiously, no marked greaters were foundamong the large number frequenting the southwest corner, and none have been found there inprevious years (S. Shanks, personal communication). There were also other areas in the NorthDelta used heavily by cranes where few marked birds were noted.
The availability of roost water influenced winter range for at least some color-marked greaters.Early in the season, many took advantage of Staten’s rare early roost water at Field 3, thenmoved to another area to spend the rest of the winter after roost water became available. Fiveshifted to north-central and northwest Staten or north Tyler Island, two to the central portion ofStaten, and three apparently to their traditional wintering site at Brack Tract as they had neverbeen recorded previously on Staten (Figure 7). Toward the end of the season, three cranesregularly seen at Staten and Tyler Island moved to Brack Tract after their roost site dried, andone additional bird which had been noted at east Staten and far west Brack Tract moved furthereast to the area still flooded (Figure 8). Shifting cranes therefore moved an average of 2.89 miles(4.7 km) (range 1.15-5.31 mi [1.85-8.56 km]), apparently in response to lack of roost water attheir traditional wintering sites (Table 1).
We also reviewed historic records for marked Malheur NWR greaters in the North Delta.However, to complicate comparisons, some have lost bands since capture and are thereforeunidentifiable, some have undoubtably died, and some historic locations were describedgenerically as “Thornton” (a nearby city). At Staten, 20 of 29 marked greaters we found duringthe winter of 2002-03 had been recorded there in previous years (69.0%). When includingThornton records (5), the percentage of philopatric wintering birds increased to 86.2%. Inaddition, several marked greaters have been repeatedly observed using the same specificlocations within fields for a number of years on Staten (S. Shanks personal communication), andfive very detailed records placed four birds in the same specific areas during 1998-2001 as foundon our surveys. On Brack Tract, 25 of 38 were again wintering at the same site (65.8%--increasing to 71.1% when including two Thornton locations). This information highlights theimportance of tradition and use of specific wintering sites to greater sandhill cranes.
Philopatric trends were less evident for Modoc NWR cranes, as apparently few use areas wherehistorically the effort to find color-marked cranes has been greatest, and we found only fiveusing Staten/Tyler Island, and none at Brack Tract. Also, where most Modoc NWR cranes werelocated this season (Stone Lakes NWR and Cosumnes River Floodplain), there has been littleprevious effort to search for marked cranes, and these birds often used areas with limited accessfor viewing.
For marked lessers, five were noted five or more times. This subspecies showed a much largerwinter home range than greaters, averaging 7.18 mi2 (18.6 km2) (Table 1 and Appendix E). Theyalso seemed more willing to fly further to focus feeding on newly-flooded or planted areas. Morecomplete data was available from satellite-equipped lessers using the Delta in 2000-03, withwinter ranges averaging 64.8 mi2 (168 km2) (range 2.7-143.2 mi2 [7-371 km2]) (Petrula andRothe In Prep.). Some were also noted to move between the Delta and the Merced and Vernalisareas (Merced and Stanislaus counties, respectively).

14
Fig. 7. Shift in winter range of color-marked greater sandhill cranes from early roost water on northeast StatenIsland to north and central Staten Island, Tyler Island, and Brack Tract, North Sacramento-San Joaquin Delta,California, 2002-03.
Fig. 8. Shift in winter range of color-marked greater sandhill cranes onto Brack Tract due to lack of roost water onStaten and Tyler Islands, North Sacramento-San Joaquin Delta, California, 2002-03.

15
Age ratios and recruitment. Recruitment rates for both greaters and lessers were low (2.5% and6.3%, respectively). Canadians arrived after we discontinued gathering this data. Twins wererarely observed for greaters, but were fairly common for lessers. The extremely low recruitmentrate of greaters was likely due to drought conditions on the breeding grounds in 2002, however,historic estimates from the North Delta were also low in 1981-82 (4.6%), 1982-83 (4.6%), and1986-87 (7.3%) (CDFG In Prep.). The slightly elevated rates may be attributed to better breedingground water conditions when recruitment rates are expected to be higher.
We also compared recruitment rates between greaters at Cosumnes River Floodplain and StoneLakes NWR (5.2%), where most marked greaters were from Modoc NWR, to those in the NorthDelta (1.7%) where most were from Malheur NWR. These differences parallel those on thebreeding grounds, with Modoc NWR cranes typically having higher production of young thanMalheur NWR cranes (G. Ivey, unpublished data). Malheur NWR cranes which are predominateat Staten have experienced extremely low recruitment for over a decade, a cause for heightenedconcern (Littlefield 1995, G. Ivey, unpublished data). Appendix F lists adult:colt ratio data.
Use of habitats by wintering sandhill cranesHistoric loss of wetlands and the advent of agriculture likely resulted in higher concentrations ofcranes and more flocking behavior than natural for these birds. For example, after termination ofgrain farming at Aransas NWR in Texas, wintering whooping cranes (G. americana) shiftedtheir behavior from gregarious flock-feeding in grainfields to solitary territorial pairs and familygroups feeding in tidal wetlands (R. Drewien, personal communication). Therefore, it is likelythat sandhill cranes would exhibit similar territorial behavior under more natural habitatconditions.
At Staten in 2002-03, cranes fed primarily in harvested corn and harvested and newly-plantedwinter wheat fields. The only wetland available (Field 3-16) was intensively used early in theseason while flooded, and large numbers of cranes (especially greaters) could reliably be foundthere. Cranes also foraged heavily in newly-flooded fields, regardless of the crop, on terrestrialinvertebrates (e.g., spiders, crickets, beetles) and rodents concentrated by flood waters. In non-agricultural areas, cranes were observed feeding on new dirt levees, the side of the main levee(particularly after the first rains), and occasionally in ditches in between fields. Grit wasconsumed from gravel roads (mostly mid-day on the secondary roads by all subspecies, and ontop of the main levee road by lessers). Additionally, cranes were observed consuming the seedsof curly dock (Rumex sp.), velvet leaf (Abutilon thesprasti), and smartweed (Polygonum sp.),tubers of nut sedge (Cyperus esculentus), and rhizomes of Bermuda grass (Cynodon dactylon).For mid-day loafing, cranes mainly used flooded crop fields, but also dirt levees, dirt and gravelroads (adjacent to roost sites), and sometimes damp areas in Fields 2 and 3. Roost sites wereusually located in the middle of a flooded field where the water level ranged from 2-8 inches (5-20 cm).
At other sites, large numbers of cranes were found feeding in other harvested crops or naturalhabitats, including alfalfa at Brack, Canal Ranch, New Hope, and Terminous tracts, Tyler Island,and Cosumnes River Preserve; rice at Brack Tract and Cosumnes River Preserve; asparagus atCanal Ranch Tract and Tyler Island; pasture at Stone Lakes NWR and Cosumnes RiverFloodplain; wetlands at Brack Tract and Cosumnes River Floodplain; and less often in disced

16
beans on Terminous Tract, tomatoes at Tyler Island, and safflower at Brack Tract.
Although we observed all three subspecies feeding in corn, wheat, rice, and flooded tomatoes,crop selection was somewhat different between them. At Staten, cranes feeding in the newly-flooded wheat were primarily lessers, whereas flooded corn was mostly used by greaters. Atother sites, lessers were by far the most common in alfalfa, asparagus, pasture, and disced beans.However, crop choice may have been influenced by location (e.g., only lessers were found atTerminous Tract where the beans were), and time of year (alfalfa seemed to be the preferred cropfor lessers from September through November). At Cosumnes River Preserve, lessers were notedflying from corn fields in late evening to feed in pastures prior to departing for roost sites, abehavior that was never observed with greaters.
Weather also played a part in crane use areas, as temperature, fog, and storms affected where andwhen cranes fed. When temperatures exceeded 90ΕF (32.2ΕC) during late September and earlyOctober, cranes returned from morning feeding to Field 3’s flooded areas to loaf earlier, and theylingered longer in the afternoons, sometimes not flying out for afternoon feeding. As time passedand temperatures cooled, use of this area during the day decreased, but this pattern may also havebeen related to diminishing water levels, as well as the availability of water at other Delta sites.Thick early morning fog often prevented cranes from flying out to feed, resulting in mid-day toafternoon feeding, or mid-day feeding and only loafing in the afternoon. Storms also influencedfeeding area preference and behavior. After the first rains, chopped corn fields and the sides ofthe main levee became favored; both these changes were likely due to the softer ground whichmade digging easier. With the first large storm of the season, rain accompanied by strong windschanged daily patterns--cranes were not found feeding in open areas (ripped or disced fields,levees, or gravel roads). Instead, many fed throughout the day in fields with taller vegetation(e.g., Field 4A), or near ditches in corn fields where the vegetation had not been mowed. Cranesalso became much more sensitive to disturbance (as they typically are in windy weather), andreturned to roost earlier.
Chronological use. The feeding and roosting patterns of cranes using Staten and the North Deltawere very dynamic. Not only did their crop preferences change with time, but major use areasshifted as well. The following is a chronological description of crane habitat use.
September to early October--The focal area for crane use was the harvested wheat fields ofField 3 (flooded or dry ripped and unmanipulated) for roosting, loafing, and feeding. A majorityof birds roosting there flew to feed on disced wheat at adjacent New Hope Tract, while someflew to Tyler Island alfalfa, disced tomatoes and wheat, and Andrus Island alfalfa. About 10%used Staten’s 4A and 5B harvested wheat fields (unmanipulated and disced/ripped, respectively).Some lingered at the wetland of Field 3-16 which was heavily used for mid-day loafing andafternoon feeding, particularly by greaters. Only minor use occurred in other fields (e.g.,harvested corn). Near the end of the period, newly-constructed levees in Fields 16 and 17become popular for feeding and loafing.
Mid- to late October--Feeding use dramatically increased in the corn of Fields 15 through17B while these sites were being flooded, while use of Field 3 rapidly declined as water levelsdropped in preparation for working on the adjacent road. Some roosting began in Fields 15

17
through 17B for birds feeding at Tyler Island and Staten, while Field 3 still continued to serve asa roost for cranes feeding primarily on New Hope Tract, and to a lesser extent on Canal Ranchand Brack tracts and Staten. Feeding in the flooded corn decreased over time and as water levelsincreased, with these fields primarily being used for loafing and roosting after late October.Disced corn fields (primarily the headlands--field ends disced to allow harvesting equipmentaccess) and newly-flooded tomato fields increased in popularity as feeding sites, followed byadjacent flooded wheat in Field 4A. The flooded tomato fields were being used for roosting,supporting larger crane numbers than the Field 3 roost (more cranes had arrived), but feedingthere decreased over time as water levels increased, similar to the pattern observed in the floodedcorn fields. No cranes were found feeding at New Hope Tract, possibly because of the drying ofroost water in Field 3. Newly-flooded rice fields at Brack Tract attracted high numbers of craneswhich used them for feeding, loafing, and roosting, while numbers using Isenberg Crane Reservedropped dramatically.
Early November– The Field 3 roost dried up completely within the first week. The first rainfell on 6 November, dispersing cranes to feed in small flocks in more fields, including largenumbers using the chopped corn and the side of the main levee on Staten. The large flocks oflessers which used Tyler Island and Canal Ranch Tract alfalfa were absent, but many were usingdisced corn on the west side of Canal Ranch Tract, and some loafed mid-day in alfalfa. Around3,800 cranes were feeding in flooded rice at Brack Tract. No cranes were seen flying in fromBrack or Canal Ranch tracts to roost at Staten since both areas had adequate roost water duringthis period.
Mid-November--The flooded wheat of Field 4A was being used for roosting, but numbers haddropped considerably (<100), likely due to diminishing water levels and limited remaining food.Also, fewer birds fed there, but it continued to received heavy mid-day loafing use. Thoseroosting in the flooded tomatoes fed mostly nearby in chopped corn. Birds roosting in Fields 15and 16 flew out to feed in Field 14 (which was being disced in preparation for planting winterwheat) to the southwest corner of Staten, and to the south end of Tyler Island for the first time.Over 100 birds feeding at the far southwest corner of Staten were observed flying to Brack Tractto roost. Hundreds of lessers were seen digging for unknown foods on the side of the east side ofthe main levee where vegetation had not yet greened up, and also near the main house wherevegetation was greening up. Fewer cranes were loafing on the dirt levees between fields. Cranesresumed feeding in north Tyler Island alfalfa, but in much lower numbers. Winter wheat plantingbegan in Field 14 and progressed north in designated fields; these areas were used immediatelyby large numbers of cranes (>1,000 per area).
Late November--Newly-planted winter wheat fields received the most crane use, followed bychopped corn. The southwest corner of the island was heavily used (chopped and unchoppedcorn), particularly around small rain-puddled areas. Numbers of lessers feeding on the east sideof the main levee continued to increase, sometimes exceeding those in east side corn fields.Large numbers of cranes, particularly lessers, loafed in moist Field 3-15 (an earlier roost site).Almost 2,900 cranes were feeding at Staten on chopped corn and newly-planted winter wheatand flying off to roost at Brack Tract (~1,900), and a recently-flooded portion of Canal RanchTract (~1,000).

18
Early December--Small numbers of cranes were consistently found along a recently cleanedField 1A ditch and also around (and uncharacteristically in) a ditch along the south side of Field17A-52. Numbers of cranes feeding in unchopped corn stubble noticeably increased. Nearly3,000 continued to feed at Staten while roosting at Brack Tract in wetlands and flooded rice, andat Canal Ranch Tract in flooded corn. Several hundred cranes feeding on the southwest side ofStaten were observed flying toward Bouldin Island to roost. Conversely, over 2,000 cranesfeeding on new winter wheat at Tyler Island flew to Staten to roost in Field 2A. At Tyler Island,cranes were also feeding in chopped asparagus and flooded corn, as well as roosting. At BrackTract, very few remained feeding in flooded rice, with most being greaters using the levees(although many of both subspecies were loafing there during mid-day, and roosting at night).
Mid- and late December--At Staten, most cranes were feeding during the storms alongvegetated edges of corn fields (especially in chopped corn fields in the southwest corner), andthere was very little use of winter wheat. Several hundred lessers were feeding on both the eastand west sides of the main levee and for a short time, some were feeding and loafing on a rain-flooded hardpan area on the south end of the island (where soil had been removed forconstruction purposes). Cranes briefly resumed roosting in Field 3, as it re-flooded from therains, flying to feed at New Hope Tract in new winter wheat. Very few cranes were roosting inflooded tomatoes, and those roosting in flooded corn fields were flying in from southwest Statenand areas to the west. Hundreds of cranes continued to fly in from Brack Tract to feed at Staten,presumably because there was little feeding opportunity there where most rice was deeplyflooded and the corn had been disced and flooded. New winter wheat became a popular foragecrop at New Hope and Canal Ranch tracts. Also at Canal Ranch, over 2,000 lessers were using aburned corn field. It was common to see small flocks of cranes flying in all directions throughoutthe North Delta during this period.
Early and mid-January--Cranes began feeding in unchopped corn fields more than chopped atStaten, perhaps due to chopped fields being fed out. The small numbers of cranes feeding inwinter wheat concentrated more in the ditches of these fields. Roost water drawdowns began inall fields in preparation for spring planting and also at Tyler Island. Feeding patterns in the NorthDelta were similar to that of December: over 5,000 flew in from Brack Tract to feed at the eastside of Staten and areas to the west, and over 1,000 flew from Canal Ranch and Brack tracts tofeed at northeast Staten, while several thousand cranes feeding at Tyler Island flew to roost onthe west side of Staten. Most cranes flying in to roost in the flooded tomatoes now came from thenorth (north Tyler and Dead Horse islands, and New Hope Tract). At New Hope Tract, almost500 lessers fed in a chopped asparagus field, and at Tyler Island, up to 1,000 (mostly greaters)were feeding and loafing in a recently-flooded, chopped asparagus field for a short time, but thissite was essentially abandoned after it was hunted. Several thousand lessers continued to useBrack Tract for mid-day loafing and roosting.
Late January--Concentrations of feeding cranes at Staten were in chopped corn near the LodiGas Line Road and the south end, with numbers using the southeast portion almost equaling thenumber using the southwest for the first time. Use of Field 4C and the greened-up headlands ofcorn fields increased substantially. Hundreds of lessers were first noted feeding on the far northend of Staten in chopped corn. These birds and those using the disced corn on the north end ofTyler Island were observed flying to Dead Horse Island as well as Staten’s Field 17B to roost.

19
This was likely due to the loss of roost water in 2A as levels were less than two inches (<5 cm),and the few cranes roosting there (~70) were doing so in small, shallow puddles. On the westside of the island, Fields 15 through 17B were 50-95% dry, but numbers of roosting cranes werestill over 4,700. At New Hope Tract, lessers continued to feed in chopped asparagus, but inlarger numbers (over 1,900). Some flocks began spiraling high in the air for northwardmigration.
Early February--Feeding in unchopped corn stubble exceeded chopped for the first time atStaten. Roosting ended in the flooded tomatoes and wheat during the first week, but cranescontinued to loaf at those sites and in flooded corn fields which were too shallow for roosting,sometimes in areas which were only damp. Roosting cranes were packed into small areas ofshallow, flooded corn. Over 4,500 loafed at Brack Tract, with most using the north portion ofIsenberg Crane Reserve observed flying to Canal Ranch Tract to feed (~3,000), while thoseloafing in the rice fed primarily at Staten. Birds also flew from Canal Ranch Tract to feed atnortheast Staten. Over 1,000 feeding at southwest New Hope Tract loafed in Staten’s northerndamp tomato and wheat fields.
Mid- to late February--Most feeding at Staten occurred on the east side by cranes from BrackTract, but numbers were dropping daily as birds departed for northward migration. Smallnumbers of cranes fed in the soil of pushed-down levees and elsewhere on the island. BothStaten and Tyler Island’s roost water levels were almost dry by mid-month, with the onlyremaining large roost area at Staten being Field 17B. Most cranes in the North Delta fed at NewHope (a newly-disced field adjacent to Staten and a freshly harvested corn field near InterstateHighway 5) and Canal Ranch tracts; heavy use for much of the winter may have fed out Staten.Dead Horse Island continued to be used for roosting by birds feeding at the north end of Statenand Tyler Island. Color-marked crane data indicated major migration during this period, as someregularly-observed birds were no longer found, and “new” marked birds were located at BrackTract which had several thousand cranes loafing mid-day in the expansive water of the floodedrice fields.
Early March--On the last survey, over 400 cranes remained to feed on the rice levees ofBrack Tract, with less than 50 foraging in the recently-disced corn fields of northeast Staten.
Effects of Staten management practices on cranesFarming began at Staten in 1868 (Collins and Paullin 1992). By the 1970s, sugar beets,asparagus, and tomatoes were primarily grown. Crane use increased after a shift to the morewildlife-compatible crops of corn and wheat in the late 1980s (J. Shanks, personalcommunication). In the mid-1980s, the historic arrival date for greaters was the third week ofSeptember (Pogson and Lindstedt 1991). Now, almost twenty years later, they regularly arrive inearly September (W. Holt and J. Shanks, personal communications). In 2002, cranes were firstobserved at the South Delta on 2 September (W. Holt, personal communication) and at Staten on7 September (S. Shanks, personal communication). This earlier arrival trend may be due in partto changes in farming at Staten. Before the mid-1980s, corn harvest was not begun until mid-September and continued to November (J. Shanks, personal communication). With more cornplanted due to the falling price of wheat, the start date for harvest was moved up in order toharvest the entire crop early. This also allowed for roost site flooding to begin sooner. With both food and roost water available in September, cranes may have learned to rely on their

20
availability. Currently, a good balance of agriculture for wildlife is considered to be 6,800-7,000acres (2,753-2,834 ha) of corn, 1,000-1,200 acres (404.9-485.8 ha) of wheat, and 500 acres(202.4 ha) of tomatoes (J. Shanks, personal communication).
Feeding sites. The use of each crop by cranes varied with different farm management practices,and recording these variables was essential, as each had a different value to cranes. Choppingfacilitated crop residue decomposition, while ripping (lifting the soil) and discing (rolling it over)helped with weed control and soil aeration, and were utilized more than plowing (rolling the soilover deeper) to minimize erosion and save fuel and labor (J. Shanks, personal communication).Details on the wildlife-compatible farming practices at Staten can be found in Ivey et al. (2003).Cranes responded quickly to new feeding opportunities. For example, early in the season, fieldsof harvested corn received very little use, but when disced in preparation for planting of winterwheat, birds moved in immediately. A similar response was noted when corn fields werechopped, and extensive chopping this winter apparently resulted in crane use of the far north endof the island for the first time (J. Shanks, personal communication). When dirt levees werepushed up for the flooding of Fields 15-17, great numbers of cranes used these areas for feedingand loafing.
Some fields were flooded to control weeds, reduce soil salinity, prevent soil loss throughoxidation, improve crop yields and provide habitat for cranes and other wildlife (J. Shanks,personal communication). These sites provided not only roost water, but also feedingopportunities, at least initially; all flooded crops were used for feeding when first flooded, butuse rapidly declined shortly after, followed by loafing and roosting use only. This change in usewas likely because cranes prefer to feed in shallow water and much of the available grain israpidly consumed by waterfowl. At Stone Lakes NWR, cranes fed and loafed in a pasture whenit was irrigated, but when the area dried, none used the area. When irrigation resumed, cranesreturned. At Brack Tract and Cosumnes River Preserve, newly-flooded rice attracted largenumbers of feeding cranes, but like Staten’s flooded crops, soon became used only for loafingand roosting as water levels increased.
Use of chopped corn began in late October and rapidly increased, remaining high throughout thewinter season. Disced corn consisted primarily of field headlands early in the season and use wasfairly low, but increased briefly to a high of 20.5% of the total when entire fields were disced inOctober in preparation for planting winter wheat, and then declined until the end of the season ascranes began feeding on new green vegetation on headlands. In flooded corn, there was a peak inuse at the end of October (44.8%), followed by a general declining trend through the winter.Corn stubble use was high at first (28.0%) as the corn portion of Field 3 was harvested, but onlyregained high percentages of use at the end of the season (29.5% and 21.5%) as chopped cornapparently was fed out. Flooded tomato fields received only minor use for foraging, primarilyduring initial flood-up (up to 4.5%), and ripped tomato fields had even less, at the end of theseason when new vegetation was sprouting (0.1-0.2%). Wetland Field 3-16 supported minorpercentages in September (6.9% and 11.4%), but then was dried. Use of disced/ripped wheatpeaked as high at 38.1% in mid-October and was used throughout the season at lowerpercentages. Disced/ripped and flooded wheat was used for foraging only in the first half of theseason, supporting up to 9.2%, primarily due to the popularity of Field 15-73. Flooded wheatgenerally supported high use through mid-November, with a peak of 33.5% in early November.

21
Newly-planted wheat immediately became important, supporting over 20.0% in mid- to lateNovember, but then rapidly declined as seedlings grew. Use of wheat stubble was highest duringSeptember (10.6% and 8.1%), but apparently was fed out very early and these fields receivedlittle use until new green vegetation appeared at the end of the season. Crane use of various cropsis depicted in Figures 9a and 9b and summarized in Appendix G.
For non-agriculture areas, fresh dirt levees were immediately used, supporting up to 13.3% inearly October, but dropped off quickly. The side of the main levee was used for most of theseason by generally low numbers of cranes, but use peaked at 14.1% in mid-November during awet stormy period. Dirt road use was low and sporadic, resulting primarily from use of the roadin the middle of Field 3 at the roost site and along the edge of Field 4C. Gravel road use showeda similar pattern. It should be noted that the importance of gravel and dirt roads were under-represented because use primarily occurred during the mid-day loafing period when it wascommon to see hundreds of cranes on the Airstrip, Beaver Slough, or Camp 5 roads. Non-agricultural crane use-days are illustrated in Figure 10 and data presented in Appendix G.
The total number of use-days per bi-weekly period ranged from 5,144 (18 September period) to119,728 (8 January period). For the entire season, overall averages showed that chopped cornwas by far the most important crop for cranes, supporting 55.4% of the winter’s use (Figure 11).Corn stubble was a distant second (11.6%), followed by flooded corn (7.9%), new wheat (7.3%),disced/ripped wheat (5.8%), the side of the main levee (3.7%), and flooded wheat (3.0%). Allother areas supported less than 2.0%.
Crane habitat preferences also changed over time (Table 2). Preference for chopped corn beganalmost immediately after chopping occurred, and continued until the end of the season, whilecorn stubble was only preferred on two periods late in winter. Disced corn was preferred on fivecounts (three early-season and two late-season periods). Flooded fields of corn, wheat andtomatoes were preferred during and for a short time after flood-up, particularly wheat. Rippedtomatoes were generally avoided. Wetland Field 3-16 showed the highest preference value of allthe field treatments early in the season while it held water. Disced/ripped wheat was preferredintermittently on five counts, and disced/ripped and flooded wheat fields were preferred duringthe first five. Newly-planted wheat was preferred on the first two counts after planting in lateNovember. Wheat stubble was only preferred during the first two periods. For non-agricultureareas, dirt levees were highly preferred from the first surveys through late November. The side ofthe main levee was preferred during November after the first rains moistened the soil. Dirt roadsshowed intermittent preference, while gravel roads were preferred in September and earlyOctober.
In comparing use and preference, high percentages of use generally occurred at the same time ashigh HPI levels. However, use-days could be low and HPIs high where habitat acreage wassmall. For example, wetland Field 3-16 was only 14.4 acres (5.8 ha) and supported 6.9% and11.4% of the use-days for the first two bi-weekly periods, but HPIs were extremely high at 23.0and 57.0. Conversely, use of a crop treatment could be high, while the HPI was small due tolarge acreages (e.g., corn stubble early in the season supported 28.0% of the crane use, but theHPI was only 0.4). Chopped corn was the only crop which remained important through most ofthe season, showing both high use and preference.
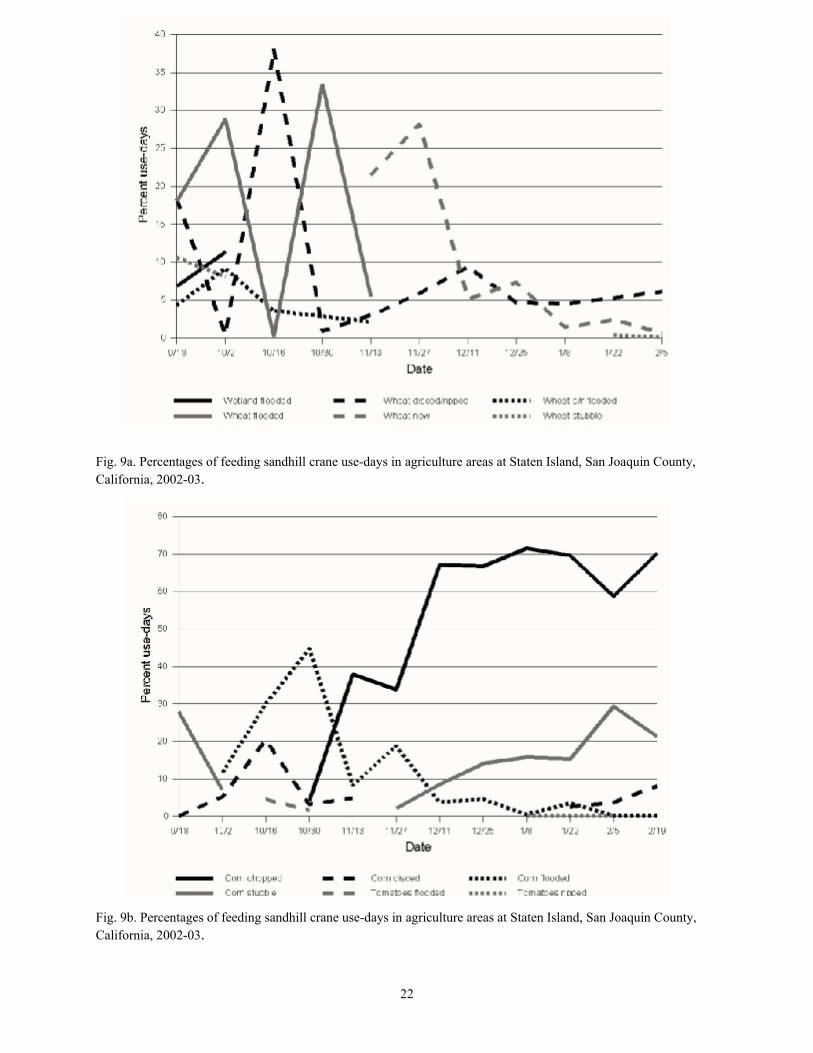
22
Fig. 9a. Percentages of feeding sandhill crane use-days in agriculture areas at Staten Island, San Joaquin County,California, 2002-03.
Fig. 9b. Percentages of feeding sandhill crane use-days in agriculture areas at Staten Island, San Joaquin County,California, 2002-03.

23
Fig. 10. Percentages of feeding sandhill crane use-days in non-agriculture areas at Staten Island, San JoaquinCounty, California, 2002-03.
Fig. 11. Overall percentages of feeding sandhill crane use-days by habitat type at Staten Island, San Joaquin County,California, 2002-03.
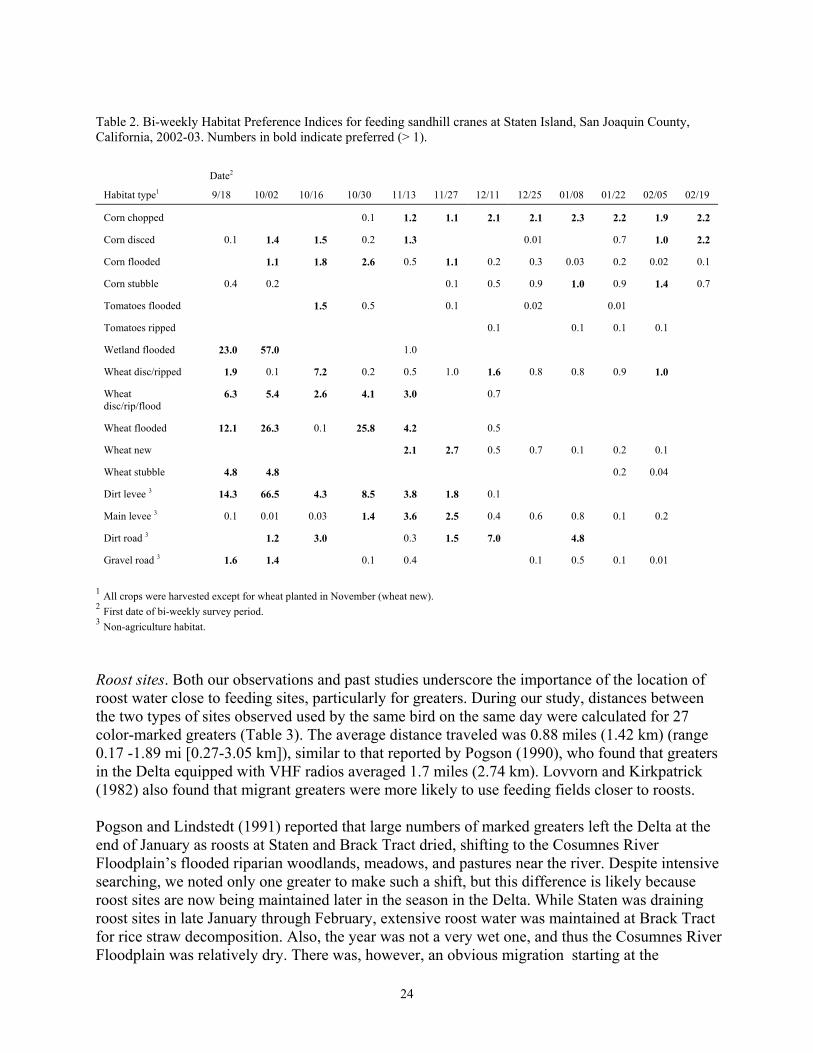
24
Table 2. Bi-weekly Habitat Preference Indices for feeding sandhill cranes at Staten Island, San Joaquin County,California, 2002-03. Numbers in bold indicate preferred (> 1).
Date2
Habitat type1 9/18 10/02 10/16 10/30 11/13 11/27 12/11 12/25 01/08 01/22 02/05 02/19
Corn chopped 0.1 1.2 1.1 2.1 2.1 2.3 2.2 1.9 2.2
Corn disced 0.1 1.4 1.5 0.2 1.3 0.01 0.7 1.0 2.2
Corn flooded 1.1 1.8 2.6 0.5 1.1 0.2 0.3 0.03 0.2 0.02 0.1
Corn stubble 0.4 0.2 0.1 0.5 0.9 1.0 0.9 1.4 0.7
Tomatoes flooded 1.5 0.5 0.1 0.02 0.01
Tomatoes ripped 0.1 0.1 0.1 0.1
Wetland flooded 23.0 57.0 1.0
Wheat disc/ripped 1.9 0.1 7.2 0.2 0.5 1.0 1.6 0.8 0.8 0.9 1.0
Wheatdisc/rip/flood
6.3 5.4 2.6 4.1 3.0 0.7
Wheat flooded 12.1 26.3 0.1 25.8 4.2 0.5
Wheat new 2.1 2.7 0.5 0.7 0.1 0.2 0.1
Wheat stubble 4.8 4.8 0.2 0.04
Dirt levee 3 14.3 66.5 4.3 8.5 3.8 1.8 0.1
Main levee 3 0.1 0.01 0.03 1.4 3.6 2.5 0.4 0.6 0.8 0.1 0.2
Dirt road 3 1.2 3.0 0.3 1.5 7.0 4.8
Gravel road 3 1.6 1.4 0.1 0.4 0.1 0.5 0.1 0.01
1 All crops were harvested except for wheat planted in November (wheat new).2 First date of bi-weekly survey period.3 Non-agriculture habitat.
Roost sites. Both our observations and past studies underscore the importance of the location ofroost water close to feeding sites, particularly for greaters. During our study, distances betweenthe two types of sites observed used by the same bird on the same day were calculated for 27color-marked greaters (Table 3). The average distance traveled was 0.88 miles (1.42 km) (range0.17 -1.89 mi [0.27-3.05 km]), similar to that reported by Pogson (1990), who found that greatersin the Delta equipped with VHF radios averaged 1.7 miles (2.74 km). Lovvorn and Kirkpatrick(1982) also found that migrant greaters were more likely to use feeding fields closer to roosts.
Pogson and Lindstedt (1991) reported that large numbers of marked greaters left the Delta at theend of January as roosts at Staten and Brack Tract dried, shifting to the Cosumnes RiverFloodplain’s flooded riparian woodlands, meadows, and pastures near the river. Despite intensivesearching, we noted only one greater to make such a shift, but this difference is likely becauseroost sites are now being maintained later in the season in the Delta. While Staten was drainingroost sites in late January through February, extensive roost water was maintained at Brack Tractfor rice straw decomposition. Also, the year was not a very wet one, and thus the Cosumnes RiverFloodplain was relatively dry. There was, however, an obvious migration starting at the

25
end of January, as large flocks were seen leaving, some regularly-noted marked cranes were nolonger found, and new birds were noted. Greaters were reported arriving at Modoc NWR andSummer Lake Wildlife Area (WA) the first week of February (S. Ludwig and M. St. Louis,personal communications), similar to the average arrival date at Malheur NWR of 17 Februaryand the earliest record of 7 February (Ivey et al. 1997). Most greaters were gone from the NorthDelta by late February, but there were still 284 on 6 March at Brack Tract.
Table 3. Distances between feeding and roost sites for marked greater sandhill cranes at the North Sacramento-SanJoaquin Delta, Cosumnes River Floodplain, and Stone Lakes NWR, California, 2003-03. Numbers in use areas referto Staten Island field names.
Identity Date Foraging field Roost field Distance mi (km)
A29 29 October 16 17B 0.98 (1.58)Flip 15 January 1A 4A 1.00 (1.61)Flip 2 February 1A 4A 1.04 (1.68)Grinch 4 November 2A 4A 0.18 (0.29)Grinch 27 December 1A 2A 0.17 (0.27)Grinch 15 January 1A 4A 0.49 (0.79)Grinch 20 January 1A 4A 0.48 (0.77)Grinch 2 February 1A 4A 0.47 (0.76)Lilly 12 November 1A 4A 0.41 (0.66)Marco 29 October North Tyler Island 17B 1.46 (2.35)P043 29 October North Tyler Island 17B 0.87 (1.40)P076 15 January 1A 4A 0.68 (1.10)P076 19 January 18B 2A 0.50 (0.81)P076 2 February 1A 4A 0.45 (0.73)P146 2 December Middle Tyler Island 16 0.64 (1.03)Sam 26 November 18 B 2A 0.36 (0.58)Sam 27 December 18 A North Tyler Island 1.10 (1.77)Sam 15 January 1A 2A 0.48 (0.77)Attilla 31 December Central Brack Tract Isenberg South 0.93 (1.50)Bert 4 October Central Brack Tract Isenberg South 1.42 (2.29)Jackie 8 October Central Brack Tract Isenberg South 1.53 (2.47)Lois 8 October Central Brack Tract Isenberg South 1.40 (2.26)Oak and Sara 4 October Central Brack Tract Isenberg South 1.34 (2.16)Oak and Sara 8 October Central Brack Tract Isenberg South 1.34 (2.16)Strugg and Yoyd 14 February Central Brack Tract Isenberg North 1.89 (3.05)Picard 3 December Riley Road, CRF Dairy Roost, CRF 0.80 (1.29)8 Modoc NWR birds 16 October Hood-Franklin Road Southwest Elk Grove 1.30 (2.10)Mean 0.88 (1.42)
Disturbance. When cranes were disturbed, they generally flew or moved away by walkingrapidly or running. Excessive disturbance can cause cranes to abandon foraging and roost sites,and repeated flushing of birds can effect the welfare of wintering cranes as they need to conserveenergy at this time of year to stay warm and build body condition, rather than burn energyunnecessarily. Their physical condition is also important because they need to store fat and lipidsto assist with long migrations back to breeding sites and to help carry them through egg layingand incubation (Krapu et al. 1985). The following were sources of disturbances recorded duringour surveys.
Aircraft--Disturbance by aircraft affected the greatest number of cranes. On 16 October, a

26
San Joaquin County Mosquito Abatement District plane (apparently assessing water levels)flushed at least 400 (almost 1/4 using the island at the time) when flying low over Fields 16 and17, and it continued to circle so that they could not return to the area. Planes spraying for weedcontrol were a common problem late in the season: on 6 February, most of the loafing cranes onthe island took flight as a plane worked its way north, flushing 485 on Tyler Island as well; on 8February, 65 were flushed from Staten as a plane flew low over the island while traveling toanother site; and on 14 February, one working the main levee at Brack Tract flushed nearly allthe cranes using the area (4,500). Ultralight aircraft disturbances were also noted as they flewalong the South Fork of the Mokelumne River (1,500 on 2 December, 400 on 3 January, and 60on 8 February). Also on 8 February, 320 took flight from New Hope Tract and Dead HorseIsland as an ultralight continued to circle. On other occasions at Staten, a private plane caused1,200 cranes to take flight on 10 December, and a helicopter flying low up a river channelflushed 280 on 23 November. Disturbance by aircraft undoubtably occurred more often thanobserved, especially on sunny weekends.
Vehicles used for farming--The most frequent disturbance factor on the island was from theuse of four-wheeled all-terrain vehicles (ATVs). In September and October, shepherds usingATVs caused repeated disturbances on the roads around Field 3 where the majority of the craneswere roosting, loafing, and feeding. ATVs also flushed cranes when they were used for farmingoperations, during pheasant hunts, and apparently for recreation by farm staff.
Cranes were much more tolerant of cars and trucks as long as the occupants stayed inside,although rapidly approaching vehicles caused at least some birds to fly or move, and wereespecially disturbed by traffic along the levees or at dawn or dusk. For example, early morningdriving of trucks by the shepherds camped near the Field 3 Roost caused all of the island’sroosting cranes to fly off before dawn several times. A similar problem was noted later in theyear by farm staff driving by the Field 4A roost near dawn and flushing 500, and a persondriving out to monitor a gas well at dusk in the middle of the Field 15 roost caused 80 cranes tofly. Cranes were more tolerant of vehicles in mid-day while they were loafing (e.g., a largeCDFG fish-stocking truck driving on the levee near the Field 3 Roost in the middle of the daycaused alarm but most cranes did not take flight). Cranes were also less concerned with slowly-moving farming equipment in the fields; they were often seen nearby taking advantage of thenewly-created feeding opportunities. They also became accustomed to the constant traffic of thelarge trucks hauling during the corn harvest, but remained wary about slow-moving cars andtrucks.
Currently, 10 permanent and 12-14 seasonal employees farm the island, but in the past,asparagus farming at the south end of the island alone employed over 300, and this high numberof employees created high levels of disturbance for cranes and other wildlife (J. Shanks, personalcommunication). In recent years, cranes traditionally feed at the north end of the island only atthe end of the season when the rest has been fed out, presumably because of more disturbancethere (J. Shanks, personal communication). Feeding use in some fields may have been influencedby disturbance (e.g., Field 1B near the busy mill was rarely used).
Hunting--Another historic decrease in the level of disturbance at Staten was the eliminationof public waterfowl and pheasant hunting in 1974. Previously, the island was leased to CDFG,and over 300 hunters used the island all day, keeping waterfowl and crane numbers very low (the

27
latter only about 200 in the closed areas) (J. Shanks, personal communication). After the publichunting program was terminated due to lack of funds, hunting became very controlled by themanager. Waterfowl hunting was limited in 2002-03, with about 12 blinds available and self-imposed restrictions of three hunt days per week and shooting hours ending at 10:00 A.M. Withonly six hunters officially assigned to blinds and each authorized to bring a guest, a maximum of12 hunters could be present, but there were usually fewer since many employees could only hunton Sunday. The ranch designed these restrictions to minimize disturbance to cranes and allowthem to return for undisturbed mid-day loafing and afternoon feeding (J. Shanks, personalcommunication). This well-managed program was compatible with high levels of crane use, yetthe disturbance from hunting kept waterfowl numbers from becoming excessive, limitedcompetition for local foods, and reduced the threat of avian cholera outbreaks which could causecrane mortality. Also, it likely decreased concerns of hunters from local areas about the potentialeffects of a large bird sanctuary on Staten on their hunting success.
When hunters entered blinds in the dark, some cranes flushed, but when shooting began, cranesgenerally didn’t fly unless they were roosting near hunters, however, they reacted to shooting bybecoming very alert. There were some effects of the hunt program on cranes during non-shootinghours, when hunters occasionally flushed cranes while driving the island to plan hunts, and onone occasion, a hunter was in a flooded corn field one afternoon apparently working on a blind inan area used by loafing and roosting cranes; no cranes were nearby. We observed that cranesusually returned to loaf earlier on hunt days than non-hunt days, presumably because they wereflushed earlier in the day.
After opening day of waterfowl season (26 October), the number of cranes using Staten roostsites more than doubled, probably due to greater impacts of hunting in nearby areas. At least1,300 flew to the Field 15-17 roost from Canal Ranch and Brack tracts where shots were beingfired. With the second opening of the season on 30 November (after a two-week closure), therewas another increase in total roost numbers, and cranes reacted with similar behavior to hunters.However, the tomato field roosts were also hunted, but unlike the results for flooded corn, roostnumbers after opening day dropped from 2,150 to 395. Counts of this field had not been this lowfor a month. This decline was likely related to the hunter beaming headlights across the roost inthe dark as the truck was turned around. All cranes and waterfowl flushed, while cranes circledin the dark. Approximately half left the area, while the other half eventually returned to the roostsite, but on the other side of the field. When the first shot was fired at dawn, about 75 cranes flewto Tyler Island, with the remaining staying at the roost later than usual; 730 were still present at0740 hrs (exceptionally late). That evening, cranes started to fly in nearly 30 minutes earlier thanthe night before, and in the much fewer numbers mentioned, with no swans and only 20% of thecranes at the area where the hunter had been. At Tyler Island, a flooded asparagus field used bymore than 1,000 cranes supported only a few after hunting began, and at Sun River Ranch, aroost site was abandoned after the area was hunted, but cranes resumed using it after waterfowlseason ended.
Pheasant hunting season opened on 9 November. This type of hunting was much more disruptiveas hunters walked through fields or drove ATVs throughout the day on weekends, rather thanremaining concealed in blinds and only hunting in the mornings three times per week. Huntingparties also sometimes comprised a larger group, including horses, ATVs, dogs, and hunters on
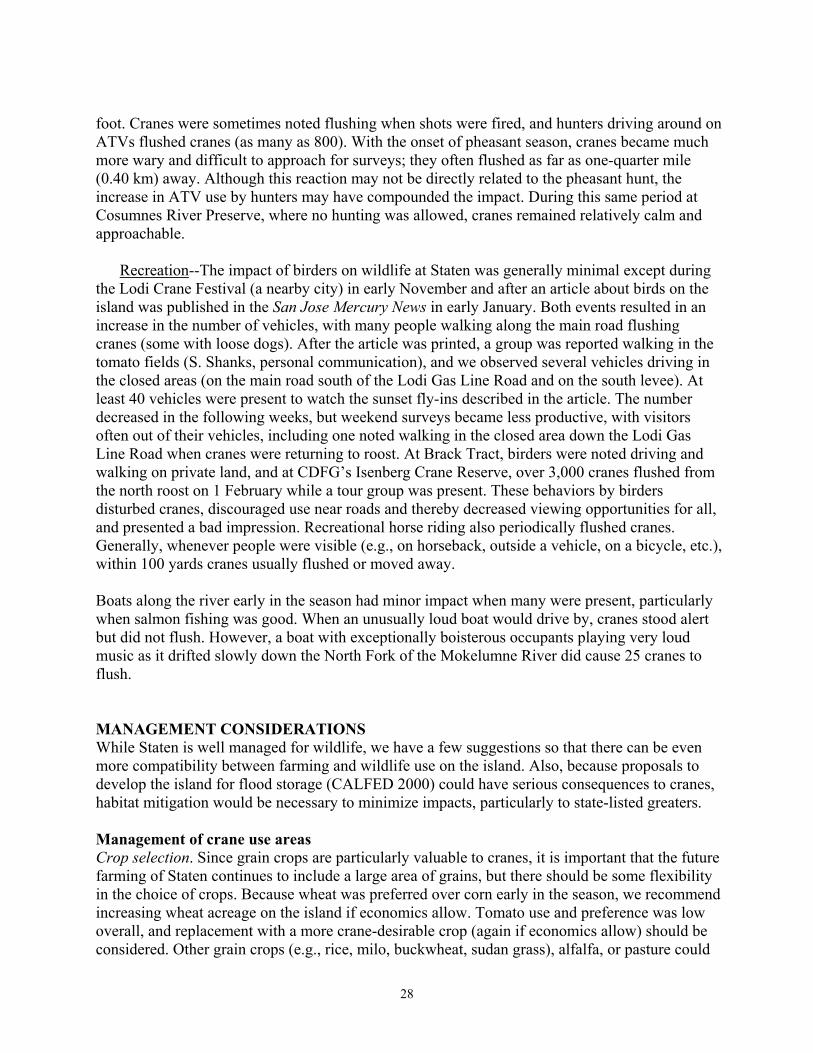
28
foot. Cranes were sometimes noted flushing when shots were fired, and hunters driving around onATVs flushed cranes (as many as 800). With the onset of pheasant season, cranes became muchmore wary and difficult to approach for surveys; they often flushed as far as one-quarter mile(0.40 km) away. Although this reaction may not be directly related to the pheasant hunt, theincrease in ATV use by hunters may have compounded the impact. During this same period atCosumnes River Preserve, where no hunting was allowed, cranes remained relatively calm andapproachable.
Recreation--The impact of birders on wildlife at Staten was generally minimal except duringthe Lodi Crane Festival (a nearby city) in early November and after an article about birds on theisland was published in the San Jose Mercury News in early January. Both events resulted in anincrease in the number of vehicles, with many people walking along the main road flushingcranes (some with loose dogs). After the article was printed, a group was reported walking in thetomato fields (S. Shanks, personal communication), and we observed several vehicles driving inthe closed areas (on the main road south of the Lodi Gas Line Road and on the south levee). Atleast 40 vehicles were present to watch the sunset fly-ins described in the article. The numberdecreased in the following weeks, but weekend surveys became less productive, with visitorsoften out of their vehicles, including one noted walking in the closed area down the Lodi GasLine Road when cranes were returning to roost. At Brack Tract, birders were noted driving andwalking on private land, and at CDFG’s Isenberg Crane Reserve, over 3,000 cranes flushed fromthe north roost on 1 February while a tour group was present. These behaviors by birdersdisturbed cranes, discouraged use near roads and thereby decreased viewing opportunities for all,and presented a bad impression. Recreational horse riding also periodically flushed cranes.Generally, whenever people were visible (e.g., on horseback, outside a vehicle, on a bicycle, etc.),within 100 yards cranes usually flushed or moved away.
Boats along the river early in the season had minor impact when many were present, particularlywhen salmon fishing was good. When an unusually loud boat would drive by, cranes stood alertbut did not flush. However, a boat with exceptionally boisterous occupants playing very loudmusic as it drifted slowly down the North Fork of the Mokelumne River did cause 25 cranes toflush.
MANAGEMENT CONSIDERATIONSWhile Staten is well managed for wildlife, we have a few suggestions so that there can be evenmore compatibility between farming and wildlife use on the island. Also, because proposals todevelop the island for flood storage (CALFED 2000) could have serious consequences to cranes,habitat mitigation would be necessary to minimize impacts, particularly to state-listed greaters.
Management of crane use areasCrop selection. Since grain crops are particularly valuable to cranes, it is important that the futurefarming of Staten continues to include a large area of grains, but there should be some flexibilityin the choice of crops. Because wheat was preferred over corn early in the season, we recommendincreasing wheat acreage on the island if economics allow. Tomato use and preference was lowoverall, and replacement with a more crane-desirable crop (again if economics allow) should beconsidered. Other grain crops (e.g., rice, milo, buckwheat, sudan grass), alfalfa, or pasture could

29
be substituted as crane-friendly alternatives. Potatoes would likely receive more use by cranesand would also benefit swans and geese.
Given the high preference of the small wetland (Field 3-16) and observations of very heavy useof wetland areas at Isenberg Crane Reserve, we recommend managing some portions of theisland as seasonal wetlands. These habitats provide a variety of foods, including sources ofprotein in the form of invertebrates, seeds, roots and tubers. Historically, the Delta was a vastwetland which was reclaimed for farming late in the 19th Century, and before the introduction ofagriculture, it is likely that cranes relied heavily on grasslands and seasonal wetlands on thefloodplains of the Delta.
We also suggest considering using wetland/agriculture rotations to provide benefits to wildlifeand enhance agricultural production. A pilot study of this method has been conducted at TulelakeNWR in northeast California where soils and conditions are very similar to the Delta, with deeppeat soil subsidence about 20 feet (~6 m) below the level of the water in the Tulelake Sump (D.Mauser, Klamath Basin NWRs, personal communication). This study set aside 600 acres (242.9ha) in three 200-acre (81 ha) blocks for experimental wetland rotation. Initially, one block wasflooded and managed as seasonal wetlands for two years, then drawn down and farmed, whilethe wetland was rotated to the next block. The first wetland block was planted to spring barleyand grew bumper yields of the highest quality. The second year, the same fields were planted topotatoes, and grew the highest yield in the Klamath Basin, without the need for fertilizer orpesticide use (because the wetland rotation killed the soil pests). In addition, the seasonalwetlands supported very high waterfowl and waterbird use, and while the lease required that thehigh bidding farmer pay for the water for flooding, he did very well financially. Such a wetlandrotation at Staten would provide multiple benefits. It would likely reduce the need for herbicides,pesticides, and fertilizers, and perhaps increase crop yields which would compensate for thereduced acreage farmed in a given year. This technique should also help reduce soil oxidationand improve soil structure, and wetland vegetation could be disced after drawdown to helprebuild organic soils. Wildlife benefits would also be great since seasonal wetlands could bemanaged to provide for waterfowl and other wetland bird nesting and production, as well aswintering foraging and roosting habitats for cranes, waterfowl, other waterbirds, and a variety ofother wildlife, including state-Threatened Swainson’s hawks (Buteo swainsonii).
While rice is not grown at Staten, we feel that recommendations should be made for farming thiscrop in case it is grown in the future. The harvested rice of Brack Tract initially was a choicefeeding spot for over 5,000 cranes, but the deep-flooding of the area decreased its forage value,and was thereafter used mostly for loafing and roosting only. A similar pattern was documentedat Cosumnes River Preserve. The only feeding use at Brack Tract thereafter was on the ricecheck levees; these birds were mostly greaters (because they are more traditional in use areas),with most lessers flying to other areas to feed. Littlefield (2002) also reported that cranes fedintensively, but only for a short time in newly-flooded rice in the Sacramento Valley. Headditionally noted that unaltered rice stubble was the most consistent crop used, with plowedfields the least. Burnt fields were also used, but attracted geese, ducks, and blackbirds whichdepleted the food source. Therefore, if rice is going to be grown, we recommend that if floodingfor rice straw composition must take place, it should be staged slowly over time to enhancefeeding opportunities for cranes, with water kept as shallow as possible. While some fields might

30
be flooded early to provide roost sites, it would be best if flooding occurred after December toallow most of the waste grain to be consumed.
Crop treatments. The chopping of corn enhanced the attractiveness of fields to cranes and werecommend that this practice continue. However, because cranes sometimes appeared to useunmanipulated corn stubble as thermal cover during storms, and given that other wildlife dependon cover, we suggest that approximately 60-75% of the corn be chopped, leaving the rest asstanding stubble. The practice of leaving field edges unmowed should continue in order toprovide additional cover for wildlife in winter weather, as well as for nesting ducks andsongbirds. Winter wheat was planted more heavily than normal (an additional 25 lbs/acre [28kg/ha]) to allow for crane forage (J. Shanks, personal communication), and this practice shouldcontinue.
Newly-flooded areas were greatly preferred and received high use by cranes. As recommendedfor rice, flood-up and short-term irrigations of all areas should proceed very slowly. It would alsobe helpful to stagger new flooded areas to provide new feeding opportunities (e.g., don’t floodFields 15-17 all at once). Where possible, the use of fall irrigations in additional areas wouldenhance crane foraging opportunities. Irrigated areas should be mostly subbed so that waterlevels primarily drive invertebrates to the surface rather than drown them.
While cranes were attracted to newly-disced areas, use of these fields was short-lived, as thismethod buried much of the waste grain, making it unavailable and reducing the overall foragevalue. We understand that discing is necessary, but recommend that for grainfields it be delayeduntil later in the winter, if possible, after much of the waste grain is consumed. Grit is animportant factor in a crane’s diet, and gravel sources should be maintained on roads and levees.
Roost sites. It would be beneficial to reconfigure the island to facilitate independent managementof water and allow flooding of more areas for multiple benefits to croplands and wildlife. Werecommend providing a minimum of one roost site of at least 10 acres (4 ha) before the firstweek of September when early cranes arrive since roosting habitat is very limited at this time inthe Delta. Ideally, there should be three areas dedicated to providing roost sites from earlySeptember until the first week of March, independent of the agriculture around them so thatfields can be flooded or drawn down as needed. To improve crane distribution and reducecrowding, roost sites should be positioned at the north (north of the Beaver Slough Road),middle, and south (south of Camp 5 Road) areas of the island. Each of these areas should containat least 100 flooded acres (40.5 ha). While additional acreage could be beneficial, the trade-offbetween foraging sites and roosting should be considered, and flooding should be slowly stagedto allow cranes to utilize available waste grain.
We also suggest considering using these roost site units as seasonal wetlands as discussedpreviously. Alternatively, they could be managed as wetland pastures by maintaining waterthrough early March (or late May for duck and shorebird production), with grazing use primarilyfrom March (or June) through August. Occasional light irrigations during summer would helpmaintain wetland plants. If vegetation became too dense, it could be dried then disced to beincorporated into the soil to help rebuild peat.

31
Having consistent places for roost sites is recommended because of the strong site fidelity ofgreaters which indicates that they do not adapt easily to changes in their winter use areas.Lovvorn and Kirkpatrick (1981) also observed that regular roost locations were important, asfavored roosts were used immediately after flooding, and Pogson and Lindstedt (1988) suggestedthat deaths due to powerline collisions near new roost sites were related to the birds’unfamiliarity with the location of the lines. Therefore, roost sites should be located away frompowerlines when possible, especially considering the history of crane powerline mortality in theDelta (R. Schlorff, personal communication). In addition, cranes flushed by hunters could beforced to fly in the fog, putting them at risk to powerline mortality. However, water levels canalso play a role. In late January, a crane hit a powerline near Field 69 at night, likely the cause ofa power outage (S. Shanks, personal communication). Since cranes do not generally fly at nightin the fog, it is likely that the water levels were so low that one of the coyotes (Canis latrans)seen using the area flushed cranes in the dark (the crane was partially consumed). This is anotherreason for maintenance of roost water through the entire wintering season. Finally, roost areasshould be located in areas where impacts from farming and hunting activities are likely to beminimal, as cranes prefer undisturbed roosts (Lovvorn and Kirkpatrick 1981, personalobservations).
DisturbanceAircraft. Our greatest concern regarding disturbance is low-flying aircraft which consistentlyflushed large numbers of cranes. We recommend an outreach program be developed andpresented at local airports used by private planes, ultralights, and helicopters to identify majorcrane use areas and timing of crane behavior to allow them to avoid disturbance at critical times.Contact should also be made with the San Joaquin County Mosquito Abatement District andprivate spray planes to recommend conducting mosquito control spraying at flooded areas in themornings while most cranes are out feeding, and herbicide spraying of dry feeding areas duringlate morning when cranes are loafing in wetter areas. In addition, studies of lessers have shownthat aircraft above an altitude of 150 meters led to only minor disturbance (Herter 1982). Pilotsshould be encouraged to fly above this level when traveling between areas to limit cranedisturbance.
Farming operations. Where possible, farming operations should try to avoid disturbing cranesduring the wintering season. Major activity areas such as the shepherd’s camp should be placedaway from crane roost sites. The use of vehicles should be minimal near regular crane use areas;early mornings and late afternoons are especially important times to avoid. ATVs should only beused when necessary as they are a serious disturbance and alternate routes should be used asneeded to avoid high concentrations of feeding, loafing and roosting cranes. Activities such asconstruction projects, irrigation, and other wildlife censuses should be conducted withconsideration for minimal disturbance to cranes. For example, it would be best to conductconstruction projects outside the crane wintering period. On a daily basis, choosing theappropriate time of day to manipulate irrigation water or census other wildlife would limitdisturbance. Also, although there are several groups interested in studying different aspects ofthe island in the future, the number of monitoring projects should be restricted during the craneuse season and not be near major use areas. Guidelines to limit crane disturbance should beconveyed to all agencies and groups working on the island (e.g., Department of WaterResources, Lodi Gas Storage LLC, DU, researchers, Cosumnes Preserve staff, etc.).

32
Hunting. The current level of waterfowl hunting on Staten appeared compatible with high levelsof crane use and could be permitted with continued restrictions on numbers of hunters andshooting hours. It would be best if hunting related activities such as setting up decoys and blindsoccurred during mornings while cranes are away from roosts. Blinds should be placed on edgesof fields or some areas not hunted to allow cranes to have more of an unharrassed roost area, aswe found that waterfowl hunting in other parts of the study area affected use by cranes, andmigrant greaters have been observed avoiding use of hunted areas in fall which were usedheavily in spring when there was no hunting (Lovvorn and Kirkpatrick 1982). In addition,Pogson and Lindstedt (1988) reported that in the Sacramento Valley, cranes abandoned huntedareas after waterfowl hunting began, and this behavior has also been documented in several otherstates as well (Lovvorn and Kirkpatrick 1981). Pogson and Lindstedt (1988) also observed thatroost sites were abandoned after pheasant season opened; we also found a high level ofdisturbance with pheasant hunting. Therefore, we recommend that if pheasant hunting continues,it be allowed only during mid-day (10 AM to 2 PM) in areas away from crane loafing sites.
Recreation and public education about cranes. While we encourage people to view and enjoywildlife on the island, we are concerned that there was confusion among the visitors about whichareas were open to the public and other use restrictions. Signs should be erected at the start of themain road clarifying that only the main road to the Lodi Gas Line Road is open, and additionalsignage at that point should clearly state that public access ends there. Also, there should beanother sign posted at the start of the main road asking people to stay in their cars for betterwildlife viewing. Such signs have proven successful in minimizing disturbance at some NWRs.Area regulations during the crane wintering season should include that foot, bicycle, horse, andATVs not be allowed, with dogs permitted only in vehicles. Pullouts could possibly beconstructed as well as a viewing blind, shielding visitors from feeding and roosting cranes andwhere people could leave their vehicles.
One of the greatest potential values of Staten is as a focal site to educate the public about craneconservation. While festivals, newspaper articles, and tours can disturb cranes if not carefullyregulated, they also can be beneficial by drawing visitors to whom information can be providedon the species, and support can be generated for the birds and their habitats. The sighting of ademoiselle crane at Staten and Brack Tract in the winter of 2001-02 also provided suchopportunities. We recommend that a public use and interpretation plan be developed to managevisitor use, yet encourage them to enjoy the island’s wildlife. Interpretive information should bedeveloped about the conservation needs for cranes and other wildlife, as well as wildlife-friendlyfarming practices. We also suggest that a partnership be sought with Farm Services agencies andAgricultural Extension offices to develop and disseminate information.
Future crane monitoring and researchThis study was a one-season effort and may not be representative of a typical year. Werecommend that monitoring be continued and additional research on sandhill cranes beconducted.
Future monitoring. Ideally, crane numbers should be monitored at Staten on at least a monthlybasis to evaluate the success of management programs. However, care should be taken to ensurethat studies are compatible with crane use and follow appropriate protocols. To assist with

33
Flyway-level monitoring, we recommend conducting coordinated surveys to develop estimatesof subspecies populations in partnership with CDFG and other agencies throughout the CentralValley. Recruitment rate data should also be collected during September and October beforesome young greaters begin to lose their juvenile characteristics. These counts should also beconducted at the Central Valley scale to minimize bias in areas dominated by birds from onebreeding locale (e.g., cranes classified at Staten and Brack Tract are primarily Malheur NWRbirds which may have much lower productivity than birds from other areas).
Future research. While we collected baseline data on home ranges of cranes using the studyarea, our information was limited, and it is inevitable that the birds we were monitoring usedareas which were not accessible or were too far to read bands. We also could not find everymarked bird every day, and some birds were not noted through the entire season, therefore, ourestimates of home ranges are likely biased towards smaller ranges. To determine true winterranges, habitat use, and differences between subspecies, we recommend a more formal studyinvolving capturing wintering cranes, attaching radios, and regularly monitoring these birds.While satellite technology is useful in determining general locations, VHF radios would providemore precise data needed for this type of information. This would greatly enhance theunderstanding of the winter ecology of California’s sandhill cranes, with implications for futuremanagement.
Mitigation recommendationsStaten is important for greaters which are state-listed as Threatened, and lessers are beingconsidered for inclusion as a state Species of Concern. Therefore, any significant losses offoraging or roosting habitats on Staten should be mitigated. To increase the chances for success,mitigation should occur as close as possible, and ideally within two miles (3.2 km), as greatersare not likely to readily shift far from their traditional winter ranges, and impacts at local scalesare more likely to affect them. The selected area should preferably be where habitat has been lostto conversion (e.g., vineyards on Canal Ranch and Brack Tracts, and turf farms on TerminousTract), not in existing agricultural areas currently containing suitable forage crops. Roost sitesshould also be provided following the guidelines in this document. Disturbance on both feedingand roost sites should be limited.
CONCLUSIONBoth historic and current surveys have shown that Staten is a critical wintering area for sandhillcranes. In 2002-03, over 7,900 feeding and 8,500 roosting cranes were recorded. Compared toother North Delta areas, the island was the only site to consistently hold high numbers of feedingcranes through the winter. For the state-listed greater subspecies, at least 15% of the CVP dependon Staten, with data from color-marked individuals showing strong site philopatry and a longtradition of use of the island.
In recent years, crane use at Staten has increased due to farming management decisions madewith wildlife in mind so that these dual purposes could be satisfied. This method of managementbecomes even more critical given the loss of crane-compatible habitats on nearby areas. Historiccrane habitat has been replaced by vineyards on Brack and Canal Ranch tracts (Littlefield andIvey 2000) and Tyler Island (S. Shanks, personal communication), and by turf farming onTerminous Tract (our observations). North of the Delta, habitat has been lost to urbanization

34
along the Cosumnes River in northeast Elk Grove where about 100 cranes were regularlyobserved in the early 1990s (J. Miller, USFWS, personal communication), and on the LagunaCreek Floodplain, in southwest Elk Grove within the past five years (G. Ivey, personalobservation). To the south, cranes foraged on winter wheat fields near Modesto until the 1960s,but no longer do so due to the development of orchards and vineyards (G. Ivey, personalobservation). Additionally, some areas where compatible crops remain in the Delta are managedin a way not conducive to crane use; foraging at Brack Tract has greatly decreased in recentyears due to the plowing of corn and deep flooding of rice fields which has limited foraginghabitat (our observations; W. Holt, San Joaquin Audubon Society, personal communication).
Since Staten is now under TNC’s ownership, management should continue to focus on providingfor the needs of cranes. However, the future of large portions of crane wintering habitats in theDelta will be determined primarily by what happens on private holdings. Therefore, agencies andconservation groups need to find ways to encourage private land managers to incorporate crane-compatible management practices into their farming operations. It is likely that the greatest valueof Staten is as a demonstration area to show how farming and wildlife can coexist economically.
LITERATURE CITEDBLOOD, D. A., AND F. BACKHOUSE. 1999. Sandhill Crane: Wildlife in British Columbia at risk. Wildlife Branch, Ministry of Environment, Lands, and Parks, Victoria, British
Columbia, Canada.
CALFED. 2000. Draft (July 19, 200) White Paper on North Delta Improvements CALFED Bay-Delta Program. Http://calfed.water.ca.gov/DeltaImprovements/adobe_pdf/revised.pdf.
CALIFORNIA DEPARTMENT OF FISH AND GAME. In Prep. Greater Sandhill Crane Recovery Plan. California Department of Fish and Game, Sacramento, California, USA.
COLLINS, E., AND D. G. PAULLIN. 1992. Wetland and waterfowl management recommendations for M & T-Staten Ranch, Staten Island, Walnut Grove, California. CentralValley Habitat Joint Venture, Sacramento, California, USA. Unpublished report.
GLENN, T. C., J. E. THOMPSON, B. M. BALLARD, J. A. ROBERSON, AND J. O. FRENCH.2002. Mitochondrial DNA variation among wintering Midcontinent Gulf Coast sandhillcranes. Journal of Wildlife Management 66:339-348.
HERTER, D. R. 1982. Habitat use and harassment of sandhill cranes staging on the easternCopper River Delta, Alaska. M.S. Thesis, University of Alaska, Fairbanks, Alaska, USA.
HOFFMAN, R. H. 1976. Field usage by Sandhill Cranes in southern Michigan. Pages 35-43 in J.C. Lewis, editor. Proceedings of the International Crane Workshop. Oklahoma StateUniversity Publishing and Printing, Stillwater, Oklahoma, USA.
IVEY, G. L., AND C. P. HERZIGER. 2000. Distribution of greater sandhill crane pairs inOregon, 1999/00. Oregon Department of Fish and Wildlife, Wildlife Diversity Program

35
Technical Report #03-01-00, Portland, Oregon, USA.
_____, AND _____. 2001. Distribution of greater sandhill crane pairs in California 2000.California Department of Fish and Game, Sacramento, California, USA
_____, _____, and M. Gause. 2003. Farming operations at Staten Island, San Joaquin County,California. Unpublished report. The Nature Conservancy, Galt, California, USA.
_____, _____, AND T. J. HOFFMANN. In Prep. Tracking movements of Pacific Coast sandhill cranes through their annual cycle. Proceedings North American Crane Workshop
9. Preliminary results on the web at: http://www.geocities.com/wccwg/Research/PTT051602/PTTstudy.htm
_____, _____, AND E. J. SCHEUERING. 1997. Spring Migration Dates for Birds at MalheurNational Wildlife Refuge, Oregon, and Surrounding Area. Oregon Birds 24:18-21.
KRAPU, G. L., G. C. IVERSON, K. J. REINECKE, AND C. M. BOISE. 1985. Fat depositionand usage by arctic-nesting sandhill cranes during spring. Auk 102:362-368.
LEWIS, J. C. 1979. Field identification of juvenile sandhill cranes. Journal of WildlifeManagement 43:211-214.
LITTLEFIELD, C. D. 1995. Demographics of a declining flock of greater sandhill cranes inOregon. Wilson Bulletin 107:667-674.
. 2002. Winter foraging habitat of Greater Sandhill Cranes in northern California. WesternBirds 33:51-60.
_____, AND G. L. IVEY. 2000. Conservation Assessment for Greater Sandhill Cranes winteringon the Cosumnes River Floodplain and Delta regions of California. The Nature Conservancy,Galt, California, USA.
_____, AND _____. 2002. Washington State Recovery Plan for the Sandhill Crane. WashingtonDepartment of Fish and Wildlife, Olympia, Washington, USA.
LOVVORN, J. R., AND C. M. KIRKPATRICK. 1981. Roosting behavior and habitat of migrantgreater sandhill cranes. Journal of Wildlife Management 45:842-857.
_____, AND _____. 1982. Field use by staging eastern greater sandhill cranes. Journal ofWildlife Management 46:99-108.
OREGON DEPARTMENT OF FISH AND WILDLIFE. 1997. Oregon Department of Fish andWildlife Sensitive Species. Oregon Department of Fish and Wildlife, Portland, Oregon, USA.
PACIFIC FLYWAY COUNCIL. 1983. Pacific Flyway Management Plan: Pacific FlywayPopulation of Lesser Sandhill Cranes. Pacific Flyway Study Committee (c/o Pacific Flyway
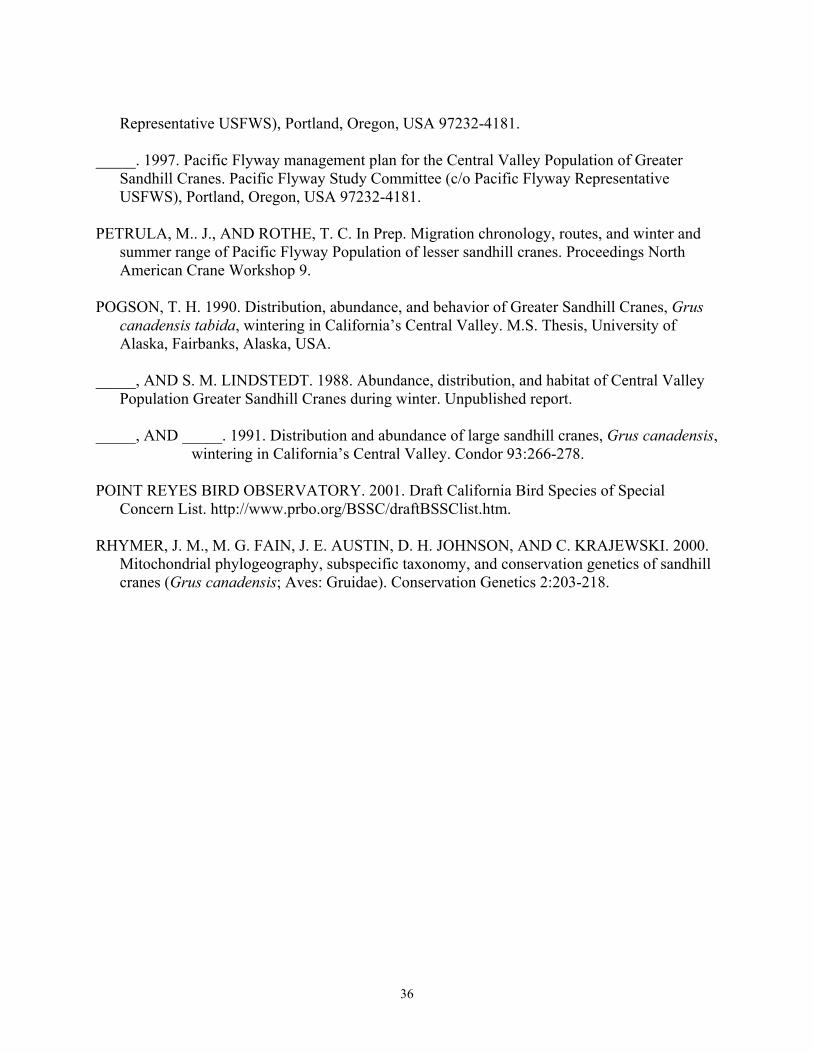
36
Representative USFWS), Portland, Oregon, USA 97232-4181.
_____. 1997. Pacific Flyway management plan for the Central Valley Population of GreaterSandhill Cranes. Pacific Flyway Study Committee (c/o Pacific Flyway RepresentativeUSFWS), Portland, Oregon, USA 97232-4181.
PETRULA, M.. J., AND ROTHE, T. C. In Prep. Migration chronology, routes, and winter andsummer range of Pacific Flyway Population of lesser sandhill cranes. Proceedings NorthAmerican Crane Workshop 9.
POGSON, T. H. 1990. Distribution, abundance, and behavior of Greater Sandhill Cranes, Gruscanadensis tabida, wintering in California’s Central Valley. M.S. Thesis, University ofAlaska, Fairbanks, Alaska, USA.
_____, AND S. M. LINDSTEDT. 1988. Abundance, distribution, and habitat of Central ValleyPopulation Greater Sandhill Cranes during winter. Unpublished report.
_____, AND _____. 1991. Distribution and abundance of large sandhill cranes, Grus canadensis,wintering in California’s Central Valley. Condor 93:266-278.
POINT REYES BIRD OBSERVATORY. 2001. Draft California Bird Species of SpecialConcern List. http://www.prbo.org/BSSC/draftBSSClist.htm.
RHYMER, J. M., M. G. FAIN, J. E. AUSTIN, D. H. JOHNSON, AND C. KRAJEWSKI. 2000.Mitochondrial phylogeography, subspecific taxonomy, and conservation genetics of sandhillcranes (Grus canadensis; Aves: Gruidae). Conservation Genetics 2:203-218.
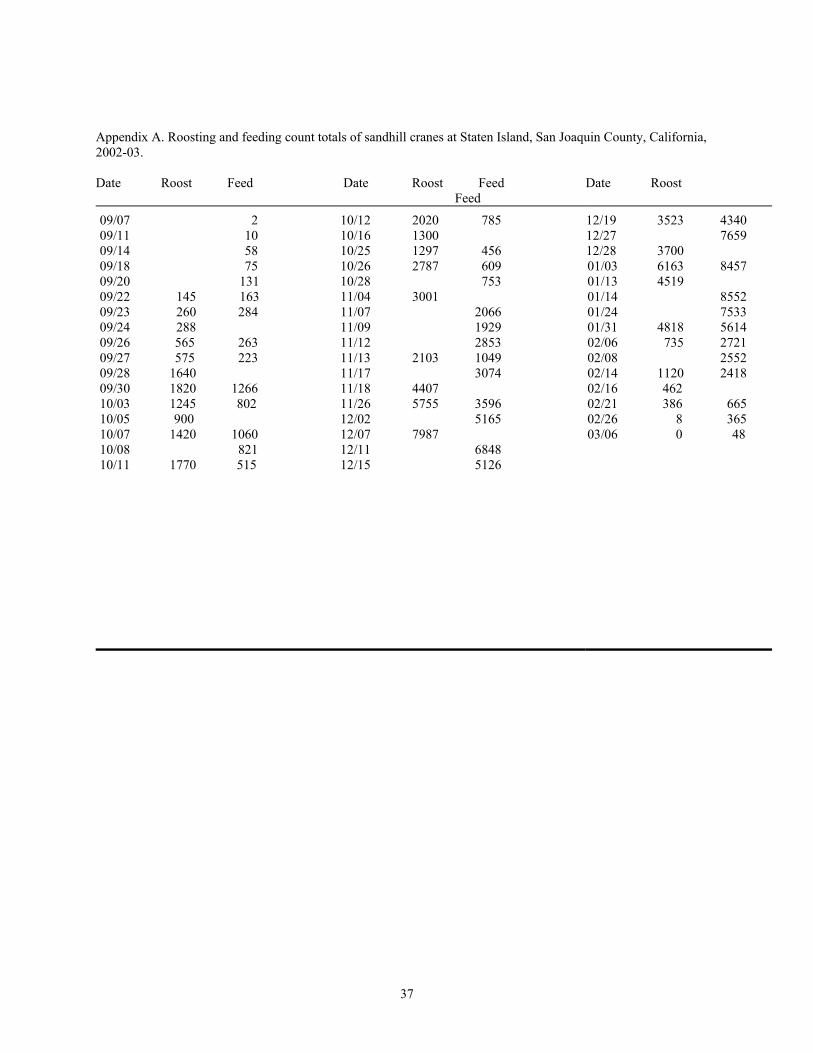
37
Appendix A. Roosting and feeding count totals of sandhill cranes at Staten Island, San Joaquin County, California,2002-03.
Date Roost Feed Date Roost Feed Date Roost Feed
09/07 209/11 1009/14 5809/18 7509/20 13109/22 145 16309/23 260 28409/24 28809/26 565 26309/27 575 22309/28 164009/30 1820 126610/03 1245 80210/05 90010/07 1420 106010/08 82110/11 1770 515
10/12 2020 78510/16 130010/25 1297 45610/26 2787 60910/28 75311/04 300111/07 206611/09 192911/12 285311/13 2103 104911/17 307411/18 440711/26 5755 359612/02 516512/07 798712/11 684812/15 5126
12/19 3523 434012/27 765912/28 370001/03 6163 845701/13 451901/14 855201/24 753301/31 4818 561402/06 735 272102/08 255202/14 1120 241802/16 46202/21 386 66502/26 8 36503/06 0 48
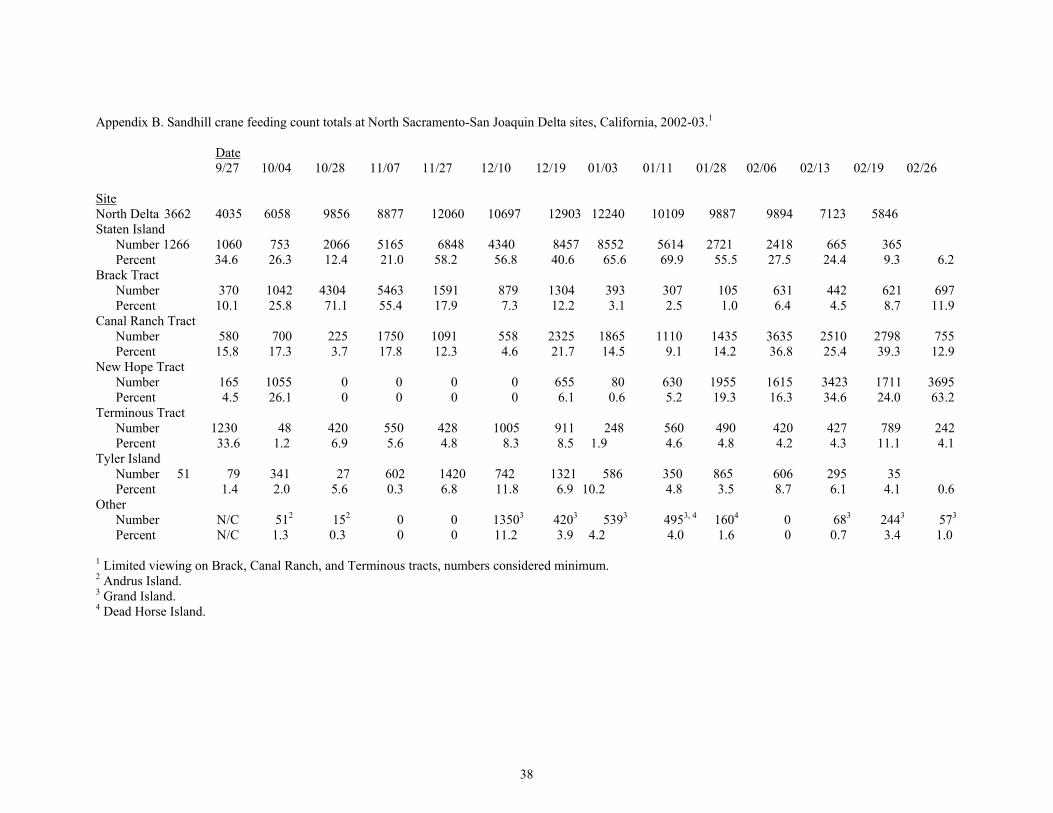
38
Appendix B. Sandhill crane feeding count totals at North Sacramento-San Joaquin Delta sites, California, 2002-03.1
Date 9/27 10/04 10/28 11/07 11/27 12/10 12/19 01/03 01/11 01/28 02/06 02/13 02/19 02/26
SiteNorth Delta 3662 4035 6058 9856 8877 12060 10697 12903 12240 10109 9887 9894 7123 5846Staten Island
Number 1266 1060 753 2066 5165 6848 4340 8457 8552 5614 2721 2418 665 365Percent 34.6 26.3 12.4 21.0 58.2 56.8 40.6 65.6 69.9 55.5 27.5 24.4 9.3 6.2
Brack TractNumber 370 1042 4304 5463 1591 879 1304 393 307 105 631 442 621 697Percent 10.1 25.8 71.1 55.4 17.9 7.3 12.2 3.1 2.5 1.0 6.4 4.5 8.7 11.9
Canal Ranch TractNumber 580 700 225 1750 1091 558 2325 1865 1110 1435 3635 2510 2798 755Percent 15.8 17.3 3.7 17.8 12.3 4.6 21.7 14.5 9.1 14.2 36.8 25.4 39.3 12.9
New Hope TractNumber 165 1055 0 0 0 0 655 80 630 1955 1615 3423 1711 3695Percent 4.5 26.1 0 0 0 0 6.1 0.6 5.2 19.3 16.3 34.6 24.0 63.2
Terminous TractNumber 1230 48 420 550 428 1005 911 248 560 490 420 427 789 242Percent 33.6 1.2 6.9 5.6 4.8 8.3 8.5 1.9 4.6 4.8 4.2 4.3 11.1 4.1
Tyler IslandNumber 51 79 341 27 602 1420 742 1321 586 350 865 606 295 35Percent 1.4 2.0 5.6 0.3 6.8 11.8 6.9 10.2 4.8 3.5 8.7 6.1 4.1 0.6
OtherNumber N/C 512 152 0 0 13503 4203 5393 4953, 4 1604 0 683 2443 573
Percent N/C 1.3 0.3 0 0 11.2 3.9 4.2 4.0 1.6 0 0.7 3.4 1.0
1 Limited viewing on Brack, Canal Ranch, and Terminous tracts, numbers considered minimum.2 Andrus Island.3 Grand Island.4 Dead Horse Island.

39
Appendix C. Historic numbers of cranes counted at the Sacramento-San Joaquin Delta, California, 1983-89, 1990-91, 1993, and 2000-01.
Date 11/03/831 11/15/851 12/10/851 01/23/861 11/21/861 01/16/871 01/24/891 11/21/902 12/13/902 12/27/902 01/10/912 12/07/932 12/27/932 12/13/001 12/28/001 01/31/011
SiteDelta 3380 3083 4667 7265 6821 8290 5101 7225 4520 6048 13400 5600 17030 5926 11625 6595
N. Delta3 3265 3080 4588 7015 6821 8040 4863 7225 4505 6038 12335 51504 161505 5285 114686 64707
Staten IslandNumber 416 1200 1047 2210 1274 2795 616 1850 1330 670 2000 4300 12000 2440 2767 3020Percent 12.8 39.0 22.8 31.5 18.7 34.8 12.7 25.6 29.5 11.1 16.2 83.5 74.3 46.2 24.1 46.7
Brack TractNumber 2201 1360 1197 3790 4852 1140 2708 5100 2810 5280 9440 0 2000 1555 4280 2800Percent 67.4 44.2 26.1 54.0 71.1 14.2 55.7 70.6 62.4 87.5 76.5 0 12.4 29.4 37.3 43.3
Canal Ranch TractNumber 648 500 1894 565 695 3580 825 N/C N/C N/C N/C N/C N/C 200 2295 0Percent 19.9 16.2 41.3 8.1 10.2 44.5 17.0 N/C N/C N/C N/C N/C N/C 3.8 20.0 0
Terminous TractNumber 0 0 0 (10)8 350 0 350 0 0 N/C N/C N/C 0 0 490 (510)8 1016 150Percent 0 0 0 5.0 0 4.4 0 0 N/C N/C N/C 0 0 9.3 8.9 2.3
Tyler IslandNumber 0 20 450 100 0 175 714 275 365 88 895 650 100 600 985 0Percent 0 0.7 9.8 1.4 0 2.2 14.7 3.8 8.1 1.5 7.3 12.6 0.6 11.4 8.6 0
South Delta9
Number 115 3 79 250 0 250 238 0 15 10 1065 450 880 641 157 125Percent 3.4 0.1 1.7 3.5 0 3.0 4.7 0 0.3 0.2 8.0 8.0 5.2 10.8 1.4 1.9
1 CDFG flights specifically for cranes.2 DU flights for waterfowl and cranes.3 “North Delta” is north of Highway 12 where most of the historic crane use area has been and can be more accurately compared to our surveys.4 Total includes 200 for New Hope Tract (3.9%).5 Total includes 2000 for New Hope Tract (12.4%) and 50 for Andrus Island (0.3%).6 Total includes 50 for New Hope Tract (0.4%) and 75 for Andrus Island (0.7%).7 Total includes 500 for New Hope Tract (7.7%).8 Numbers in parenthesis represent portion south of Highway 12.9 South of Highway 12, percentages are in comparison to entire Delta.


40
Appendix D. Identity of color-marked cranes at the North Sacramento-San Joaquin Delta, Stone Lakes NWR, and Cosumnes River Floodplain, California, 2002-03 (in order of datenoted).
BRACK TRACT STATEN ISLAND STONE LAKES NWR COSUMNES R. F. TYLER ISLAND CANAL RANCH T. NEW HOPE T. TERMIN. T. Crane Origin Crane Origin Crane Origin Crane Origin Crane Origin Crane Origin Crane Origin Crane Origin Oak MNWR 1997 Grinch MNWR 1995 P196 MDNWR 2001 P143 MDNWR 1992 Sam MNWR 1997 Madalen MNWR 1996 CJ30 AK 2001 A05 AK 2001 Sara MNWR 1997 Pam MNWR 1984 P114 MDNWR 1990 P114 MDNWR 1990 Marco MNWR 1997 Chip MNWR 1996 A01 AK 2001 A01 AK 2001 Sam MNWR 1997 P143 MDNWR 1992 P171 MDNWR 1997 P043 MDNWR 1986 Strugg MNWR 1996 Jackie MNWR 1982 Steve MNWR 1984 P155 MDNWR 1993 Poppy ??? P146 MDNWR 1992 Yoyd MNWR 1996 YB ??? Nancy MNWR 1984 P180 MDNWR 1998 P199 MDNWR 2002 A01 AK 2001 Attilla MNWR 1996 Lilly MNWR 1993 P197 MDNWR 2002 Jean-Claude MNWR 1995 Miles MNWR 1998 Bert MNWR 1993 Marco MNWR 1997 P183 MDNWR 1998 Gimpy ??? P076 MDNWR 1988 Lois MNWR 1984 Elmo MNWR 1993 P177 MDNWR 1998 Chernobyl ??? Elmo MNWR 1993 Jake II MNWR 1994 Logan MNWR 1993 P168 MDNWR 1997 Ben ??? P115 MDNWR 1990 Cal MNWR 1997 Jess MNWR 1993 P172 MDNWR 1997 P136 MDNWR 1992 Vidal CNWR 1999 Madalen MNWR 1996 Cal MNWR 1997 P199 MDNWR 2002 Picard MNWR 1997 Steve MNWR 1984 Tricia MNWR 1998 P103 MDNWR 1989 Finch ??? Clint MNWR 1984 Betsy SLWA 1995 P198 MDNWR 2002 Cortez SLWA ??? Rene MNWR 1983 Rod SLWA 2000 P101 MDNWR 1989 P101 MDNWR 1989 Tricia MNWR 1998 Junior SLWA 2002 Lucky ??? P198 MDNWR 2002 Chip MNWR 1996 Bernice MNWR 1995 Sunny ??? A06 AK 2001 Shark MNWR 1995 Geordie MNWR 1997 P095 MDNWR 1989 599-36547 ??? Yoyd MNWR 1996 Popeye MNWR 1993 P133 MDNWR 1992 P069 MDNWR 1988 Scooby MNWR 1994 Zorro MNWR 1984 P164 MDNWR 1994 P113 MDNWR 1990 Shaggy ??? Miles MNWR 1998 P102 MDNWR 1989 P028 MDNWR 1985 Iggy MNWR 1996 X38 MNWR 1984 P132 MDNWR 1992 Orville ??? Benson MNWR 1992 Iris MNWR 1996 P195 MDNWR 2000 P102 MDNWR 1989 Uno MNWR 1996 P043 MDNWR 1986 P174 MDNWR 1998 Sweetie MNWR 1987 Fiona MNWR 1996 P194 MDNWR 1999 Strugg MNWR 1996 A29 MNWR 1982 P189 ACWA 1994 Leslie MNWR 1983 P069 MDNWR 1988 P139 MDNWR 1992 CJ24 AK 2000 Domino CNWR 2000 Blue ??? Ron MNWR 1996 Rudy MNWR 1994 P190 ACWA 1994 Lydia MNWR 1996 Picard MNWR 1997 YY ??? Flip ??? CJ30 AK 2001 Troi MNWR 1997 A05 AK 2001 Squakie ??? Pam MNWR 1984 P076 MDNWR 1988 Zorro MNWR 1984 A01 AK 2001 Denise MNWR 1984 P146 MDNWR 1992 Cecil MNWR 1993 A06 AK 2001


41
Appendix D (con’t). Identity of color-marked cranes at the North San Joaquin Delta, Stone Lakes NWR, and Cosumnes River Floodplain, California, 2002-03.
BRACK TRACT STATEN ISLAND STONE LAKES NWR COSUMNES R. F. TYLER ISLAND CANAL RANCH T. NEW HOPE T. TERMIN. T. Crane Origin Crane Origin Crane Origin Crane Origin Crane Origin Crane Origin Crane Origin Crane Origin Popeye MNWR 1993 CJ30 AK 2001 Miles MNWR 1998 Rufous MNWR 1994 Rudy MNWR 1994 CJ24 AK 2000 Hugh MNWR 1996 Cecil MNWR 1993 Liz MNWR 1996 519-96643 ??? Logan MNWR 1993 P115 MDNWR
1990 Jess MNWR 1993 Chris MNWR 1983 Marco MNWR 1997 Chernobyl ??? Picard MNWR 1997 Vidal CNWR 1999 A06 AK 2001 A75 MNWR 1983 A14 AK 2002 599-01431 MNWR 1973Chernobyl ??? 48 47 28 22 10 4 2 1
TOTAL UNIQUE CRANES: 117
AK = Cook Inlet (2000 and 2001) or Bristol Bay (2002), Alaska.CNWR = Conboy NWR, south-central Washington.MDNWR = Modoc NWR, northeast California.MNWR = Malheur NWR, southeast Oregon.SLWA = Summer Lake WA, southeast Oregon.

42
APPENDIX E. WINTER RANGES OF COLOR-MARKED CRANESAT THE NORTH SACRAMENTO-SAN JOAQUIN DELTA
AND COSUMNES RIVER FLOODPLAIN, CALIFORNIA, 2002-03.
43
Appendix E. Winter ranges of color-marked cranes at the North Delta and Cosumnes River Floodplain, California, 2002-03.
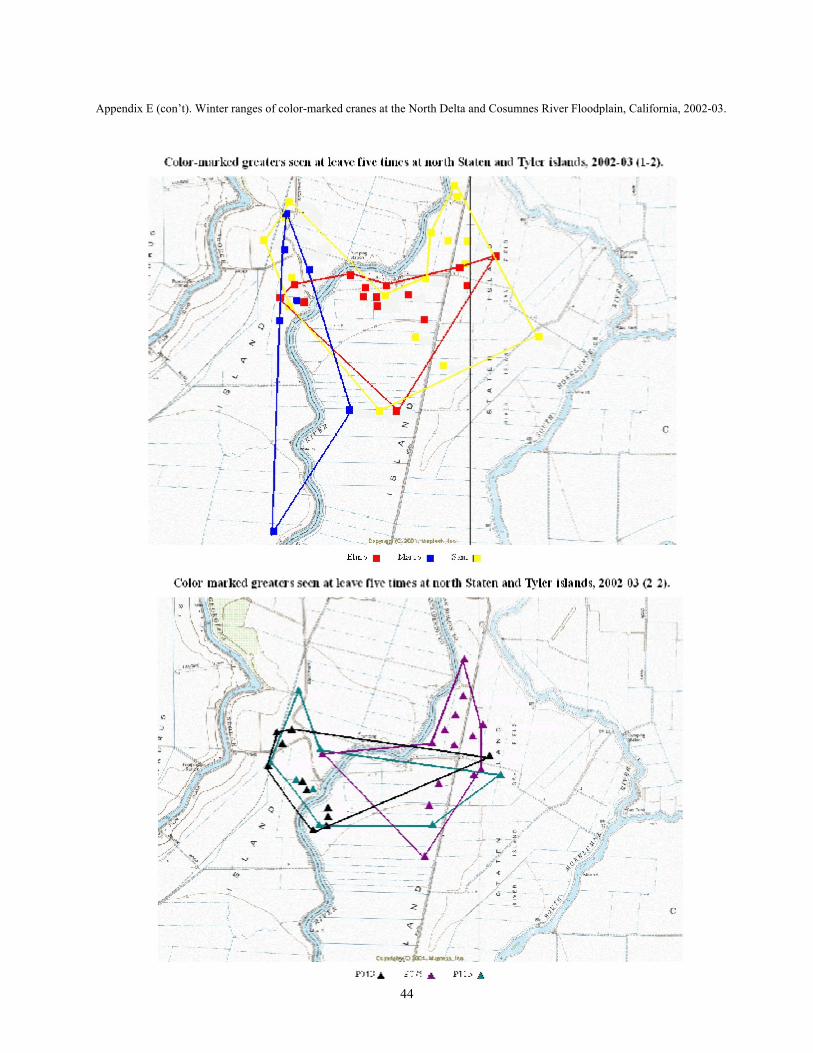
44
Appendix E (con’t). Winter ranges of color-marked cranes at the North Delta and Cosumnes River Floodplain, California, 2002-03.

45
Appendix E (con’t). Winter ranges of color-marked cranes at the North Delta and Cosumnes River Floodplain, California, 2002-03.

46
Appendix E (con’t). Winter ranges of color-marked cranes at the North Delta and Cosumnes River Floodplain, California, 2002-03.

47
Appendix E (con’t). Winter ranges of color-marked cranes at the North Delta and Cosumnes River Floodplain, California, 2002-03.

48
Appendix E (con’t ). Winter ranges of color-marked cranes at the North Delta and Cosumnes River Floodplain, California, 2002-03.

49
Appendix E (con’t). Winter ranges of color-marked cranes at the North Delta and Cosumnes River Floodplain, California, 2002-03.

50
Appendix E (con’t). Winter ranges of color-marked cranes at the North Delta and Cosumnes River Floodplain, California, 2002-03.

51
Appendix E (con’t). Winter ranges of color-marked cranes at the North Delta and Cosumnes River Floodplain, California, 2002-03.

52
Appendix F. Sandhill crane adult:colt ratios and recruitment at the North Sacramento-San Joaquin Delta, Cosumnes RiverFloodplain, and Stone Lakes NWR, California, 2002.1
Date > adult:colt < adult:colt
9/20 4:0
9/22 18:0 25:0
9/22 25:2 27:0
9/23 33:1
9/24 12:0
9/24 34:0 6:0
9/24 33:2 12:1
9/26 18:0 11:0
9/26 27:0 16:0
9/26 65:2 60:1
9/26 18:0 12:0
9/27 19:0 76:3 (1 T)
9/27 23:0 2:0
9/27 51:1 6:0
9/27 13:0
9/27 15:0 9:1
9/27 4:0
9/28 10:0 17:0
9/29 6:1
9/29 8:0
9/29 160:1 5:0
9/29 12:0
10/1 2 10:0
10/2 4:0
10/2 24:2 2:0
10/2 4:0
10/2 9:1
10/2 8:0
10/3 9:0 10:1
10/3 14:0 3:1
10/3 2:0
10/3
10/3
10:0
5:0 4:0
Date > adult:colt < adult:colt
10/3 15:0
10/3 155:0 5:3 (1 T)
10/4 2 2:0 7:1
10/4 2 9:0 15:2 (1 T)
10/4 5:1
10/4 7:0 3:0
10/5 2:0
10/5 111:0 47:3 (1 T)
10/5 22:1 8:0
10/5 350:2 290:8 (1 T)
10/5 19:0 21:0
10/5 2 17:0 26:3 (1 T)
10/5 2 6:0 7:2 (1 T)
10/7 2:0 49:3 (1 T)
10/7 2 19:0
10/7 2 2:0 258:7
10/7 84:4
10/7 115:9
10/7 2 10:0
10/7 2 8:0 25:0
10/7 2 12:0 15:0
10/7 61:9
10/7 2 6:0 46:2
10/8 2 9:1
10/8 10:0
10/8 4:2 (1 T) 6:0
10/8 2:0 20:1
10/8 19:0 15:0
10/8 17:1 6:0
10/8 19:0 6:0
10/10 2
10/10
10/10 2
40:2
3:1
9:0
Date > adult:colt < adult:colt
10/10 15:3 (1 (T)
10/10 8:4 (2 T)
10/10 114:3
10/10 2 23:2 21:1
10/10 2 22:1
10/10 2:0
10/10 47:5
10/10 2 71:5
10/11 8:0
10/11 6:0
10/11 11:1
10/11 9:0
10/11 7:0
10/11 6:0 4:0
10/11 34:0 3:0
10/11 4:0
10/11 2:0
10/12 120:14
10/12 28:0 37:4 (1 T)
10/13 79:9
10/14 2 29:0
10/14 7:1
10/14 2 6:2 9:2 (1 T)
10/14 2 10:2
10/14 4:0
10/14 2 10:0
10/14 2 6:0 10:4 (2 T)
10/14 2 4:0
10/14 2 44:4
10/14 2 7:1
10/14 33:5 (1 T)
10/14 2 38:0
10/15 45:0 15:0

53
Appendix F (con’t). Sandhill crane adult:colt ratios and recruitment at the North Sacramento-San Joaquin Delta, CosumnesRiver Floodplain, and Stone Lakes NWR, California, 2002.1
Date > adult:colt < adult:colt
10/15 5:1
10/16 20:1 3:0
10/16 8:0
10/16 14:1
10/16 17:1 3:0
10/16 14:0
10/16 12:0
10/16 56:1 2:0
10/16 4:0
10/16 6:0
10/16 7:1
10/16 41:0
10/16 8:0 2:0
10/16 8:0
10/16 6:2 (1 T)
10/16 4:0
10/16 85:5 3:1
10/17 2 34:4 37:5 (1 T)
10/19 3:1
10/20 18:0
10/20 126:2 29:2
Date > adult:colt < adult:colt
10/20 55:1 50:6
10/20 4:0 8:0
10/23 2 7:3 (1 T)
10/23 20:0
10/23 2 8:0 4:0
10/23 2 2:0 488:16 (2 T)
10/23 16:0
10/23 2 113:3 (1 T) 2:0
10/23 2 4:0
10/23 6:1
10/23 2 2:0 72:8 (1 T)
10/24 367:17
10/25 67:0
10/25 3:1
10/25 24:0 12:0
10/25 4:1
10/25 14:0 64:6 (1 T)
10/25 63:4 (1 T)
10/25 2 3:1
10/25 2 6:0 17:1
10/25 15:1
Date > adult:colt < adult:colt
10/25 25:0 2:0
10/25 3:0
10/25 20:0
10/25 19:0
10/26 5:1
10/26 47:0 92:10 (4 T)
10/26 3:1
10/26 24:2 59:12 (3 T)
10/26 27:0 4:2 (1 T)
10/26 58:3 (1 T) 9:2
10/26 92:13
10/28 6:0
10/28 11:0
10/28 21:2 (1 T)
10/28 14:0 5:0
10/29 22:2
10/29 7:1 5:0
10/29 14:0 17:4 (1 T)
10/29 12:1
10/29 2 9:2
10/31 69:8 (1 T)
10/31 2 12:0 3:1
1 T = Twins.
2 Cosumnes River Floodplain or
Stone Lakes NWR area.

54
Appendix G. Sandhill crane use-days for bi-weekly periods at Staten Island, San Joaquin County, California, 2002-03.
Date1
Habitat type2 9/18 10/02 10/16 10/30 11/13 11/27 12/11 12/25 01/08 01/22 02/05 02/19
Corn chopped Number Percent
1316 4.1
13640 37.9
24430 33.8
51114 67.1
50152 66.7
85680 71.6
64141 69.7
21060 58.7
5068 70.3
Corn disced Number Percent
10 0.2
585 5.3
174020.5
1036 3.3
1754 4.9
18 0.03
2422 2.6
1326 3.7
581 8.1
Corn flooded Number Percent
1322 11.9
2558 30.2
1432644.8
3000 8.3
13566 18.8
2922 3.8
3370 4.5
588 0.5
3269 3.6
66 0.2
14 0.2
Corn stubble Number Percent
1438 28.0
798 7.2
1582 2.2
6524 8.6
10692 14.2
18956 15.8
14105 15.3
10602 29.5
1547 21.5
Tomatoes flooded Number Percent
382 4.5
532 1.7
210 0.3
46 0.07
35 0.04
Tomatoes ripped Number Percent
168 0.2
112 0.1
126 0.1
28 0.1
Wetland flooded Number Percent
3546.9
1274 11.4
66 0.2
Wheat disc/ripped Number Percent
94818.4
42 0.4
323038.1
294 0.9
1078 3.0
4242 5.9
7164 9.4
3528 4.7
5432 4.5
4844 5.3
2198 6.1
Wheat disc/r/flood Number Percent
3914.3
1022 9.2
308 3.6
934 2.9
738 2.1
350 0.4
Wheat flooded Number Percent
92818.1
321728.9
14 0.2
10696 33.5
1984 5.5
514 0.7
Wheat new Number Percent
7742 21.5
20398 28.2
3896 5.1
5498 7.3
1680 1.4
2170 2.4
252 0.7
Wheat stubble Number Percent
54610.6
907 8.1
350 0.4
42 0.1
Dirt levee 3 Number Percent
2204.3
147813.3
144 1.7
1082 3.4
584 1.5
490 0.7
180.03
Main levee 3 Number Percent
150.3
6 0.1
10 0.1
1698 5.3
5092 14.1
7000 9.7
1316 1.7
1694 2.3
3724 3.1
399 0.4
308 0.9
Dirt road 3 Number Percent
67 0.6
98 1.2
18 0.1
392 0.6
2146 2.8
2240 1.9

55
Gravel road 3 Number Percent
2945.7
434 3.9
42 0.1
326 0.9
210 0.3
1316 1.1
168 0.2
10 0.03
1 First date of bi-weekly survey period. 2All crops were harvested except for wheat planted in November (wheat new). 3 Non-agriculture habitat.


![38 Wx•Nsaxw, Sandhill Crane in Michigan€¦ · 38 Wx•Nsaxw, Sandhill Crane in Michigan [Auk [Jan. SUMNER, ]•. Ie., JR. 1935. A life history study of the California quail, with](https://img.dokumen.tips/doc/110x75/5fbcd08c4820b03ba2147cdd/38-wxansaxw-sandhill-crane-in-michigan-38-wxansaxw-sandhill-crane-in-michigan.jpg)