Embed Size (px)
Citation preview
Sand Spring Advisors LLC
Time for the Rabbit Out of the Hat by, Barclay T. Leib April 30, 2005 I have been e-mailed and telephoned over the past few days by a variety of subscribers and market analysts calling for an immediate equity market crash event. One subscriber, for example, wrote that this weekend would be 55 days from the March 7th equity high, and that most historical crashes have accelerated lower after such a day count. Another analyst wrote me that he thought that they odds are now “100-1 against the March 7th highs being taken out at anytime over the next five years.” In this latter case, the analyst has done much cycle work all the way back to the crash of 1929 leading him to the conclusion that March 7th was an extremely significant turning point. Perhaps he is right, but tant pis (what a pity) that he missed telling me this definitively on that high. For our part, we do not quite see more extreme market ugliness transpiring right away – particularly as we now approach the May 11, 2005 PEI minor cycle turn date that we have previously suggested should reside near a market low. Instead, our gut and technical view of the world tells us that it is time for world political and economic leaders to pull some sort of “rabbit out of their hat” to create yet another “false glow” over the summer months – a postponement of sorts from any immediate financial market meltdown. But what “rabbit” could be produced?
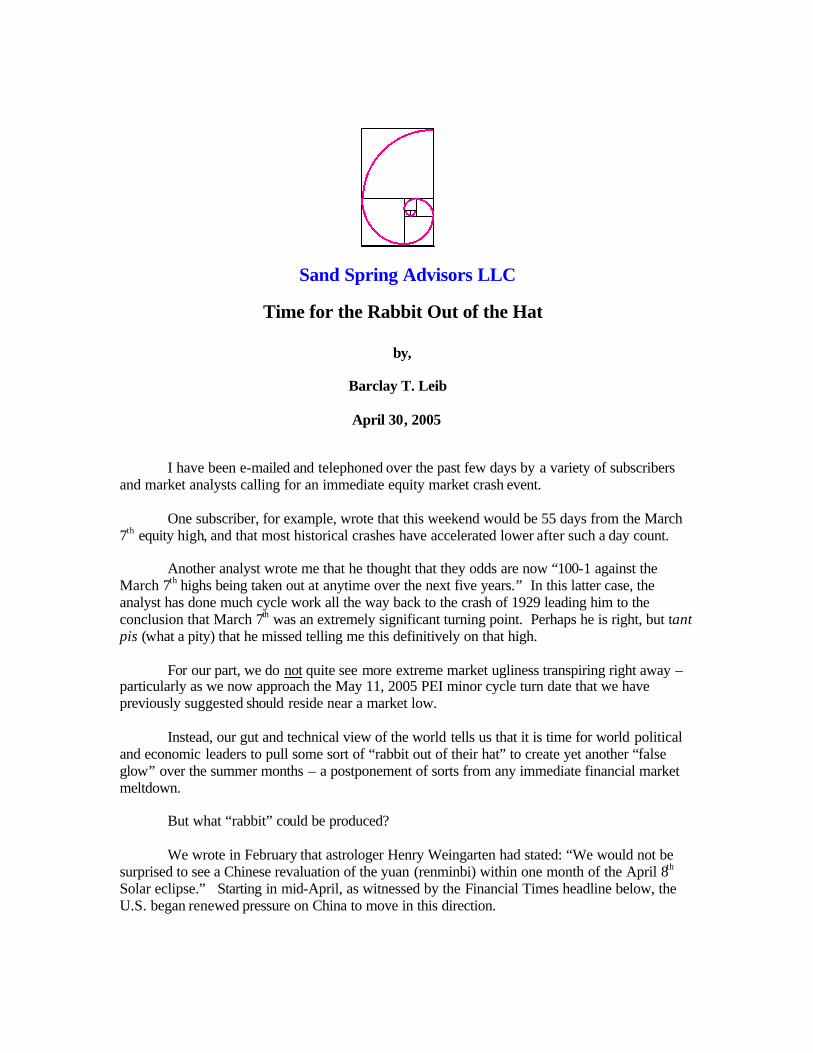
We wrote in February that astrologer Henry Weingarten had stated: “We would not be surprised to see a Chinese revaluation of the yuan (renminbi) within one month of the April 8th Solar eclipse.” Starting in mid-April, as witnessed by the Financial Times headline below, the U.S. began renewed pressure on China to move in this direction.
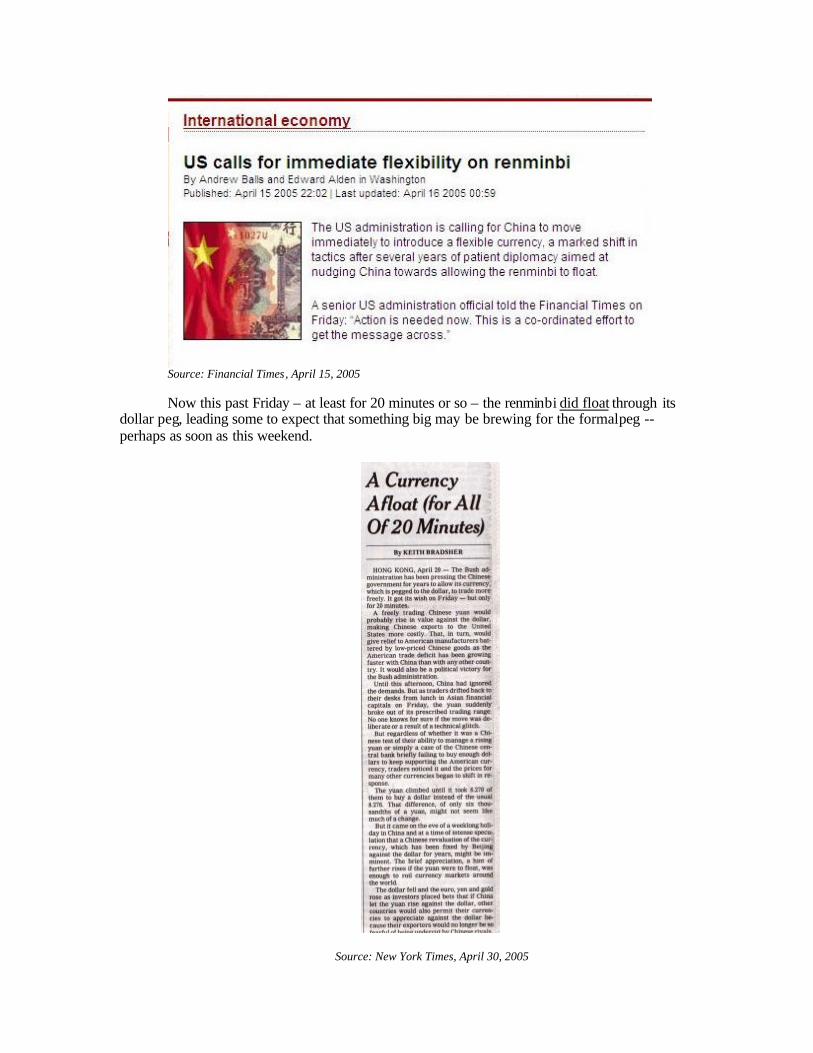
Source: Financial Times, April 15, 2005 Now this past Friday – at least for 20 minutes or so – the renminbi did float through its
dollar peg, leading some to expect that something big may be brewing for the formal peg -- perhaps as soon as this weekend.
Source: New York Times, April 30, 2005

Maybe something big on the renminbi peg is about to occur, or maybe not. But if the renminbi were to revalue, this would be viewed as a huge success for the Bush administration – something designed to help U.S. exports be more competitive in Asia, and bring the U.S. trade imbalance with that region back down. Whether such results actually end up occurring or not, a renminbi revaluation could psychologically be the trigger for a false sense of happiness and financial market relief.
Elsewhere, the capture of Musab Al-Zarqawi or Osama bin Laden could , of course, be
another obvious catalyst to make people celebrate. News reports say that the U.S. came close to capturing Al-Zarqawi a few weeks ago. Since that time, Al-Zarqawi-inspired car bomb attacks in Iraq have become more brazen and aggressive. One can sense that desperation and aggressiveness is building on both sides of this conflict. President Bush would certainly love to celebrate Memorial Day or the 4th of July with a prisoner like Al-Zarqawi in hand. Other reasons that we do not see an immediate meltdown in the markets revolve around sentiment and seasonal patterns. The cover picture below is from this weekend’s Barron’s. It shows a bull straining upside down to achieve a daunting pole vault , above which a huge banner headline asks: “Too High?” This made us remember back to the timing of an earlier Barron’s cover from June 2003 that showed a Bear with a bucket on its head. We believe that Barron’s covers of this nature should be faded – at least for a few months after they appear.
April 30, 2005 – Barron’s Cover

June 14, 2003 – Barron’s Cover
More specifically, after the above June 2003 cover, equities traded lower for two months into August 2003, and effectively ended up going sideways for 4 months into Oct 2003. Will the recent April 30, 2005 Barron’s cover making fun of the Bull hold the opposite consequences? Perhaps it will be an up-market for two months and net sideways for four? Another reason that we do not look for an immediate follow-through to the downside in the markets is the simple fact that historically very few major crashes ever occur at this time of year. April and May can often bring minor equity market weakness, but hardly ever a crash event. And the seasonal pull of the summer is of course typically higher.
It is only during the early fall months of September and October that more acute market stress seems to arrive. Perhaps sociologically, it is at this time of year that people become somewhat stressed by tuition and back-to school bills , September 15th estimated tax payments, and other late year pre-bonus cash flow constraints – forcing many to pull money from the market to fund such expenses. Or maybe it is as simple as the seasons of nature and the movement of our clocks: spring forward, fall back.
Whatever the case, the chart below shows the composite seasonal pattern of the DJIA
over the past 34 years (notably, not even including the October crash of 1929). It is also interesting how close this composite seasonal chart happens to fit the 2005 Bradley Siderograph shown under it. The words of Arch Crawford from earlier this year about a May 15th conjunction of some significance also remains in our head: “After this conjunction, the cycle is supposed to be up.”


Lastly, as referred to in our early April 2005 overview article of cycle behavior entitled Are Markets Cyclical? (written in “lay terms” for a hedge fund publication, but also posted within the subscriber area of the website), we are not entirely comfortable with the Fibonacci rhythm made by the DJIA into the March 7, 2005 high. Our Fibonacci bands would simply fit the DJIA price action much better if sometime on or before the next major 8.6-year PEI cycle date of February 27, 2007, the DJIA were to push higher and reach an upper range of 11325-11360 -- even if the DJIA is also destined to eventually reach a downside price range of 8,750-8,790. Should 11,345 or thereabouts be reached, it would make sense that an equivalent upside target of 1260-1265 on the S&P -- that we have long made note of as a possible “natural attractor” Fibonacci target -- would be reached at the same time.
In any case, our favored DJIA path both in terms of amplitude and timing now appears as follows:
The above chart – if it transpires as forecast – would represent a classic “broadening pattern” – a typical formation at significant market tops -- consistent with our view as well of

increasing equity market volatility to come. Such a view is also not entirely out of synch with our prior socionomic discussion of the high number of horror movies and their popularity in 2005. After a real plethora of horror movie releases this past spring, the next real cluster of horror movies will now only start in mid-August and then accelerate into the fall.
So call us penultimate contrarians. Now that everyone is starting to be nervous about the
financial markets, we still expect one or two more “hook moves” to hurt the new and old bears alike.
It is only during the Sep 2005 to Jan 2006 period where we see real danger of a large
equity market crash – with such occurring only after people have once again been lulled asleep by benign markets. By early September, people will psychologically be awaiting a strong Christmas-time rally. But in 2005, Santa Claus simply won’t appear. Instead, with the consumer increasingly tapped out, the proof will be in the pudding with poor Christmas charge card sales. Other Markets Before finishing this month’s market letter, a few other markets currently have interesting chart patterns that bear mentioning. Oil is currently in a steep slide, but our read of the chart below is that Crude is about to finish a C-wave within a sloppy and volatile 4th wave corrective period, with a 5th wave higher high yet to come. Specifically, a 5th wave high near $61.22 by late summer looks right to our Fibonacci eye, albeit renewed strength might persist into early 2006.

We do not want to get people into trouble attempting to “catch a falling knife” in Crude at present, but if basing action starts to transpire into our May 11, 2005 PEI date, crude could be an attractive speculative proposition on the long side yet again.
So too may gold where we still see an upside 2005 target for the metal near $475. In
terms of the weekly chart of the XAU Gold and Silver Index, we also see support currently building near 80.20. This emanates from three separate factors: significant trend line support, Fibonacci bands, and the 200-week moving average. If the 80.20 area holds – and it should – look for an upside target of 118.64 on the XAU by January 2006.
So overall, May 11, 2005 could easily bring a shift back to an earlier positive inflation
thematic – “Buy Assets! – Buy stocks, buy oil, but gold” (each occurring even as the property market is topping out as mortgages become more expensive). Then the future game plan as the year transpires will be: sell stocks first and go short again (by September 2005), sell oil next (maybe in September 2005, but possibly not until January 2006), and sell gold last (in January 2006).
It’s a tricky and increasingly volatile world at present, but let’s see how we do with these
several views.

All contents are Copyright © 2005 by Sand Spring Advisors, LLC, Morristown, NJ
Send us your comments at [email protected]. AN IMPORTANT DISCLOSURE Sand Spring Advisors provides information and analysis from sources and using methods it believes reliable, but cannot accept responsibility for any trading losses that may be incurred as a result of our analysis. Our advice should be deemed our personal opinion and not a recommendation to invest. Individuals should consult with their broker and personal financial advisors before engaging in any trading activities, and should always trade at a position size level well within their financial condition. Principals of Sand Spring Advisors may carry positions in securities or futures discussed, but as a matter of policy we will always so disclose this fact if it is indeed the case. We will also specifically not trade in any described security or futures for a period 5 business days prior to or subsequent to a commentary being released on a given security or futures contract.