Embed Size (px)
Citation preview

Sand Creek Watershed Project
Sand Creek Watershed Management Plan
Grand Val
Lower Gran
To integrate research, education, a
Prepared for ley Metropolitan Council as part of the
d River Watershed Project
nd outreach to enhance and preserve freshwater resources

Grand Valley Metropolitan Council 40 Pearl St NW, Suite 410 Grand Rapids, Michigan 49503 Phone: (616) 77-METRO (776-3876) Fax: (616) 774-9292 Annis Water Resources Institute Grand Valley State University Lake Michigan Center 740 West Shoreline Drive Muskegon, MI 49441 Phone: (616) 331-3749 Local: (231) 728-3601 Fax: (616) 331-3864 www.gvsu.edu/wri
This project has been funded wholly or in part by the United States Environmental Protection Agency under the assistance agreement to the Michigan Department of Environmental Quality. The contents of this document do not necessarily reflect the views and policies of the Environmental Protection Agency, nor does the mention of trade names or commercial products constitute endorsement or recommendation for use.

SAND CREEK WATERSHED PROJECT
SAND CREEK WATERSHED MANAGEMENT PLAN
MR-2003-113
Submitted by: Annis Water Resources Institute Grand Valley State University
740 West Shoreline Drive Muskegon, MI 49441

TABLE OF CONTENTS
CHAPTER 1 EXECUTIVE SUMMARY ................................................................................... 1 CHAPTER 2 INTRODUCTION ................................................................................................. 6 CHAPTER 3 DESCRIPTION OF WATERSHED...................................................................... 9 3.1 STUDY AREA ............................................................................................ 9 3.2 CLIMATE.................................................................................................... 9 3.3 PHYSIOGRAPHIC FEATURES .............................................................. 13 3.4 POPULATION........................................................................................... 24 3.5 LAND USE................................................................................................ 27 3.6 LOCAL WATERSHED AGENCIES AND INTEREST GROUPS.......... 32 CHAPTER 4 REPORTED CONDITION OF THE SAND CREEK WATERSHED ............... 34 4.1 CONDITIONS REPORTED IN PREVIOUS STUDIES........................... 34 4.2 CONDITIONS REPORTED IN CURRENT STUDIES ........................... 37 CHAPTER 5 DESIGNATED USES ......................................................................................... 46 5.1 DESIGNATED USES IN THE SAND CREEK WATERSHED .............. 46 5.2 PRIORITIZATION OF DESIGNATED USES......................................... 47 5.3 IMPAIRED DESIGNATED USES ........................................................... 47 5.4 IMPAIRMENTS TO DESIGNATED USES............................................. 48 CHAPTER 6 DESIRED USES.................................................................................................. 59 CHAPTER 7 WATER QUALITY GOALS .............................................................................. 60 7.1 GOALS AND OBJECTIVES .................................................................... 60 7.2 FINAL WATER QUALITY SUMMARY ................................................ 63 CHAPTER 8 CRITICAL AREAS............................................................................................. 64 CHAPTER 9 PROPOSED IMPLEMENTATION ACTIVITIES ............................................. 68 9.1 RECOMMENDATIONS ........................................................................... 68 9.2 TECHNICAL ASSISTANCE.................................................................... 68 CHAPTER 10 INFORMATION AND EDUCATION STRATEGY.......................................... 79 CHAPTER 11 METHODS OF MEASURING AND EVALUATING PROJECT..................... 86 11.1 PLANNING PHASE EVALUATION....................................................... 86 11.2 IMPLEMENTATION PHASE EVALUATION ....................................... 91 CHAPTER 12 SUSTAINABILITY............................................................................................. 92 GLOSSARY ............................................................................................................................. 95 BIBLIOGRAPHY.......................................................................................................................... 96 APPENDICES
I

FIGURES
FIGURE 1 STUDY AREA .................................................................................................... 11 FIGURE 2 SUBBASINS ....................................................................................................... 12 FIGURE 3 TOPOGRAPHIC RELIEF................................................................................... 15 FIGURE 4 TOPOGRAPHIC SLOPE .................................................................................... 16 FIGURE 5 SOIL TEXTURE ................................................................................................. 17 FIGURE 6 HYDROLOGIC SOIL GROUPS ........................................................................ 18 FIGURE 7 EROSION POTENTIAL (K)............................................................................... 19 FIGURE 8 PRIME FARMLAND SOILS.............................................................................. 20 FIGURE 9 SOILS SUITABLE FOR DEVELOPMENT....................................................... 21 FIGURE 10 POPULATION DENSITY .................................................................................. 25 FIGURE 11 POPULATION CHANGE................................................................................... 26 FIGURE 12 PRESETTLEMENT VEGETATION.................................................................. 28 FIGURE 13 LAND USE/COVER ........................................................................................... 29 FIGURE 14 NATIONAL WETLAND INVENTORY............................................................ 30 FIGURE 15 WETLAND RESOURCES.................................................................................. 31 FIGURE 16 AVERAGE MACROINVERTEBRATE SCORES IN SAND CREEK, 1993-2003 ............................................................................................................ 38 FIGURE 17 SAND CREEK AVERAGE WEEKLY WATER TEMPERATURE AND RANGE................................................................................................................ 43 FIGURE 18 MONITORING SITES........................................................................................ 57 FIGURE 19 CRITICAL AREAS............................................................................................. 67
II

TABLES
TABLE 1 TOWNSHIPS AND COUNTIES LOCATED WITHIN THE SAND CREEK WATERSHED......................................................................................... 9 TABLE 2 SOILS IN THE SAND CREEK WATERSHED................................................. 22 TABLE 3 LOCAL WATERSHED AGENCIES & INTEREST GROUPS ......................... 33 TABLE 4 DESIGNATED USES FOR SURFACE WATERS IN THE STATE OF MICHIGAN......................................................................................................... 46 TABLE 5 DESIGNATED USES OF THE SAND CREEK WATERSHED....................... 46 TABLE 6 PRIORITY OF DESIGNATED USES IN THE SAND CREEK WATERSHED..................................................................................................... 47 TABLE 7 MET, IMPAIRED, OR THREATENED DESIGNATED USES OF THE SAND CREEK WATERSHED........................................................................... 47 TABLE 8 SOURCES AND CAUSES OF POLLUTANTS AFFECTING DESIGNATED USES OF THE SAND CREEK WATERSHED....................... 49 TABLE 9 OPEN LEAKING UNDERGROUND STORAGE TANK SITES IN THE SAND CREEK WATERSHED .................................................................. 53 TABLE 10 PART 201 SITES OF ENVIRONMENTAL CONTAMINATION IN THE SAND CREEK WATERSHED .................................................................. 54 TABLE 11 SAND CREEK WATERSHED E.COLI DATA ................................................. 58 TABLE 12 DESIRED USES IN THE SAND CREEK WATERSHED ................................ 59 TABLE 13 SHORT TERM GOALS TO ENHANCE DESIRED USES OF THE SAND CREEK WATERSHED........................................................................... 59 TABLE 14 WATER QUALITY OBJECTIVES FOR THE SAND CREEK WATERSHED..................................................................................................... 61 TABLE 15 CRITICAL AREA RANKING SCORES FOR SUBBASINS IN THE SAND CREEK WATERSHED........................................................................... 66 TABLE 16 RECOMMENDED IMPLEMENTATION ACTIVITIES FOR THE SAND CREEK WATERSHED........................................................................... 69 TABLE 17 SCHEDULE, COST ESTIMATES, AND POTENTIAL PARTNERS FOR IMPLEMENTATION ACTIVITIES .......................................................... 74
III

TABLE 18 PLANNING PHASE EVALUATION TOOLS OPTIONS................................. 87 TABLE 19 POTENTIAL PROJECT EVALUATION QUESTIONS AND TOOL OPTIONS ............................................................................................................ 88 TABLE 20 EVALUATION TECHNIQUES FOR THE IMPLEMENTATION PHASE................................................................................................................. 91
IV

APPENDICES
APPENDIX A BIOLOGICAL ASSESSMENT OF SAND CREEK APPENDIX B ROAD STREAM CROSSINGS INVENTORY APPENDIX C HYDROLOGIC MODEL OF THE SAND CREEK WATERSHED APPENDIX D DATA RESULTS FROM THE WATER QUALITY ASSESSMENT OF THE SAND CREEK WATERSHED APPENDIX E I&E STRATEGY COMPONENTS
V

CHAPTER 1 EXECUTIVE SUMMARY
WATERSHED DESCRIPTION Sand Creek is a designated cold water stream, approximately 22 miles in length, and a tributary of the Grand River. It flows primarily southward from Section 35 of Chester Township to the Grand River, west of Grand Rapids. Approximately half the length of Sand Creek is a designated drain. The creek’s major tributary is the East Fork, which originates as the Laubach Inter County Drain in Section 11 of Wright Township. Several smaller tributaries and drains, approximately 23, also empty into it. The Sand Creek Watershed encompasses 55 square miles and covers parts of 4 townships, 1 city, and 2 counties: Alpine Township and the City of Walker of Kent County; and Chester, Wright, and Tallmadge Townships of Ottawa County. The watershed is mostly agricultural and includes a mix of forest, residential, and urban areas. The Village of Marne and the City of Walker are the only urban centers located within the watershed.
WATER QUALITY The Michigan Department of Environmental Quality (MDEQ) lists Sand Creek as having a poor fish community on its 303(d) non-attainment list. Section 303(d) of the federal Clean Water Act requires states to develop Total Maximum Daily Loads (TMDLs) for water bodies that are not meeting Water Quality Standards (WQS). After approval from the U.S. Environmental Protection Agency, the state will be required to take corrective action to meet WQS by 2006 for Sand Creek. Nine nonpoint source (NPS) pollutants have been identified as impairments or threats to the designated uses of the Sand Creek Watershed. Impacted designated uses include the cold water fishery, other aquatic life and wildlife, partial body contact recreation, and total body contact recreation. NPS pollutants were identified using past and current studies performed in the watershed. Sediment, nutrients, thermal pollution, changes in hydrology, hydrocarbons, and invasive/exotic plant species have been identified as known watershed pollutants. These pollutants are impairing the designated use of cold water fishery and threatening the other aquatic life and wildlife use. In addition, pathogens, hydrocarbons, and trash are known pollutants threatening the designated uses of total and partial body contact recreation. Toxic substances, such as Inorganic Contaminants, Synthetic Organic Contaminants (SOCs), and Volatile Organic Contaminants, are suspected of impacting all four designated uses. NPS pollutants of the Sand Creek Watershed result from improper land use practices and a lack of Best Management Practices. The greatest potential threat to the water quality of Sand Creek comes from the velocity, volume, and pollutant load of storm water runoff. Storm water runoff is suspected of contributing to the sedimentation, nutrient loading, thermal pollution, E.coli concentrations, and hydrocarbons of Sand Creek as well as its tributaries and drains. NPS pollutants include several sources of groundwater contamination. These sources include several Leaking Underground Storage Tank (LUST) sites and Part 201 sites of environmental contamination, including an abandoned landfill. The extent of impact on the stream’s water quality from any of these sites has not been determined. Inadequately maintained road/stream crossings and improperly managed storm water runoff contribute to the excessive erosion and sedimentation at several sites. Siltation is suspected of contributing significantly to the loss of habitat and fishery food sources. The MDEQ has noted that improper agricultural land use
1

practices and historical channelization activities of the upper watershed have contributed to the reduction in aquatic habitat for fish and macroinvertebrates.
PROJECT GOALS The goal of the Sand Creek Watershed Project is to improve and protect the designated uses of the watershed. In order to achieve this overall goal, and attain compliance with the TMDL established in Sand Creek, four goals have been established and prioritized. The primary goal of the Sand Creek Watershed Project is to restore or improve the cold water fishery. The secondary goal of the project is to protect and improve the habitats of native aquatic life and wildlife. Both goals can be achieved by reducing the amount of known pollutants affecting both of these uses. Pollutant reduction can be achieved through proper storm water management that would also serve to address harmful changes in the stream’s flow regime. The third goal of the project is to improve and protect partial body contact recreational uses, such as wading and fishing, by reducing pathogen concentrations, hydrocarbons, toxic substances, and trash. These four known and suspected pollutants also affect total body contact recreation uses, such as swimming. The fourth goal of the Sand Creek Watershed Project is to improve and protect this use. Best Management Practices (BMPs), land use policies, and Information and Education (I&E) activities will be needed to reduce known pollutants affecting these impaired and threatened uses. The following objectives have been identified to achieve the long-term goals established for the watershed: A. Objectives for reducing sediment pollution of the watershed: • Encourage and implement conservation and environmental farming practices • Encourage proper erosion and sediment control measures during construction • Encourage sediment control and better site selection for future access roads • Encourage proper maintenance at appropriate public access sites • Encourage proper use of motorized vehicles near stream banks • Exclude livestock access at impacted sites • Reduce harmful changes in hydrology • Minimize impact of discharge from outlets and drainage networks on stream bank and
reduce sediment load of storm water runoff • Encourage adequate erosion and sediment control measures at stream crossings • Treat and manage urban runoff • Evaluate log jams on a site by site basis
B. Objectives for reducing nutrient pollution of the watershed: • Discourage undesirable site selection for animal pastures • Exclude livestock access at impacted sites • Encourage proper manure management/application • Encourage proper pet waste disposal • Install and encourage conservation and environmental farming practices • Encourage proper fertilizer management and filter/buffer strip installation • Encourage proper installation, operation, and maintenance of septic systems • Encourage sanitary sewers in areas serviced by water utilities • Implement corrective actions for leaking wastewater treatment sites • Encourage proper composting procedures and curbside collections of yard and kitchen waste • Treat and manage urban runoff
2

C. Objectives for reducing thermal pollution of the watershed:
Replant and minimize the removal of the canopy on waterways and drainage networks • • • •
• • • • • • •
• •
• • •
• • • • •
•
• • • • • • •
Reduce impervious surfaces and effectively manage storm water runoff Discourage excessive agricultural water withdrawals Reduce sediment pollution
D. Objectives for reducing harmful changes in hydrology of the watershed:
Minimize future channelization of the creek/tributaries Manage outlet, drain, and tile discharge volume and speed more effectively Discourage excessive agricultural water withdrawals in the watershed Reduce impervious surfaces and effectively manage storm water runoff Allow for stream recovery and stabilization from impacts caused by dam failure Discourage future development and destructive manipulation of the floodplain Restore wetlands and discourage wetland drainage
E. Objectives for reducing hydrocarbon pollution of the watershed:
Treat and manage urban runoff Complete corrective actions for LUST sites and Part 201 sites of environmental contamination Encourage proper installation, operation, and maintenance of industrial equipment Properly dispose of inoperable/dismantled vehicles at unauthorized “junk yards” Increase knowledge about storm drains
F. Objectives for reducing toxic substance pollution of the watershed:
Identify and complete corrective actions for Part 201 sites of environmental contamination Encourage proper installation, operation, and maintenance of industrial equipment Complete corrective actions for abandoned landfill Determine if chloride levels exceed tolerance limits for aquatic life Encourage proper pesticide/herbicide management practices
G. Objectives for reducing harmful invasive/exotic plant species of the watershed:
Minimize spread of invasive/exotic species H. Objectives for reducing pathogen concentrations of the watershed:
Discourage undesirable site selection for animal pastures Exclude livestock access at impacted sites Encourage proper manure management/application Encourage proper pet waste disposal Encourage proper installation, operation, and maintenance of septic systems Encourage sanitary sewers in areas serviced by water utilities Implement corrective actions for leaking wastewater treatment sites
3
•
• •
Sample surface waters to determine if E. coli values exceed limits set for partial/total body contact recreation.
I. Objectives for reducing trash pollution of the watershed:
Educate residents on proper waste disposal Clean up impacted areas
RECOMMENDATIONS Structural, vegetative, and managerial Best Management Practices (BMPs), along with land use policy and Information and Education (I&E) recommendations, have been identified to treat, prevent, and reduce the NPS pollutants of the Sand Creek Watershed. The Sand Creek Watershed Partners and the Rural Subcommittee, in collaboration with the MDEQ and the Project Manager, selected and reviewed recommendations to meet the goals and objectives identified during this 319 project. Each recommendation addresses the sources and causes of a specific pollutant. Potential project partners, a timeline, and a cost estimate were identified for each recommendation. Increasing storm water runoff storage and treatment, implementing agricultural/urban Best Management Practices, and implementing I&E activities will be the most critical in reducing NPS pollutants and reaching project goals and objectives.
EVALUATION The planning phase of this project will be evaluated according to the following five project task categories: watershed assessment and characterization, I&E strategy, creation of a system of regional governance, BMP review process and recommendations, and project management. The project evaluation team will use the following evaluation tools during the review process to assess project tasks: observation, interviews, focus groups, surveys, and content analysis of project materials. During the implementation phase of this project, the success of recommended activities will be evaluated using a two-phase process: (1) that which will assess the effectiveness of I&E tools, and (2) an assessment of physical improvements. In both instances, a Steering Committee will be organized from watershed stakeholders, with the Sand Creek Watershed Partners being a logical source for membership. The Steering Committee will oversee all project activities and will be asked to measure the success of both I&E activities and physical improvements.
SUSTAINABILITY To ensure that the efforts and outcomes of this project, as well as other ongoing watershed projects in the Grand River Watershed, are more effectively coordinated and prioritized on a comprehensive watershed-wide basis, the Lower Grand River Watershed (LGRW) management plan is anticipating the creation of an ongoing Lower Grand River Watershed Organization. Through input of the Grand River Forum, the LGRW Steering Committee is forming a more comprehensive persisting organization to sustain the future value of this effort and to someday reach a long-term vision adopted for the entire LGRW. Such an organization can also coordinate with the Upper Grand River Watershed Project to ensure harmonization of similar efforts for the entire Grand River Basin.
4

The Sand Creek WMP will provide the Sand Creek Watershed Partners the details on how to implement recommendations to reach more immediate goals and objectives of the Sand Creek WMP and the longer range visions of the LGRW Management Plan. It is expected that through a new LGRW organization, these sub-basin recommendations will be extrapolated for use and adoption in other rural areas of the LGRW experiencing similar problems. Furthermore, this WMP will be the basis on which Phase II communities will write their Storm Water Pollution Prevention Initiative, which outlines implementation recommendations of the Sand Creek WMP.
5

CHAPTER 2 INTRODUCTION The water quality of Sand Creek and its tributaries is affected by many factors and only proper management of land activities will protect this valued resource. This document provides a description of watershed characteristics, identifies sources and causes of watershed pollutants, and makes recommendations as well as provides tools to treat, prevent, and reduce water pollution in the Sand Creek Watershed.
DEVELOPMENT OF THE SAND CREEK WATERSHED MANAGEMENT PLAN (WMP) The development of the Sand Creek WMP was facilitated through the Lower Grand River Watershed (LGRW) Project, funded by the U.S. Environment Protection Agency (EPA) through Section 319 of the Clean Water Act. This 319 grant was administered by the Michigan Department of Environmental Quality (MDEQ). The Grand Valley Metro Council (GVMC) was awarded the grant and consequently contracted with the Annis Water Resources Institute (AWRI) and Fishbeck, Thompson, Carr, & Huber Inc. (FTC&H). The Sand Creek Watershed was chosen for detailed study through the LGRW Project as a pilot project area. Due to the large size of the LGRW, pilot project areas were selected to represent the urban and rural issues of the area. The Buck Creek Watershed, Millennium Park Watershed, and Grand City Watershed were chosen as the urban pilot project areas while the Sand Creek Watershed was selected as a rural/developing pilot project area. The Sand Creek Watershed was chosen because of its strong local support, rural nature, and changing land uses due to urban development. It is expected that the rural subwatersheds in the LGRW will eventually face changing land uses due to growth and development. The Sand Creek Watershed will serve as a model on how to effectively accommodate urban land uses while preserving rural land uses. The product of this pilot project, the Sand Creek WMP, will provide detailed information regarding the sources, causes, and impacts of nonpoint source (NPS) pollutants that typically affect the designated uses of a rural watershed. The management plan will also include recommendations to treat, prevent, or reduce NPS pollution for rural areas.
PUBLIC PARTICIPATION PROCESS FOR DEVELOPING THE SAND CREEK WMP Grand River Forum meetings, held through the LGRW Project, offered the opportunity for public comment on the management of the LGRW project and its pilot project areas. Over fifty watershed stakeholders from the LGRW attended these public meetings. These meetings provided an opportunity for watershed residents, local decision makers, and watershed coordinators to share their concerns, offer solutions, and provide feedback regarding the management of the Lower Grand River and the pilot project areas. The greatest watershed concerns expressed by participants included impacts from development, bacteria levels, storm water management, sediment pollution, hydrology fluctuations, and wetland protection. Goals and desired uses of the LGRW included recreational use, desirable habitat, and educational opportunities. Participants listed the following steps to reach these goals: smart growth techniques, enforcement of existing regulations, installation of buffer strips, and public education. The Rural Subcommittee of the LGRW Project was formed to address not only the rural issues in the LGRW but also the rural issues of the Sand Creek Watershed. Members from the Grand River
6

Forum volunteered to serve on the Rural Subcommittee due to their interest in resource protection of rural areas. Members participated in developing the criteria necessary to select a rural pilot project area using the information contained within the Watershed Information Matrix (WIM). The WIM included information about every subwatershed in the LGRW regarding water quality, watershed planning, land use planning, local participation, and regional planning. Using these criteria, they selected three potential rural pilot project areas, which were brought to the steering committee to be discussed and voted on. After the Sand Creek Watershed was chosen, the planning process began. A physical inventory of the watershed was performed and a watershed tour was held to familiarize subcommittee members with the area and its watershed issues. The inventory was used, along with past watershed studies, to identify NPS pollutants. Subcommittee members participated in the review and identification of sources and causes of these watershed pollutants. They also worked in collaboration with the Technical and I&E Subcommittees to recommend Best Management Practices (BMPs), land use policies, and I&E activities to address watershed pollutants. The Sand Creek Watershed Partners, the local watershed organization for this subwatershed, was formed in February of 2002. The Partners have been involved with several watershed projects to date including two macroinvertebrate inventories, a road/stream crossings inventory, development of a hydrologic model, logo development, as well as development and distribution of several I&E materials. They meet monthly to “Work together to achieve and maintain desired water quality, stream stability, and biological integrity in Sand Creek to benefit current and future generations”. The project manager met with this group monthly to solicit their input during the development of the Sand Creek WMP. Similar to the Rural Subcommittee, the Partners reviewed sources and causes of NPS pollutants as well as recommended BMPs, land use policies, and I&E activities. In addition, they played a central role in the identification of specific pollution sites and selecting future implementation projects. The Sand Creek Watershed Partners, in collaboration with several project partners, will oversee the implementation of recommended BMPs, land use policies, and I&E activities identified during the planning phase of this 319 project. This 319 project and upcoming implementation activities will offer this group an opportunity to build on their past achievements and protect and restore the designated uses of the Sand Creek Watershed. In regard to the review of the Sand Creek WMP, additional public input was solicited from local units of government, state agencies, watershed residents, and pertinent organizations during a scheduled review held on December 2, 2003. The following organizations participated in the review process or provided comment at some point during WMP development: • Camp & Cruise • City of Walker • Department of Environmental Quality • Department of Natural Resources • Grand Valley State University, Biology Department • Herman Miller • Lion’s Club of Michigan • Michigan Department of Transportation • Natural Resources Conservation Service (NRCS) • Ottawa County Conservation District • Ottawa County Drain Commission • Ottawa County Health Department • Ottawa County Road Commission • Sand Creek Watershed Partners • Subcommittees of the Lower Grand River Watershed Project
7
• Tallmadge Township • Timberland RC&D • Watershed residents • West Michigan Environmental Action Council (WMEAC) • Wright Township
COORDINATION WITH LOWER GRAND RIVER WMP The Lower Grand River WMP will address the issues facing this watershed by building on existing efforts in the pilot project areas. The information collected and recommendations made for these areas will be used to address the rural and urban issues facing all subwatersheds of the LGRW. The Grand River Forum will oversee this effort to create a holistic, ecosystem approach to WMP development. They will provide guidance and recommendations for reaching that vision under which the entire watershed will operate. A future LGRW organization will emerge from the planning phase of this 319 project to oversee, guide, and recommend future watershed efforts and sustain the initiative that has been created. Grand River Forum meetings will continue to provide the opportunity for residents, local units of government, watershed coordinators, and other interested individuals to express their concerns and desires for the management of the LGRW. Specifically, the Sand Creek WMP will provide the details on how to implement recommendations to reach the overall goals and objectives of the LGRW Management Plan. The remedies for the impaired rural areas of the Sand Creek Watershed will provide opportunities for rural and developing areas to evaluate management measures used and determine which management measure would be best for their particular situation. The recommendations can be extrapolated to other rural areas of the LGRW experiencing similar problems.
8

CHAPTER 3 DESCRIPTION OF WATERSHED
3.1 STUDY AREA Sand Creek is a third order designated cold water stream approximately 22 miles in length (Figure 1). It begins in the east-central portion of Ottawa County, near Conklin, and has been designated as a trout stream by the Michigan Department of Natural Resources (MDNR 2000). The creek flows through Marne to its confluence with the Grand River, west of Grand Rapids. Approximately 23 streams, most of which are intermittent, and drains flow directly into Sand Creek. Its major tributary is the East Fork, which originates as the Laubach Inter County Drain in Section 11 of Wright Township. The Laubach Drain and the East Fork are 11.5 miles in length and empty into the creek in Section 2 of Tallmadge Township. The following smaller tributaries also flow into Sand Creek: Little Sand Creek, Sunset Creek, Mink Creek, and Wright Creek. The Sand Creek Watershed drains approximately 55 square miles and covers parts of 4 townships, 1 city, and 2 counties (Table 1). Fifteen subbasins were delineated within the watershed (Figure 2). The watershed itself is one of many subbasins of the Grand River Watershed, the largest watershed in Michigan. The northern portion is mostly agricultural while the southern portion is a mix of forested, residential, and agricultural areas. The Sand Creek Watershed contains several surface water bodies including: Reardon, Stafford, Carmody, Mud, Hopkins, and Round Lakes as well as Lake Jabocena and Mill Pond. The watershed is crossed by Interstate 96, as well as one railway, and contains 79 road/stream crossings. The Village of Marne and the City of Walker are the only urban centers located within the watershed. Other cities located nearby, but outside the watershed boundary, include Allendale, Coopersville, and Grand Rapids.
TABLE 1: TOWNSHIPS AND COUNTIES LOCATED WITHIN THE SAND CREEK WATERSHED
Township/City County Percentage of Watershed within Township Alpine Township Kent County 12 % Chester Township Ottawa County 3 % Tallmadge Township Ottawa County 32 % Walker, City of Kent County 8% Wright Township Ottawa County 45%
3.2 CLIMATE The Sand Creek Watershed is located in the Southwest Lower Climatic Division and is approximately 28 miles east of Lake Michigan. Lake Michigan and the prevailing westerly winds produce “lake effect” moderating temperatures throughout most of the year resulting in milder winters and cooler summers. This climate modification contributes to the diversified agriculture seen throughout western Michigan. Moderately warm temperatures dominate summers with a 1951-1980 average of only 12 days per year exceeding the 90°F mark. Prolonged periods of hot, humid weather or extreme cold are seldom experienced. The highest average monthly maximum temperature is 88.5°F while the lowest average monthly minimum temperature is 3.1°F. The average percent possible sunshine varies from 21% for December to 64% for July, and averages 46% annually. The prevailing wind blows in a southwesterly direction and averages about 10
9

mph. The 1 P.M. relative humidity averages 62% annually and varies from 53% for May to 75% for December (MDA 2003).
10

Figure 1: Study Area
11

Figure 2: Subbasins
12

3.3 PHYSIOGRAPHIC FEATURES Physiographic features of the Sand Creek Watershed are divided into three types: geology, topography, and soils.
GEOLOGY & TOPOGRAPHY Elevations within the Sand Creek Watershed vary from a low of approximately 590 feet near the stream’s confluence to a high of about 940 feet near 8th Ave and Harding Street in the northern portion of the watershed (Figure 3). Most of the watershed is composed of gently rolling hills. The majority of steeper slopes are located close to the creek at the southern end of the watershed (Figure 4). Stream valley character is primarily glacial and unconfined with channel flows unconfined in a relatively broad glacial-fluvial valley (MDNR 2000). Over 2/3 of the Sand Creek Watershed quaternary geology is made up of end moraines of fine-textured till (37%) and glacial outwash sand/gravel (38%). End moraines of fine-textured till are non-sorted glacial debris occurring in narrow linear belts marking former stillstands of ice-sheet margin. This also includes some small areas of ground moraine as well as outwash. Glacial outwash sand/gravel is a pale brown to pale reddish brown, fine to course sand, and well-stratified occurring as fluvial terraces along present and abandoned drainage ways. Also included in this category are a few narrow belts of Holocene alluvium occurring below outwash terraces alongside present streams (MDNR 1982).
SOILS A variety of different soils with many different properties make up the Sand Creek Watershed. Over 1/3 of the watershed consists of the Nester and Kawkawlin soil series. The Kawkawlin series consists of somewhat poorly drained soils that occur on uplands and till plains while the Nester series consists of well drained and moderately well drained soils that occur on uplands and along drainage ways on lake plains (NRCS-USDA 1972). Both series have a loamy texture and Nester has a clay loam texture in some areas. Soil textures of the Sand Creek Watershed are shown in Figure 5. Not only can soils be classified by soil texture but also by hydrologic soil groups. Hydrologic soil groups of the Sand Creek Watershed are shown in Figure 6. These groupings differentiate soils primarily based on infiltration rates in turn affecting runoff potential. Nearly half (46.3%) of the Sand Creek Watershed consists of Group C soils that have slow infiltration rates. Group B soils, soils having moderate infiltration rates, represents almost one quarter (21.3%) of the watershed. The soil series are also classified as hydric or non-hydric. Hydric soils are those that are saturated, flooded, or ponded long enough during the growing season to develop anaerobic conditions in the upper soil horizons. Hydric soils make up nearly 20% of the Sand Creek Watershed. Erosion potential for each soil series is shown in Figure 7. The K-value is a soil erodibility factor representing the susceptibility of erosion, with higher values meaning greater erosion potential. Soils high in clay have low K-values (0.5 – 0.15) and are resistant to detachment. Medium textured soils, such as loam and silt loam have much higher K-values (0.25 – 0.4), and soils with high percentages of silt have the highest K-values (greater than 0.4) (NRCS-USDA 2003). Over half (60.2%) of the watershed has a high erosion potential with K-values ranging from 0.3 – 0.43. Using soil information, maps were developed showing areas with prime farmland soils (Figure 8) and development limitations (Figure 9) of the Sand Creek Watershed. The U.S. Department of
13

Agriculture (USDA) Natural Resources Conservation Service (NRCS) defines prime farmland as land with the best combination of physical and chemical characteristics for producing crops. The NRCS-USDA has identified whether a soil series is prime farmland according to three different categories: 1.) Prime farmland 2.) Prime farmland only if drained, 3.) Not prime farmland if flooded more than occasionally during the growing season. Sand Creek Watershed contains nearly 60% of soils with prime farmland capabilities. Soils suitable for development were based on criteria developed by the USDA-NRCS. Builders have a need for soil information helping them determine what sites are suitable for homes and other commercial buildings. Drainage, permeability, slope, erosion hazard, stability, and frequency of flooding all have to be considered in determining the suitability of a site for development (NRCS-USDA 1972). The NRCS-USDA have taken these characteristics of soils and ranked each series as suitable, moderately suitable, or not suitable for development. Over 50% of the Sand Creek Watershed is not considered suitable for development. Table 2 provides the soil texture, hydrologic group, hydric information, and acreage for each soil series in the Sand Creek Watershed. Descriptions of each hydrologic group are provided below. Hydrologic Group A - (Low runoff potential) Soils having high infiltration rates even when thoroughly wetted and consisting chiefly of deep, well to excessively drained sands or gravels. Hydrologic Group B – Soils having moderate infiltration rates when thoroughly wetted. Hydrologic Group C – Soils having slow infiltration rates when thoroughly wetted. Hydrologic Group D – (High runoff potential) Soils having very slow infiltration rates when thoroughly wetted. Soils can be classified as two groups, such as D/A. The first group shown is the natural group that the soil series is usually classified under and the second group shown is the probable maximum improvement that can be made through artificial drainage, land use, or other factors.
14

Figure 3: Topographic Relief
15

Figure 4: Topographic Slope
16

Figure 5: Soils Textures
17

Figure 6: Hydrologic Soil Groups
18

Figure 7: Erosion Potential (K)
19

Figure 8: Prime Farmland Soils
20

Figure 9: Soils Suitable for Development
21

Soil Name Soil Texture Hydrologic Group Hydric AcresAdrian Muck D/A Y 127.07Adrian-Houghton Muck D/A Y 121.33Algansee Loamy Sand B Y 262.01Allendale Sandy Loam B N 75.02
Au Gres Loamy Sand Sandy Loam B N 39.30
Belding Sandy Loam B N 1037.00Belleville Loamy Sand D/B Y 15.06Bowers Loam C N 73.06Boyer Loamy Sand B N 29.60Breckenridge Sandy Loam D/B Y 144.53Brevort Sandy Loam D/B Y 124.34Bruce Loam D/B Y 234.11Capac Loam C N 1059.75Carlisle Muck D/A Y 766.54Ceresco Loam B Y 365.28Chelsea Loamy Sand A N 376.00Cohoctah Loam D/B Y 663.45Colwood Silt Loam D/B Y 8.24Croswell Sand A N 17.60Dumps Not Rated Not Rated Not Rated 14.786Edwards Muck D/B Y 71.140Fox Sandy Loam B N 189.85Gilford Sandy Loam D/B Y 145.58Gladwin Sandy Loam A N 504.41Glendora Sandy Loam D/A Y 302.43Glynwood Loam C N 3.35Granby Loamy Sand D/A Y 28.71Gravel Pits Not Rated Not Rated Not Rated 115.26Hettinger Loam D/C Y 841.97Houghton Muck D/A Y 268.22Iosco Loamy Sand B N 766.70Ithaca Loam C N 532.91Kalkaska Sand A N 12.85Kawkawlin Loam C N 4758.82Kibbie Loam B N 483.35Lacota Silt Loam D/B Y 299.53Linwood Muck D/A Y 10.29Made Land Not Rated Not Rated Not Rated 63.03Mancelona Loamy Sand A N 603.99Marlette Loam B N 1259.406Marsh Not Rated Not Rated Y 1.500Matherton Loam B N 401.76Menominee Loamy Sand A N 371.02Metamora Sandy Loam B N 124.40Metea Loamy Sand B N 75.17Montcalm Loamy Sand A N 1638.811Morley Loam C N 1.938Nester Loam, Clay Loam C N 7802.185Newaygo Sandy Loam B N 3.093
TABLE 2: SOILS IN THE SAND CREEK WATERSHED
22

Oakville Fine Sand A N 59.216Oshtemo Sandy Loam B N 626.87Owosso Sandy Loam B N 43.39Palms Muck D/A Y 29.50Parkhill Loam D/B Y 54.35Perrinton Loam C N 1909.88Pewamo Loam D/C Y 308.76Pinconning Loamy Sand D/B Y 18.91Pipestone Sand B N 28.06Plainfield Sand A N 1.256Richter Sandy Loam B N 298.639Rimer Loamy Fine Sand C N 15.65Rubicon Sand A N 605.03Saylesville Silt Loam C N 10.801Scalley Sandy Loam B N 35.937Selfridge Loamy Sand B N 85.16Selkirk Loam C N 19.40Shoals Loam C N 37.04Sims Loam D Y 851.60Sloan Loam D/B Y 260.65Spinks and Montcalm Loam Sand A N 135.39Spinks Loamy Sand A N 105.59Thetford Loamy Sand A N 49.85Tonkey Sandy Loam D/B Y 43.08Tuscola Fine Sandy Loam B N 7.89Ubly Sandy Loam B N 1202.432Udipsamments Not Rated Not Rated Not Rated 12.257Udorthents Loam Not Rated Not Rated 185.005Urban Land Not Rated Not Rated N 263.85Wallkill Silt Loam D/C Y 209.19Warners Muck D/C Y 23.40Wasepi Sandy Loam B N 18.83Woodbeck Silt Loam B N 19.60
TABLE 2: SOILS IN THE SAND CREEK WATERSHED CONT'D
23

3.4 POPULATION The total number of residents living in the Sand Creek Watershed is approximately 15,484 people. This is a high-end estimate calculated from the census 2000 data assuming uniform density across each incorporated township. The majority of the population resides in the lower portion of the Sand Creek Watershed. In the lower eastern portion, the City of Walker contains the most heavily populated region with an average of 391 to 868 people per square mile. Conversely, townships further from the City of Grand Rapids, in the upper region of the Sand Creek Watershed, are sparsely populated with only 0 to 91 people per square mile (Figure 10). The population in the Sand Creek Watershed is increasing but not uniformly according to the 1960 and 2000 census data. The eastern portion of the watershed is experiencing the greatest growth, which includes the City of Walker and Alpine Township (north of the City of Walker), at a 9.4 to 41.7 percent change. The extreme upper and most of the lower portions of the watershed are seeing a 0.1 to 9.3 percent change while the upper western region shows no overall change (Figure 11).
24

Figure 10: Population Density
25

Figure 11: Population Change
26

3.5 LAND USE Prior to widespread European settlement in the 1800’s, the dominant native vegetation of the Sand Creek Watershed was beech-sugar maple forest. Beech-sugar maple forest covered nearly all but the lower eastern portion of the watershed totaling 79 percent of the land area (Figure 12). The remaining presettlement vegetation consisted of forest and swamp land. White pine-mixed hardwood forests (5.3%) and mixed oak savanna (3.3%) primarily grew in the lower eastern portion of the watershed. Mixed hardwood swamps (8%) built up along the upper reaches and tributaries of Sand Creek. Other presettlement vegetation found scattered throughout the region included: mixed conifer swamp (2%), shrub swamp/emergent marsh (1.6%), cedar swamp (0.2%), lake/river (0.2%), and muskeg/bog (0.1%). The landscape has changed significantly since presettlement. The predominant land cover is now pasture/hay (40.5%) and row crops (36.3%), which uniformly cover the area (Figure 13). Hardwood and conifer forests (16.3%) along with wetlands (4%) speckle the region next to water sources. The remaining land cover consists of: low intensity residential (1.5%), commercial (0.9%), open water (0.3%), high intensity residential (0.1%), urban/recreational grasses (0.04%), quarries/strip mines/gravel pits (0.02%), and transitional (0.01%). Numerous wetland areas occur in the Sand Creek Watershed. These wetlands are broken down into specific types as classified by the National Wetland Inventory (Figure 14). Some of the wetland areas, particularly the forested wetlands, are not classified as wetlands in the land use categories above, hence discrepancies occur in the total percent of wetland areas between the two. According to the National Wetland Inventory, the majority of the wetland areas are forested, covering 5.4% of the watershed. Emergent wetlands (3%) are found away from Sand Creek and up around the tributaries. The additional wetland areas consist of: scrub-shrub (1.1%), open water/unknown bottom (0.6%), and aquatic bed (0.03%). Figure 15 shows the categories of existing wetlands, similar to Figure 14, but also indicates areas for potential wetland restoration: areas with hydric soils and presettlement wetlands.
27

Figure 12: Presettlement Vegetation
28

Figure 13: Land Use/Cover
29

Figure 14: National Wetland Inventory
30

Figure 15: Wetland Resources
31

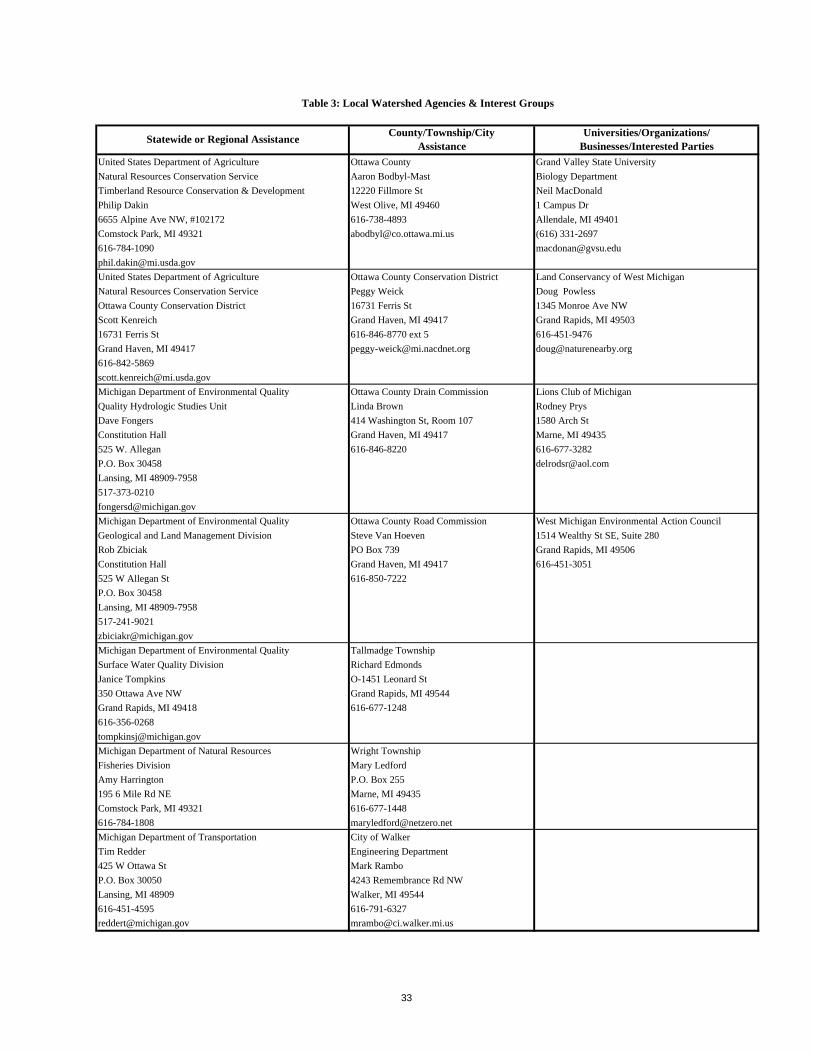
3.6 LOCAL WATERSHED AGENCIES AND INTEREST GROUPS The Sand Creek Watershed Project would not be possible without the involvement of local watershed agencies and interest groups. The following table includes those agencies and groups that are assisting in watershed activities (Table 3).
32
United States Department of Agriculture Ottawa County Grand Valley State UniversityNatural Resources Conservation Service Aaron Bodbyl-Mast Biology DepartmentTimberland Resource Conservation & Development 12220 Fillmore St Neil MacDonaldPhilip Dakin West Olive, MI 49460 1 Campus Dr6655 Alpine Ave NW, #102172 616-738-4893 Allendale, MI 49401Comstock Park, MI 49321 [email protected] (616) 331-2697616-784-1090 [email protected]@mi.usda.govUnited States Department of Agriculture Ottawa County Conservation District Land Conservancy of West Michigan Natural Resources Conservation Service Peggy Weick Doug PowlessOttawa County Conservation District 16731 Ferris St 1345 Monroe Ave NWScott Kenreich Grand Haven, MI 49417 Grand Rapids, MI 4950316731 Ferris St 616-846-8770 ext 5 616-451-9476Grand Haven, MI 49417 [email protected] [email protected]@mi.usda.govMichigan Department of Environmental Quality Ottawa County Drain Commission Lions Club of MichiganQuality Hydrologic Studies Unit Linda Brown Rodney PrysDave Fongers 414 Washington St, Room 107 1580 Arch StConstitution Hall Grand Haven, MI 49417 Marne, MI 49435525 W. Allegan 616-846-8220 616-677-3282P.O. Box 30458 [email protected], MI [email protected] Department of Environmental Quality Ottawa County Road Commission West Michigan Environmental Action CouncilGeological and Land Management Division Steve Van Hoeven 1514 Wealthy St SE, Suite 280Rob Zbiciak PO Box 739 Grand Rapids, MI 49506Constitution Hall Grand Haven, MI 49417 616-451-3051525 W Allegan St 616-850-7222P.O. Box 30458Lansing, MI [email protected] Department of Environmental Quality Tallmadge TownshipSurface Water Quality Division Richard EdmondsJanice Tompkins O-1451 Leonard St350 Ottawa Ave NW Grand Rapids, MI 49544Grand Rapids, MI 49418 [email protected] Department of Natural Resources Wright TownshipFisheries Division Mary LedfordAmy Harrington P.O. Box 255195 6 Mile Rd NE Marne, MI 49435Comstock Park, MI 49321 616-677-1448616-784-1808 [email protected] Department of Transportation City of WalkerTim Redder Engineering Department425 W Ottawa St Mark RamboP.O. Box 30050 4243 Remembrance Rd NWLansing, MI 48909 Walker, MI 49544616-451-4595 [email protected] [email protected]
Table 3: Local Watershed Agencies & Interest Groups
County/Township/CityAssistanceStatewide or Regional Assistance Universities/Organizations/
Businesses/Interested Parties
33

CHAPTER 4 REPORTED CONDITION OF THE SAND CREEK WATERSHED
The project manager, Sand Creek Watershed Partners, and Rural Subcommittee of the Lower Grand River Watershed Project evaluated past and current studies of the Sand Creek Watershed. This information was used to assess water quality and problematic locations within the watershed. These studies identify point source and NPS pollutants from agricultural, residential, urban, and industrial areas of the watershed. NPS pollution refers to pollution that originates from sources that cannot be defined as discrete points, such as agricultural areas, residential lawns, and parking lots.
4.1 CONDITIONS REPORTED IN PREVIOUS STUDIES
MICHIGAN RIVERS INVENTORY According to the Michigan Rivers Inventory (MRI) database, Sand Creek is groundwater driven, with very high baseflow. The water chemistry is eutrophic with moderate to high nutrients. Slopes are low, roughly 4-10 ft/mile. Water temperature is predicted as cool (19-22 °C), on average, with moderate variation (6-11°C), based on July temperatures. However, according to the categories used in the model, thermometers placed in Sand Creek by AWRI staff reveal cold mean temperatures (14-19 °C) with low variation (2-6°C) for July of 2003 and cold to cool mean temperatures (14-22°C) with low variation (2-6°C) for August of 2003. Therefore, water temperatures in Sand Creek may be colder with less variation than predicted. Further studies would need to be performed to determine whether summer temperatures for 2003 were typical. The Michigan Rivers Inventory, which provided the above information, is a long-term, collaborative research effort established in 1988 by scientists from the Institute of Fisheries Research, Michigan Department of Natural Resources (IFR/MDNR) and the School of Natural Resources and Environment, University of Michigan (SNRE/UM). Initially a Dingell-Johnson funded inventory project directed by Dr. Paul Seelbach (MDNR) and Dr. Mike Wiley (SNRE/UM), the collaboration has grown to include active scientists from multiple research institutions. The MRI focuses on the development of: 1) a regional, spatially explicit, inventory framework; 2) collaboratively managed research database, and 3) scientific models and methods for studying the large-scale ecology of Michigan's rivers. The MRI database currently includes site and catchment-level data for 700+ study locations linked by an extensive geographic information system (GIS). This combination of a GIS and extensive field inventory database is designed to provide the ability to both describe and model key features of the biology, hydrology, and water quality of Michigan's major rivers systems.
MDEQ BIOLOGICAL ASSESSMENT The Great Lakes Environmental Assessment Section (GLEAS) of the MDEQ performed a biological assessment of Sand Creek on August 26, 1993 and September 16, 1996. The Surface Water Quality Division of the MDEQ requested the original survey in order to assess the potential impacts on the watershed from changing land uses and urbanization. The second survey was requested by The Land and Water Management Division (LWMD) to assess potential
34

impacts associated with illicit periodic water withdrawals by a private landowner for crop irrigation. Both surveys were performed according to the methods outlined in GLEAS Procedure No. 51 (MDEQ 1997) and results were reported in a May 2000 Staff Report (Appendix A). Biological assessments were performed at 3 locations during the 1993 survey, approximately 11, 5.5, and 3 miles upstream of the creek’s mouth and located at Arthur St., Lincoln St., and M-45 stream crossings. Two stream locations were sampled during the 1996 survey, one upstream (Cleveland St. crossing) and one downstream (Arthur St. crossing) of the illicit water withdrawal site. Evaluations of the fish community, macroinvertebrate communities, and aquatic habitat were performed for each location. Both surveys indicated that the upstream sites located at Cleveland and Arthur stream crossings were more degraded than the downstream sites located at Lincoln St. and M-45 crossings. GLEAS staff indicated that the degradation of the upstream locations was due to improper agricultural land use practices and historical channelization activities and contributed to the reduction in habitat for fish and aquatic macroinvertebrates. Staff suggested that these factors, mentioned above, contributed to the following conditions noted during the surveys: high levels of embeddedness and bottom deposition, channel/habitat homogeneity, reduction of sensitive species, and a general shift toward tolerant macroinvertebrate species. The dewatering of the stream channel for irrigation, which was occurring at the time, was also noted as a cause and the landowner was forced to install a weir to maintain baseflow conditions downstream. GLEAS staff indicated that the higher diversity of fish and macroinvertebrate species noted at the downstream locations was attributed to a more heterogeneous and stable stream channel, inputs from the East Fork and smaller tributaries, and a lack of historical channelization. Future survey activity was recommended to determine if the installation of the weir enabled the Arthur stream crossing to approach the higher water quality condition of the downstream sites.
AWRI ASSESSMENT OF WATER QUALITY AND AQUATIC HABITAT The Annis Water Resources Institute (AWRI) completed a report in January of 1996 providing an overview of the Sand Creek Watershed, including recommendations for its protection and enhancement. This report was the result of the Grand River Watershed Project funded by the Grand Rapids Foundation, the W.K. Kellogg Foundation, and the Frey Foundation. Geologic, geographic, and demographic characteristics of the watershed were reviewed and water chemistry, habitat, and biota of Sand Creek were assessed. This information was used to describe current water quality conditions, existing problems, and possible threats to the watershed. In summary, AWRI project staff concluded that the water quality and aquatic habitat of Sand Creek was fair to poor, with fish and macorinvertebrate populations that suggested marginal to poor water quality. Nonpoint/point source pollution sites threatening the water quality of Sand Creek Watershed included the following: • Suburban Landfill (abandoned), • Leaking Underground Storage Tanks (LUSTs), • Several oil and gas drilling sites, • Wright Township Wastewater Storage Lagoon, • Aeration and seepage lagoon of the Alpine Meadows Mobile Home Park, and • Several additional sites of environmental contamination.
35

The extent of impact on the stream’s water quality from any of these sites had not yet been determined. Other NPS pollutants included increased amounts of silt and sand sediment in the stream channel. Inadequately maintained road/stream crossings were contributing to erosion and the sedimentation process at several sites. Siltation had contributed to the loss of habitat and fishery food sources. The greatest potential threat to water quality was indicated as rapid fluctuation in the stream’s hydrology that resulted from excessive precipitation runoff. These hydrologic changes typically resulted in increases in sedimentation and degradation of the benthos from storm water runoff. A strategy to improve the stream’s present water quality and reduce NPS pollution included both short and long term objectives. Short-term objectives included establishment and/or maintenance of riparian buffers, stabilization of stream channels, and improvement or proper maintenance of road/stream crossings. Also discussed were the environmental education and the implementation of proper chemical and waste management practices for agricultural landowners and homeowners. In addition, the creation of volunteer groups to monitor stream conditions and assist local officials in developing water quality protection measures was noted. Long-term objectives included the control of storm water runoff. Local units of government were encouraged to modify existing zoning ordinances and master plans, thereby incorporating watershede-wide pollution prevention practices and stewardship. It was suggested that implementing such management options would instill local ownership, involvement, and protection as well as maintain and enhance water quality of the Sand Creek Watershed.
TOTAL MAXIMUM DAILY LOADS The MDEQ is responsible for identifying water bodies within the state of Michigan that are not meeting Water Quality Standards (WQS). WQS are state rules established to protect surface waters of the state. Section 303(d) of the federal Clean Water Act and the U.S. Environmental Protection Agency (EPA) require states to develop Total Maximum Daily Loads (TMDL) for surface waters that do not meet WQS. A TMDL is used as a short hand acronym to describe the process used to determine how much of a pollutant load a waterbody can assimilate. To identify these waterbodies, a study is completed to determine the amount of a pollutant that can be put in a waterbody from point sources and nonpoint sources and still meet WQS, including a margin of safety. Waterbodies not meeting WQS are placed on the nonattainment list published as part of a 303(d) Report. After performing a biological community assessment of the fish community, the MDEQ rated the fish community of Sand Creek as poor from Wilson Road downstream to its confluence with the Grand River. Sand Creek was placed on the nonattainment list published as part of the 2002 303(d) Report (MI/DEQ/SWQ-02/013). To note, the specific pollutants, impairing the cold water fishery and exceeding WQS, and their TMDLs have not been determined. After approval from the US EPA, the state will be required to take corrective action to met WQS by 2006.
36

4.2 CONDITIONS REPORTED IN CURRENT STUDIES
MACROINVERTEBRATE INVENTORY Five macroinvertebrate inventories have been performed in the Sand Creek Watershed during 1993, 1994, 1996, 2002, and 2003 according to GLEAS Procedure No. 51 (MDEQ 1997). GLEAS staff performed the 1993 and 1996 inventories and Annis Water Resources Institute (AWRI) performed the 1994 inventory as noted in the above section. Dr. Neil MacDonald, professor at Grand Valley State University, led the 2002 and 2003 inventories with assistance from the Soil and Water Conservation Society of GVSU, AWRI staff, and watershed residents. The analysis of benthic macroinvertebrates provides an excellent tool for assessing the impact of aquatic pollutants. Different benthic invertebrate species have varying tolerances to chemical perturbations. Thus, by examining abundance and presence/absence of species within the community over broad areas, impact can be assessed. GLEAS Procedure No. 51 specifies that macroinvertebrates be collected from all habitats within a stream during a specified amount of time. This provides an assessment of macroinvertebrate health that subsequently will provide an indication of general water quality of the stream location. If a stream contains a good number of taxa that are sensitive as well as a good number that are tolerant to aquatic pollutants, good to excellent water quality is presumed for that area. As stream health deteriorates, pollution-sensitive organisms, such as mayflies, caddisflies, and stoneflies, will become rare or absent while more tolerant species become more common and fair to poor water quality is presumed. Pollution tolerant, intermediate and sensitive class scores were calculated for each sample location based on the macroinvertebrates collected. For each location, data from each study year were averaged to assess general water quality for each location between 1993 and 2003 (Figure 16). In general, upstream sample locations, north of Leonard St., reveal fair water quality while downstream sites demonstrated good water quality. According to a biological assessment performed by GLEAS staff, the aquatic habitat of the upstream locations is more degraded due to agricultural land use practices and historical channelization. Downstream locations receive additional water inputs from the East Fork and other tributaries, which may elevate the quality of water.
37

Figure 16: Average Macroinvertebrate Scores in Sand Creek, 1993-2003
0.0
10.0
20.0
30.0
40.0
50.0
60.0
Taft Arthur East Fork Lincoln Leonard M-45 Luce
Station Sampled
Stre
am Q
ualit
y Sc
ore
TolerantIntermediateSensitive
38

ROAD/STREAM CROSSINGS INVENTORY Herman Miller volunteers, with support from staff of the MDEQ, performed a road/stream crossings inventory during the fall of 2002. At each of the 79 road/stream crossings inventoried, information regarding the following was collected: • substrate composition, • river morphology, • physical appearance of stream, • instream cover, • stream corridor condition, • adjacent land uses, • road crossing information, • potential sources of pollution, and • background information including stream width, temperature, pH, and dissolved oxygen. Photo documentation was compiled for each site, as was a summary of inventory results. The inventory summary results were categorized into 5 subwatersheds: lower, mid-lower, mid-upper, upper, and East Fork subwatersheds. The full summary can be found in Appendix B. A brief summary of noted pollutants, impairments, and concerns is listed below. Specific locations of these concerns and subwatersheds can be found Appendix B. Lower Subwatershed: The majority of this stream stretch flows through Aman Park and the surrounding area remains relatively natural. • Failing septic systems were suspected • Landowner’s road may contribute additional runoff after road installation • MDOT barrels were noted in the stream • Michigan Department of Transportation (MDOT) project on M-45 was contributing sediment
to the creek • Old oil lines crossing the stream were noted and removal was recommended Mid-Lower Subwatershed: This stream section flows through a wooded and rural residential area south of Marne. • A large gully had formed from road runoff at the Leonard St. crossing • Containment tanks were noted in the creek creating a potential contamination problem • Fast moving green water was entering creek • Several riparian owners maintained their lawns up to the streambank leaving no stream buffer Mid-Upper Subwatershed: Tributaries in this subwatershed had very little water or were dry, yet high channel forming flows were evident. Land use was primarily agricultural in the northern portion and residential to urban in the southern half. • Bank erosion due to animal access was noted • Culvert contained stagnant water • Drainage pipes observed along with a substantial gully due to road runoff • Eroded area on both sides of culvert • Maintained lawns with no buffer • Parking lot runoff from boat storage site • Road runoff from downtown Marne drained directly to the creek
39

• Runoff from a dirt/gravel parking lot appeared to impact creek • Unknown tile discharging nutrient rich water was observed Upper Subwatershed: Many of the channels in this subwatershed are county drains and are maintained. Land use was mainly agricultural. There was evidence of high flows during rain events and culverts were designed for extreme volumes of water. • Gravel roads contribute sediment to the stream at stream crossings • Stream bank erosion due to animal access was noted • Nutrient input from agricultural runoff was impacting the creek • Excessive amounts of algae were observed at one stream stretch • Heavy impact from road runoff and from vehicle access areas at orchards • Intensive horse operation was contributing manure to creek • Extensively eroded road ditch contributing sediment pollution • Trash observed in creek • Cropland needed horizontal tilling • Undercut culvert • Tiles drained directly into stream • Culvert is 1/3 full of sediment. Considerable erosion on nearby hillside and road runoff
contributes sediment • Culvert dry and ½ full of sand • Two culverts filled with sediment • Crop fields needed larger buffer zones • Sheep allowed to drink from creek at five foot wide location • Road runoff flows directly to stream • Pipe, from adjacent field, drains directly to stream and water appears foamy and has a film
(not oil or bacteria) East Fork Subwatershed: Land use ranges from agricultural in the northern region to rural residential and slightly urban in the mid-section and rural residential to forested in the lower reaches. • Extensive channel erosion caused by high volumes of water was observed • Agricultural runoff was greater in the Laubach Inter County Drain indicated by a large
amount of vegetative matter • A possible septic system contamination was noted • Along with channel erosion, deep gullies from road runoff and residential runoff indicated
degrading sources • Installation of sewer main line at crossing causing a potential source issue • Residential maintained lawn with no buffer • Potential highway runoff (I-96) impacting stream • No geo-textile material placed to hold roadside vegetation after construction project • Several deteriorated culverts noticed • Raised septic system next to dry streambed observed • Significant aquatic plant growth noted • Grey water noted indicating possible septic system failure • High nutrient loading observed
40

PHYSICAL INVENTORY The Project Manager and a student assistant employed by the Annis Water Resources Institute performed a two-week physical inventory of Sand Creek in August 2003. Digital orthoquadrangle aerial photographic maps, downloaded from the US Geological Survey website, were used to walk the creek. The main body of Sand Creek was walked from approximately the Roosevelt Street stream crossing to the Luce Street crossing. A few stream stretches that flowed through heavily forested sections were not walked due to time constraints. The inventory was completed to assist the project manager in verifying suspected nonpoint source pollutants and identifying sites for implementation of Best Management Practices. Detailed field observations were taken at sites impacted and sites contributing to nonpoint source pollution. A final report of inventory findings will be completed by the Annis Water Resources Institute (AWRI) prior to July 2004 and will include a site description, photo documentation, possible landowner, date, and location of each site. A brief summary of noted pollutants, impairments, and concerns is listed below. • Scoured stream banks due to high flows • Duckweed and oil sheens was observed • Metal parts, plastics, pop cans, and numerous tires were noted throughout the creek • Sedimentation was noted • Many road stream crossings were contributing to sediment pollution • Storm water runoff had formed gullies, eroded stream banks, and added sediment pollution
to the creek • Many stretches with stream bank undercutting • Manure runoff from horse pastures/trail • Excessive vegetative matter noted in a few stream sections indicating nutrient inputs from
residential areas • Eroded banks/streambeds due to ORV and tractor traffic through creek • Several failed rip rap attempts by landowners to stabilize stream banks • ORV trails potentially contributing sediment to creek • Cow pastures near creek did not have a filter strips and may be contributing to manure
runoff issues • Discharge from several storm water outlets eroding stream banks and bringing sediment and
trash to creek • Lawns maintained up to stream bank by riparian owner reducing canopy cover • Nutrient runoff noted at one particular animal pasture location • Urban runoff flows directly to creek in Marne • Improperly maintained public access points contribute sediment to creek • Residential runoff has formed large gully and was eroding the stream bank • Invasive plant species crowding out native vegetation on stream bank
TEMPERATURE MONITORING During the months of July and August, water temperature data from Sand Creek were analyzed to determine the thermal conditions of six locations in the Sand Creek Watershed. Wehrly (2003) analyzed stream data from Michigan’s Lower Peninsula and determined habitat suitability for various aquatic species within different thermal regimes. Using this information, Sand Creek was studied to show whether its thermal conditions at six specific locations were suitable habitat for the Brown Trout and Mottled Sculpin known to be successfully established and reproduce naturally in its waters.
41

During the study, water temperature data were collected every two hours from five sites along Sand Creek and one site along the East Fork during the months of July and August. Using these data, the average weekly temperature and weekly temperature range was calculated for each site (Figure 17). According to Wehrly (2003), average temperatures and temperature ranges can be divided into a 3 × 3 matrix providing nine thermal categories. The thermal categories are defined as cold (<19°C), cool (19°C to <22°C), and warm (≥22°C) for average temperatures, and stable (<5°C), moderate (5°C to <10°C), and extreme (≥10°C) for temperature ranges. Using these thermal regimes, Wehrly (2003) determined which thermal regimes were suitable habitat for various species. For brown trout, the cold-moderate thermal category is optimal, and the cold-stable and cool-moderate thermal categories are suitable. For mottled sculpin, the cold-moderate thermal category is optimal, and the cold-stable and cool-moderate thermal categories are suitable. Using the temperature data plots from Sand Creek, the thermal conditions can be analyzed for the same species. In July of 2003, all six sites fell within the optimal or suitable thermal regimes for Brown Trout and Mottled Sculpin: cold-stable thermal regime and cold-moderate regime. In August of 2003, four of the sample sites moved into the cool-stable thermal category, which is not suitable habitat for these coldwater species according to Wehrly (2003). However, it should be noted that these sample sites do not necessarily represent their particular stream stretch or are utilized as habitats by Brown Trout or Mottled Sculpin. Furthermore, since Brown Trout are mobile they will move to more suitable sites when temperatures become intolerable. Sculpin, however, are not as mobile. Sites populated by Mottled Scuplin that experience temperature changes creating unsuitable conditions that will result in distress of this species. Based on these data, it is recommended that Sand Creek be monitored in the future to determine the locations of suitable and unsuitable thermal regimes. Sites deemed as suitable, but unpopulated by coldwater species, could be improved through habitat restoration, if appropriate. Furthermore, sites containing ideal habitat features but unpopulated with coldwater species, due to unsuitable thermal regimes, could be improved through Best Management Practices addressing the sources and causes of thermal pollution. Knowing the thermal conditions of Sand Creek and the habitat suitability within these thermal regimes for coldwater species will be a useful tool for assessing the state of the cold water fishery of the Sand Creek Watershed. Additionally, further monitoring would help determine if the water temperatures for the summer of 2003 are typical of the Sand Creek Watershed.
42

Figure 17: Sand Creek Average Weekly Water Temperature and Range
Cold: < 19oC Stable: < 5oCCool: 19oC to < 22oC Moderate: 5oC to < 10oCWarm: ≥ 22oC Extreme: ≥ 10oC
Thermal Categories
July
3
4
5
6
7
8
9
10
11
12
17 18 19 20 21 22 23 24
Average Weekly Temperature (oC)
Wee
kly
Tem
pera
ture
Ran
ge (o C
)
WarmCoolCold
Moderate
Extrem
eStable
August
3
4
5
6
7
8
9
10
11
12
17 18 19 20 21 22 23 24
Average Weekly Temperature (oC)
Wee
kly
Tem
pera
ture
Ran
ge (o C
)
WarmCoolCold
Moderate
Extrem
eStable
SitesSite A - Sand Creek at Arthur St.Site B - Sand Creek at Berlin Fair Dr.Site C - East Fork at 8th Ave.
Site D - Sand Creek at Leonard St.Site E - Sand Creek at Aman ParkSite F - Sand Creek at Luce St.
43

MDEQ HYDROLOGIC STUDY The Hydrologic Studies Unit (HSU) of the MDEQ has developed a hydrologic model of the Sand Creek Watershed (Appendix C). The hydrologic model was developed using the Hydrologic Engineering Center’s Hydrologic Modeling System (HEC-HMS). Watershed monitoring data collected from April 11, 2002 to July 16, 2002 and data collected after April 21, 2003 will be used to refine the model. The preliminary report was completed in June of 2003. The model was developed to determine the effect of land use changes in the watershed on Sand Creek’s flow regime and to provide design flows for stream bank stabilization management practices. It is suggested that the Sand Creek Watershed Partners, the local watershed group, and local communities use this information in the development of Best Management Practices and storm water ordinances. The hydrologic model has four scenarios corresponding to 1800, 1978, 1998, and build-out land uses. The build-out scenario was developed according to area zoning maps. Zoning maps did not designate wetland areas and this scenario is further subdivided to model the effect of preserving or eliminating wetland storage in the watershed. The model predicts, based on land use trends, increases in runoff volumes and peak flows from 1800 to 1978/1998 and from 1978/1998 to build-out for the 50%, 10%, and 4% chance 24-hour storm. The model predicts nearly identical flows for the 1978 to 1998 land use scenarios. Projected runoff volume and peak flow increases from the 10% and 4% chance 24-hour storms would serve to aggravate the existing flooding problems throughout the watershed. Only through proper storm water management practices can projected runoff volumes and peak flows be mitigated. The projected increases from the 50% chance (2 year), 24-hour storm will increase channel-forming flows. Stable streams with channel-forming flow usually have a 1-2 year recurrence interval. These relatively modest storm flows, due to their higher frequency, have more effect on channel form than extreme flood flows that is indicated by excessive erosion at many locations throughout a steam stretch. The projected increase in volume and peak flow would therefore further increase stream bank erosion already taking place in Sand Creek. Storm water management practices can help reduce projected channel-forming flow increases, however, it is suggested that channel-forming flow criteria be specifically considered so that selected practices be most effective. The proposed Kent County model storm water ordinance calls for a maximum release rate of 0.05 cubic feet per second per acre (cfs/acre) for runoff from the 50% chance, 24 hour storm for Zone A areas, the most environmentally sensitive of the three zones. Currently, the Sand Creek Watershed has an area-weighted average yield of 0.02 cfs/acre for this storm. After considering the model predictions, the Sand Creek Watershed Partners, the local watershed group, recommended a maximum release rate of 0.02 cfs/acre for runoff from the 50% chance, 24 hour storm for Zone A areas in the watershed. Currently eight subbasins have a higher yield: Sand Creek to State, Sand Creek to Wilson, Sand Creek Tributary to Leonard, East Fork lower, East Fork to Hayes, East Fork Tributary, East Fork Upper (Figure 2). The model ordinance also calls for a maximum release rate of 0.13 cfs/acre for the runoff from the 4 % chance, 24-hour storm for Zones A and B. Currently, the average yield from this storm for the Sand Creek Watershed is 0.09 cfs/acre. Nine subbasin have higher yields: Sand Creek Lower, Sand Creek to East Fork, Sand Creek to State, Sand Creek to Wilson, Sand Creek South Tributary, Sand Creek Tributary to Leonard, East Fork to Hayes, East Fork Tributary. The Sand
44

Creek Watershed Partners have not yet recommended a maximum release rate for runoff from the 4% chance, 24 hour storm for Zones A and B in the watershed.
45

CHAPTER 5 DESIGNATED USES
5.1 DESIGNATED USES IN THE SAND CREEK WATERSHED Designated uses are defined as recognized uses of water established by state and federal water quality programs. The State of Michigan states that all surface waters shall be designated and protected for eight specific uses according to R323.1100 of Part 4, Part 31 of PA 451, 1994, revised 4/2/99 (Table 4).
TABLE 4: DESIGNATED USES FOR SURFACE WATERS IN THE STATE OF MICHIGAN
Designated Use General Definition Agriculture Livestock watering, irrigation, and crop spraying Navigation Navigation of inland waters
Industrial water supply Water utilized in industrial or commercial applications
Public water supply at the point of water intake
Surface waters meet human cancer and noncancer values set for drinking water
Warm water or cold water fishery Supports warm water or cold water species
Other indigenous aquatic life and wildlife
Supports other indigenous animals, plants, and macroinvertebrates
Partial body contact recreation Supports boating, wading, fishing activities
Total body contact recreation Supports swimming activities between May 1 to October 31
It was determined by the project manager and the Sand Creek Watershed Partners that three of the eight designated uses established by the state were not current uses of the Sand Creek Watershed: 1) industrial water supply, 2) navigation, and 3) public water supply. The remaining five designated uses were determined to be designated uses of the Sand Creek Watershed (Table 5). Since Sand Creek is designated as a cold water stream (MDNR 2000), the cold water fishery use, rather then the warm water fishery use, is listed.
TABLE 5: DESIGNATED USES OF THE SAND CREEK WATERSHED
Designated Use General Definition Agriculture Livestock watering, irrigation, and crop spraying Cold water fishery Supports warm water or cold water species Other indigenous aquatic life and wildlife
Supports other indigenous animals, plants, and macroinvertebrates
Partial body contact recreation Supports boating, wading, fishing activities
Total body contact recreation Supports swimming activities between May 1 to October 31
46

5.2 PRIORITIZATION OF DESIGNATED USES After review of the impairments to the Sand Creek Watershed, the Sand Creek Watershed Partners decided on the priority ranking of designated uses shown in Table 6. The cold water fishery impaired use was deemed the highest priority while the other indigenous aquatic life and wildlife use was ranked as the second priority. Both uses were ranked at a higher priority level than the recreational uses for the reason that the improvement of these uses would result in the prevention and reduction of seven watershed pollutants rather than four. The cold water fishery use was selected as a higher priority due to the fact that fishing is the most popular use of the waterway. The partial body contact recreational use was ranked as the third priority above the total body contact recreational use. Because the watershed is used more frequently for partial body recreation, such as wading and fishing, this use took priority over total body contact recreation, such as swimming. Use of the watershed for agricultural purposes was ranked as the fifth priority.
TABLE 6: PRIORITY OF DESIGNATED USES IN THE SAND CREEK WATERSHED
Designated Use Priority Cold Water Fishery 1
Other Indigenous Aquatic Life and Wildlife 2 Partial Body Contact Recreation 3 Total Body Contact Recreation 4
Agriculture 5
5.3 IMPAIRED DESIGNATED USES Watershed pollutants have impaired or threatened four of the five designated uses of the Sand Creek Watershed (Table 7). The cold water fishery use is impaired while the following three designated uses are threatened: 1) other indigenous aquatic life and wildlife, 2) partial body contact recreation, and 3) total body contact recreation. The agricultural use is currently being met in the Sand Creek Watershed. Designated uses that are impacted by pollutant(s) that exceed Water Quality Standards (WQS) are said to be impaired. Designated uses that are threatened by pollutant(s) that currently meet WQS but may not in the future are said to be threatened. WQS are state rules established to protect public health and welfare, to enhance and maintain the quality of water, and to protect the state’s natural resources of the Great Lakes, the connecting waters, and all other surface waters of the state ( R323.1041 of Part 4 , Part 31 of PA 451, 1994, revised 4/2/99).
TABLE 7: MET, IMPAIRED OR THREATENED DESIGNATED USES OF THE SAND CREEK WATERSHED
Designated Use Designated Use Met, Impaired, or Threatened
Agriculture Met Cold Water fishery Impaired Other indigenous aquatic life and wildlife Threatened Partial body contact recreation Threatened Total body contact recreation Threatened
47

The cold water fishery use was determined as impaired because MDEQ determined Sand Creek was not meeting WQS set for its cold water fishery. After performing a biological community assessment of the fish community, the MDEQ rated the fish community of Sand Creek as poor from Wilson Road downstream to its confluence with the Grand River. Sand Creek was placed on the nonattainment list published as part of the 2002 303(d) Report (MI/DEQ/SWQ-02/013). To note, the specific pollutants impairing the cold water fishery and exceeding WQS have not been determined. After approval from the US Environmental Protection Agency, the state will be required to take corrective action to meet WQS by 2006. The two recreational uses and other indigenous aquatic life and wildlife use were determined to be threatened because although it is believed that these uses are threatened by watershed pollutants it has not been determined that these pollutants exceed WQS. Threatened designated uses were ascertained through DEQ water quality reports, field observations by the Project Manager, scientific experts, and members of the Sand Creek Watershed Partners.
5.4 IMPAIRMENTS TO DESIGNATED USES A number of watershed pollutants were identified as impairing or threatening the designated uses of the Sand Creek Watershed. Past watershed studies, current inventories, and personal communication with watershed stakeholders and scientific experts provided the necessary information to identify pollutants. These watershed pollutants, including their sources and causes, are listed in Table 8. These pollutants adversely, or have the potential to, affect the designated uses of the Sand Creek Watershed. Pollutants affecting each designated use were ranked according to the amount of degradation the pollutants were causing to surface waters. The prevalence of each pollutant was considered, and its weighted effects based on its toxicity were evaluated. Past studies, current inventories, as well as scientific experts and reports were consulted to determine the pollutant rankings. The ranking is displayed in Table 8. The certainty of a recorded pollutant in the watershed is also noted in Table 8. Pollutants, sources, and causes are listed as being either known, suspected, or potential. For example, hydrocarbons are listed as a known pollutant because the appearance of several oil sheens was observed during the physical inventory of Sand Creek in August of 2003. The presence of the oil sheens confirms hydrocarbons as a known pollutant. Additionally, if algal blooms were observed in the watershed then they would be a known source of nutrient pollution, however, if leaking septic systems were suspected as a source, but weren’t observed, this source would remain suspected. Footnotes within Table 8 indicate what information source was used to confirm whether a pollutant, and their sources and causes, was “known (k)”. It should be noted that Table 8 does not encompass all pollutants, sources, or causes and this list should be updated as more information is made available.
48

Des
igna
ted
Use
Pollu
tant
s/Im
pair
men
ts:
know
n (k
), su
spec
ted
(s),
pote
ntia
l (p)
(r
anki
ng in
clud
ed)
Sour
ces:
know
n (k
), su
spec
ted
(s),
pote
ntia
l (p)
(ran
king
incl
uded
)C
ause
s:kn
own
(k),
susp
ecte
d (s
), po
tent
ial (
p)O
bjec
tives
1. A
gric
ultu
ral R
unof
f (k)
1,2
Lack
of C
onse
rvat
ion
and
Envi
ronm
enta
l Far
min
g Pr
actic
es (k
) 1,2
Enco
urag
e an
d im
plem
ent c
onse
rvat
ion
and
envi
ronm
enta
l far
min
g pr
actic
es
5. C
onst
ruct
ion
Site
s (k)
1, 2
Impr
oper
Ero
sion
and
Sed
imen
t Con
trol M
easu
res (
k) 1,2
Enco
urag
e pr
oper
ero
sion
and
sedi
men
t con
trol m
easu
res d
urin
g co
nstru
ctio
n
6. U
npav
ed V
ehic
le A
cces
s Roa
ds (k
) 2U
se o
f San
dy G
rave
l Veh
icle
Acc
ess R
oads
(k) 2
Enco
urag
e se
dim
ent c
ontro
l and
bet
ter s
ite se
lect
ion
for f
utur
e ac
cess
road
s
Poor
ly M
aint
aine
d Pu
blic
Acc
ess A
reas
(k) 1
Enco
urag
e pr
oper
mai
nten
ance
at a
ppro
pria
te p
ublic
acc
ess s
ites
Mis
use
of M
otor
ized
Veh
icle
s (O
RV
/Tra
ctor
) (k)
1En
cour
age
prop
er u
se o
f mot
oriz
ed v
ehic
les n
ear s
tream
ban
ksU
nres
trict
ed L
ives
tock
Acc
ess (
k) 1,
2Ex
clud
e liv
esto
ck a
cces
s at i
mpa
cted
site
sH
arm
ful c
hang
es in
Hyd
rolo
gy (k
) 1,2,
4R
educ
e ha
rmfu
l cha
nges
in h
ydro
logy
Dis
char
ge fr
om S
torm
Wat
er O
utle
ts a
nd D
rain
age
Net
wor
ks (k
) 1,2
Min
imiz
e im
pact
of d
isch
arge
from
out
lets
and
dra
inag
e ne
twor
ks o
n st
ream
ban
k an
d re
duce
sedi
men
t loa
d of
stor
m w
ater
ru
noff
Log
jam
s (k)
1,2
Eval
uate
log
jam
s on
a si
te b
y si
te b
asis
3. R
oad/
Stre
am C
ross
ings
(k) 1,
2,4
Inad
equa
te E
rosi
on a
nd S
edim
ent C
ontro
l Mea
sure
s (k)
1,2
Enco
urag
e ad
equa
te e
rosi
on a
nd se
dim
ent c
ontro
l mea
sure
s at s
tream
cro
ssin
gs4.
Urb
an R
unof
f (k)
1,2
Unt
reat
ed U
rban
Run
off (
k) 1,
2Tr
eat a
nd m
anag
e ur
ban
runo
ffU
ndes
irabl
e Si
te S
elec
tion
for A
nim
al P
astu
res (
k) 1
Dis
cour
age
unde
sira
ble
site
sele
ctio
n fo
r ani
mal
pas
ture
sU
nres
trict
ed L
ives
tock
Acc
ess (
k) 1,
2Ex
clud
e liv
esto
ck a
cces
s at i
mpa
cted
site
sIm
prop
er M
anur
e M
anag
emen
t/App
licat
ion
(s)
Enco
urag
e pr
oper
man
ure
man
agem
ent/a
pplic
atio
nIm
prop
er D
ispo
sal o
f Pet
Was
te (s
)En
cour
age
prop
er p
et w
aste
dis
posa
l3.
Agr
icul
tura
l Run
off (
k) 1,
2La
ck o
f Con
serv
atio
n an
d En
viro
nmen
tal F
arm
ing
Prac
tices
(k) 1,2
Inst
all a
nd e
ncou
rage
con
serv
atio
n an
d en
viro
nmen
tal f
arm
ing
prac
tices
1.
Fer
tiliz
er R
unof
f (s)
Impr
oper
Fer
tiliz
er M
anag
emen
t (s)
Enco
urag
e pr
oper
ferti
lizer
man
agem
ent a
nd fi
lter/b
uffe
r stri
p in
stal
latio
n
4. F
ailin
g Se
ptic
Sys
tem
s (s)
Impr
oper
Inst
alla
tion,
Ope
ratio
n, o
r Mai
nten
ance
(s)
Enco
urag
e pr
oper
inst
alla
tion,
ope
ratio
n, a
nd m
aint
enan
ce o
f sep
tic sy
stem
sEn
cour
age
sani
tary
sew
ers i
n ar
eas s
ervi
ced
by w
ater
util
ities
7. W
aste
wat
er T
reat
men
t Site
s (s)
Impr
oper
Inst
alla
tion,
Ope
ratio
n, o
r Mai
nten
ance
(s)
Impl
emen
t cor
rect
ive
actio
ns fo
r lea
king
was
tew
ater
trea
tmen
t site
s6.
Yar
d an
d K
itche
n W
aste
Dum
ping
s (k)
1Im
prop
er W
aste
Dis
posa
l (k)
1En
cour
age
prop
er c
ompo
stin
g pr
oced
ures
and
cur
bsid
e co
llect
ions
of y
ard
and
kitc
hen
was
te5.
Urb
an R
unof
f (s)
Unt
reat
ed U
rban
Run
off (
s)Tr
eat a
nd m
anag
e ur
ban
runo
ff2.
Lac
k of
Stre
amsi
de C
anop
y (k
) 1, 2
Rem
oval
of C
anop
y on
Wat
erw
ays a
nd D
rain
age
Net
wor
ks (k
) 1, 2
Rep
lant
and
min
imiz
e th
e re
mov
al o
f the
can
opy
on w
ater
way
s and
dra
inag
e ne
twor
ks1.
Sto
rm W
ater
Run
off (
k) 1,
2Im
perv
ious
Sur
face
s (s)
Red
uce
impe
rvio
us su
rfac
es a
nd e
ffec
tivel
y m
anag
e st
orm
wat
er ru
noff
4. A
gric
ultu
ral W
ater
With
draw
als (
s)
Irrig
atio
n Pr
actic
es (s
) D
isco
urag
e ex
cess
ive
agric
ultu
ral w
ater
with
draw
als
3. S
edim
enta
tion
(s)
See
Cau
ses o
f Sed
imen
t Pol
lutio
nR
educ
e se
dim
ent p
ollu
tion
3. C
hann
eliz
atio
n (k
) 3A
gric
ultu
ral L
and
Use
Pra
ctic
es (k
) 1,2
Min
imiz
e fu
ture
cha
nnel
izat
ion
of th
e cr
eek/
tribu
tarie
s1.
Dis
char
ge fr
om S
torm
Wat
er O
utle
ts a
nd D
rain
age
Net
wor
ks (k
) 1,2
Agr
icul
ture
and
Urb
an L
and
Use
Pra
ctic
es (k
) 1,2
Man
age
outle
t, dr
ain,
and
tile
dis
char
ge v
olum
e an
d sp
eed
mor
e ef
fect
ivel
y
7. A
gric
ultu
ral W
ater
With
draw
als (
s)
Irrig
atio
n Pr
actic
es (s
) D
isco
urag
e ex
cess
ive
agric
ultu
ral w
ater
with
draw
als i
n th
e w
ater
shed
5. Im
perv
ious
Sur
face
s (s)
La
nd U
se C
hang
e (u
rban
izat
ion)
(k) 6
Red
uce
impe
rvio
us su
rfac
es a
nd e
ffec
tivel
y m
anag
e st
orm
wat
er ru
noff
6. F
aile
d D
am (k
) 7Fa
ilure
of R
oot D
am (k
) 1A
llow
for s
tream
reco
very
and
stab
iliza
tion
from
impa
cts c
ause
d by
dam
failu
re4.
Dis
conn
ectio
n/Fi
lling
of F
lood
plai
n (k
) 7U
ndes
irabl
e A
gric
ultu
ral a
nd U
rban
Lan
d U
se P
ract
ices
(k) 1
Dis
cour
age
futu
re d
evel
opm
ent a
nd d
estru
ctiv
e m
anip
ulat
ion
of th
e flo
odpl
ain
2. L
oss o
f Wet
land
s (k)
5D
rain
age/
Dep
ositi
on o
f Fill
Mat
eria
l to
Acc
omm
odat
e A
gric
ultu
re a
nd D
evel
opm
ent (
k)
1R
esto
re w
etla
nds a
nd d
isco
urag
e w
etla
nd d
rain
age
1. U
rban
Run
off (
k) 1
Unt
reat
ed R
unof
f fro
m G
as S
tatio
ns/P
arki
ng L
ots/
Roa
ds (k
) 1,2
Trea
t/man
age
urba
n ru
noff
Impr
oper
Was
te D
ispo
sal/S
pills
(s)
Com
plet
e co
rrec
tive
actio
ns fo
r LU
ST si
tes a
nd P
art 2
01 si
tes o
f env
ironm
enta
l con
tam
inat
ion
Impr
oper
Equ
ipm
ent I
nsta
llatio
n, O
pera
tion,
or M
aint
enan
ce (s
)En
cour
age
prop
er in
stal
latio
n, o
pera
tion,
and
mai
nten
ance
of i
ndus
trial
equ
ipm
ent
3. U
naut
horiz
ed Ju
nk Y
ards
(k)
Impr
oper
dis
posa
l of i
nope
rabl
e/ d
ism
antle
d ve
hicl
es (k
) 9Pr
oper
ly d
ispo
se o
f ino
pera
ble/
dism
antle
d ve
hicl
es a
t una
utho
rized
"ju
nk y
ards
"
4. Il
licit
Dum
ping
into
Sto
rm D
rain
s (s)
Lack
of K
now
ledg
e ab
out S
torm
Dra
ins (
s)In
crea
se k
now
ledg
e ab
out s
torm
dra
ins
Impr
oper
Was
te D
ispo
sal/S
pills
(s)
Com
plet
e co
rrec
tive
actio
ns fo
r Par
t 201
site
s of e
nviro
nmen
tal c
onta
min
atio
nIm
prop
er E
quip
men
t Ins
talla
tion,
Ope
ratio
n, o
r Mai
nten
ance
(s)
Enco
urag
e pr
oper
inst
alla
tion,
ope
ratio
n, a
nd m
aint
enan
ce o
f ind
ustri
al e
quip
men
t4.
Lan
dfill
Lea
chat
e (s
)Fa
ulty
Lan
dfill
Des
ign
(k) 4
Com
plet
e co
rrec
tive
actio
ns fo
r aba
ndon
ed la
ndfil
l3.
Roa
d Sa
lt R
unof
f (s)
Exce
ssiv
e A
pplic
atio
n (s
)D
eter
min
e if
chlo
ride
leve
ls e
xcee
d to
lera
nce
limits
for a
quat
ic li
fe1.
Agr
icul
tura
l Run
off (
s)Im
prop
er P
estic
ide/
Her
bici
de M
anag
emen
t (s)
Enco
urag
e pr
oper
pes
ticid
e/he
rbic
ide
man
agem
ent p
ract
ices
Purp
osef
ul/A
ccid
enta
l Hum
an In
trodu
ctio
ns (k
) 1
Win
d an
d A
nim
al D
ispe
rsio
n (s
)
2. S
tream
Ban
ks (k
) 1,2
TA
BL
E 8
: SO
UR
CE
S A
ND
CA
USE
S O
F PO
LL
UT
AN
TS
AFF
EC
TIN
G D
ESI
GN
AT
ED
USE
S O
F T
HE
SA
ND
CR
EE
K W
AT
ER
SHE
D
Col
d W
ater
Fis
hery
Oth
er In
dige
nous
A
quat
ic L
ife a
nd
Wild
life
1. S
edim
ent (
k) 1,
2,3,
8
4. H
arm
ful C
hang
es in
Hyd
rolo
gy (k
) 1,3,
4,7
Min
imiz
e sp
read
of i
nvas
ive/
exot
ics s
peci
es
2. In
dust
rial S
ites (
s)
5. H
ydro
carb
ons (
k) 1
2. In
dust
rial/F
uel S
tora
ge S
ites (
s)
1. M
aint
aine
d La
wns
and
Nat
ural
Are
as (k
) 1
3. T
herm
al P
ollu
tion
(k) 8
2. N
utrie
nts (
k) 1,
2,8
6. T
oxic
Sub
stan
ces (
s)(M
etal
s, B
rine/
Chl
orid
e, V
OC
s, SO
Cs,
etc.
)
7. In
vasi
ve/E
xotic
Pla
nt S
peci
es (k
) 1
2. A
nim
al W
aste
(k) 1,
2
49

Des
igna
ted
Use
Pollu
tant
s/Im
pair
men
ts:
know
n (k
), su
spec
ted
(s),
pote
ntia
l (p)
(r
anki
ng in
clud
ed)
Sour
ces:
know
n (k
), su
spec
ted
(s),
pote
ntia
l (p)
(ran
king
incl
uded
)C
ause
s:kn
own
(k),
susp
ecte
d (s
), po
tent
ial (
p)O
bjec
tives
TA
BL
E 8
: SO
UR
CE
S A
ND
CA
USE
S O
F PO
LL
UT
AN
TS
AFF
EC
TIN
G D
ESI
GN
AT
ED
USE
S O
F T
HE
SA
ND
CR
EE
K W
AT
ER
SHE
D
Und
esira
ble
Site
Sel
ectio
n fo
r Ani
mal
Pas
ture
s (k)
1D
isco
urag
e un
desi
rabl
e si
te se
lect
ion
for a
nim
al p
astu
res
Unr
estri
cted
Liv
esto
ck A
cces
s (k)
1, 2
Excl
ude
lives
tock
acc
ess a
t im
pact
ed si
tes
Impr
oper
Man
ure
Man
agem
ent/A
pplic
atio
n (s
)En
cour
age
prop
er m
anur
e m
anag
emen
t/app
licat
ion
Impr
oper
Dis
posa
l of P
et W
aste
(s)
Enco
urag
e pr
oper
pet
was
te d
ispo
sal
2. F
ailin
g Se
ptic
Sys
tem
s (s)
Impr
oper
Inst
alla
tion,
Ope
ratio
n, o
r Mai
nten
ance
(s)
Enco
urag
e pr
oper
inst
alla
tion,
ope
ratio
n, a
nd m
aint
enan
ce o
f sep
tic sy
stem
sEn
cour
age
sani
tary
sew
ers i
n ar
eas s
ervi
ced
by w
ater
util
ities
Impl
emen
t cor
rect
ive
actio
ns fo
r lea
king
was
tew
ater
trea
tmen
t site
s
Sam
ple
surf
ace
wat
ers t
o de
term
ine
if E.
col
i val
ues e
xcee
d lim
its se
t for
par
tial/t
otal
bod
y co
ntac
t rec
reat
ion
1. U
rban
Run
off (
k) 1
Unt
reat
ed R
unof
f fro
m G
as S
tatio
ns/P
arki
ng L
ots/
Roa
ds (k
) 1,2
Trea
t/man
age
urba
n ru
noff
Impr
oper
Was
te D
ispo
sal/S
pills
(s)
Com
plet
e co
rrec
tive
actio
ns fo
r LU
ST si
tes a
nd P
art 2
01 si
tes o
f env
ironm
enta
l con
tam
inat
ion
Impr
oper
Equ
ipm
ent I
nsta
llatio
n, O
pera
tion,
or M
aint
enan
ce (s
)En
cour
age
prop
er in
stal
latio
n, o
pera
tion,
and
mai
nten
ance
of i
ndus
trial
equ
ipm
ent
3. U
naut
horiz
ed Ju
nk Y
ards
(k)
Impr
oper
dis
posa
l of i
nope
rabl
e/ d
ism
antle
d ve
hicl
es (k
) 9Pr
oper
ly d
ispo
se o
f ino
pera
ble/
dism
antle
d ve
hicl
es a
t jun
k ya
rds
4. Il
licit
Dum
ping
into
Sto
rm D
rain
s (s)
Lack
of K
now
ledg
e ab
out S
torm
Dra
ins (
s)In
crea
se k
now
ledg
e ab
out s
torm
dra
ins
Impr
oper
Was
te D
ispo
sal/S
pills
(s)
Iden
tify
and
com
plet
e co
rrec
tive
actio
ns fo
r Par
t 201
site
s of e
nviro
nmen
tal c
onta
min
atio
nIm
prop
er E
quip
men
t Ins
talla
tion,
Ope
ratio
n, o
r Mai
nten
ance
(s)
Enco
urag
e pr
oper
inst
alla
tion,
ope
ratio
n, a
nd m
aint
enan
ce o
f ind
ustri
al e
quip
men
t4.
Lan
dfill
Lea
chat
e (s
)Fa
ulty
Lan
dfill
Des
ign
(k) 4
Com
plet
e co
rrec
tive
actio
ns fo
r aba
ndon
ed la
ndfil
l3.
Roa
d Sa
lt R
unof
f (s)
Exce
ssiv
e A
pplic
atio
n (s
)D
eter
min
e if
chlo
ride
leve
ls e
xcee
d to
lera
nce
limits
for a
quat
ic li
fe1.
Agr
icul
tura
l Run
off (
s)Im
prop
er P
estic
ide/
Her
bici
de M
anag
emen
t (s)
Enco
urag
e pr
oper
pes
ticid
e/he
rbic
ide
man
agem
ent p
ract
ices
2. C
omm
erci
al, R
esid
entia
l, an
d Pu
blic
Are
as (k
) 1, 2
1. R
oads
and
Par
king
Lot
s (k)
1
3. Il
licit
dum
ping
s (k)
1
Info
rmat
ion
Sour
ces:
1. O
bser
vatio
ns n
oted
by
staf
f of t
he A
nnis
Wat
er R
esou
rces
Inst
itute
. Aug
ust 2
003.
2. S
tream
Sur
vey
of S
and
Cre
ek. 2
002.
Per
form
ed b
y H
erm
an M
iller
Vol
unte
ers w
ill su
ppor
t fro
m th
e M
ichi
gan
Dep
artm
ent o
f Env
ironm
enta
l Qua
lity.
3. B
iolo
gica
l Ass
essm
ent o
f San
d C
reek
. GLE
AS
Surv
ey. M
ay 2
000.
4. A
n as
sess
men
t of W
ater
Qua
lity
and
Aqu
atic
hab
itat a
nd R
ecom
men
datio
ns fo
r the
Pro
tect
ion
and
Enha
ncem
ent o
f the
San
d C
reek
Wat
ersh
ed O
ttaw
a C
ount
y an
d K
ent C
ount
y, M
ichi
gan.
Ann
is W
ater
Res
ourc
es In
stitu
te o
f GV
SU. J
anua
ry 1
996.
5. W
etla
nd M
ap. A
WR
I. 20
03.
6. L
and
Use
Map
. AW
RI.
2003
.7.
Per
sona
l Com
mun
icat
ion
with
Dav
e Fo
nger
s of t
he M
ichi
gan
Dep
artm
ent o
f Env
ironm
enta
l Qua
lity.
Oct
ober
200
3.8.
Wat
er C
hem
istry
Mon
itorin
g St
udy
perf
orm
ed b
y th
e A
nnis
Wat
er R
esou
rces
Inst
itute
. 200
3.9.
Per
sona
l Com
mun
icat
ion
with
the
Sand
Cre
ek W
ater
shed
Par
tner
s. 20
03.
Prio
ritiz
atio
n M
etho
d:
The
obje
ctiv
es id
entif
ied
in T
able
8 w
ere
deriv
ed a
fter t
he e
xam
inat
ion
of p
ollu
tant
s, po
lluta
nt so
urce
s, an
d th
e ca
uses
for t
hose
pol
luta
nts i
mpa
ctin
g de
sign
ated
use
s. P
ollu
tant
s w
ere
prio
ritiz
ed b
y A
WR
I sta
ff in
Tab
le 8
bas
ed o
n th
e pr
eval
ence
and
sign
ifica
nce
of e
ach
pollu
tant
. Fo
r exa
mpl
e, se
dim
ent w
as o
bser
ved
by A
WR
I sta
ff o
n ev
ery
visi
t to
the
wat
ersh
ed, i
t is h
ighl
ight
ed b
y vo
lunt
eers
per
form
ing
stre
am su
rvey
s, it
is in
clud
ed a
s a p
ollu
tant
by
in th
e M
DEQ
GLE
AS
Surv
ey, a
nd is
furth
er d
ocum
ente
d by
wat
er c
hem
istry
m
onito
ring
data
pro
vide
d by
AW
RI.
Sed
imen
t is t
hus c
onsi
dere
d th
e hi
ghes
t prio
rity
with
rega
rd to
the
atta
inm
ent o
f the
des
igna
ted
use
of C
old
Wat
er F
ishe
ry a
nd O
ther
Indi
geno
us
Aqu
atic
Life
and
Wild
life.
Sou
rces
of p
ollu
tant
s wer
e al
so p
riorit
ized
by
AW
RI s
taff
and
incl
uded
in T
able
8 fo
llow
ing
exam
inat
ion
of e
vide
nce
prov
ided
, inp
ut fr
om st
akeh
olde
rs,
obse
rvat
ions
by
volu
ntee
rs, a
nd c
omm
ents
off
ered
by
the
Sand
Cre
ek W
ater
shed
Par
tner
s.
Tot
al B
ody
Con
tact
R
ecre
atio
nPa
rtia
l Bod
y C
onta
ct
Rec
reat
ion
Impr
oper
was
te d
ispo
sal (
k) 1, 2
Educ
ate
resi
dent
s on
prop
er w
aste
dis
posa
lC
lean
up
impa
cted
are
as
3. W
aste
wat
er T
reat
men
t Site
s (s)
Impr
oper
Inst
alla
tion,
Ope
ratio
n, o
r Mai
nten
ance
(s)
2. In
dust
rial/F
uel S
tora
ge S
ites (
s)
2. In
dust
rial S
ites (
s)3.
Tox
ic S
ubst
ance
s (s)
(Met
als,
Brin
e/C
hlor
ide,
VO
Cs,
SOC
s, et
c.)
4. T
rash
(k) 1,
2
1. P
atho
gens
(k) 8
2. H
ydro
carb
ons (
k) 1
1. A
nim
al W
aste
(k) 1,
2
50

The pollutants and impairments, noted above, in Table 8, as affecting the designated uses of the Sand Creek Watershed, are described below.
SEDIMENT Inorganic fine sediments are naturally present to some extent in all streams, but are considered pollutants at excessive levels. Precipitation, including secondary events such as floods and melting snow packs, will transport sediment from eroded uplands to nearby water bodies. In addition, channel movement will scour stream banks and streambeds and add additional amounts of inorganic sediment. Because storm events increase stream velocity, more sediment is added by channel movement during rainfall events. Sediment can be suspended, causing turbidity, or deposited on the streambed, causing a loss of benthic productivity and fish habitat. The deposit of an excessive amount of sediment in a stream will cover spawning habitat, clog fish gills, and generally degrade the aquatic habitat of fish and macroinvertebrate species. Human activities, related to agriculture, forestry, mining, and urban development, contribute excessive amounts of sediment that often overwhelms the “assimilative capacity” of a stream (Cairns 1977) and affects aquatic life. The biological assessment performed by GLEAS staff of the MDEQ on August 26, 1993 and September 16, 1996 noted high levels of embeddedness and bottom deposition in the upper watershed resulting from improper agricultural uses and historical channelization. Storm water runoff is suspected of carrying excessive amounts of sediment to Sand Creek and its tributaries from agricultural/urban areas, construction sites, vehicle access roads, stream banks, and road/stream crossings. Access of humans, livestock, and motorized vehicles has caused unstable and eroded stream banks. Discharge from storm water, drain tile, and ditch outlets has also eroded stream banks within the Sand Creek Watershed. Agricultural and urban runoff, especially at road stream crossings, also adds excessive amounts of sediment to Sand Creek and its tributaries.
NUTRIENTS Nutrients are compounds that stimulate plant growth, but at elevated levels are considered pollutants and an environmental concern. In fact, nutrients were rated as the second most important factor, next to siltation, adversely affecting the nation’s fishery habitat in streams (Judy et al. 1984). Excessive nutrients, carried by storm water runoff, can cause dense algal growths known as an algal bloom. After the elevated nutrient source has been depleted, the algal bloom will die and decompose, reducing dissolved oxygen (DO) levels. If DO levels reach levels intolerant to fish species, a fish kill may result. If DO levels are consistently low, a shift toward more tolerant aquatic species will arise reducing species diversity within the stream. Nitrogen and phosphorus have been identified as the two most common nutrients to enter surface waters. Polluted runoff can result from a variety of sources related to agricultural and urban land use practices. Known and suspected sources of nutrient inputs to Sand Creek and its tributaries include the following: animal waste, failing septic systems, wastewater treatment sites, yard and kitchen waste dumpings, and fertilizer runoff. It should be noted that Prein & Newoff has been hired to perform a hydrogeology study to assess environmental impacts from the leakage that was observed from the Wright Township Wastewater Storage Lagoon. Currently a lagoon closure plan is in place and the NPDES permit will expire April 1, 2004. The report on leakage impact on groundwater will be submitted January 1, 2004.
51

A water quality assessment performed by the Annis Water Resources Institute between the months of May and November of 2003 confirm that elevated levels of the following nutrients occurred periodically during the sampling period: soluble reactive phosphorus (SRP-P), total phosphorus (TP-P), ammonia (NH3-N), total Kjeldahl nitrogen (TKN-N), and nitrate (NO3-N). A complete nutrient data set is located in Appendix D. These compounds provide sources of nitrogen and phosphorus, which at elevated levels, have the potential to stimulate the growth of algal blooms. The decay of this growth can ultimately reduce dissolved oxygen and lead to fish kills within Sand Creek or its tributaries. Algal blooms were noted in Sand Creek during the road/stream inventory performed in the fall of 2002 and the physical inventory performed in the summer of 2003.
THERMAL POLLUTION Thermal pollution can result from the input of heated liquids from industrial discharges or hot impervious surfaces, such as parking lots, roads, or rooftops. A significant lack of streamside vegetation and ditching practices will also lead to thermal pollution due to direct exposure of surface waters to the sun. Dark sediment particles absorb heat and a significant reduction in water levels from water withdrawals will also cause a creek to be more easily heated by the sun. Thermal pollution is harmful to coldwater species such as rainbow and brown trout because it may lower the dissolved oxygen level beyond the species’ tolerance level. This occurs because warm water holds less dissolved oxygen than cold water. In Sand Creek, a lack of streamside canopy, storm water runoff, ditching and tiling, sedimentation, and agricultural water withdrawals are either known or suspected sources of thermal pollution to Sand Creek and its tributaries.
HYDROLOGY Harmful changes in a stream’s flow regime, such as increased peak flows and decreased attenuation, can increase sediment pollution, cause flooding, and damage aquatic habitat. Hydrology can be defined as the science of water, its properties, phenomena, and distribution over the earth's surface. The hydrologic cycle describes the movement of water cycling between the atmosphere and earth through the processes of condensation, precipitation, infiltration, runoff, and evaporation. Precipitation will infiltrate into the soil as groundwater or runoff the land into a nearby water body or waterway as surface water. Impervious surfaces, associated with urban development, and loss of wetlands disrupt this natural cycle. Storm water runoff that would normally infiltrate into the soil will runoff impervious surfaces and erode stream banks due to its greater force and may cause flooding due to its greater volume. Loss of wetlands further intensifies this situation due to the fact that loss of storage capacity will contribute to greater surface runoff volume. In the Sand Creek Watershed, increases in impervious surfaces, such as parking lots, roads, and rooftops, historical channelization, and the failure of Root Dam has led to increases in storm water runoff. This increase in storm water runoff, along with inputs from storm water, tile and ditch outlets, has yielded a greater volume and force of storm water into the creek and its tributaries. Destructive manipulation of the floodplain and loss of wetlands have decreased runoff storage during high flow events also contributing to a greater runoff volume. These land use practices have resulted in excessive stream bank erosion, several flooding events, and a greater addition of runoff pollutants to the creek and its tributaries. Excessive water withdrawals during base flow conditions also have the potential to create harmful changes in the creek’s flow regime. During the biological assessment of Sand Creek, GLEAS staff indicated that hydrologic
52

fluctuations negatively affected the fish and macroinvertebrate habitats of the Sand Creek Watershed. The hydrologic model of the watershed, developed by the Hydrologic Studies Unit (HSU) of the MDEQ, projected increases in storm water runoff volume and peak flows from the 1998 land use scenario to build-out conditions. The build-out scenario was based on existing zoning maps. Model predictions based on this land use change show significant increases in runoff volumes and peak flows for all three design storms: 50% chance, 10% chance, and the 4% chance, 24-hour storms. Peak flows and runoff volumes from the 50% chance, 24-hour storm are predicted to increase more, on a percentage basis, than flows from the 10% or 4% chance, 24-hour storm. The projected increases in runoff volumes and peak flows from the 50% chance storm would increase channel forming flow, which will increase stream bank erosion that is already reported as excessive within the watershed. In addition, projected increases in runoff volumes and peak flows from the 10% and 4% chance storms will aggravate existing flooding problems reported throughout the watershed.
HYDROCARBONS Hydrocarbons are defined as an organic compound (as acetylene or butane) containing only carbon and hydrogen and often occurring in petroleum, natural gas, coal, and bitumens. Oil sheens were noted on the stream banks of Sand Creek during the physical inventory performed in August of 2003. The presence of hydrocarbons is often the result of road runoff containing automotive petroleum products. It may also result from illicit dumping of used motor oil into storm drains. Industrial and fuel storage sites are also suspected of contributing hydrocarbons to surface and groundwater reserves of the Sand Creek Watershed. Two sites containing Leaking Underground Storage Tanks (LUSTs) have been reported by the MDEQ as open LUST sites (www.deq.state.mi.us/lustcs/). An identified open LUST site indicates that a release has occurred from one or more underground storage tanks and corrective actions have not been completed. The two open LUST sites identified in the Sand Creek Watershed are both located in Marne and combined account for 13 individual leaking storage tanks, 10 of which have been removed and 3 that are currently in use (Table 9). The 3 leaking tanks currently in use are located in Marne have a 15,000 gallon capacity each and are inevitably contaminating ground water reserves in close proximity to Sand Creek. The MDEQ has also identified a Tool and Die site impacted with cutting oil located in Walker (Table 10).
TABLE 9: OPEN LEAKING UNDERGROUND STORAGE TANK SITES IN THE SAND CREEK WATERHSED
Facility Name Facility Address
No. of leaking tanks in
use
No. of removed
tanks
Tank Capacity
(gal.)
Substance stored
Release Date
Marne Imperial #52*
14226 IRONWOOD DR MARNE, MI 49504 Phone#: (517) 773-9921
3 5 6000-15000 Gasoline 9-15-1999
Schneiders Shell
1460 Franklin St Marne, MI 49435 Phone#: (616) 677-1537
0 5 1000-4000 Gasoline and Diesel
12-16-1999
*Currently the Marathon Gas Station located on 8th Avenue and Ironwood Drive
TOXIC SUBSTANCES Toxic Substances can affect the reproductive health of aquatic life and may pose a health risk to recreational users who use a water body for partial/total body contact recreational uses or
53

consume its fish. The Michigan Department of Environmental Quality defines toxic substances as “a substance, except for heat, that is present in sufficient a concentration or quantity that is or may be harmful to plant life, animal life, or designated uses” (R 323.1044 1100 of Part 4, Part 31 of PA 451, 1994, revised 4/2/99). Toxic substances can include but are not limited to: Inorganic Contaminants, such as nitrate and lead; Synthetic Organic Contaminants (SOCs), such as pesticides and herbicides; Volatile Organic Contaminants (VOCs), such as xylenes, toluene, and benzene. These contaminants, mentioned above, are designated as drinking water contaminates by the Environmental Protection Agency (www.epa.gov/safewater/hfacts.html). Several toxic substances have been released into the Sand Creek Watershed as indicated by the Part 201 list produced by the MDEQ (Table 10). Unknown amounts of lead, an inorganic contaminant, and the following volatile organic contaminants were released in Marne or Walker between 1990 and 1997: Toluene, Benzene, Xylenes, Ethylbenzene, Trichloroethylene, Perchloroethylene, 1,1,1 Trichloroethane, Methyl ethyl ketone, and Methylene chloride. These contaminants are suspected of impacting groundwater after time of release. It is unknown but suspected that these formerly impacted groundwater plumes are impacting Sand Creek and its tributaries currently. To note, the unlined suburban sanitary landfill is abandoned and no effort has been initiated since 1990 to address contaminants. The landfill accepted primarily municipal waste but was suspected of accepting waste from plating, leather tanning, and industry (AWRI 1996). Agricultural runoff is suspected of adding pesticides and herbicides to surface waters via storm water runoff due to improper pesticide/herbicide management.
TABLE 10: PART 201 SITES OF ENVIRONMENTAL CONTAMINATION IN
THE SAND CREEK WATERSHED Site Name Site Address Pollutant (s) Score Score Date Status
1379 Comstock**
1379 Comstock Marne, MI 49435
Pb; T; B; X; E* 36 out of 48 01-06-1997 Interim response
in progress
H.B. Fuller Company
2727 Kinney Ave. NW Walker, MI 49544
1,1,1 TCA;* MEK;* Methylene chloride
40 out of 48 11-28-1995 Interim response in progress
Ranger Tool and Die Co.
2024 Kinney NW Walker, MI 49504 Cutting oil 19 out of 48 05-01-1991 Interim response
in progress
Suburban Sanitary Landfill
15342 24th Ave. Marne, MI 49435 Pb* 25 out of 48 11-14-1990
Inactive - no actions taken to address contamination
Walker Area Ground Water Contamination
Walker, Richmond, Kinney Walker, MI (T.7N.-R.12W-S.07)
TCE; PCE* 27 out of 48 09-03-1991
Interim response conducted – No further activities anticipated
*Pb = Lead; T = Toluene; B = Benzene; X = Xylenes; E = Ethylbenzene; TCE = Trichloroethylene; PCE = Perchloroethylene; 1,1,1 TCA = 1,1,1 Trichloroethane; MEK = Methyl ethyl ketone ** Currently Wolohan Lumber
INVASIVE/EXOTIC SPECIES Introduced species are referred to by a variety of names: invasive, nonnative, alien, exotic, or nonindigenous. Introduced species are those that evolved elsewhere and have been purposely or accidentally relocated. While some species have invaded habitats on their own (e.g., migrating wildlife, plants and animals rafting on floating debris), humans have dramatically increased the
54

diversity and scale of invasions by exotic species. Introduced species often find no natural enemies in their new habitat and therefore spread easily and quickly. Invasive plants can smother native vegetation as well as introduce diseases and parasites that can attack and eliminate dominant native plant species. According to the Nature Conservancy, invasive species have contributed to the decline of 46% of endangered species in the U.S. (http://nature.org/initiatives/invasivespecies/features/index.html). Common Periwinkle (Vinca minor L.) was identified by the Project Manager on a section of stream bank during the physical inventory of Sand Creek in August of 2003. Common Periwinkle is a perennial evergreen ground cover with thick glossy leaves and small blue flowers that occur indeterminately from April to September. The Nature Conservancy has identified Common Periwinkle as an invasive species (http://tncweeds.ucdavis.edu/esadocs.html) and the Plant Conservation Alliance (PCA) reports Common Periwinkle invasions in twenty-five states including Michigan (http://www.nps.gov/plants/alien/list/v.htm). From the backyard of a residence located on Leonard Street, this invasive plant species has spread and is currently covering a 100” x 30” area of stream bank along Sand Creek. If left to grow, this invasive will continue to spread and choke out the canopy species and expose the creek to direct sunlight possibly elevating water temperatures. Garlic Mustard has been located in Aman Park by the Grand Rapids Audubon Society and is identified as an invasive by The Nature Conservancy (http://tncweeds.ucdavis.edu/esadocs.html). Garlic Mustard (Alliaria peteiolata) is a biennial herb in the mustard family with triangular to heart-shaped, coarsely toothed leaves that gives an odor of garlic when crushed. Although Garlic Mustard does not appear to be impacting water quality in the Sand Creek Watershed, it does pose a severe threat to native plants and animals. It typically invades forested communities and edge habitats where it rapidly spreads and displaces native herbaceous species. Displacement occurs rapidly, often within 10 years of establishment. Many native wildflowers that complete their life cycles in the springtime (e.g., spring beauty, wild ginger, bloodroot, Dutchman's breeches, hepatica, toothworts, and trilliums) occur in the same habitat as garlic mustard. Garlic mustard is simply more aggressive and takes over these wildflower communities. Once established, garlic mustard is very difficult to control. Annual monitoring and rapid removal of plants will be the most effective measure in preventing the establishment of garlic mustard and protecting the wildflower species of Aman Park. The Nature Conservancy identifies the following invasive plants for Michigan, any of which may be present in the Sand Creek Watershed and impacting designated uses: Purple Loosestrife, Kudzu, Multiflora Rose, Giant Salvinia, Tree of Heaven, Bush Honeysuckle, Morrow’s Honeysuckle, Tatarian Honeysuckle, European Buckthorn, Glossy Buckthorn, Eurasion Watermilfoil, Sericea, and Russian Olive. (http://nature.org/initiatives/invasivespecies/features/index.html).
TRASH Trash decreases aesthetics and creates a less desirable, and potentially harmful, environment for recreational uses such as fishing, wading, swimming, etc. Trash is carried by storm water runoff from impervious surfaces, such as parking lots and roads, to surface waters. Illegal dumping also contributes to further stream pollution.
55

Illicit dumping of trash, such as furniture, appliances, scrap metal, and tires, was noted during the physical inventory of Sand Creek. Tires were the most prevalent form of trash noted. In addition, evidence of trash inputs via urban runoff, such as pop cans and plastics, was also evident.
PATHOGENS The presence of coliforms, Escherichia coli (E. coli) or fecal coliform, within a water body indicates the possible presence of microbial pathogen contamination. Coliforms are mostly harmless bacteria that live in soil, water, and the intestinal tracts of humans and warm-blooded animals. Pathogens are microbes that cause disease and include several types of bacteria, viruses, protozoa, and other organisms. The extent to which total coliforms are present in surface waters can indicate general water quality and the likelihood that the water is contaminated with microbial pathogens. Improperly installed, operated, or maintained septic systems and waste water treatment sites can contribute pathogens from humans to surface waters posing a potential health risk to recreational users. Animal runoff from animal pastures and improper disposal of pet waste also contribute animal pathogens to nearby water bodies. The water quality assessment of Sand Creek performed by the Annis Water Resources Institute (AWRI) between May and November of 2003 reveals elevated E.coli levels. The Michigan Department of Environmental Quality (MDEQ) has set specific rules to protect partial and total body recreation activities according to R 323.1062 of Part 4, Part 31 of PA 451, 1994, revised 4/2/99. According to this rule, compliance is based on the following sample methods:
Total Body Contact Recreation Sampling Methods: •
•
1) Each sampling event shall consist of 3 or more samples taken at representative locations within a defined sampling area. The geometric mean of all individual samples taken during 5 or more sampling events representatively spread over a 30 day period is not to contain more than 130 E.coli per 100 milliliters.
2) The geometric mean of 3 or more samples taken during the same sampling event at representative locations within a defined sampling area is not to contain more than a maximum of 300 E.coli per 100 milliliters.
Partial Body Contact Recreation Sampling Method:
The geometric mean of 3 or more samples, taken during the same sampling event, at representative locations within a defined sampling area is not to exceed a maximum of 1000 E.coli per 100 milliliters. Due to financial constraints, only one individual sample was collected from each sample location (Figure 18) one to three times per month during AWRI’s water quality assessment of Sand Creek. Although this data cannot be used to determine whether total or partial body contact recreational uses are being met, it does provide a general snapshot of bacterial concentrations in Sand Creek. (Table 11). Future studies are recommended to determine whether partial and total body recreational uses are in fact impaired based on the sampling methods defined above.
56

Figure 18: Monitoring Sites
57

Table 11: Sand Creek Watershed E.coli Data
58

CHAPTER 6 DESIRED USES Desired uses of a watershed are based on factors important to the watershed community. The Sand Creek Watershed Partners, the local watershed group, identified nine desired uses of the Sand Creek Watershed (Table 12). The Sand Creek Watershed is utilized for recreational uses such as fishing, hiking, biking, and wildflower viewing. Recreational uses of the watershed, along with the protection of agricultural lands and the preservation of green space, were identified as desired uses of the watershed by the Sand Creek Watershed Partners. Protecting wildlife habitat and corridors was also recognized as an important factor to the watershed community.
TABLE 12: DESIRED USES IN THE SAND CREEK WATERSHED
Desired Use Goal Preserve green space Identify ways to protect and preserve green space Maintain and protect unimpeded routes for migratory fish
Identify and discourage activities that would impede migratory routes for fish (e.g. reconstruction of Root Dam)
Preserve agricultural land Develop zoning and adopt ordinance to permanently preserve agricultural lands
Protect and increase the number of wildlife species
Identify critical habitat for wildlife species and ways to protect these areas
Protect wildlife/riparian corridor Develop zoning and adopt ordinance to establish permanent easements
Enhance existing recreational trails Enhance Musketawa Trail and trails in Aman Park
Maintain an intact floodplain Discourage future development and destructive manipulation of the floodplain
Protect and restore wetlands Adopt ordinance to protect wetlands and partner with appropriate organizations to restore wetlands
Control invasive species that would decrease the integrity of the stream
Raise awareness about invasive/exotic species and encourage planting native vegetation
Maintain and improve public access areas
Identify improperly maintained public access areas and ways to improve them
The Sand Creek Watershed Partners have identified several projects that will enhance these desired uses. Short-term goals include the following action items listed in Table 13. TABLE 13: SHORT TERM GOALS TO ENHANCE DESIRED USES OF THE SAND CREEK
WATERSHED
1. Develop two parks providing walkways on land owned by Wright Township (located on Berlin Fair Drive) and Ottawa County (located on 24th and Arthur).
2. Improve public access areas in Aman Park including installing a boardwalk on the “unofficial trail”.
3. Enhance current information stations and add additional stations along interpretive trails in Aman Park to educate residents about the watershed.
4. Add information stations along Musketawa Trail to educate residents about the watershed. 5. Create a Scenic Tours brochure indicating watershed areas with native landscaping, trails,
parks, and other areas of interest. 6. Work with a minimum of two farmers to install filter strips.
59

CHAPTER 7 WATER QUALITY GOALS
7.1 GOALS AND OBJECTIVES The goal of the Sand Creek Watershed Project is to improve and protect the designated uses of the watershed. In order to achieve this overall goal, and attain compliance with the TMDL established in Sand Creek, four goals have been established and prioritized. The priority ranking was based on the priority ranking of the impaired designated uses: 1) Restore or improve the cold water fishery 2) Protect and improve the habitats of native aquatic life and wildlife 3) Protect and improve partial body contact recreation 4) Protect and improve total body contact recreation The primary goal for the Sand Creek Watershed is to restore or improve the cold water fishery and the secondary goal is to protect and improve the habitats of native aquatic life and wildlife. Both goals can be achieved by reducing those pollutants that are known and suspected of affecting these two designated uses: sediment, nutrients, thermal pollution, harmful changes in hydrology, hydrocarbons, toxic substances, and invasive/exotic species. The third goal and fourth goal involve protecting and improving recreational uses in the watershed, which can be achieved by reducing the known and suspected pollutants affecting these uses: pathogens, hydrocarbons, toxic substances, and trash. Objectives have been identified to reduce pollutants affecting these four impaired designated uses and thus achieve the goals established for the Sand Creek Watershed. Objectives directly related to each pollutant cause and are listed and categorized by pollutant (Table 14).
60

(Table 14: Water Quality Objectives for the Sand Creek Watershed).
61

7.2 FINAL WATER QUALITY SUMMARY Nonpoint source pollution has impaired and threatened the designated uses of the Sand Creek Watershed. The use of cold water fishery has been identified as impaired and three designated uses have been identified as threatened, 1) other indigenous aquatic life and wildlife, 2) partial body contact recreation and 3) total body contact recreation. Sediment, nutrients, thermal pollution, harmful changes in hydrology, hydrocarbons, toxic substances, pathogens, trash, and invasive/exotic species are all known or suspected of impacting the watershed’s designated and desired uses. Watershed inventories have indicated that the upper watershed is impaired and has only fair water quality due to agricultural land use practices and historical channelization that has served to degrade the aquatic habitat of fish and macroinvertebrate species. Water quality improves downstream and is ranked as “good” most likely due to inputs from the East Fork and several other tributaries and a lack of the impairments affecting the upper watershed.
Project Goals The primary goal of the Sand Creek Watershed is to restore or improve the cold water fishery. Achieving this goal will attain compliance with the TMDL for “poor fish community” on Sand Creek. The secondary goal of the project is to protect and improve the habitats of native aquatic life and wildlife. Both goals can be achieved by reducing the known pollutants affecting both of these uses. The third and final goal of the watershed is to protect and improve partial body contact recreation, such as fishing and wading, followed by total body contact recreation, such as swimming. This can be achieved by reducing the known and suspected pollutants affecting these two uses. Best Management Practices, improved land use policies, and information and education activities will be needed to reduce known pollutants affecting these four impaired and threatened designated uses.
Impairments to the Coldwater Fishery and Aquatic Life/Wildlife Uses The designated uses of 1) coldwater fishery and 2) other indigenous aquatic life and wildlife are impaired due to the following known and suspected pollutants: 1) sediment, 2) nutrients, 3) thermal pollution, 4) harmful changes in hydrology, 5) hydrocarbons, 6) toxic substances, and 7) invasive/exotic species. Sources of these pollutants result from agricultural, industrial, residential, urban, and recreational uses of the watershed.
Impairments to Partial and Total Body Contact Recreation Uses The designated uses of partial and total body contact recreation are threatened due to the following known and suspected pollutants: 1) pathogens, 2) hydrocarbons, 3) toxic substances, and 4) trash. A few known and suspected sources of pathogens include 1) animal waste runoff/ sewage treatment sites, 2) storm water runoff, and 3) impacted groundwater plumes.
63

CHAPTER 8 CRITICAL AREAS Critical areas are those geographic portions of the watershed that are or have the potential to contribute the majority of the pollutants to the waterway. Critical areas were identified to reduce the geographic scope of the watershed project so future efforts can focus on the parts of the watershed that are contributing the most pollutants. Five factors were used to assess the potential for water quality degradation and aid in the identification of critical areas: 1) land use, 2) high groundwater vulnerability, 3) high erosion potential, 4) subbasin yields – 50% chance, 24-hour storm, and 5) subbasin yields – 4% Chance, 24-hour storm. These factors were believed to best characterize the critical areas of the watershed from the information available. Critical areas were mapped using a geographic information system (GIS) and data obtained from the hydrologic model of the Sand Creek Watershed developed by the Hydrologic Studies Unit (HSU) of the MDEQ. The information below details how each of the fifteen subbasins of the Sand Creek Watershed were ranked based on each factor and how a total ranking for each subbasin was determined.
Land Use Ranking This ranking identifies subbasins with high percentages of developed land. The total acres of agricultural and urban land uses were added together and divided by total acres of each subbasin to achieve a total percent of developed land in each subbasin. Data for this analysis came from the 1992 USGS National Land Cover Data set. Each subbasin received a numerical rank based on the percentage of developed land: (0-25% = 1), (26-50% = 2), (51-80% = 3), (81-100% = 4). A score between 1-2 was classified as a slightly critical area, a score of 3 was classified as moderately critical, and a score of 4 was classified as severely critical.
High Groundwater Vulnerability Ranking This ranking used two parameters to identify subbasins with high percentages of groundwater vulnerability. The first factor was the type of hydrologic soil group. Soils that fall into hydrologic group A infiltrate water rapidly; generally water that falls on this soil group will not pond there long, but quickly percolate through the soil and into the groundwater. The second factor used was the distance of the groundwater table from the ground surface. Any areas where the groundwater table was less than six feet from the surface were considered problematic. All areas that contained both hydrologic soil group A and a high water table were considered areas of high groundwater vulnerability. Subbasins received a numerical rank based on the percentage of high groundwater vulnerability: (< 1% = 1), (1.1 – 2% = 2), (2.1 – 3% = 3), (>3% = 4). A score between 1-2 was classified as slightly critical, a score of 3 was classified as moderately critical, and a score of 4 was classified as severely critical.
High Erosion Potential Ranking The parameter used to determine high erosion potential is the K-factor. The K-factor quantifies the degree of sheet and rill erosion for a certain soil. The average K-factor for each subbasin was calculated and ranked. Soils with K-factors greater than 0.28 are considered highly erosive (USDA 1986).
64

Each subbasin was given a numerical rank based on the average K-value: (<0.20 = 1), (0.21 – 0.24 = 2), (0.25 – 0.28 = 3), (>0.28 = 4). A score between 1-2 was classified as slightly critical, a score of 3 was classified as moderately critical, and a score of 4 was classified as severely critical.
Subbasin Yields – 50% Chance, 24-hour Storm Ranking A hydrologic study was developed for the Sand Creek Watershed by the Hydrologic Studies Unit (HSU) of the Department of Environmental Quality (DEQ) in July of 2003. A model was created to estimate subbasin yields (cfs/acre) during a 50% chance storm using 1998 land use data. A numerical rank was given based on the amount of each subbasin yield: (<= 0.01 = 1), (0.02 – 0.03 = 2), (0.04 = 3), (>= 0.05 = 4). A score between 1-2 was classified as slightly critical, a score of 3 was classified as moderately critical, and a score of 4 was classified as severely critical.
Subbasin Yields – 4% Chance, 24-hour Storm Ranking Similar to the subbasin yields for 50% chance, 24-hour storm ranking, subbasin yields for a 4% chance storm, using 1998 land use data, were used to rank subbasins. A numerical rank was given based on the amount of each subbasin yield: (<0.08 = 1), (0.08 – 0.10 = 2), (0.11 – 0.12 = 3), (>0.0.12 = 4). A score between 1-2 was classified as slightly critical, a score of 3 was classified as moderately critical, and a score of 4 was classified as severely critical.
Total Ranking This total ranking added the individual rankings from each of the five categories measured for the critical area analysis (Table 15). The subbasins receiving higher rankings are the most sensitive to changes within the Sand Creek Watershed. A total ranking between 8-10 was classified as slightly critical, a ranking of 11-13 was classified as moderately critical, and a ranking >13 was classified as severely critical. Two subbasins were ranked as severely critical, eight as moderately critical, and five as slightly critical. In general, north-western subbasins were the most critical while the eastern subbasins, including all subbasins of the East Fork, were the second most critical. Southern subbasins of Sand Creek, below Hayes St, were the least critical excluding the “Sand Creek, Lower” subbasin which was ranked as moderately critical (Figure 19).
65

TABLE 15: CRITICAL AREA RANKING SCORES FOR SUBBASINS IN THE SAND CREEK WATERSHED
Subbasin
Land Use
Rank
GroundwaterVulnerability
Rank
Erosion Potential
Rank
50% Storm Rank
4% Storm Rank
Total Rank
East Fork, Lower 3 1 2 3 4 13
East Fork, Tributary 3 1 1 4 4 13
East Fork, to Hayes 3 3 2 2 2 12
East Fork, to Tributary 4 1 3 2 1 11
East Fork, Upper 4 1 4 2 2 13
Sand Creek, to Wilson 4 1 4 3 4 16
Sand Creek, to State 4 3 2 2 2 13
Sand Creek, to East Fork 3 1 2 2 2 10
Sand Creek, to Arthur 4 4 3 2 1 14
Sand Creek, Tributary at Leonard 4 2 3 2 2 13
Sand Creek, to M-45 3 1 3 1 1 9
Sand Creek, to South Tributary 2 2 3 1 1 9
Sand Creek, Lower 3 2 3 2 2 12
Sand Creek, to Leonard 3 1 3 2 1 10
Sand Creek, S Trib. 2 1 2 1 2 8
66

Figure 19: Critical Areas
67

CHAPTER 9 PROPOSED IMPLEMENTATION ACTIVITIES
9.1 RECOMMENDATIONS The Sand Creek Watershed Partners and Rural Subcommittee of the Lower Grand River Watershed Project, in collaboration with the project manager, reviewed watershed pollutants affecting designated uses of the watershed. This was done in order to develop the recommendations needed to treat, prevent, and reduce watershed pollutants. Recommendations have been divided into three categories: Structural and Vegetative Best Management Practices (BMPs), Policy and Management Recommendations, and Information and Education (I&E) activities. Recommendations were selected regarding the objectives that were identified to reduce watershed pollutants (Table 16). It should be noted that future watershed efforts should be directed toward subbasins in the Sand Creek Watershed deemed most critical. Costs of BMP implementation, land use policies, and I&E activities as well as a schedule for implementation are provided (Table 17). Several potential project partners are also listed, and additional partners should be utilized to build on existing programs and share resources.
9.2 TECHNICAL ASSISTANCE In order to carry out the many recommendations identified, technical assistance is necessary. Many agencies are involved in watershed management activities either through implementing structural or vegetative Best Management Practices, implementing changes in land use policies or management, or carrying out I&E activities. The following organizations and agencies can provide technical assistance to residents, landowners, local decision makers, watershed managers, and other interested parties in the Sand Creek Watershed:
Grand Valley Metro Council (GVMC) • • • • • • • • • • • •
Grand Valley State University, Annis Water Resources Institute (AWRI) Lower Grand River Watershed Organization Michigan Department of Environmental Quality (MDEQ) Michigan Department of Environmental Resources (MDNR) Michigan State University Extension Offices (MSUE) Other Watershed Projects/Partnerships Ottawa and Kent County Conservation Districts Ottawa and Kent County Drain Commissioners and Road Commissions Ottawa and Kent County Health, Public Works, Parks and Recreation Departments Timberland Resources Conservation & Development (RC&D) USDA Natural Resource Conservation Service (NRCS)
68

TABLE 16: RECOMMENDED IMPLEMENTATION ACTIVITIES FOR THE SAND CREEK WATERSHED
69

TABLE 17: SCHEDULE, COST ESTIMATES, AND POTENTIAL PARTNERS FOR IMPLEMENTATION ACTIVITIES
74

Chapter 10 INFORMATION AND EDUCATION STRATEGY Introduction The Sand Creek Watershed Information & Education (I&E) Strategy is based on the larger I&E Strategy being formulated for the Lower Grand River Watershed Management Plan. An I&E Strategy is needed to help motivate the watershed’s stakeholders, residents and other decision makers to take actions necessary to protect the water quality and environmental conditions in the watershed. The Sand Creek I&E strategy will serve as a working document that outlines the major steps and actions needed to successfully maintain and improve water quality and environmental conditions in the Sand Creek Watershed.
SECTION I: STRATEGY COMPONENTS The primary goal for the Sand Creek Watershed is to restore or improve the cold water fishery and the secondary goal is to protect and improve the habitats of native aquatic life and wildlife. Both goals can be achieved by reducing those pollutants that are known and suspected of affecting these two designated uses: sediment, nutrients, thermal pollution, harmful changes in hydrology, hydrocarbons, toxic substances, and invasive/exotic species. The third goal and fourth goal involve protecting and improving recreational uses in the watershed which can be achieved by reducing the known and suspected pollutants affecting these uses: pathogens, hydrocarbons, toxic substances, and trash. I&E Strategy Goal The I&E strategy will help to answer the question, “How will the I&E efforts help to achieve the watershed management goal?” The I&E efforts will achieve the watershed management goal by increasing the involvement of the community in watershed protection activities through awareness, education, and action. The watershed community can become involved only if they are informed of the issues and are provided information and opportunities to participate. Key Target Audience Based on the I&E goal for the Sand Creek Watershed Project, key target audiences whose support is needed to achieve the watershed management goal have been identified. Although the overall audience for the I&E strategy is extremely broad, there are two major categories of audiences: (1) users of the resource within the watershed and (2) local decision-makers both within and outside the watershed. Within the first category, the audience is further broken down to include the following: Category 1: Residents of Sand Creek Watershed, agricultural community, business owners, builders/developers, environmental/recreational groups, schools (K-college), homeowners, and watershed mangers. Category 2: Locally elected officials, municipal employees.
79

Audience Characteristics The level of understanding of watershed management, the types of values and concerns, and the level of enthusiasm that people have for participation in watershed management activities are expected to differ across the diverse groups that make up the community. Understanding these differences is critical to targeting appropriate audiences, developing effective messages and means of participation for them, and motivating them to become involved in the watershed management process. Section 1 of Appendix E includes summary information that describes the makeup of the audiences, shows how they receive information on environmental issues, identifies their existing level of knowledge on watershed issues, and outlines the communication tools used to reach their constituents. Table 1 of Appendix E also provides specific distribution tools for each audience. Recommended Strategy Objectives Specific objectives have been developed to achieve the I&E goals. These objectives will move the audience through the phases of outreach from awareness to education and finally to action. The messages and formats used to achieve these outcomes will vary with each audience. Four major objectives must be met to achieve the I&E goal. Under each objective specific tasks and products will be developed to address how the objective will be achieved. Table 1 of Appendix E includes a summary of the tasks and activities to be conducted to achieve the objectives. • Objective 1 - Awareness: Make the target audience aware that they live in a watershed with
unique resources and that their day-to-day activities affect the quality of those resources. (Categories 1 and 2)
• Objective 2 - Education: Educate target audiences on the link between urban development,
agricultural activities and water quality impacts, and highlight what actions can be taken to reduce impacts. (Categories 1 and 2)
• Objective 3 - Action: Motivate the audience to adopt and implement practices that will result
in water quality improvements. These practices may include homeowner activities such as reducing fertilizer application, maintaining septic systems, purchasing properties with low-impact design elements, maintaining stream buffers on their properties or supporting land use planning practices in the watershed. (Category 1)
• Objective 4 - Action: Incorporate watershed protection activities into land use planning
decisions. (Category 2) Developing and Distributing Effective Messages The objectives of the I&E strategy all involve raising awareness, educating people on the problems and solutions, and motivating people to participate in activities to protect the Sand Creek Watershed, which will in turn protect the Lower Grand River Watershed. The I&E strategy will need to communicate effectively with the wide range of audiences that make up the Sand Creek Watershed community to achieve these objectives. Specific messages will be developed to make the different audiences aware of the issues and to support the watershed management effort. These messages should be repeated frequently to make an impact on the audience. Each audience will respond differently to the information presented, and it is critical that team members tailor the information to meet the needs of the audience. The members of each audience must
80

understand specifically how the information being presented affects them. Messages have been developed for various audiences based on the available information on the audiences. Throughout the Sand Creek Watershed, these messages should be validated and modified based on new information collected from the community. Some key messages include the following: • The Sand Creek Watershed is within the larger Lower Grand River Watershed, which is a
unique resource in which everyone can enjoy and take pride. A list of “Did you know?“ factoids that highlight unique features of the watershed can be prepared.
• Take part in shaping your future. Residents need to know how they can participate in land
use planning decisions. A checklist should be developed that shows them who to contact and where their input is needed.
• The following statements can also be used to help assure stakeholders that their involvement
will be fruitful. • Protecting our watershed also protects your pocketbook. The connection for landowners and
businesses between a healthy watershed and economic return is an important message. Information should be collected on revenue generated from recreational users of the watershed and farming operations and on the property values along the river.
• We have the tools to help you get the job done. As audiences move from awareness to
education, they need to be informed of the resources that may be available to them to help implement changes. Farmers, businesses, and local officials are more likely to participate if they are given access to resources and technical assistance.
Formats Because the target audience is so broad, multiple formats will be used to reach these audiences and to reinforce the messages over time. These formats will be phased in over time as the audiences move from awareness to education and finally to action. Efforts will be largely focused on using media outlets (such as local press and established government publications, radio, and public television) to make the audiences aware of the issues in the watershed during the awareness phase. General background materials will be developed for project team members to use when working with the various audiences. These materials include a general brochure, slide show, updated web site, and traveling display. Formats that focus on solutions and actions that can be taken to help improve and preserve the water quality in the Sand Creek Watershed will be developed as the audiences become more aware of the watershed project. These formats include presentations throughout the watershed, articles in the larger project newsletter, The Grand River Beacon, and technical workshops. Table 17 of Chapter 9 supplies detailed activities to be conducted for each format. Table 1 of Appendix E summarizes the target audiences reached using the different formats. Specific formats to be developed include the following: • Fact Sheets: Fact sheets may be produced similarly to the general brochure but targeted to
specific audiences as the I&E strategy progresses. • “Did You Know” Questions or Watershed Factoids: A set of 10 or more characteristics that
highlight the unique features of the watershed should be developed to be included in the brochure and fact sheets. Audiences respond very well to fun facts and tidbits about their community. This list will help to reinforce the concept that Sand Creek is worth protecting and improving. Once developed, this list can be disseminated through a variety of means:
81

aired as public service announcements, printed in brochures and fact sheets, posted up on the display, printed in newspapers or news inserts, and reproduced on other materials.
• Media: The primary tool to be used in the awareness phase for all audiences is the media.
These markets include newspapers such as the Grand Rapids Press and The Advance. Radio stations include WBCT-FM, WBFX-FM, WOOD-AM, WOOD-FM, WSNX-FM, WTKG-AM, WVTI-FM, WKLQ-FM, WMUS-FM, and WMRR-FM. Public access stations include GRTV and WGVU/WGVK TV. The more often the target audiences read articles on watershed issues or watch watershed-related information on television, the more likely they are to respond and participate in the process. Keeping the message in front of people is vital to keeping them interested. News stories will be written with a local angle, be of interest to many people, or have a human-interest component. At a minimum, an article that mentions something about issues on the watershed project should appear monthly. Producing articles about other activities in the watershed project, such as the stream crossing inventories or model ordinances, provides an excellent opportunity for coordination with the rest of the watershed efforts. A press kit that includes background information on the project with quotes from local representatives, a map of the watershed with political boundaries, and contact information will be prepared.
• Local Newspapers: Articles should appear on a regular basis in all sections of the paper—
human interest, sports, editorials, and news features. If possible, a regular column in the local paper that highlights activities regarding the development of the watershed plan should be initiated. For example, quizzes can be developed for readers, and announcements can be inserted regarding field sampling days or field trips.
• Public Access Channels: As part of the initial awareness efforts, and throughout the
watershed assessment process, information should be posted on both television and radio public access stations. This coverage can be accomplished in a variety of formats, such as public service announcements, a talk show, filming sampling events out in the field, showing examples of water quality degradation, or covering events such as watershed fair or storm drain stenciling. The television station should be contacted whenever an event is planned.
• Area Newsletters: In addition to submitting articles for publication in the local press, articles
should be regularly submitted to periodicals in the watershed to which the target audiences subscribe. Each article should be tailored to the interests of the publication. Table 2 of Appendix E includes contact information on these periodicals.
• The Grand River Beacon: The Lower Grand River Watershed project has developed a
periodic news insert, The Grand River Beacon, that provides updates on the watershed project. The news insert is distributed to more than 4,000 people throughout the Lower Grand River Watershed A regular article highlighting the Sand Creek Watershed could be submitted for each new edition.
• Watershed Presentations: Presentations are a very effective means to reach a variety of
audiences and allow the presenter to get immediate feedback. Project team members will make presentations using the slide show developed for specific audiences. Key opportunities for making presentations include local schools, commissioner meetings, homeowner association meetings, local business meetings, and regional business meetings. At each presentation, a brief “show what you know” survey will be handed out to determine the audience’s level of understanding. A follow-up survey will be sent one month after the event to determine any changes in the audience’s knowledge.
82

• Targeted Training Workshops: Topic specific workshops will be held for local decision-
makers, businesses, and other audiences in the watershed. These workshops will be scheduled once the project team members have initiated a dialogue with these audiences and determined the topics of greatest interest. The workshops may be presented as a stand-alone workshop or in conjunction with other activities sponsored by the target audiences.
Distribution The materials identified above will be distributed through a variety of mechanisms. One of the most effective means of distributing information is to piggyback it onto existing materials received by the target audience, such as the materials used by local governments and the Lower Grand River Project. This approach helps to leverage resources, and materials are more likely to be seen by the audience since they are already familiar with the format. Table 2 of Appendix E lists some of the communication tools currently used by the target audiences. These tools will be used to the extent possible to distribute information about the Sand Creek Watershed Project. Evaluation Evaluation provides a feedback mechanism for continuous improvement of the I&E strategy. Evaluation tools must be built into the strategy at the beginning to ensure that accurate feedback is generated. Indicators of success will be developed throughout the planning and implementation process to help the project team members determine whether the objectives have been achieved. The indicators selected must include several parameters, not just the number of brochures mailed out or how many people attended a meeting. To successfully determine if the objectives were met, a pre- and post-survey is useful. Such a survey can be conducted by mail, by telephone, or in person at events. The kind of information needed includes the following: • Demographic information on the audience • Knowledge of the message • How they heard about the meeting or event • Current practices around their property • Interest level in the issues • Change in practices or behavior based on information received.
Table 18 of Chapter 9 summarizes the tasks and schedule for implementation. Section 3 of Appendix E gives detailed information on the proposed tasks and tracking indicators to evaluate the success of the task. Although evaluation of specific components within the I&E strategy will occur continuously, project team members will hold evaluation sessions semi-annually for the express purpose of reviewing the entire I&E strategy. The worksheet Section 2 of Appendix E can be used as a guide when reviewing the status of the I&E strategy.
SECTION II: STRATEGY IMPLEMENTATION & ADMINISTRATION Organizing Strategy Administration Implementation of the I&E component will involve project partners and be coordinated by Grand Valley State University’s Annis Water Resource Institute (AWRI). Funding for the I&E strategy will be provided from a variety of sources including Section 319 funds, other US EPA grants,
83

community foundations, local units of government, sportsperson organizations, and Michigan Department of Transportation. Roles and Responsibilities The I&E strategy will primarily be administered from AWRI. The Project Manager will be responsible for administering the strategy and will coordinate activities with other organizations such as Michigan Department of Environmental Quality, West Michigan Environmental Action Council, Grand Valley Metro Council, Timberland RC&D, Ottawa/Kent County Conservation Districts, the planners, zoning administrators, drain commissioners, and West Michigan Trout Unlimited. The responsibilities of project staff will include the following: • Oversight of the project • Obtaining grants or appropriations • Establishing strategy development milestones and tracking progress • Obtaining volunteer support • Advertising the strategy • Participating in activities
Project Partners The Lower Grand River Watershed Project has already formed partnerships with several other organizations throughout the watershed. These partners will help maximize the use of limited resources by assisting with the developing and distributing of I&E materials. As the project progresses, more partnerships will be formed. Current partners of the Lower Grand River Watershed Project are listed in Table 3 of Appendix E. Project Priorities Project priorities need to be established to direct resources to the areas that will realize the greatest benefits. The Lower Grand River Watershed project has determined the following public education activities will be considered high-priority in terms of resource allocation: • Activities that build on existing efforts: These activities include watershed programs in
adjacent areas, land use planning efforts, and statewide programs. • Activities that consider future regulatory requirements, such as NPDES Phase II Storm
Water Regulations, and TMDL actions. • Activities that must be conducted to lay the foundation for future efforts, such as awareness
campaigns in the local press to bring the major watershed issues to the forefront. And baseline surveys.
• Activities that strengthen relationships or form partnerships within the watershed.
• Activities that leverage external funding sources (such as grants).
84

Resources Communities and foundations could help to fund this project. Table 18 of Chapter 9 outlines the estimated resources and recommended timeline needed to accomplish the proposed tasks. The implementation of I&E activities will be phased in and will be coordinated with the other watershed efforts. Implementation will depend on several factors, including staff resources, technical capabilities, and interest shown by various key partners. Section 3 of Appendix E outlines a worksheet to be used as the main tool to track project progress.
85

CHAPTER 11 METHODS OF MEASURING AND EVALUATING PROJECT
11.1 PLANNING PHASE EVALUATION The two-year planning phase of the Lower Grand River Watershed Project began on July 1, 2002 and will end on July 30, 2004. The Project Evaluation Team, made up of members from the project committees, will perform an evaluation of the planning phase for the Lower Grand River Watershed Project. The evaluation will address the five project focus areas: watershed assessment and characterization, information and education strategy, system of regional governance, Best Management Practice (BMP) review and recommendations, and project management. Since this evaluation will address the success of the Sand Creek Watershed Project according to these five areas, it will serve as the evaluation component for the planning phase of this project. The Project Evaluation Team met on March 12, 2003 to generate a list of potential evaluation questions to assess each of the five project areas noted above. The questions addressed issues related to the goals and objectives, organizational arrangements, processes, and outputs of each project area. On July 30, 2003 the Project Evaluation Team met in order to identify and select the most appropriate evaluation tools to answer the evaluation questions previously identified. The list of evaluation tools, considered by the team, was adapted from the W.K. Kellogg Foundation Evaluation Handbook, January 1998. The evaluation tools are described in Table 18. Potential evaluation questions and tools, as they relate to the five project focus areas, are listed in Table 19. At this time, the Project Evaluation Team also determined appropriate audiences for particular evaluation tools and questions, identified and categorized questions appropriate for evaluating Project Year 1 and Project Year 2, and identified opportunities for distributing or conducting particular portions of the evaluation. The final Lower Grand Watershed Project Evaluation Report will be prepared by Tetra Tech Inc. and completed at the conclusion of the planning phase of this project.
86

TABLE 18: PLANNING PHASE EVALUATION TOOL OPTIONS 1. Observation. This tool involves watching the activities of project staff and participants, and is useful when conducting context and implementation evaluations. Through this tool, the evaluator may identify strengths and weaknesses in the operations of the project and offer suggestions for improvement. 2. Interview. Through this tool, the evaluator can learn how project staff and participants view their experiences with the program and gain an in-depth understanding of hard-to-measure concepts, such as participation, empowerment, and cohesiveness. Interviews help the evaluator to understand how a project actually works and can produce useful information for individuals who wish to replicate the project. The evaluator may choose to give different types of interviews, such as informal conversational interviews where there are no predetermined questions, to closed-field response interviews where the evaluator asks participants to choose from fixed responses. 3. Focus Group. This tool is essentially a group interview. The evaluator can use this tool when confidentiality is not a concern and when obtaining a range of opinions on a topic is necessary. In this type of interview setting, a group of six to eight individuals meet for a few hours to respond to a series of predetermined questions. The goal is for participants to state what they think about these series of questions, and to serve as a catalyst for generating thoughts and observations that they might not have thought of individually. 4. Survey. To obtain feedback from a broad audience, an evaluator may choose to develop and administer this type of evaluation tool. Surveys can vary in length and type of question, depending on where and how it is to be administered and the type of information the evaluator would like to obtain. Surveys can use a mix of open- and close-ended questions that will allow the evaluator to easily translate standard responses, but also obtain detailed information on perception and values. 5. Content Analysis. Internal project documents are a valuable source of evaluation data. This tool focuses on conducting a detailed review and analysis of internal project documents, such as progress reports, strategies, outreach materials, summaries, meeting minutes, and project schedules. Coupled with other evaluation tools, content analysis of internal project documents can provide the evaluator with a mechanism for comparing the intent of the project with the reality of the project. Reviewing and analyzing these types of documents also serve as an efficient way for the evaluator to gain insights into project participation, decision-making processes, and changes in project development.
87

TABLE 19: POTENTIAL PROJECT EVALUATION QUESTIONS AND EVALUATION TOOL OPTIONS Project Focus Area
Goals and Objectives Organizational Arrangements
Processes Outputs
Watershed Assessment and Characterization
Does the management plan reflect stakeholders’ concerns as well as priority areas identified through the watershed characterization? Tool Options: • Content analysis
of management plan and Grand River Forum worksheet results (2/20/03)
Are Phase II issues/concerns of watershed partners reflected in the watershed management plan? Tool Options: • Content analysis
of management plan • Focus group
and/or survey of local watershed partners to capture Phase II issues/concerns
Does the structure or the context of the project lead to better project outcomes (e.g., availability of resources, access to data, participation)? Tool Options: • Survey of project
partners within each subcommittee
• Focus group of select representatives of each subcommittee
• Content analysis of subcommittee meeting summaries
Did the project have full participation? Tool Options: • Content analysis of
complete listing of project partners compared to subcommittee attendance records
• Focus group of select representatives of subcommittees to discuss perceptions about project participation
Does the assessment follow a standard operating procedure? Tool Options: • Content analysis of
documentation on process used to conduct watershed assessment and characterization
Are the processes used unique to this watershed or are they transferable to other watersheds? Tool Options: • Identification of lessons learned
through survey and/or focus group
Was the assessment of the watershed accurate? Tool Options: • Conduct in-field verifications
of any assumptions made in developing the management plan
Were the tools used to assess the watershed the right tools? Tool Options: • Focus group of project
partners and representatives of subcommittees
Do the pilot projects accurately characterize the Lower Grand River watershed?
Does the public agree? Do the data support
the selection of the pilot projects?
Tool Options: • Compare pilot projects
selected by subcommittees to those identified through the Grand River Forum worksheet results (2/20/03)
• Compare overall watershed data to baseline data collected for the pilot project areas
Information and Education Strategy
Were the appropriate target audiences identified?
For the project?
For the watershed?
Tool Options: • Focus group of
subcommittee members and Grand Forum participants
• Content analysis of the final I&E strategy to examine processes used to identify target audiences
Were the appropriate stakeholders on the Information and Education Strategy team? Tool Options: • Focus group
and/or survey of members of the I&E subcommittee, as well as other project partners
Was focusing on awareness now the right approach to take? Tool Options: • Baseline survey of
stakeholders throughout the watershed to determine existing level of awareness conducted via quiz on educational materials and/or project web site
Was developing the brochure and the news inserts by subcommittee an effective process? Tool Options: • Focus group with I&E
subcommittee members • Content analysis of
subcommittee meeting minutes • Review of final products
Did people in the Grand Forum read and use the products developed through the I&E Strategy? Tool Options: • Build feedback
mechanism into educational products that allows project team to track use and user awareness
• Count numbers of products distributed throughout the watershed
• Survey of Grand Forum participants
Were the news inserts and brochures effective in raising awareness? Tool Options: • Baseline survey of
stakeholders throughout the watershed to determine existing level of awareness conducted via quiz on educational materials and/or project web site
• Build feedback mechanism into educational products that allows project team to track use and user awareness
88

Project Focus Area
Goals and Objectives Organizational Arrangements
Processes Outputs
System of Regional Governance
Does the new watershed organization represent all existing activities and interests? Tool Options: • Analysis of participants
in new watershed organization compared to overall interests within the Lower Grand River watershed
Does the strategic plan for the new watershed organization define how it will be sustained over time? Tool Options: • Content analysis of
strategic plan to identify mechanisms for ensuring sustainability
Does the new watershed organization maintain the identity and viability of smaller subwatershed groups? Tool Options: • Survey of smaller
subwatershed groups • Focus group with
members of smaller subwatershed groups
• Personal interviews with members of smaller watershed groups
Do other organizations within the watershed know and understand the purpose and functions of the new watershed organization? Tool Options: • Survey of smaller
subwatershed groups • Focus group with members of
smaller subwatershed groups • Personal interviews with
members of smaller watershed groups
Is the process for establishing the new watershed organization defined?
Does the process involve all stakeholders?
Are there effective mechanisms in place for obtaining partner and public input?
Tool Options: • Content analysis of the
strategic plan • Focus group with members of
the steering committee and other subcommittees
Does the new watershed organization effectively serve as a resource to other groups within the watershed? Tool Options: • Survey of smaller
subwatershed groups • Focus group with members
of smaller subwatershed groups
• Personal interviews with members of smaller watershed groups
Does the summary of existing efforts and organizations capture all relevant existing programs? Tool Options: • Content analysis of the final
summary • Content analysis of
comments on the summary provided by reviewers
• Survey and/or focus group of subwatershed groups
BMP Review and Recommendations
Are the baseline conditions of each pilot area established? Tool Options: • Content analysis of
watershed characterization report to identify baseline data and conditions
• Content analysis of all related pilot project selection information
Are effective evaluation mechanisms for determining BMP effectiveness being developed as BMPs are identified (i.e., monitoring plans)? Tool Options: • Content analysis of
BMP prioritization process and matrix, and any additional documentation related to BMP recommendations
• Survey and/or focus group of rural and urban subcommittee members to discuss development of evaluation mechanisms
Does the strategy for evaluating BMPs leverage partner resources? Tool Options: • Content analysis of
documentation related to BMP evaluation implementation
• Focus group with subcommittee members involved in developing BMP evaluation mechanisms to discuss allocation of resources
Is there an assessment of resources available from all partners to support monitoring/evaluation of BMPs? Tool Options: • Content analysis of
documentation related to BMP evaluation implementation
• Focus group with subcommittee members involved in developing BMP evaluation mechanisms to discuss allocation of resources
Were BMPs selected based on a set of BMP evaluation criteria that addressed all aspects of feasibility (e.g., technical, financial, social acceptance, legal, etc.)? Tool Options: • Content analysis of BMP
prioritization process and matrix
Was a mix of short- and long-term BMPs identified? Tool Options: • Content analysis of
prioritization process and matrix
• Content analysis of selected systems of BMPs for urban and rural areas
Are long-term BMPs feasible? Tool Options: • Content analysis of BMP
prioritization process and matrix
• Survey of watershed stakeholders
• Focus group with participants in Grand Forum
Did the assessment of BMPs reach target audiences? Tool Options: • Build feedback
mechanism into educational products that allows project team to track use and user awareness
• Count numbers of products distributed throughout the watershed
• Survey of Grand Forum participants and other project partners
89

Project Focus Area
Goals and Objectives Organizational Arrangements
Processes Outputs
Project Management
Is a basin approach (versus a sub-watershed approach) effective in attaining resources for the watershed? Tool Options: • Track number of
funded grant proposals and other requests for funds
• Track funding of small subwatershed groups before and after 319 project implementation
Have matching commitments from local governments been met for this project? Tool Options: • Analysis of project
budget to determine if local governments have met their matching commitments
• Conduct focus group and/or interview with local governments to determine reasons that matching commitments have not been met
How much of the project success is based on actual individuals versus partner organizations? Tool Options: • Focus group with
members of the subcommittees and the Grand Forum
• Focus group of local governments that contributed matching funds
• Content analysis of project documentation to identify any changes in organizational processes, deliverable schedules, decision-making capabilities, etc. during the project period of performance that may track with changes in key project individuals (e.g., Jerry Felix of Grand Valley Metro Council)
Were on-going sub-watershed activities promoted and sustained while engaging in this larger basinwide project? Tool Options: • Focus group of smaller
subwatershed groups • Survey of smaller
subwatershed groups • Interviews with smaller
subwatershed groups • Content analysis of progress
reports and/or annual reports of subwatershed groups and activities to identify areas that may signify smaller groups suffered during this larger basinwide project (e.g., decreases in funding, missed deadlines, decreases in volunteers, canceled events, etc.)
Was the project funder given review time that the contract calls for? Tool Options: • Content analysis of
progress reports and the project contract to compare timelines of proposed review schedules with actual dates of when project deliverables were submitted for review
Were project budgets realistic? Tool Options: • Comparison of proposed
project budgets with actual project expenditures
• Focus group with key project managers to discuss budget and schedules
What activities were accomplished that go beyond the requirements of the grant? Tool Options: • Focus groups with
members of the subcommittees and the steering committee
• Content analysis of progress reports compared to the original grant requirements
90

11.2 IMPLEMENTATION PHASE EVALUATION The evaluation of the implementation phase will be divided into two types: (1) that which will assess the effectiveness of Information and Education (I&E) tools, and (2) an assessment of Best Management Practices and land use policies. In both instances, a Steering Committee will be organized from watershed stakeholders, with the Sand Creek Watershed Partners being a logical source for membership. The Steering Committee will oversee all project activities and will be asked to measure the success of both I&E, land use policies, and Best Management Practices as they relate to project goals and objectives. This will result in a written summary to be included as part of the regular progress reports due to the Michigan Department of Environmental Quality (MDEQ). With regard to the effectiveness of the Information and Education (I&E) tools, a subcommittee will be appointed by the steering committee to help direct I&E efforts. The subcommittee will agree to the appropriateness of all I&E tools by membership vote. Protocols established for I&E activities as part of the Lower Grand Watershed Project will be incorporated in this proposed project thus ensuring the identification of target audiences, selection of appropriate messages, and development of evaluation tools. The I&E Committee’s performance will be measured by the Steering Committee and be included in the regular progress reports to MDEQ as mentioned previously. It is suggested that a pre-project and post-project survey be developed to measure general knowledge about watershed issues and willingness to support improvement efforts. This survey will require a MDEQ approved Quality Assurance Project Plan (QAPjP). However, additional I&E evaluation technique options are provided in Table 18 and can also be considered as evaluation tools by the I&E committee. Evaluation of physical improvements can include weekly visits to the site during the period of construction, collection of pre and post construction photos, and a visual inspection of water quality impacts resulting from construction activities. Additional options are provided in Table 20. The results of this evaluation will be included as a separate report due at the conclusion of the project. Actual water quality improvements will be determined to the extent practical by a comprehensive water quality monitoring program to be developed as part of the Lower Grand Watershed Project. This comprehensive monitoring strategy will include the network of monitoring already undertaken by local units of government and others operating in the Lower Grand River system. It is expected that the water quality monitoring program for the Lower Grand River Watershed Project will require a MDEQ approved QAPP.
TABLE 20: EVALUATION TECHNIQUES FOR THE IMPLEMENTATION PHASE
Pollutant Addressed Evaluation Techniques Units of Measurement Water Quality Monitoring Pollutant yield (kg/day/hectare) BMPs implemented Number of implemented BMPs Photographs of installed BMPs “Before and after” photographs Cost/benefit ratio Cost of BMP/ pollutant yield reduction
Sediment Nutrients
Macroinvertebrate Surveys Water Quality Score Hydrology Hydrologic Analysis Peak flows (cfs/acre) and volume (cubic feet) Thermal Pollution Water Quality Monitoring Temperature (°C) Hydrocarbons Water Quality Monitoring Visual presence (# of oil sheens) Toxic Substances Water Quality Monitoring Absence/presence based on level of detection Invasive/Exotic Species Removal of vegetation Area cleared of invasives/exotics (ft2) Trash Field Observations Number of impacted areas
Water Quality Monitoring Pollutant concentration (E.coli/100mL) Pathogens Cost/benefit ratio Cost of BMP/ reduction in pollutant concentration
91

CHAPTER 12 SUSTAINABILITY To ensure that the efforts and outcomes of this project, as well as other ongoing watershed projects in the Grand River Watershed, are more effectively coordinated and prioritized on a comprehensive watershed-wide basis, the Lower Grand River Watershed (LGRW) management plan is anticipating the creation of an ongoing Lower Grand River Watershed Organization. Through input of the Grand River Forum, the LGRW Steering Committee is forming a more comprehensive persisting organization to sustain the future value of this effort and to someday reach a long-term vision adopted for the entire LGRW. Such an organization can also coordinate with the Upper Grand River Watershed Project to ensure harmonization of similar efforts for the entire Grand River Basin. The Sand Creek WMP will provide the Sand Creek Watershed Partners the details on how to implement recommendations to reach more immediate goals and objectives of the Sand Creek WMP and the longer range visions of the LGRW Management Plan. It is expected that through a new LGRW organization, these sub-basin recommendations will be extrapolated for use and adoption in other rural areas of the LGRW experiencing similar problems. Furthermore, this WMP will be the basis on which Phase II communities will write their Storm Water Pollution Prevention Initiative, which outlines implementation recommendations of the Sand Creek WMP. LOWER GRAND RIVER WATERSHED ORGANIZATION A number of watershed groups within the state of Michigan are actively involved in watershed improvement and protection. Within the Lower Grand River Watershed, the Rogue River, Coldwater River, Sand Creek, York Creek, and Bear Creek Watersheds are actively working to improve the water quality of their rivers, lakes, and streams. Stakeholders of the LGRW have expressed their desire for all subwatersheds within the Grand River Watershed to design plans and implement projects through a more comprehensive Watershed Management Plan (WMP) at the Lower Grand level and for subwatershed group to carry out coordinated recommendations at their more localized level To achieve this goal, the Grand River Forum has envisioned a future Lower Grand River Watershed Organization that would serve as an umbrella under which area subwatershed groups would operate. This organization would provide the opportunity for subwatershed groups to work together and share information and resources to collectively reach the overall goals and objectives of the LGRW. Based upon a preliminary evaluation of several other watershed organizations throughout Michigan, the LGRW Steering and Visioning Committees have envisioned an organization that would likely include representatives from local government units, environmental organizations, and existing subwatershed groups. The purpose of this organization would be based upon a widely held watershed vision, (as established by the Grand River Forum), and supported by a mission and set of strategies established in the LGRW project to maintain long-term continuity for all watershed initiatives Preliminary work by the Visioning Committee of the LWGR project have offered a draft vision and mission and they are currently working with the Grand Forum on a set of strategies to attain that vision. LGRW Preliminary Vision: A water system which is swimmable, fishable, drinkable, enjoyable: connecting water with life. LGRW Preliminary Mission Statement: To foster the discovery our water resources and the possibilities within us to celebrate the legacy of our shared watersheds”
92

Watershed studies, data sources, and publications regarding the Lower Grand River Watershed will be critical in identifying priorities and priority areas within the watershed in order to facilitate future projects. Much of this information has been compiled and can be found on the project’s website. The website address is listed below: http://www.gvsu.edu/wri/isc/lowgrand/library.htm. SAND CREEK WATERSHED PARTNERS The Sand Creek Watershed Partners (Partners), in collaboration with several project partners, will oversee the implementation of recommendations. This watershed organization’s mission statement is: “Work together to achieve and maintain desired water quality, stream stability, and biological integrity in Sand Creek to benefit current and future generations”. The Sand Creek watershed organization has been involved with several projects to date including two macroinvertebrate inventories, a road/stream crossings inventory, development of a hydrologic model, logo development, as well as development and distribution of several Information and Education (I&E) materials. Recently they have partnered with Timberland Resource Conservation and Development (RC&D) and designated board members to further strengthen their group. A possible “319” project and upcoming implementation activities will offer this group an opportunity to build on their past achievements and protect and restore the designated uses of the Sand Creek Watershed. Participation in the future Lower Grand River Watershed Organization will allow the Partners to share in watershed information and resources, participate in basin-wide oversight and prioritization of water quality concerns, and take part in achieving the overall goals of the LGRW project. UPPER GRAND RIVER WATERSHED COUNCIL The Upper Grand River Watershed (UGRW), located mainly in Jackson and Ingham County, was nearing the completion of the UGRW Project at the beginning of the Lower Grand River Watershed Project. The steering committee of the UGRW was working toward similar goals to create a sustainable watershed organizational structure within the limitations of existing programs, organizations, and agencies. The steering committee found that existing efforts were limited by a geographic scope that did not include the entire UGRW. It was then recommended that an organization be formed to represent the interests of the entire UGRW and provide sustainability of the efforts initiated through the project. The ultimate goal of the resulting organization is to coordinate efforts with the Lower Grand River Watershed Project and to eventually expand their geographic scope to the entire Grand River Watershed. Coordination with the Upper Grand River Watershed Project will ensure harmonization of goals and objectives for the entire Grand River Basin. NPDES PHASE II COMMUNITIES Portions of four of the five local government units within the Sand Creek Watershed have been identified by the U.S. Environmental Protection Agency (EPA) as having urbanized areas requiring a National Pollutant Discharge Elimination System (NPDES) storm water permit. Wright, Tallmadge, and Alpine Townships as well as the City of Walker are required by the EPA to develop Storm Water Pollution Prevention Initiatives (SWPPIs) in accordance with NPDES Phase II Storm Water Regulations. The Sand Creek Watershed Management Plan (WMP) can serve as a guide for these communities to understand water quality concerns and voluntary actions needed to meet water quality goals. The NPDES Phase II Storm Water Regulations
93

creates an opportunity for these communities to implement recommendations made through the Sand Creek Management Plan as compliance standards in their SWPPIs. .
94

GLOSSARY Escherichia coli (E. coli) – bacterium used as an indicator of the presence of waste from humans and other warm-blooded animals. Fecal coliform – bacteria found in the feces of human and other warm-blooded animals. Filter strips – a strip or area of vegetation for removing sediment, organic matter, and other pollutants from runoff water and wastewater. Impervious surface – surface that does not allow runoff to slowly percolate in the ground. Water remains above the surface, accumulates, and runs off in large amounts. Examples include roads, parking lots, sidewalks, and rooftops. Macroinvertebrate – any animal without a backbone, or spinal column that can be seen without using a microscope; the classification includes all animals except fishes, amphibians, reptiles, birds, and mammals. Moraine – an accumulation of earth, stones, and other debris deposited by a glacier. Some types are terminal, lateral, medial, and ground. Nonpoint source pollutants – pollution caused when rain, snowmelt, or wind carry pollutants off the land and into waterbodies. Pathogen – any microorganism or virus that can cause disease. Riparian buffers – an area of trees, shrubs, and other vegetation located in areas adjacent to and upgradient from water bodies. Storm water runoff – the runoff and drainage of precipitation resulting from rainfall or snowmelt or other natural precipitation event. Subbasin/Subwatershed – smaller drainage area within the watershed. Substrate – a part, substance, etc. which lies beneath and supports another. Tributary – a stream that flows into a larger stream or body of water.
95

BIBLIOGRAPHY Annis Water Resources Institute. 1996. An Assessment of Water Quality and Aquatic Habitat and Recommendations for its Protection and Enhancement of the Sand Creek Watershed, Ottawa and Kent County, Michigan. Cairns, J., Jr. 1977. Aquatic ecosystem assimilative capacity. Fisheries 2(2):5-7.24. Judy, R. D., Jr., P. N. Seeley, T. M. Murray, S. C. Svirsky, M. R. Whitworth, and L. S. Ischinger. 1984. 1982 National Fisheries Survey, volume 1. Technical report: initial findings. U.S. Fish and Wildlife Service FWS-OBS-84/06. K. E. Wehrly, M. J. Wiley, and P. W. Seelbach. January 2003. Transactions of the American Fisheries Society; “Classifying Regional Variation in Thermal Regime Based on Stream Fish Community Patterns”. Volume 132, Number1. Pages 18-38. Michigan Department of Environmental Quality (MDEQ). 1997. Qualitative biological and habitat survey protocols for wadable streams and rivers. GLEAS Procedure No. 51. Michigan Department of Environmental Quality, Surface Water Quality Division, Lansing, Michigan. Michigan Department of Agriculture (MDA). 2003. Climatology Program. Michigan State University. 417 Natural Sciences Building. East Lansing, MI 48824. http://35.9.73.71 Michigan Department of Environmental Quality (MDEQ). 2002. Clean Water Section 303(d) List. Report # MI/DEQ/SWQ-02/013 Michigan Department of Natural Resources (MDNR), Institute for Fisheries Research. 1982. VSEC Metadata. Pp. 5. Michigan Department of Natural Resources. 2000. Designated Trout Streams for the State of Michigan. Report # F0-210.01 Natural Resources Conservation Service- United States Department of Agriculture (NRCS-USDA). 2003. Technical Guide to RUSLE use in Michigan. Pp. 12 Natural Resources Conservation Service- United States Department of Agriculture (NRCS-USDA). 1991. Technical Guide to Cropland Interpretations. Pp. 2 Rithcie, J.C. 1972. Sediment, fish, and fish habitat. Journal of Soil and Water Conservation 27:124-125. United States Department of Agriculture (USDA). 1972. Soil Survey of Ottawa County, Michigan. Pp. 35, 48, 130. United States Department of Agriculture, Natural Resource Conservation Service, United States Forest Service, Soil Survey of Kent County Michigan, April 1986.
96

United States Department of Agriculture, Natural Resource Conservation Service, United States Forest Service, Soil Survey of Ottawa County Michigan, 1972.
97