Embed Size (px)
Citation preview

et al., IJSIT, 2015, 4(5), 439-450 Amiebenomo Hauwa Christiana
IJSIT (www.ijsit.com), Volume 4, Issue 5, September-October 2015
439
SAND CONTROL USING GEOMECHANICAL TECHNIQUES: A CASE STUDY OF
NIGER DELTA, NIGERIA
Amiebenomo Hauwa Christiana1 and Adewale Dosunmu2
1,2Centre for Petroleum Geosciences, Institute of Petroleum Studies, University of Port Harcourt, Nigeria
ABSTRACT
Nigeria’s Niger-Delta region having been identified as part of Akata-Agbada formation which is
predominantly unconsolidated sandstone in nature is currently facing serious sand production challenges.
Petroleum producers are now realizing the consequence of sand production, it reduces the life cycles of
subsurface and surface equipment, reduction in flow rate and cost implication in the Industry. As a result,
failure analysis of reservoirs rocks for sanding potential prediction purposes has become rather imperative,
the efficient management of these challenges for field operation optimization requires a reliable failure
model. Most of the existing models failed to capture the real time failure of the reservoir sand, and those that
tried to capture the real time failure criterion required parameters that are difficult to acquire. This project
incorporates a computer model which was used to run stress analysis and do regressional plots to show their
sensitivities and rock strength, as well as point of failure. A case study was conducted on an oil field to predict
pre-drill wellbore stability, where sand production was the main cause of serious operational problems.
Results from the studies showed that the sand production increased as the following parameters; the flow
rates, the confining pressure, the drawdown and mud weight are increased. The results also indicates that
high sand-free flow rates can be achieved if the sand formation is mechanically confined (compacted). An
improved well control method has been proffered for implementation using proposed geomechanical
technique.
Keywords: Failure criterion, critical drawdown pressure, compressional stress, tangential stress.

et al., IJSIT, 2015, 4(5), 439-450 Amiebenomo Hauwa Christiana
IJSIT (www.ijsit.com), Volume 4, Issue 5, September-October 2015
440
INTRODUCTION
Sand production (or sanding) is the production of the formation sand alongside with the formation
fluids (gas, oil and water) due to the unconsolidated nature of the formation. Produced sand has essentially
no economic value. On the contrary, formation sand does not only plug wells to reduce recovery rates, it also
erodes equipment and settles in surface vessels. Controlling formation sand is costly and usually involves
either slowing the production rate or using gravel packing or sand-consolidation techniques. As a result of
this, sand production is a major issue during oil and gas production from unconsolidated reservoirs. Its effect
is a peculiar problem of the Niger Delta oil province which describes the Niger Delta as complex and its
geology. The production of sand is a worldwide problem. Areas of major problems include the U.S Gulf Coast,
California, Canada, China, Venezuela, Trinidad, Western Africa, and Indonesia. At least some problems are
reported in all areas of the world where oil and gas are produced. Sand production is initiated when the
formation stress exceed the strength of the formation.
Sand production is one of the oldest problems of oil field. It is usually associated with shallow
formations as compaction tends to increase with depth. But in some areas, sand production may be
encountered to a depth of 12,000ft or more. Sand production higher than 0.1% (volumetric) can usually be
considered as excessive, but depending on the circumstances, the practical limit could be much lower or
higher. Several factors are responsible for the production of sand oil and Gas wells in Niger Delta area of
Nigeria. Firstly, by Virtue of the considerable porosity of the Niger Delta, reservoir sands tend to be weakly
consolidated or totally unconsolidated and are thus produced when the well flows. The unconsolidated sands
are loose and are susceptible to being produced into the wellbore and to the surface unlike the consolidated
(compacted) sands that are carried by fluid drag force. Secondly, the rate at which the formation is produced
can lead to sand production in a well. Every reservoir has a threshold pressure, which is the pressure at
which a well will Produce sand free. But this threshold pressure is below economic producing rate; therefore,
the engineer tends to ignore the threshold pressure so as to produce at a maximum rate from a sand stone
reservoir, sand will be produced.
And finally, a reservoir that might have been certified sand free may begin to produce sand after a
long time because of a lot of factors that changes with time. Some of these changes could be reservoir
depletion, water production and increased overburden stress. The general sand production can be classified
into three categories: transient, continuous and catastrophic. The transient sand production is commonly
encountered during clean-up after perforation or acidizing. At this stage, sand production will decline with
time. The continuous sand production occurs during production from unconsolidated sandstone reservoir
that has no sand control equipment. For this case, sand production is observed throughout the life of the well.

et al., IJSIT, 2015, 4(5), 439-450 Amiebenomo Hauwa Christiana
IJSIT (www.ijsit.com), Volume 4, Issue 5, September-October 2015
441
AIM AND OBJECTIVES
This work is based on generating a geomechanical model based on reservoir rock strength, to
determine the point of failure of the rock (shear failure) in an effort to control the production of sand.
LITERATURE REVIEW
There have been extensive studies on sand failure mechanisms using laboratory experiments,
theoretical modeling and field observations. In 1996, van den Hoek et al, conducted laboratory experiments
in which sand failure was observed for near-cavity effective stresses above a certain threshold, independent
of applied drawdown. The results led to the conclusion that cavity failure under compression or tension
stress in most cases depends only on cavity size, and not on near-wellbore stress or drawdown. Sand
prediction tools based on theoretical modeling include the works ofRisnes et al, (1981) and Papamichos et al.
(1999).
Sand production is predominant in the Niger Delta because almost all the oil and gas reserves are
located within the tertiary Agbada sandstones and the upper Akata formation (Adeyanju and Oyekunle,
2010). When hydrocarbons are produced from a reservoir, solid particles sometimes follow the reservoir
fluid into the well. This unintended by-product of the hydrocarbon production is called sand production.
There have been extensive studies on sand failure mechanisms using laboratory experiments, theoretical
modeling and field observations. In 1996, van den Hoek et al, conducted laboratory experiments in which
sand failure was observed for near-cavity effective stresses above a certain threshold, independent of applied
drawdown. The results led to the conclusion that cavity failure under compression or tension stress in most
cases depends only on cavity size, and not on near-wellbore stress or drawdown. Sand prediction tools based
on theoretical modeling include the works ofRisnes et al, (1981) and Papamichos et al. (1999).
METHODOLOGY
In this work, geomechanical model for shear failure was carried out by using pore pressure data from
an onshore well in Niger Delta. This data was used to obtain the maximum stress (σH), fracture break down
pressure, collapse pressure and mud pressure at different depths using the overburden at constant value of
0.96psi/ft, since it is a constant irrespective of the well depth.
Preska’s correlation wa used to determine the principal stresses for sandstone formation in the Niger
Delta. A 3D Mogi-coulomb failure criterion was used to calculate all the related stresses such as radial, axial
and tangential stresses, upper and lower bound stress, the principal stresses, in-situ stresses etc.

et al., IJSIT, 2015, 4(5), 439-450 Amiebenomo Hauwa Christiana
IJSIT (www.ijsit.com), Volume 4, Issue 5, September-October 2015
442
The work incorporates a computer model (Visual Basic.Net) which carries out these stress analyses
based on input data. Some regressional plots where performed for different criteria to show the effects of
these stresses in predicting sand production at different well directions respectively.
(a) Building a 3D Geomechanical Modeling: To build a Geomechanical Model of a given area by assessing
the mechanical response to rock submitted to such stress tensor. This is done through the analysis and
modeling of information from well logs (sonic, image, density), core, drilling (fracturing tests, formation tests,
caliper, mud weight, well orientation and direction) rock mechanics tests and seismic. The Geomechanical
Model concept has been proved to be extremely useful in a number of petroleum industry application of
which sand production is not an exemption. For instance, it has been estimated that the worldwide industry
losses caused by mechanical problems while drilling and production can reach US$1billion per year. Wells
designed with Geomechanical Models mitigates these potential losses and these can subsequently be used to
optimize drilling and production strategies.
(b) Shear failure: In this section a new shear failure model based on the elasto plastic theory and Mogi-
Coulomb failure mechanism was developed. In the elasto plastic theory, the largest stress concentration
occurs at the onset of the elastic zone where plastic shield terminates (Fjaer et al. (1992). The stresses at the
plastic elastic interface in the vertical wells are given by Equations (3.1) to (3.3) (Mirzaghorbanali, 2009).
r=pw+2y/√ (
) (3.1)
√ (
)
(3.2)
( ) (3.3)
To avoid plastic elastic interface collapse, there are three cases of three principle stresses needed to
be investigated, as follows:
(1) σz ≥σϴ ≥ σr
(2) σϴ ≥σz ≥ σr
(3) σϴ ≥σr ≥ σz (Mirzaghorbanali, 2009).
By utilizing the effective stress concept and in terms of the first and the second stress invariants,
Mogi-Coulomb law can be represented as in Equation (3.8).
I1= σ1+ σ2+ σ3 (3.4)
I2= σ1σ2+ σ2σ2+ σ1σ3 (3.5)
a’= 2Ccosᵩ (3.6)

et al., IJSIT, 2015, 4(5), 439-450 Amiebenomo Hauwa Christiana
IJSIT (www.ijsit.com), Volume 4, Issue 5, September-October 2015
443
b’=sinᵩ (3.7)
(I12-3I2)0.5 = a’+ b’ (I1 - σ2 -2P’) (3.8)
(c) Tensile failure: When the effective stress at the well bore exceeds the tensile strength of the formation,
tensile failure, and as a result, induced fracture is imminent as shown in Equation (3.9).
Pw ≥ p˚+ σ‘ϴϴ + T (3.9)
The upper limit of the mud window to avoid well bore fracture is determined directly from Equation
(3.9).
Aadnoy and Belayneh (2004) used elasto plastic constitutive model to obtain the effective tangential
stress around the vertical wells, and by introducing this term into the Equation (3.9), the upper limit of the
mud weight window based on elasto plastic model is obtained as shown in Equation (3.10).
Pw=3σ’h,min- σ’Hmax+1.1547Y (t/a)+T+P (3.10)
The plastic zone thickness is determined by leak off test, and eventually fracturing pressure for entire
of the well trajectory is calculated by Equation (3.10), this equation shows that similar to the shear failure, the
role of the plastic zone in vicinity of the well bore is like a pressure shield.
RESULTS ANALYSIS/DISCUSSION
The interface in Fig 1 shows the result for critical pressure drawdown at which the well will begin to
produce sand. This prediction runs for two types of rocks:
1) Intact rock (Fig 1)
2) Depleted reservior (Fig 2)
The result on the critical pressure drawdown (Pd`, psi) based on the two rock types shows that at
same depth (ft) sand would be produced at different pressure considering the the strength of the formation
and the amount of pressure/ stress it can withstand before it begins to fail.
From Fig 3, the result on the critical pressure drawdown (Pd`, psi) shows that for an intact rock sand
would be produced at a pressure of 2505.58psi at a depth of about 5860ft. This will help to mitigate sand
production if our reservoir is located at such depth by controlling the rate of flow from well head
(bean/choke size). This also indicates that d shallower the reservoir, the faster the sand production problem.
From Fig 4.5, as expected higher draw-down results in production of higher percentage of sand, this
is due to higher drag force separating the fluidized sand from the sand mass leading to sand production. The
result on the critical pressure drawdown (Pd`, psi) shows that for an depleted reservoir sand would be
et al., IJSIT, 2015, 4(5), 439-450 Amiebenomo Hauwa Christiana
IJSIT (www.ijsit.com), Volume 4, Issue 5, September-October 2015
444
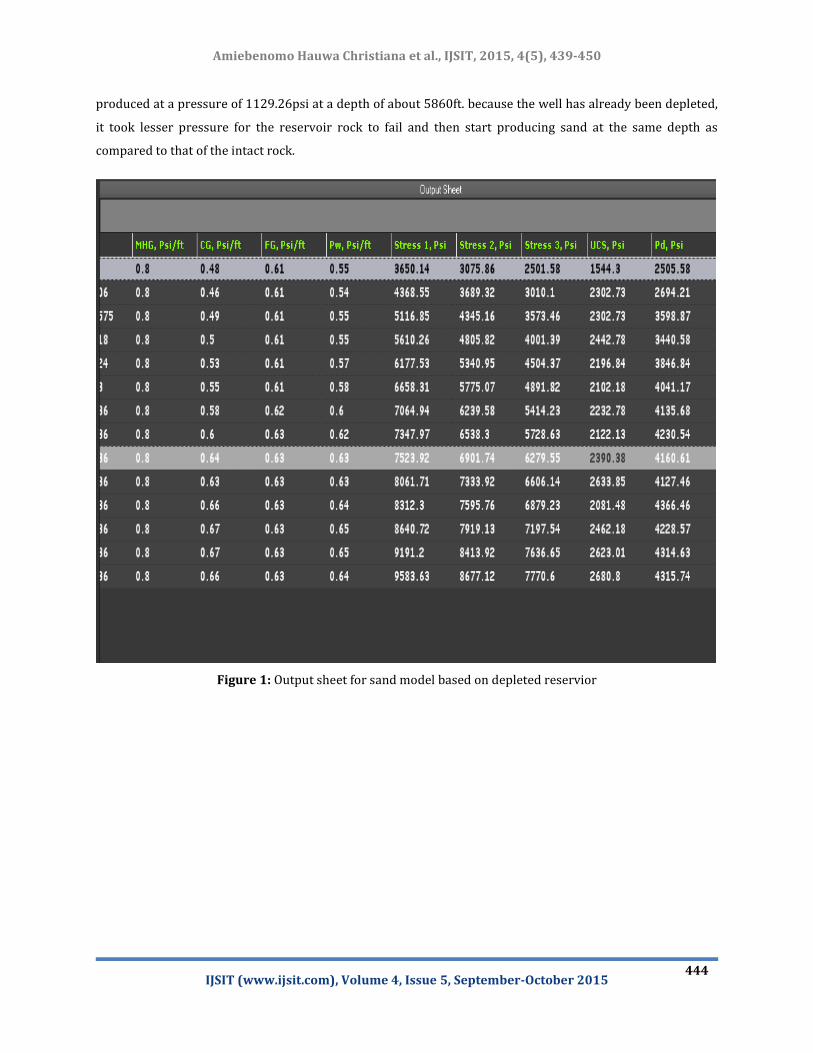
produced at a pressure of 1129.26psi at a depth of about 5860ft. because the well has already been depleted,
it took lesser pressure for the reservoir rock to fail and then start producing sand at the same depth as
compared to that of the intact rock.
Figure 1: Output sheet for sand model based on depleted reservior

et al., IJSIT, 2015, 4(5), 439-450 Amiebenomo Hauwa Christiana
IJSIT (www.ijsit.com), Volume 4, Issue 5, September-October 2015
445
Figure 2: Output sheet for sand model based on intact rock

et al., IJSIT, 2015, 4(5), 439-450 Amiebenomo Hauwa Christiana
IJSIT (www.ijsit.com), Volume 4, Issue 5, September-October 2015
446
Figure 3: Plot showing Critical pressure drawdown Vs depth for intact rock formation.

et al., IJSIT, 2015, 4(5), 439-450 Amiebenomo Hauwa Christiana
IJSIT (www.ijsit.com), Volume 4, Issue 5, September-October 2015
447
Figure 4: Plot showing uniaxial compressive strength Vs Critical pressure drawdown for intact rock
formation.
Figure 5: Plot showing Critical pressure drawdown Vs depth for depleted reservoir.

et al., IJSIT, 2015, 4(5), 439-450 Amiebenomo Hauwa Christiana
IJSIT (www.ijsit.com), Volume 4, Issue 5, September-October 2015
448
MUD WINDOWS: Determination of safe mud weight window is critically important in order to avoid
instability problems. Mechanical properties of formations along with magnitude and direction of in-situ stress
are necessary parameters for evaluating the possibility. However, important role of an efficient failure
criterion should never be neglected.
Once a geomechanical model has been developed that quantifies the principal stress magnitudes and
orientations, the pore pressure, and the rock properties, it is possible to predict the amount of wellbore
instability as a function of mud weight and properties. This makes it possible to reduce drilling costs by
keeping lost time low and by designing wells just carefully enough to minimize problems without excessive
cost. A further benefit of considering geomechanical risk is that when problems are encountered, their causes
can be recognized and plans can be in place to mitigate their effects with minimal disruption of the drilling
schedule.
The result shows that the required mud weight should be between the collapse pressure (lower
bound) and the fracture pressure (upper bound). This is important to ensure a good wellbore stability and a
safe drilling process.
The result also shows the collapse & fracture gradients against inclination at a constant depth of
4500ft. the model tries to expand the mud weight window to enable you drill beyond 65o and even up to 90o
maximum.
From the result, the plot shows the principal stresses (stress 1, 2 3) acting on the well cavities. In
drilling, completion and production, three principal stresses have to be
accounted for, which are;
Vertical stress ( overburden stress)
Maximum horizontal stress ( stress1)
Minimum horizontal stress ( stress 3)
From the plot, the stress 2 represents the intermediate stress, since designed model considered stress in
3-Dimenions.
VALIDATING THE GEOMECHANICAL MODEL: It is important when using geomechanical analysis to use
prior drilling experience to validate the geomechanical model. This is possible, even when no log data are
available from previous wells, by using drilling events such as:
Mud losses

et al., IJSIT, 2015, 4(5), 439-450 Amiebenomo Hauwa Christiana
IJSIT (www.ijsit.com), Volume 4, Issue 5, September-October 2015
449
Tight spots
Places necessitating repeated reaming
Evidence of excessive or unusually large cuttings
If wellbore stability predictions for existing wells are capable of reproducing previous drilling
experience, we can be confident that the geomechanical model is appropriate for use in predicting the
stability of planned wells and also for selecting the best sand production control method. The sand control
model designed in this work was successfully test run with a pre drilled data set.
CONCLUSION
From the study done on the geomechanical design for sand control in the Niger Delta region, the
results obtained captures real time failure of the reservoir sand formations which is strongly affected by the
mud weight during drilling, impact of gunshot during perforation, completion methods and flow rate as well
as the confining pressure during production. High sand-free flow rates can be achieved if the sand formation
is mechanically confined (compacted). For unconsolidated sandstone formation containing heavy crude oil, it
is necessary to apply other sand control methods such as down-hole emulsification, gravel packing, or down-
hole solidification. According to the confining pressure results, shallow formation results in larger sand
production than those in deeper wells. Finally, producing a reservoir at rates between the critical rate and the
peak rate resulted in sand production decreasing towards a certain constant rate. Production at rate higher
than the peak rate results in excessive sand production which depends on the flow rate.
REFERENCES
1. Al‐Ajmi, A.M. (2006). Stability analysis of vertical borehole using the Mogi‐
Coulomb failure criterion. International Journal of Rock Mechanics and Mining Sciences, 1200‐1211.
2. Al-Awad, N.J. (1997). The Investigation of the Source of sand Produced from Competent Sandstone
Reservoirs. A Paper presented in Second Jordanian Conference on Mining, Amman. April 26-29, 1997, 393-
405.
3. Al-Awad, N.J. and Al-Misnad, Omar A. (1997). Rock Failure Criteria: A Key for Predicting Sand Free
Production Rate. Journalfor Egyptian Society of Engineers, 36, No 2, 1997, 53-58.
4. Anderson, E.M, (1951).The Dynamics of Faulting and Dyke Formation with Applications to Britain, 2nd
Edition, Penn Well Publisher, pp.674-700.
5. Anthony, J. L. and Crook, J. Y., 2002. Development of an orthotropic 3D elastoplastic material model for
shale. In: Proc SPE/ISRM Rock MechConf, Irving, Texas, October 2023. SPE 78238.

et al., IJSIT, 2015, 4(5), 439-450 Amiebenomo Hauwa Christiana
IJSIT (www.ijsit.com), Volume 4, Issue 5, September-October 2015
450
6. Appah, D. (1988). “New Gravel-Pack Technique Reduces Sand Production in Niger Delta Wells.” Oil & Gas
Journal, 44-46.
7. Aubertin, M., Li, L., and Simon, R., 2000. A multiaxial stress criterion for short- and longterm strength of
isotropic rock media. Int J Rock Mech Min Sci, 37[8], 1169-1193.
8. Barton, C.A. and Zoback, M.D. (1988) ״. Determination of In-situ Stress Orientation From Borehole Guided
Waves״, Journal of Geophysical Research,(August 1988), pp. 7834-7844.
9. Frederick, J., Deitrick, G., Arguello, J. and de RoufFignac, E. (1998) ״geomechanincs approach to mitigation
and reservoir management״, SPE 47284, SPE Annual Technical Conference, Colorado, Oct. 5-6.
10. Kristiansen, T. G., 2004. Drilling wellbore stability in the compacting and subsiding Valhall field. In: Proc
IADC/SPE Drilling Conf, Dallas, 2-4 March. SPE 87221.
11. Kristiansen, T.G., Meling, S. (1996). “A production parameter analysis of chalk influxes in the Valhall
field”. In: Proc. 5th North Sea Chalk Symposium, Reims.
12. Kulatilake, S. W., Malama, B., and Wang, J. (2001) “Physical and particle flow modeling of jointed rock
block behavior under uniaxial loading,” International Journal of Rock Mechanics andMining Sciences, vol.
38, no. 5, pp. 641–657.
13. Michelis, P., 1987b. True triaxial yielding and hardening of rock. J GeotechEngDiv ASCE, 113[6], 616-635.
14. Michelis, P., 1987b. True triaxial yielding and hardening of rock. J GeotechEngDiv ASCE, 113[6], 616-635.
15. Mirzahgorbanali, A. (2009). Well bore stability using Mogi‐
Coulomb failure criterion and ElastoPlastic model. Tehran, Iran: A Master project submitted to the Petrol
eum University of Technology.
16. Mitchell, R. F., Goodman, M. A., and Wood, E. T., 1987. Borehole stresses: plasticity and the drilled hole
effect. In: Proc IADC/SPE Drilling Conf, New Orleans, March 15-18. SPE 16053.
17. Mogi, K., 1967. Effect of the intermediate principal stress on rock failure. J Geophys Res, 72, 5117-5131.
18. Murrell, S. A. F., 1963. A criterion for brittle fracture of rocks and concrete under triaxial stress, and the
effect of pore pressure on the criterion. In: Proc 5th Symp Rock Mech, Minneapolis, University of
Minnesota, 563-577.
19. Oyeneyin, M. and Maceleod, C. (2005). “Intellegent Sand Management”, presented at the 29th annual SPE
International technical conference and exhibition, Abuja, Nigeria.