Embed Size (px)
Citation preview

Prepared Expressly for…
January 2021
San Pablo 2020 Year-end…
Annual Community Survey
Including Comparison of Opinion Leaders with the Mainstream
Strategy Research InstituteAn Institute for CONSENSUS BUILDING
WWW.SRI-CONSULTING.ORG800.224-7608

San Pablo Community Survey
January 2021
Research Design
Sample size: N=301N= 44 Opinion Leaders
Population surveyed: Community-at-large
Sampling Error: ±4.5 to 5.8%
Data Collection: January 18 thru 21, 2021

San Pablo is a great community…
I am happy to be a resident
Question 1.0: San Pablo is a great community; I am happy to be a resident.
Figure 1
San Pablo Community Survey
January 2021
53
38
3 42
0
10
20
30
40
50
60
70
80
90
100
Pe
rc
en
t
91%Agree
Opinion Leaders
95%
Agree
Strongly Somewhat Don’t Agree Somewhat Strongly
Agree or Disagree Disagree
6%Disagree
Dec 2019
83% Agree
Dec 201876% Agree
Oct 2017
86% Agree
Nov. 2016
85% Agree
Jan 2014
87% Agree

Question 2.0: Is there anything about the City of San Pablo that you
would like changed?
Desired Changesin the City of San Pablo
Issues Would Like Changed(Top 6, Rank-ordered based upon % of 69% who said YES)
20% Trash clean-up around the city
10% Address issue of homelessness
9% Crime (remain under control)
8% More police officers needed
7% Street & road maintenance
6% Traffic (too much, speeding)
(Refer to Questionnaire for entire list)
Figure 2
San Pablo Community Survey
January 2020
69%
YES
26%
NO5%Unsure/DK
/Ref

Figure 3
San Pablo Community Survey
January 2021
Question 3.0: Is there a Local Issue, or more than one issue, you are
especially concerned about as a resident of San Pablo?
Issues of concern(Top 5, Rank-ordered based upon % of 71% who said YES)
16% Trash clean-up around the City
15% Address issue of homelessness
7% Crime (remain under control)
6% Covid 19 Pandemic
6% More police officers needed
(Refer to Questionnaire for entire list)
Local Issues of Concern
40%
NO
71%
YES
24%
NO5%
Unsure/DK
/Ref
2019
55%YES
(Open-ended)

Figure 4
San Pablo Community Survey
January 2021
Question 4.0: I will read a list of local issues that may or may not be of
concern to local residents. After I read each one, please tell me whether
the issue is something that is of High concern, Some concern, or NO
Concern at all to you.
Q4.4 Improved street & road maintenance
Q4.3 Local economy & jobs
Q4.1 Crime (remain under control)
Q4.7 Quality of education
Q4.5 Local taxes & user fees
Q4.2 Emergency Medical Services
Q4.6 Fire protection services
Local Issues of Concern(Core Values)
High Concern + Some Concern
51
27
36
48
29
30
20
46
37
29
33
29
20 34
0 20 40 60 80 100
Percent
77
73
73
71
63
54
58

Figure 5A
San Pablo Community Survey
January 2021
Question 5.0: A new City Council, elected in November 2020, will soon be
developing an update to the City Council’s Priority Work Plan for fiscal year
2020-22. They would like to have benefit of your input as they approach this
important task. I will read a list of possible endeavors that are presently
under consideration. Please tell me whether you see this as being a high
priority, medium, low or NOT a priority at all.
Endeavors for 2020-22 Work Plan(Top 8 Rank-ordered)
Q5.8 Enhance the quality of education for local youth
Q5.4 Create programs for Homeless
Q5.3 Economic development toDiversify Local Economy
Q5.2 Enhance services & programs
for Local Youth
Q5.11 Enhance services for Seniors
Q5.9 Provide Affordable Housing
Q5.6 Enhance Workforce Development & Job Training
5.13 Create City-funded College Prep, Scholarships & Workforce Development
Programs for Local Youth
High Priority + Medium Priority
58
64
64
71
76
30
20
30
24
26
19
14
66
56
67 18
0 20 40 60 80 100
Percent
90
88
86
86
85
90
90
88

Figure 5B
San Pablo Community Survey
January 2021
Question 5.0: A new City Council, elected in November 2020, will soon be
developing an update to the City Council’s Priority Work Plan for fiscal year
2020-22. They would like to have benefit of your input as they approach this
important task. I will read a list of possible endeavors that are presently
under consideration. Please tell me whether you see this as being a high
priority, medium, low or NOT a priority at all.
Q5.10 Street maintenance/rehabilitation projects
Q5.1 Enhance Public Safety Training Programs & Technology
Infrastructure
Q5.5 Additional recreation facilities
Q5.12 New & improved City parks
Q5.7 Enhanced Telecom Services
Endeavors for 2020-22 Work Plan(Bottom 5 Rank-ordered)
High + Medium Priority
46
51
37
32
31
27
43
32
40 17
0 20 40 60 80 100
Percent
78
77
75
69
57

Figure 6
San Pablo Community Survey
January 2021
Question 6.0: Are there additional projects or endeavors that
you think the new City Council should incorporate into its
2020-22 Work Plan?
Additional Projects/Endeavors Constituents would Like included in 2020-22 Work Plan
Additional Projects(Top 6, Rank-ordered based upon
43% of those who said YES)
8% Address issue of homelessness
7% Trash clean-up around City
6% Better health care
6% Programs for youth
6% Crime (remain under control)6% Street & road maintenance
(Refer to Questionnaire for entire list)
43%
YES
51%
NO
6%Unsure/DK
/Ref

Question 7.0: As you know, the City provides many services to San Pablo
residents, including City street and park maintenance, programs and
services for local youth and seniors, public safety services (such as police
services), and many more. On whole, how satisfied are you with the
services presently being provided by and/or through the City?
Figure 7
San Pablo Community Survey
January 2021
24
38
26
11
10
10
20
30
40
50
60
70
80
90
100
Pe
rc
en
t
62%Satisfied
Opinion Leaders
50%
Satisfied
Extremely Slightly Neutral Slightly Extremely
Satisfied Ref Dissatisfied
12%Dissatisfied
2019
48%
Satisfied
Satisfaction with…
City-SponsoredServices & Programs

Question 8.0: Are there any additional services that you would
like the City to consider providing to residents throughout
the community?
Additional Services Constituents would Like Included in 2020-22 Work Plan
Additional Services(Top 4, Rank-ordered based upon
31% of those who said YES)
17% Crime (remain under control)15% Trash clean-up around the city
11% Better health care
8% Assistance for seniors(Refer to Questionnaire for entire list)
Figure 8
San Pablo Community Survey
January 2021
31%
YES
57%
NO
12%Unsure/DK
/Ref

Has Crime in the City
IMPROVED (LESS CRIME),
GOTTEN WORSE, OR NO CHANGE?
Question 9.0: Public safety is, without question, one of the top concerns
among residents in any community, San Pablo is no exception. In your
opinion, has CRIME in San Pablo…
Figure 9
San Pablo Community Survey
January 2021
27%Little
Change
18%
Gotten Worse
7%Unsure/DK
/Ref
48%
Improved(less crime)
Opinion Leaders
50%Improved
14%Gotten worse
32%Little change
From 2018
32%
Improved(less crime)

Figure 10
San Pablo Community Survey
January 2021
Should the City…
Invest in New Technologiesto Enhance Public Safety?
Question 10.0: San Pablo City Council has invested thousands of dollars into
a new City-wide camera surveillance technology, body worn cameras, and
new DRONE technology for its Police Department, which has assisted in
reducing violent crime substantially, increased law
Do you AGREE or DISAGREE with the notion that the City should continue to
invest in new technologies to enhance public safety throughout the
community? And would that be…
Strongly Somewhat Don’t agree/ Somewhat StronglyAgree Disagree Disagree
68
157 6
40
10
20
30
40
50
60
70
80
90
100
Pe
rce
nt
83%
Agree
10%
Disagree
Opinion Leaders
77%
Agree
From 2018
82%
Agree

Figure 11
San Pablo Community Survey
January 2021
Do You Support…
Construction & Developmentof New Police Department &
Regional Law Enforcement Training Center?
Question 11.0: Do you support the construction and development of a new
Police Department, combined with a Regional Law Enforcement Training
Center?
47%Definitely
YES
6%
Probably
NO
9%Unsure
17%
Definitely
NO
Potential
Support
68%55% OpLead
21% Probably
YES

Figure 12
San Pablo Community Survey
January 2021
Question 12.0: The San Pablo Police Department has a number of
community policing programs to help combat crime, divert youth from
at-risk behaviors, encourage police engagement, and improve crime
reporting. Should these be kept or eliminated?
Community Policing Program Keep Eliminate
Q12.3 Youth At-Risk Programs 85% 5%
Q12.4 Neighborhood Watch Programs 81% 13%
Q12.6 Loving Solutions 80% 8%
Q12.5 Business Crime Prevention Program 78% 9%
Q12.7 Police Cadet Program 73% 10%
Q12.1 School Resource Officers (JEWL)Juvenile Education Welfare Liaison
66% 23%
Q12.2 San Pablo Police Citizen Academy 64% 12%
Q12.8 Police Explorers Program 62% 10%
Keep or Eliminate the Following
Community Policing Programs(Rank-ordered)

Question 13.1 Before this telephone interview, had you heard of fiber optics
or Municipal Broadband?
40%
Yes56%
No
Have You Heard of…
Fiber Optics or
Municipal Broadband?
Figure 13A
San Pablo Community Survey
January 2021
4%Unsure/DK
/Ref
43%
Yes
53%
No
From 2018
60%
YES

Figure 13B
San Pablo Community Survey
January 2021
Likely ‘Take Rate’Question13.2: Based upon the description I just gave you for a City-owned,
public Municipal Broadband fiber optics network AND a future City-wide
5G public wireless network, how likely is it that you will SWITCH from your
present provider of Internet services (including your television, internet and
perhaps telephone), specifically Comcast Cable or AT&T when it is made
available to you through the City of San Pablo?
Likely Take Rate TodayMinimum
Take RageLikely
Take RatePotentialTake Rate
41%51.5% to
55.7%62%
100%
of Highly Likely
To Switch
100% of Highly Likely
Plus 50% to 70% of
Somewhat Likely to Switch
100% of Highly Likely
Plus 100% of Somewhat
Likely to Switch
50
70
90
Nov. 2014 June. 2016 Oct. 2017 Dec. 2018 Dec. 2019
Perc
enta
ge
Likely Take Rate Over Time
Range 50 to 56%
Range 59 to 67%Range 71 to 77%
Range 53 to 59%Range 65 to 74

Figure 14A
San Pablo Community Survey
January 2021
Do You Support Partnering with the…
West Contra Costa Unified
SCHOOL DISTRICT
for Wi-Fi Connectivity?
Question 14.1: City officials are committed to playing a central role in
ensuring that San Pablo residents, especially local youth, have access to
these technological enhancements. Toward that end, City officials are
considering entering into partnerships with the following two entities; the
West Contra Costa Unified School District AND/OR San Pablo branch of the
Contra Costa County Library. Both endeavors would be intended to
promote academic enrichment for local youth AND help close the digital
divide in San Pablo.
10%Do NotPursue
63%Strongly
Encourage
20%Somewhat Encourage
Unsure/
Refused
7%
Encourage
83%96% OpLead

Figure 14B
San Pablo Community Survey
January 2021
Do You Support Partnering with the…
San Pablo Branch County
LIBRARY
for Wi-Fi Connectivity?
Question 14.2: City officials are committed to playing a central role in
ensuring that San Pablo residents, especially local youth, have access to
these technological enhancements. Toward that end, City officials are
considering entering into partnerships with the following two entities; the
West Contra Costa Unified School District AND/OR San Pablo branch of the
Contra Costa County Library. Both endeavors would be intended to
promote academic enrichment for local youth AND help close the digital
divide in San Pablo.
8%Do NotPursue
67%Strongly
Encourage
14%SomewhatEncourage
11%Unsure/Refused
Encourage
81%100% OpLead

Question 14.3: City officials are committed to playing a central role in
ensuring that San Pablo residents, especially local youth, have access to
these technological enhancements. Toward that end, City officials are
considering entering into partnerships with the following two entities; the
West Contra Costa Unified School District AND/OR San Pablo branch of the
Contra Costa County Library. Both endeavors would be intended to
promote academic enrichment for local youth AND help close the digital
divide in San Pablo.
Figure 14C
San Pablo Community Survey
January 2021
Do You Support Partnering with the…
BOTH
the School District AND the Library?
64%Strongly
Encourage
24%Somewhat Encourage7%
Unsure/
Refused5%
Do NOT
Pursue
Encourage
88%100% OpLead

Question 15.1 Would you support a full-service park with a number of park
features or amenities including, but not necessarily limited to, the
following: an amphitheater, playground, tot-lot areas, restroom facilities,
baseball fields, basketball courts, barbeque areas, benches, and picnic
areas?
Support for…
Full Service Parkat 2600 Moraga/El Portal Recreation Field?
Figure 15A
San Pablo Community Survey
January 2021
40%
Yes56%
No2%
Unsure/DK
/Ref
82%
Yes
16%
No
YES
91%OpLead

Question 15.2 Would you support a community park that includes one or
more regulation-size adult soccer fields, similar in scale to the soccer
fields already provided at the Rumrill Blvd. Sports Field Park?
Figure 15B
San Pablo Community Survey
January 2021
Support for…
Community Parkat 2600 Moraga/El Portal Recreation Field?
40%
Yes56%
No9%Unsure/DK
/Ref
67%
Yes
24%
No
YES
82%OpLead

Question 15.3 Would you support a combination of both a full-service park
with amenities described above, plus a regulation-sized adult soccer
field for residents and soccer enthusiasts?
Figure 15C
San Pablo Community Survey
January 2021
Support for…
Combinationof BOTH Types of Parks (including Regulation-sized Soccer Field)
40%
Yes56%
No7%Unsure/DK
/Ref
70%
Yes
23%
No
YES
86%OpLead

Figure 16A
San Pablo Community Survey
January 2021
Do You Support funding for…
College Prep, Workforce Development
& Scholarships for Local Youth?
Question 16.1: In order to provide funding for such a program, would you vote
YES or NO on an Initiative, if placed on the local ballot, wherein the monies
from this funding Measure would be dedicated to such a program?
45%Definitely
YES
21% Probably
YES5%
Probably
NO
9%Unsure 15%
Depends onAmount
Likely Support
100% Definitely
+ 50% Probably
SRI’s Go, No-Go
55.5%63.5% OpLead
5%Definitely
NO
PotentialSupport
66%
77% OpLead
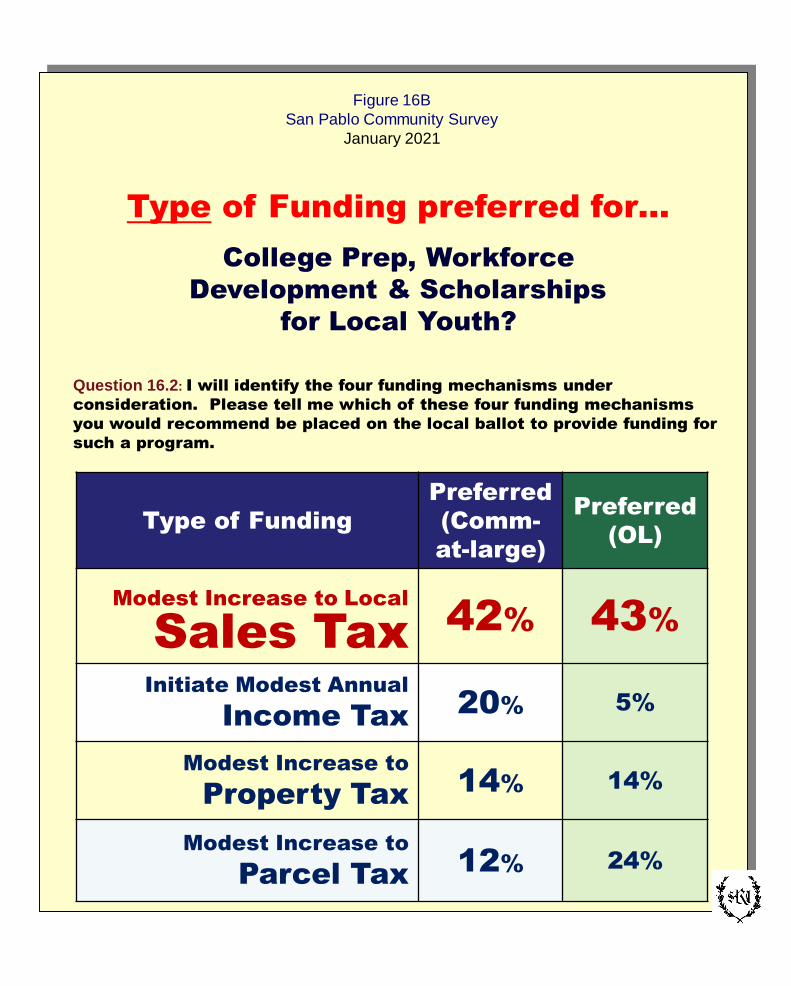
Figure 16B
San Pablo Community Survey
January 2021
Question 16.2: I will identify the four funding mechanisms under
consideration. Please tell me which of these four funding mechanisms
you would recommend be placed on the local ballot to provide funding for
such a program.
Type of Funding
Preferred
(Comm-
at-large)
Preferred
(OL)
Modest Increase to Local
Sales Tax 42% 43%
Initiate Modest Annual
Income Tax 20% 5%
Modest Increase to
Property Tax 14% 14%
Modest Increase to
Parcel Tax 12% 24%
Type of Funding preferred for…
College Prep, Workforce
Development & Scholarships
for Local Youth?

Satisfaction With…
Level of Waste Disposal and
Trash Removal Services
Question 17.1: How satisfied are you with the level of waste disposal and
trash removal services presently being provided through the City of San
Pablo?
Extremely Somewhat Neutral/ Somewhat ExtremelySatisfied Refused Dissatisfied
3037
12 147
0
10
20
30
40
50
60
70
80
90
100
Pe
rce
nt
67%
Satisfied
21%
Dissatisfied
Opinion Leaders
68%
Satisfied
Figure 17A
San Pablo Community Survey
January 2021

Figure 17B
San Pablo Community Survey
January 2021
Question 17.2: I will list several waste disposal and trash removal services
that are presently being provided to San Pablo residents; after I read each
one, please tell me whether or not you were AWARE of this service prior
to today’s interview?
Service Aware
Dumpster Days 56%
Free Hazardous Household Waste Drop-off 48%
Curbside Bulky Item Collection(limited to 1 large item)
45%
Extra Curbside Collection Services(limited to 15 garbage bags)
41%
Free Mattress Recycling 37%
Dump Voucher Program 33%
AWARE of Specific Waste Disposal
and Trash Removal Services

Figure 17C
San Pablo Community Survey
January 2021
Question 17.3: I will read the list of waste disposal and trash removal
services one more time. After I read each one, please tell me if you use
this service routinely, from time-to-time, or never.
USAGE of these Waste Disposal and Trash Removal Services
Service Use
Routinely
Use
Time-
to-
Time
Never
Dumpster Days 10% 27% 63%
Free Hazardous Household Waste
Drop-off9% 19% 71%
Dump Voucher Program 8% 20% 70%
Curbside Bulky Item Collection(limited to 1 large item)
6% 18% 76%
Extra Curbside Collection Services(limited to 15 garbage bags)
6% 12% 82%
Free Mattress Recycling 2% 12% 82%

Friend or Neighbor
U.S. Mail
City’s E-newsletter
Other
Social Media
Republic Services
Visiting City Hall
Sources of Information for Waste Disposal & Trash Removal Services
Source for Securing Information
Often + Some
2
2
9
10
14
14
14
16
0 5 10 15 20 25 30 35 40 45 50
Percent
Question 17.4:
Figure 17D
San Pablo Community Survey
January 2021
#1 Medium for
Opinion Leaders
18%
Social Media

Question 17.5 Would you like to receive information about the waste-
reduction programs that are presently being provided through the City?
Would You Like to Receive
More Informationabout Waste-Reduction Programs?
Figure 17E
San Pablo Community Survey
January 2021
40%
Yes56%
No
64%
Yes
36%
No

How Would You Like to ReceiveInformation About Waste Disposal &
Trash Removal Services?
U.S. Mail
in Garbage Bill
Other 3
18
32
46
0 20 40 60
Percent
Question 17.6:
Figure 17F
San Pablo Community Survey
January 2021

Question 18.0 Would you be willing to pay slightly higher garbage rates in
order to make it possible for the City to provide additional Citywide litter
removal services and address illegal dumping throughout San Pablo?
Would You Be Willing to Pay
Higher Ratesfor Additional Citywide Litter Removal Services
and to Address Illegal Dumping?
Figure 17G
San Pablo Community Survey
January 2021
40%
Yes56%
No
10%Unsure/DK
/Ref
40%
Yes
50%
No

$10/year
$20/year
$30/year
More than $30/year
How Much Would You Payfor Additional Clean-up Services?
10
20
23
40
0 20 40 60 80 100
Percent
Question 18.1 To make it possible for the City to provide additional clean-up
services, would you be willing to pay an additional…
Figure 17H
San Pablo Community Survey
January 2021
53%
Of the 40% who are
willing to pay more/yr.
Are Willing to Pay
$20 more/yr.
(Based upon 40% who said YES)

Thank You
We’ll be pleased to
Take Questions Now

Demographics
of Survey Respondents
Length of Residency
0 to 5 years 26%
6 to 10 17%
11 to 25 29%
Over 25 years 27%
Refused 21%
Age
18 to 30 21%
31 to 40 19%
41 to 50 14%
51 to 65 24%
Over 65 years 21%
Refused 1%
Household Income
Under $25,000 15%
$25,001 to $50,000 17%
$50,001 to $75,000 20%
$75,001 to $100,000 13%
Over $100,000 17%
Refused 18%
Education
Less than High School 2%
High School/Trade School 21%
Some College 33%
College Graduate 29%
Graduate/Prof. School 15%Ethnicity
Caucasian 33%
Hispanic/Latino 28%
African American/Black 17%
Native American/Alaskan 0%
Native Hawaiian & other
Pacific Islander 2%
Asian 11%
Other 9%
Gender
Male 43%
Female 57%
Ideology
Liberal 27%
Progressive 14%
Moderate 27%
Conservative 15%
Refused 17%
Home Ownership
Own 62%
Rent 35%
Refused 3%
Figure 18A
San Pablo Community Survey
January 2021
Demographics
of Survey Respondents
Length of Residency
0 to 5 years 19%
6 to 10 21%
11 to 25 31%
Over 25 years 29%
Refused 0%
Age
18 to 30 17%
31 to 40 19%
41 to 50 15%
51 to 65 21%
Over 65 years 27%
Refused 1%
Household Income
Under $25,000 15%
$25,001 to $50,000 16%
$50,001 to $75,000 27%
$75,001 to $100,000 15%
Over $100,000 12%
Refused 15%
Education
Less than High School 3%
High School/Trade School 17%
Some College 38%
College Graduate 31%
Graduate/Prof. School 10%
Refused 1%
Ethnicity
Caucasian 22%
Hispanic/Latino 33%
African American/Black 23%
Native American/Alaskan 2%
Native Hawaiian & other
Pacific Islander 0%
Asian 11%
Other 3%
Refused 6%
Gender
Male 39%
Female 61%
Ideology
Liberal 26%
Progressive 24%
Moderate 20%
Conservative 17%
Refused 13%
Home Ownership
Own 58%
Rent 41%
Refused 1%
Figure 18A
San Pablo Community Survey
January 2021

Demographics
of Survey Respondents
Figure 18A
San Pablo Community Survey
January 2021
Demographics
of Survey Respondents
Figure 18B
San Pablo Community Survey
January 2021
# School Aged Children
None 66%
One 18%
Two 10%
Three or more 6%
Refused 0%
Registered to Vote
Yes 97%
No 3%
Party ID
Democrat 57%
Republican 7%
Independent 19%
Other 10%
Refused 7%
Area of Residence
East I80/San Pablo Hills 9%
Old Town 10%
N San Pablo, Leroy Heights
Contra Costa College 48%
West I80, Casino Hospital
Area, City Hall 27%
Refused 6%