Embed Size (px)
Citation preview
SAN FRANCISCO
Transportation Sustainability Fee: Economic Feasibility Study
Prepared for
San Francisco Planning Department
Prepared by
Seifel Consulting
Spring 2015
San Francisco Transportation Sustainability Fee: Economic Feasibility Study
Page 1
I. Introduction The Association of Bay Area Governments (ABAG) estimates that the City of San Francisco will add 190,000 jobs and 100,000 households by 2040.1 Much of this growth is already occurring – projects aimed at creating housing for upwards of 60,000 new residents are currently under construction or are being reviewed. More housing and more jobs means more travelers using the City’s roads and transit lines, further straining the City’s already-‐congested and overtaxed transportation system. To offset the impact of new development, San Francisco needs to invest in updated infrastructure, including transportation system improvements. In 2013, Mayor Edwin M. Lee convened a Transportation Task Force to investigate what San Francisco can do to update its transportation network and to prepare it for future travelers. The Task Force found that in order to meet current need and future demand, the City would need to invest $10 billion in transportation infrastructure through 2030, which will require $6.3 billion in new revenues.2
The Transportation Sustainability Program (TSP) is an initiative to improve and expand San Francisco’s transportation system. This economic feasibility study presents findings of an economic evaluation of the potential impact of the proposed TSP on new development in San Francisco. The Transportation Sustainability Fee (TSF), the TSP component examined in this study, is a proposed citywide impact fee that will help fund new transit, bicycle and pedestrian improvement projects as well as capital maintenance. The TSF would provide additional revenue to help fill the City’s transportation funding gap and ensure that new developments pay their fair share for impacts on the City’s transportation system. Another TSP component examined in this study is the reform of the California Environmental Quality Act (CEQA) review process, which has the potential to enhance the City’s ability to deliver new development in a more reliable, timely and cost efficient manner.
San Francisco is currently experiencing a surge in residential and commercial real estate construction and absorption, after a significant recessionary period that ended in 2012. Increased demand from both business expansion and new residents, combined with the relatively slow pace of development that has occurred for more than a decade, has contributed to rapidly escalating sales prices and rental rates. Recognizing the need for new development (particularly housing development) to meet the needs of a growing population and to ensure that prices do not continue to escalate to unsustainable levels, the goal of this study is to evaluate and inform the development of the TSP to ensure that the program will not impair development feasibility overall.
This report presents the following information:
I. Introduction– describes the purpose of the study and its organization. II. Summary of Findings– summarizes the results of the economic feasibility analysis. III. Description of Proposed Transportation Sustainability Program– provides an overview of the
TSP and its three interrelated components: the Transportation Sustainability Fee (TSF), which will replace the current Transit Impact Development Fee (TIDF), California Environmental Quality Act (CEQA)/ Level of Service (LOS) reform, and Citywide Transportation Demand Management (TDM).
1 Association of Bay Area Governments, Projections 2013. 2 For more information on the Mayor’s 2030 Transportation Task Force, please visit: http://transportation2030.sfplanning.org
San Francisco Transportation Sustainability Fee: Economic Feasibility Study
Page 2
IV. Study Goals and Methodology– presents the key goals for the study, along with a summary of the analysis methodology, including the selection of ten prototypical developments (prototypes) for evaluation.
V. Cost and Time Savings from CEQA / Level of Service Reform– describes the potential cost and time savings for environmental review that may occur with the TSP and analyzes what savings may occur for the ten development prototypes with TSP.
VI. Results From Analysis of Base Case TSF Levels– presents the financial results, assuming the TSF would be established at the fee rates listed in the 2012 Draft TSF Ordinance (after adjusting for inflation, to 2015 dollars) and assuming the proposed consolidation of non-‐residential fee categories, as described in the 2015 San Francisco Transportation Sustainability Fee Nexus Study. (For purposes of this study, these fee rates are referred to as “Base Case TSF.”)
VII. Sensitivity Analysis of Alternative TSF Levels– compares the financial results, assuming alternative TSF levels at 125 percent (%), 150% and 250% of the Base Case TSF (2012 Draft TSF Ordinance levels inflated to 2015 Dollars).
VIII. Conclusion
San Francisco Transportation Sustainability Fee: Economic Feasibility Study
Page 3
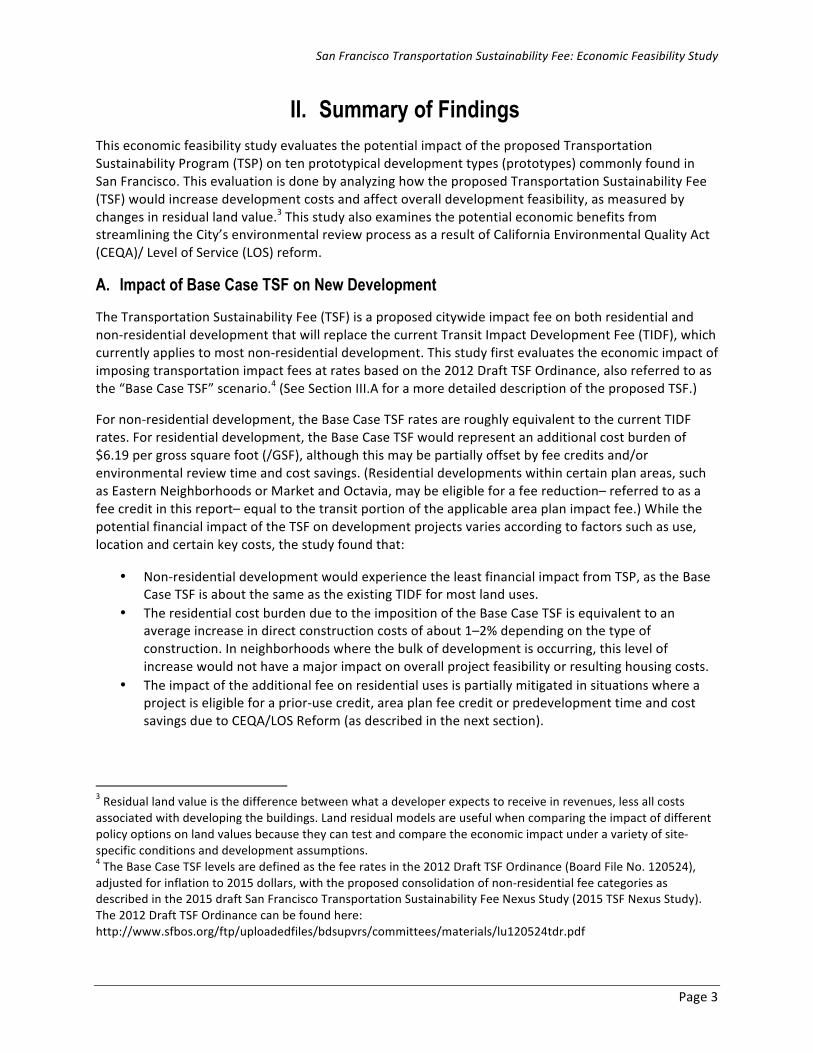
II. Summary of Findings This economic feasibility study evaluates the potential impact of the proposed Transportation Sustainability Program (TSP) on ten prototypical development types (prototypes) commonly found in San Francisco. This evaluation is done by analyzing how the proposed Transportation Sustainability Fee (TSF) would increase development costs and affect overall development feasibility, as measured by changes in residual land value.3 This study also examines the potential economic benefits from streamlining the City’s environmental review process as a result of California Environmental Quality Act (CEQA)/ Level of Service (LOS) reform.
A. Impact of Base Case TSF on New Development
The Transportation Sustainability Fee (TSF) is a proposed citywide impact fee on both residential and non-‐residential development that will replace the current Transit Impact Development Fee (TIDF), which currently applies to most non-‐residential development. This study first evaluates the economic impact of imposing transportation impact fees at rates based on the 2012 Draft TSF Ordinance, also referred to as the “Base Case TSF” scenario.4 (See Section III.A for a more detailed description of the proposed TSF.)
For non-‐residential development, the Base Case TSF rates are roughly equivalent to the current TIDF rates. For residential development, the Base Case TSF would represent an additional cost burden of $6.19 per gross square foot (/GSF), although this may be partially offset by fee credits and/or environmental review time and cost savings. (Residential developments within certain plan areas, such as Eastern Neighborhoods or Market and Octavia, may be eligible for a fee reduction– referred to as a fee credit in this report– equal to the transit portion of the applicable area plan impact fee.) While the potential financial impact of the TSF on development projects varies according to factors such as use, location and certain key costs, the study found that:
• Non-‐residential development would experience the least financial impact from TSP, as the Base Case TSF is about the same as the existing TIDF for most land uses.
• The residential cost burden due to the imposition of the Base Case TSF is equivalent to an average increase in direct construction costs of about 1–2% depending on the type of construction. In neighborhoods where the bulk of development is occurring, this level of increase would not have a major impact on overall project feasibility or resulting housing costs.
• The impact of the additional fee on residential uses is partially mitigated in situations where a project is eligible for a prior-‐use credit, area plan fee credit or predevelopment time and cost savings due to CEQA/LOS Reform (as described in the next section).
3 Residual land value is the difference between what a developer expects to receive in revenues, less all costs associated with developing the buildings. Land residual models are useful when comparing the impact of different policy options on land values because they can test and compare the economic impact under a variety of site-‐specific conditions and development assumptions. 4 The Base Case TSF levels are defined as the fee rates in the 2012 Draft TSF Ordinance (Board File No. 120524), adjusted for inflation to 2015 dollars, with the proposed consolidation of non-‐residential fee categories as described in the 2015 draft San Francisco Transportation Sustainability Fee Nexus Study (2015 TSF Nexus Study). The 2012 Draft TSF Ordinance can be found here: http://www.sfbos.org/ftp/uploadedfiles/bdsupvrs/committees/materials/lu120524tdr.pdf
San Francisco Transportation Sustainability Fee: Economic Feasibility Study
Page 4
• In neighborhoods where current market rent and/or sales prices are not high enough to warrant development investment, the TSF will further inhibit the ability of new development to become financially feasible. However, the TSF itself will not cause these developments to be infeasible.
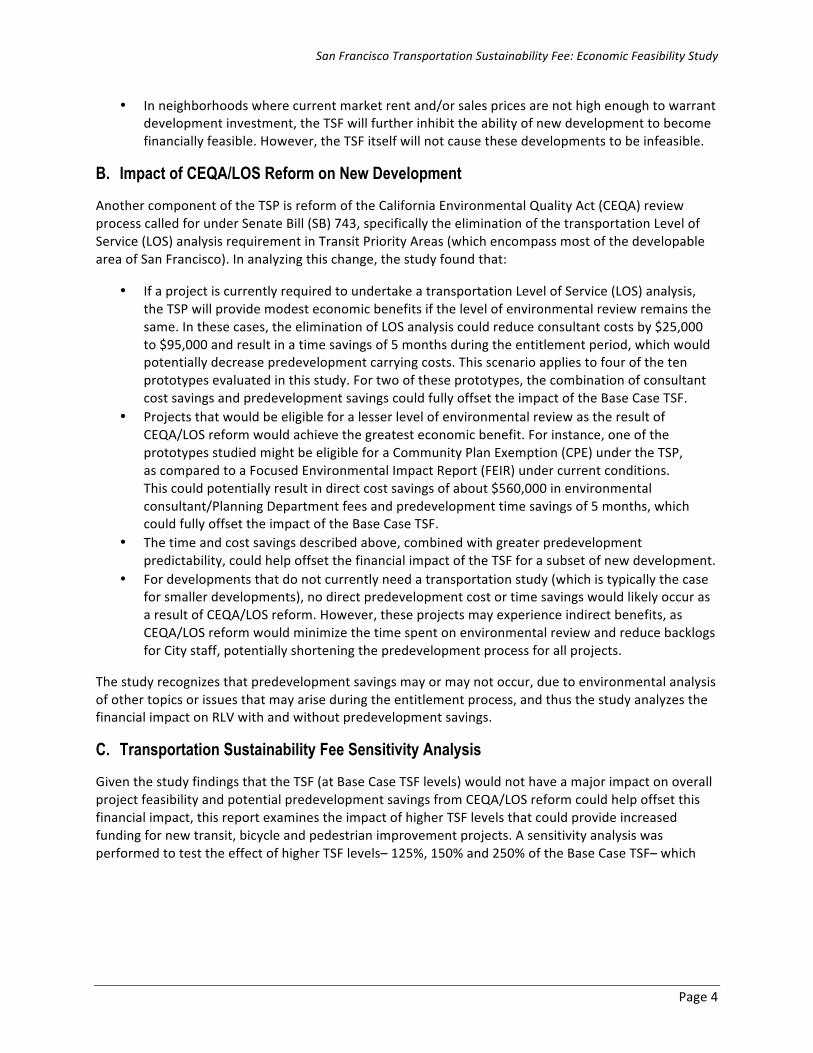
B. Impact of CEQA/LOS Reform on New Development
Another component of the TSP is reform of the California Environmental Quality Act (CEQA) review process called for under Senate Bill (SB) 743, specifically the elimination of the transportation Level of Service (LOS) analysis requirement in Transit Priority Areas (which encompass most of the developable area of San Francisco). In analyzing this change, the study found that:
• If a project is currently required to undertake a transportation Level of Service (LOS) analysis, the TSP will provide modest economic benefits if the level of environmental review remains the same. In these cases, the elimination of LOS analysis could reduce consultant costs by $25,000 to $95,000 and result in a time savings of 5 months during the entitlement period, which would potentially decrease predevelopment carrying costs. This scenario applies to four of the ten prototypes evaluated in this study. For two of these prototypes, the combination of consultant cost savings and predevelopment savings could fully offset the impact of the Base Case TSF.
• Projects that would be eligible for a lesser level of environmental review as the result of CEQA/LOS reform would achieve the greatest economic benefit. For instance, one of the prototypes studied might be eligible for a Community Plan Exemption (CPE) under the TSP, as compared to a Focused Environmental Impact Report (FEIR) under current conditions. This could potentially result in direct cost savings of about $560,000 in environmental consultant/Planning Department fees and predevelopment time savings of 5 months, which could fully offset the impact of the Base Case TSF.
• The time and cost savings described above, combined with greater predevelopment predictability, could help offset the financial impact of the TSF for a subset of new development.
• For developments that do not currently need a transportation study (which is typically the case for smaller developments), no direct predevelopment cost or time savings would likely occur as a result of CEQA/LOS reform. However, these projects may experience indirect benefits, as CEQA/LOS reform would minimize the time spent on environmental review and reduce backlogs for City staff, potentially shortening the predevelopment process for all projects.
The study recognizes that predevelopment savings may or may not occur, due to environmental analysis of other topics or issues that may arise during the entitlement process, and thus the study analyzes the financial impact on RLV with and without predevelopment savings.
C. Transportation Sustainability Fee Sensitivity Analysis
Given the study findings that the TSF (at Base Case TSF levels) would not have a major impact on overall project feasibility and potential predevelopment savings from CEQA/LOS reform could help offset this financial impact, this report examines the impact of higher TSF levels that could provide increased funding for new transit, bicycle and pedestrian improvement projects. A sensitivity analysis was performed to test the effect of higher TSF levels– 125%, 150% and 250% of the Base Case TSF– which
San Francisco Transportation Sustainability Fee: Economic Feasibility Study
Page 5
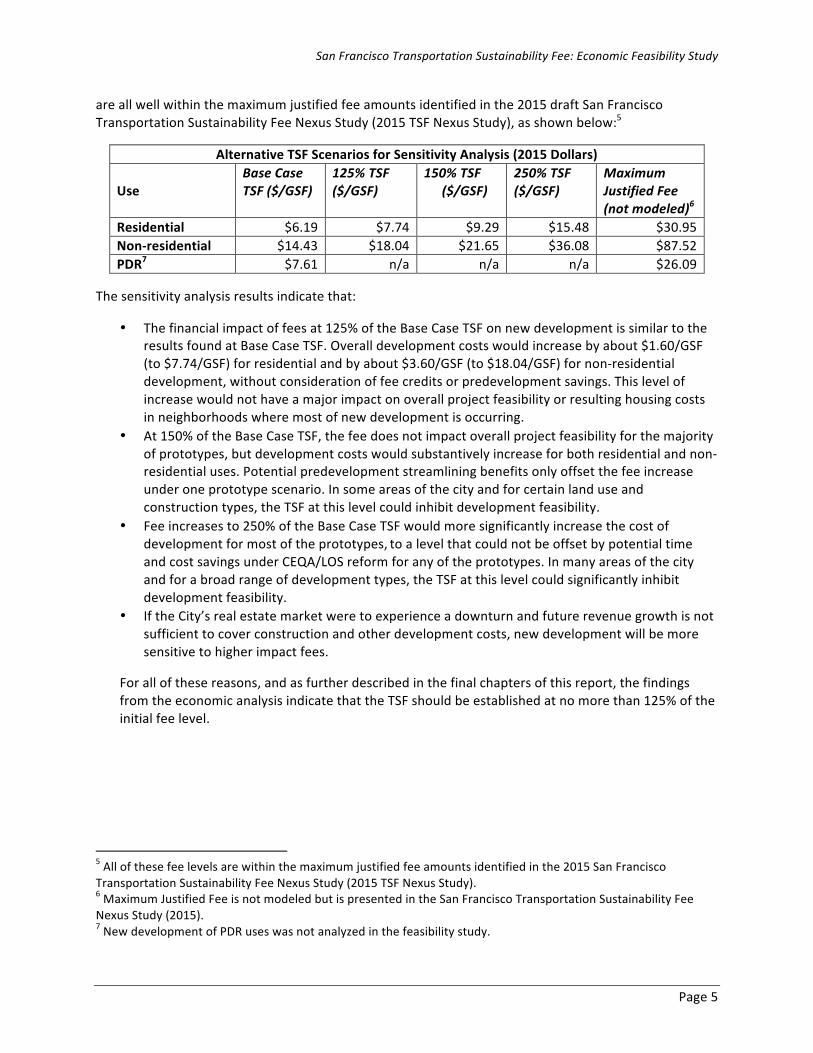
are all well within the maximum justified fee amounts identified in the 2015 draft San Francisco Transportation Sustainability Fee Nexus Study (2015 TSF Nexus Study), as shown below:5
Alternative TSF Scenarios for Sensitivity Analysis (2015 Dollars)
Use Base Case TSF ($/GSF)
125% TSF ($/GSF)
150% TSF ($/GSF)
250% TSF ($/GSF)
Maximum Justified Fee (not modeled)6
Residential $6.19 $7.74 $9.29 $15.48 $30.95 Non-‐residential $14.43 $18.04 $21.65 $36.08 $87.52 PDR7 $7.61 n/a n/a n/a $26.09
The sensitivity analysis results indicate that:
• The financial impact of fees at 125% of the Base Case TSF on new development is similar to the results found at Base Case TSF. Overall development costs would increase by about $1.60/GSF (to $7.74/GSF) for residential and by about $3.60/GSF (to $18.04/GSF) for non-‐residential development, without consideration of fee credits or predevelopment savings. This level of increase would not have a major impact on overall project feasibility or resulting housing costs in neighborhoods where most of new development is occurring.
• At 150% of the Base Case TSF, the fee does not impact overall project feasibility for the majority of prototypes, but development costs would substantively increase for both residential and non-‐residential uses. Potential predevelopment streamlining benefits only offset the fee increase under one prototype scenario. In some areas of the city and for certain land use and construction types, the TSF at this level could inhibit development feasibility.
• Fee increases to 250% of the Base Case TSF would more significantly increase the cost of development for most of the prototypes, to a level that could not be offset by potential time and cost savings under CEQA/LOS reform for any of the prototypes. In many areas of the city and for a broad range of development types, the TSF at this level could significantly inhibit development feasibility.
• If the City’s real estate market were to experience a downturn and future revenue growth is not sufficient to cover construction and other development costs, new development will be more sensitive to higher impact fees.
For all of these reasons, and as further described in the final chapters of this report, the findings from the economic analysis indicate that the TSF should be established at no more than 125% of the initial fee level.
5 All of these fee levels are within the maximum justified fee amounts identified in the 2015 San Francisco Transportation Sustainability Fee Nexus Study (2015 TSF Nexus Study). 6 Maximum Justified Fee is not modeled but is presented in the San Francisco Transportation Sustainability Fee Nexus Study (2015). 7 New development of PDR uses was not analyzed in the feasibility study.
San Francisco Transportation Sustainability Fee: Economic Feasibility Study
Page 6
III. Description of Proposed Transportation Sustainability Program The Transportation Sustainability Program (TSP) is an initiative intended to improve and expand San Francisco’s transportation system, which will help to keep people moving as the City grows. Today, San Francisco’s streets are congested while transit lines are already at or near capacity, with record numbers of riders traveling on Muni, BART and Caltrain. If San Francisco does not change its current development practices and invest in transportation improvements citywide, future development could result in unprecedented traffic gridlock on San Francisco’s streets and overcrowding on San Francisco’s buses and trains. Without investing in transportation infrastructure, San Francisco will have more than 600,000 vehicles added to its streets every day by 2040, which is more traffic than all the vehicles traveling each day on the Bay Bridge and Golden Gate Bridge combined.8 Caltrain ridership has grown by 60% in the last decade. Ridership on Muni is projected to increase by 300,000 trips per day (or 43%) by 2040.9 Significant design measures need to be implemented to make it safer for cyclists and pedestrians to navigate San Francisco’s heavily-‐trafficked streets.
The TSP will help fund transportation improvements so San Francisco’s streets are safer and less congested and minimize new development’s impact on the transportation system. Further, the TSP will help improve environmental performance from development by shifting trips away from cars to less polluting modes of transportation.
The TSP project goals include:
• Make it easier to safely, reliably and comfortably travel to get to work, school, home and other destinations.
• Help manage traffic congestion and crowding on local and regional transit. • Improve air quality and reduce greenhouse gas emissions • Enhance the safety of everyone’s travel, no matter which mode of transportation they choose.
To help achieve these goals, the TSP seeks to:
• Enhance Transportation to Support Growth: Fund citywide transportation improvements, including the addition of Muni buses and trains, helping to accommodate new residents and new members of the workforce.
• Modernize Environmental Review: Make the review process align with the City’s longstanding environmental policies by changing how the City analyzes the impacts of new development on the transportation system under CEQA. The new practices will be more reliable and will emphasize travel options that create less traffic.
• Encourage Sustainable Travel: Make it easier for new residents, visitors and workers to get to their destination by means other than driving alone, and by integrating environmentally friendly travel options into new developments. New practices will provide on-‐site amenities so that people have options other than driving their cars by themselves (such as car-‐sharing and shuttle services).
The TSP consists of three policy components: 1) the Transportation Sustainability Fee (TSF), which will replace the current Transit Impact Development Fee (TIDF); 2) California Environmental Quality Act
8 San Francisco County Transportation Agency, San Francisco Transportation Plan 2040. 9 Ibid.
San Francisco Transportation Sustainability Fee: Economic Feasibility Study
Page 7
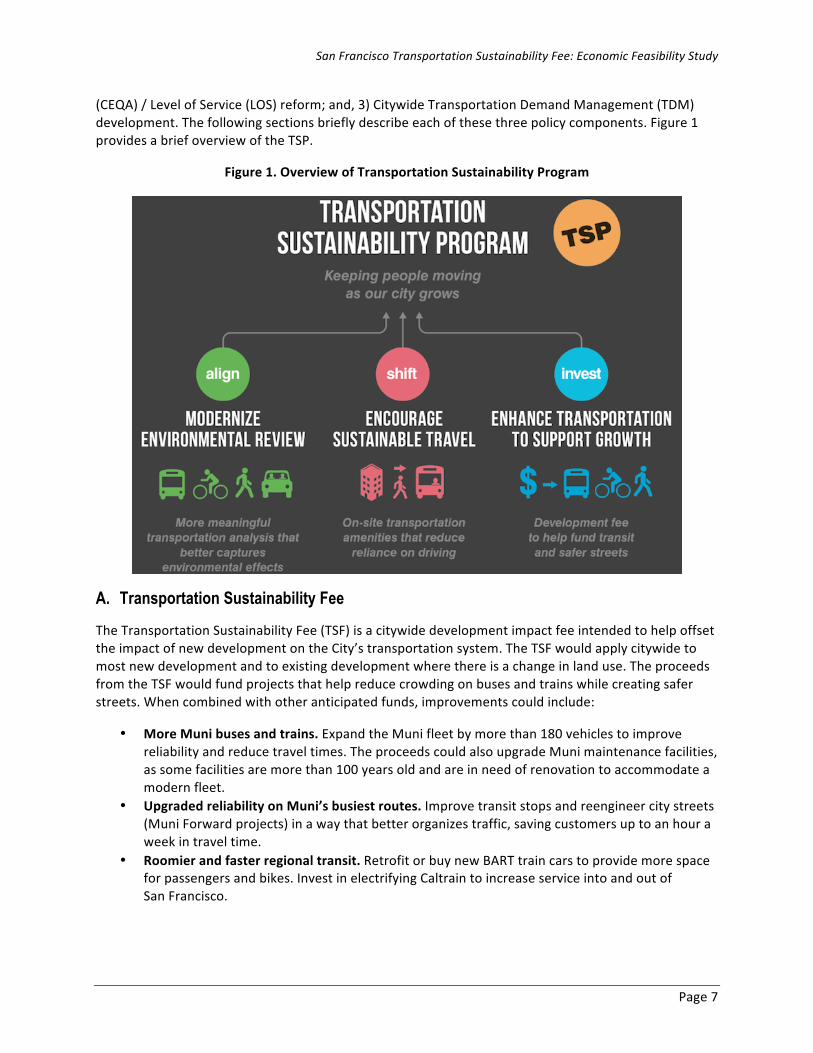
(CEQA) / Level of Service (LOS) reform; and, 3) Citywide Transportation Demand Management (TDM) development. The following sections briefly describe each of these three policy components. Figure 1 provides a brief overview of the TSP.
Figure 1. Overview of Transportation Sustainability Program
A. Transportation Sustainability Fee
The Transportation Sustainability Fee (TSF) is a citywide development impact fee intended to help offset the impact of new development on the City’s transportation system. The TSF would apply citywide to most new development and to existing development where there is a change in land use. The proceeds from the TSF would fund projects that help reduce crowding on buses and trains while creating safer streets. When combined with other anticipated funds, improvements could include:
• More Muni buses and trains. Expand the Muni fleet by more than 180 vehicles to improve reliability and reduce travel times. The proceeds could also upgrade Muni maintenance facilities, as some facilities are more than 100 years old and are in need of renovation to accommodate a modern fleet.
• Upgraded reliability on Muni’s busiest routes. Improve transit stops and reengineer city streets (Muni Forward projects) in a way that better organizes traffic, saving customers up to an hour a week in travel time.
• Roomier and faster regional transit. Retrofit or buy new BART train cars to provide more space for passengers and bikes. Invest in electrifying Caltrain to increase service into and out of San Francisco.
San Francisco Transportation Sustainability Fee: Economic Feasibility Study
Page 8
• Improved bike infrastructure; safer walking and bicycling. Expand bike lanes to reduce crowding on transit. Secure millions of dollars for bicycle infrastructure and pedestrian safety improvements.
The TSF would replace the existing Transit Impact Development Fee (TIDF), which currently applies to most non-‐residential development, and would include market-‐rate residential development, major hospitals and universities. The TSF would be assessed in proportion to the size and use of the proposed development. As described in the 2015 TSF Nexus Study, the TSF would also consolidate non-‐residential fee categories. (For further information on the TSF, please refer to the Transportation Sustainability Program website and the 2015 TSF Nexus Study.10)
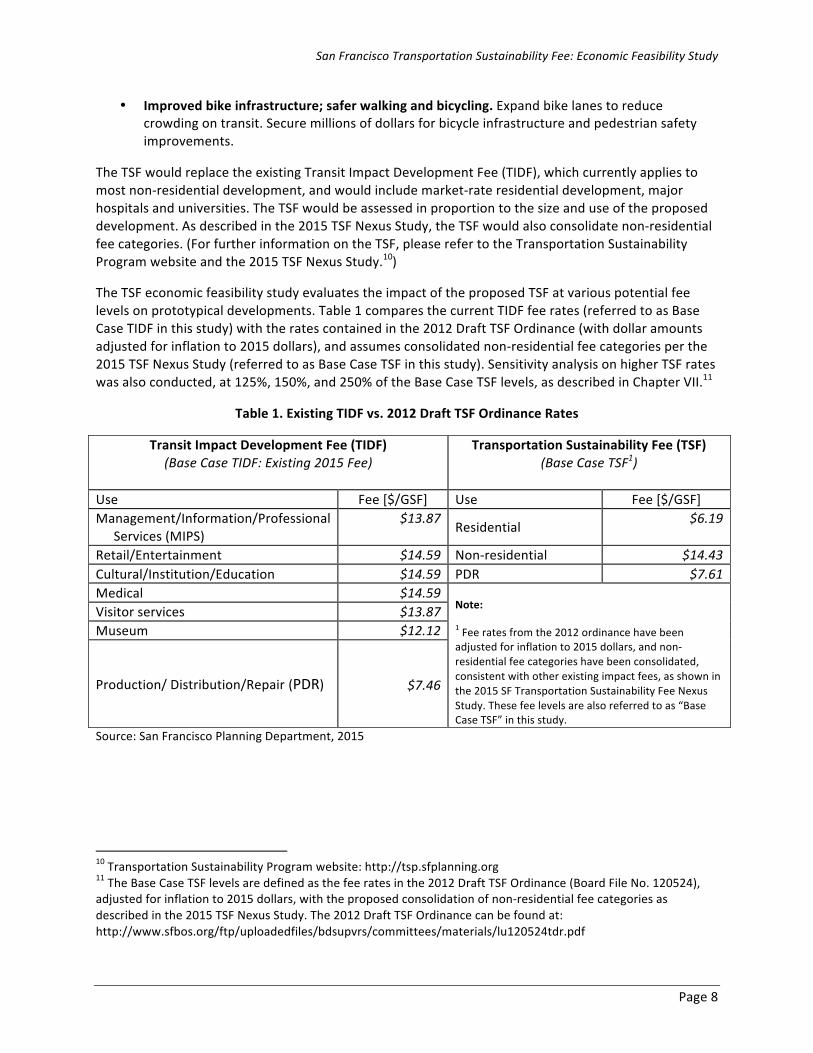
The TSF economic feasibility study evaluates the impact of the proposed TSF at various potential fee levels on prototypical developments. Table 1 compares the current TIDF fee rates (referred to as Base Case TIDF in this study) with the rates contained in the 2012 Draft TSF Ordinance (with dollar amounts adjusted for inflation to 2015 dollars), and assumes consolidated non-‐residential fee categories per the 2015 TSF Nexus Study (referred to as Base Case TSF in this study). Sensitivity analysis on higher TSF rates was also conducted, at 125%, 150%, and 250% of the Base Case TSF levels, as described in Chapter VII.11
Table 1. Existing TIDF vs. 2012 Draft TSF Ordinance Rates
Transit Impact Development Fee (TIDF) (Base Case TIDF: Existing 2015 Fee)
Transportation Sustainability Fee (TSF) (Base Case TSF1)
Use Fee [$/GSF] Use Fee [$/GSF] Management/Information/Professional
Services (MIPS) $13.87 Residential $6.19
Retail/Entertainment $14.59 Non-‐residential $14.43 Cultural/Institution/Education $14.59 PDR $7.61 Medical $14.59
Note:
1 Fee rates from the 2012 ordinance have been adjusted for inflation to 2015 dollars, and non-‐residential fee categories have been consolidated, consistent with other existing impact fees, as shown in the 2015 SF Transportation Sustainability Fee Nexus Study. These fee levels are also referred to as “Base Case TSF” in this study.
Visitor services $13.87 Museum $12.12
Production/ Distribution/Repair (PDR)
$7.46
Source: San Francisco Planning Department, 2015
10 Transportation Sustainability Program website: http://tsp.sfplanning.org 11 The Base Case TSF levels are defined as the fee rates in the 2012 Draft TSF Ordinance (Board File No. 120524), adjusted for inflation to 2015 dollars, with the proposed consolidation of non-‐residential fee categories as described in the 2015 TSF Nexus Study. The 2012 Draft TSF Ordinance can be found at: http://www.sfbos.org/ftp/uploadedfiles/bdsupvrs/committees/materials/lu120524tdr.pdf
San Francisco Transportation Sustainability Fee: Economic Feasibility Study
Page 9
A portion of the impact fee funding from certain area plans is dedicated to transit projects. Under the Transportation Sustainability Fee proposal, residential projects inside some plan areas would receive a credit for the transit portion of the area plan impact fee.12
B. California Environmental Quality Act and Level of Service Reform
Over the last 2 years, the City of San Francisco and the State of California have been actively working on Level of Service (LOS) reform and on improvements to the environmental review process under the California Environmental Quality Act (CEQA). With the adoption of the Sustainable Communities and Climate Protection Act of 2008 (SB 375), California is promoting land use and transportation planning decisions and investments that reduce vehicle miles traveled, thereby helping to lower greenhouse gas emissions as required by the California Global Warming Solutions Act of 2006 (AB 32).
On September 27, 2013, Governor Jerry Brown signed Senate Bill 743 (SB 743).13 A key provision of SB 743 is the elimination of the use of LOS as a metric for measuring traffic impacts of projects in “transit priority areas” – defined as areas within ½ mile of a major transit stop, which encompasses most of the developable area of San Francisco.14, 15 Senate Bill 743 also requires the California Office of Planning and Research (OPR) to develop revisions to the CEQA Guidelines establishing alternative criteria for determining the significance of transportation impacts of projects within transit priority areas that promote the “…reduction of greenhouse gas emissions, the development of multimodal transportation networks, and a diversity of land uses.”
On August 6, 2014, OPR published the Updating Transportation Impacts Analysis in the CEQA Guidelines document, in response to SB 743.16 These Draft CEQA guidelines indicate that the travel distance and amount of driving that a development project might cause should be the primary consideration when reviewing the project’s transportation impact. Accordingly, OPR proposes that the LOS metric be replaced with a Vehicle Miles Traveled (VMT) metric. Level of Service analysis could be used for traffic engineering or transportation planning purposes, although not for environmental review.
Level of Service reform would eliminate the need for intersection LOS analysis for development projects that require a transportation impact study (TIS), which is typically required for larger developments. Level of Service analysis is a lengthy and costly process that can frequently drive the overall schedule for the TIS and broader CEQA analysis process. Level of Service analysis typically requires: identifying study
12 Projects in the Transit Center District Plan (TCDP) do not receive a TSF area plan fee reduction– referred to as a fee credit– as the Transit Center Transportation and Streets Fee is designated to address the substantial impacts on transit associated with such a high density development. Projects in the Rincon Hill and Visitacion Valley area plans also do not receive a TSF area plan fee credit, since these area plan fees do not include a transit component. 13 SB 743 can be found on-‐line at: http://leginfo.legislature.ca.gov/faces/billNavClient.xhtml?bill_id=201320140SB743 14 Public Resources Code, Chapter 2.7, Division 13, Section 21099. “Modernization of Transportation Analysis for Transit-‐Oriented Infill Projects.” 15 A “transit priority area” is defined in as an area within one-‐half mile of an existing or planned major transit stop. A "major transit stop" is defined in Section 21064.3 of the California Public Resources Code as a rail transit station, a ferry terminal served by either a bus or rail transit service, or the intersection of two or more major bus routes with a frequency of service interval of 15 minutes or less during the morning and afternoon peak commute periods. 16 Document available at: http://www.opr.ca.gov/docs/Final_Preliminary_Discussion_Draft_of_Updates_Implementing_SB_743_080614.pdf
San Francisco Transportation Sustainability Fee: Economic Feasibility Study
Page 10
intersections; calculating the project’s travel demand; distributing the project’s trips on the surrounding roadway network; conducting traffic counts; and running a traffic simulation model that measures the impact of the project-‐related trips on study intersections.
The existing LOS analysis requirement creates uncertainty, as only toward the conclusion of a transportation impact analysis (well into the pre-‐entitlement process) does a developer fully realize if a project’s traffic impact would necessitate a higher level of environmental review (such as an Environmental Impact Report). As the environmental approvals must be completed prior to project approval hearings, this situation represents a significant risk to the developer, who must invest time and money for environmental review of projects that could ultimately be rejected. Thus, time and cost savings for environmental review, as well as earlier certainty around the TIS findings, will help reduce the pre-‐entitlement risk taken on by project sponsors.
The overall effect of LOS reform is to more accurately measure the environmental impacts of new development, simplify the transportation impact analysis and environmental review process and increase development certainty. This economic feasibility analysis evaluates the direct time and cost savings that typical projects may experience in the preparation of the TIS and related CEQA documentation. Additionally, there may be indirect economic benefits for all projects, as the removal of LOS analysis from transportation and environmental review documents would minimize the time spent on environmental review (thereby reducing backlogs for City staff and facilitating new development).
C. Transportation Demand Management (TDM) Development
One goal of the TSP is to minimize single-‐driver car trips while maximizing trips (from new developments) made via sustainable modes of transportation, such as walking, biking, ridesharing and mass transit. Transportation Demand Management (TDM) measures aim to reduce single occupancy vehicle (SOV) trips through programming and policies that encourage walking, bicycling, public or private transit, carpooling, and other alternative modes. Transportation Demand Management measures include both project design measures (such as way-‐finding signage or bicycle parking) and operational measures (such as employer transportation programs). The California Office of Planning and Research has recommended the use of TDM trip reduction strategies in the preliminary CEQA guidelines to implement Senate Bill 743.17
San Francisco is studying the benefits of implementing TDM measures on the choice of transportation mode. The City’s policies already require many TDM measures – for instance, the Planning Code requires residential developments to include a certain number of Class I and Class II bicycle parking facilities.18
For the purposes of this feasibility analysis, the development prototypes incorporate TDM measures that are currently required as part of City policy – for instance, all prototypes include the required level of bicycle parking facilities and carshare parking spaces, consistent with the Planning Code. However, this study does not separately calculate the direct costs (such as increased space for bicycle parking) and benefits (such as lower construction costs from less vehicular parking) associated with TDM measures, nor any potential legislative changes to TDM requirements, as these TDM measures and legislative changes are not yet defined.
17 http://www.opr.ca.gov/docs/Final_Preliminary_Discussion_Draft_of_Updates_Implementing_SB_743_ 080614.pdf 18 San Francisco Planning Code, Section 155.2
San Francisco Transportation Sustainability Fee: Economic Feasibility Study
Page 11
IV. Study Goals and Methodology The purpose of this study is to evaluate the potential impact of the proposed TSP on new development in San Francisco. The study has three primary goals:
• Evaluate the potential impact of the TSP on development feasibility. • Gather input from the development community on development revenues and costs, as well as
how CEQA/LOS reform might help streamline the development process. • Conduct sensitivity analysis on potential development scenarios (e.g. alternative TSF levels).
A. Methodology Overview
This section briefly describes the methodology and underlying data that Seifel Consulting Inc. (Seifel) used to perform the economic analyses. All of the core components of the methodology, assumptions and analysis were developed and vetted in collaboration with City staff and Urban Economics (the City’s nexus study consultant) over a series of meetings held during 2014 and 2015. The methodology leverages prior economic analyses and reports that were prepared when the TSP was originally being conceptualized in 2009 through 2012, as well as other studies that the City has commissioned to evaluate proposed modifications to the City’s impact fees, inclusionary housing programs and neighborhood land use plans. (For a more detailed discussion of the methodology, development assumptions and data sources used in this study, please refer to Appendix A.)
The data and analysis presented in this study and its appendices have been gathered from the most reliable sources available and are designed to represent current market conditions, taking in to account a long-‐range view of real estate cycles in San Francisco. This information has been assembled and analyzed for the sole purpose of performing an economic evaluation of the proposed adoption of the TSP. Actual potential financial impacts on new development may vary from the estimates presented in this study.
B. Selection of Development Prototypes
The first step in the analysis was to select a set of prototypical developments to be analyzed. Ten development prototypes – eight residential, two non-‐residential – were developed in order to represent the range of typical potential developments citywide that would see changes as a result of the TSP. The study placed greater emphasis on residential prototypes since the TSF proposal represents a new fee on residential uses. Seifel worked with City staff to identify common development types and locations by analyzing existing data sources, such as the San Francisco Planning Department’s development pipeline, the Housing Inventory Report, Preliminary Project Assessments (PPAs), and market data sources.
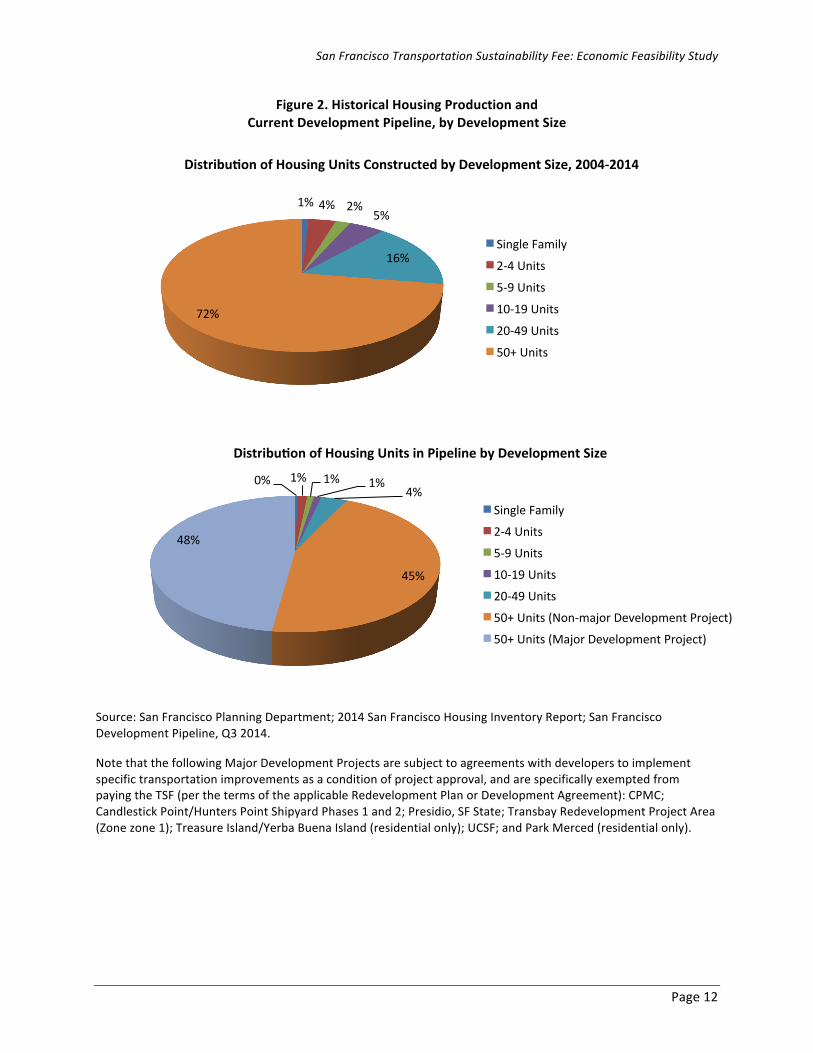
The residential prototypes were also designed to represent the broad range of development sizes that would likely be built in San Francisco. Figure 2 (following page) illustrates typical residential project sizes constructed in 2004–2014 and in the current development pipeline. As the top graph in Figure 2 shows, 72% of housing units constructed in the past decade are located in larger developments, sized 50 units or more. Less than 1% of housing units constructed during the last decade consist of single-‐family units, with about 11% of units located in developments sized between 2-‐19 units, and about 16% in developments 20-‐49 units in size.
San Francisco Transportation Sustainability Fee: Economic Feasibility Study
Page 12
Figure 2. Historical Housing Production and Current Development Pipeline, by Development Size
Source: San Francisco Planning Department; 2014 San Francisco Housing Inventory Report; San Francisco Development Pipeline, Q3 2014.
Note that the following Major Development Projects are subject to agreements with developers to implement specific transportation improvements as a condition of project approval, and are specifically exempted from paying the TSF (per the terms of the applicable Redevelopment Plan or Development Agreement): CPMC; Candlestick Point/Hunters Point Shipyard Phases 1 and 2; Presidio, SF State; Transbay Redevelopment Project Area (Zone zone 1); Treasure Island/Yerba Buena Island (residential only); UCSF; and Park Merced (residential only).
1% 4% 2% 5%
16%
72%
Distribu>on of Housing Units Constructed by Development Size, 2004-‐2014
Single Family
2-‐4 Units
5-‐9 Units
10-‐19 Units
20-‐49 Units
50+ Units
0% 1% 1% 1% 4%
45%
48%
Distribu>on of Housing Units in Pipeline by Development Size
Single Family
2-‐4 Units
5-‐9 Units
10-‐19 Units
20-‐49 Units
50+ Units (Non-‐major Development Project)
50+ Units (Major Development Project)
San Francisco Transportation Sustainability Fee: Economic Feasibility Study
Page 13
According to the current development pipeline, the City can expect a reduced proportion of future residential development to be smaller-‐sized developments (19 units or fewer), representing about 3% of housing units. About 4% of new housing units are projected to occur in developments ranging in size from 20 to 49 units, while about 93% are anticipated to occur in larger developments (50 units or more).
About half of these housing units in larger developments (50 units or more) are located in major development projects with development agreements or other contracts that specifically exempt future development from having to pay the TSF. Those agreements specify other developer obligations to mitigate development impacts, such as construction of local transportation infrastructure. While these projects would not be subject to the TSF, they nonetheless will fund substantial improvements to the City’s transportation system, helping to mitigate development impacts. Given this, none of the selected prototypes is located in major development projects that would not also be subject to the TSP. Most of the larger residential projects currently in the development pipeline are located in area plans, and three of the development prototypes (Prototypes 5, 8 and 9) are representative of larger residential developments with 100 or more housing units that are located in area plans.
According to Planning Department data, most residential projects are mixed use developments, consisting of retail on the ground floor and residential on the upper floors. In addition, most of San Francisco’s developable infill sites have zoning requirements that require active uses (such as retail) on street frontages. Thus, all but one of the residential prototypes is mixed use with retail development included on the ground floor.
The project team sought prototype locations both inside and outside of area plans in order to study different impact fee scenarios. In addition, prototype locations were chosen to represent varied transportation conditions in order to study different environmental review scenarios. Where possible, prototypes were selected to correspond with those analyzed in the concurrent Affordable Housing Bonus and Central SoMa feasibility analyses, in order to ensure that key development assumptions are consistent across these studies.
For purposes of distinguishing residential prototypes by development size, small projects are defined as consisting of 19 or fewer units (Prototypes 1 and 4), medium projects consist of 20–60 units (Prototypes 2, 3 and 6), and large projects consist of 61 or more units (Prototypes 5, 8, 9). The two non-‐residential prototypes are large office buildings with ground floor retail (Prototypes 7 and 10), which are reflective of typical office developments in the development pipeline.
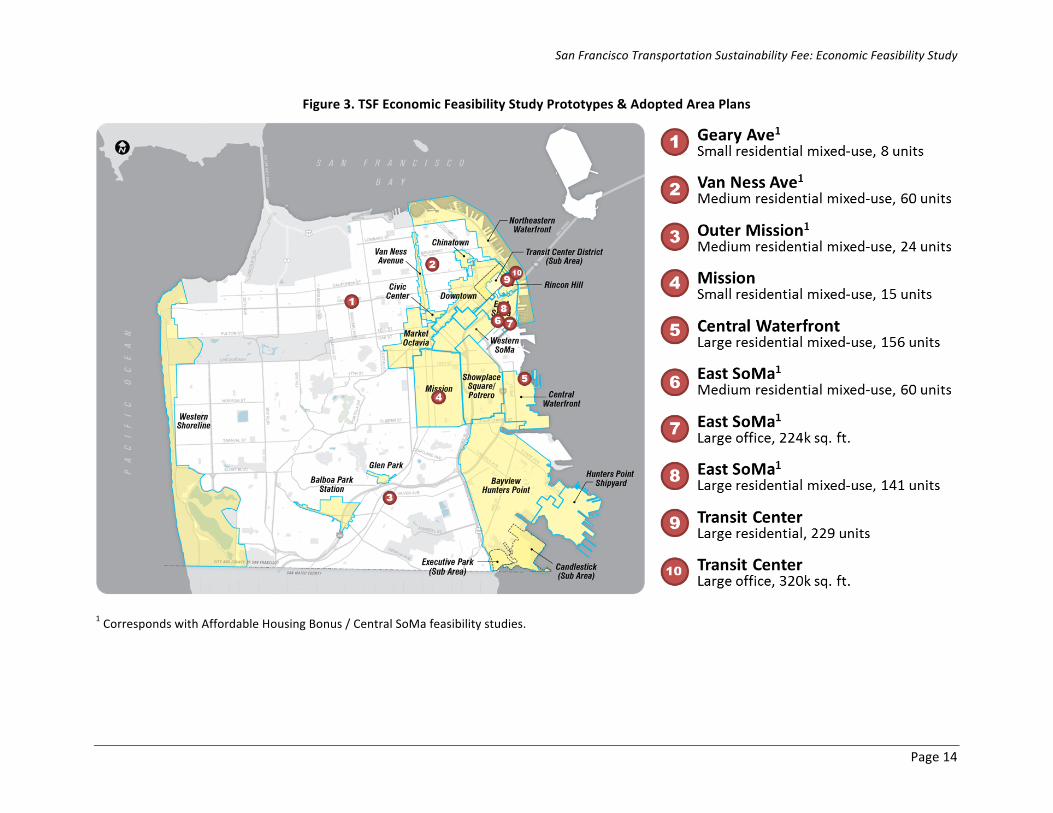
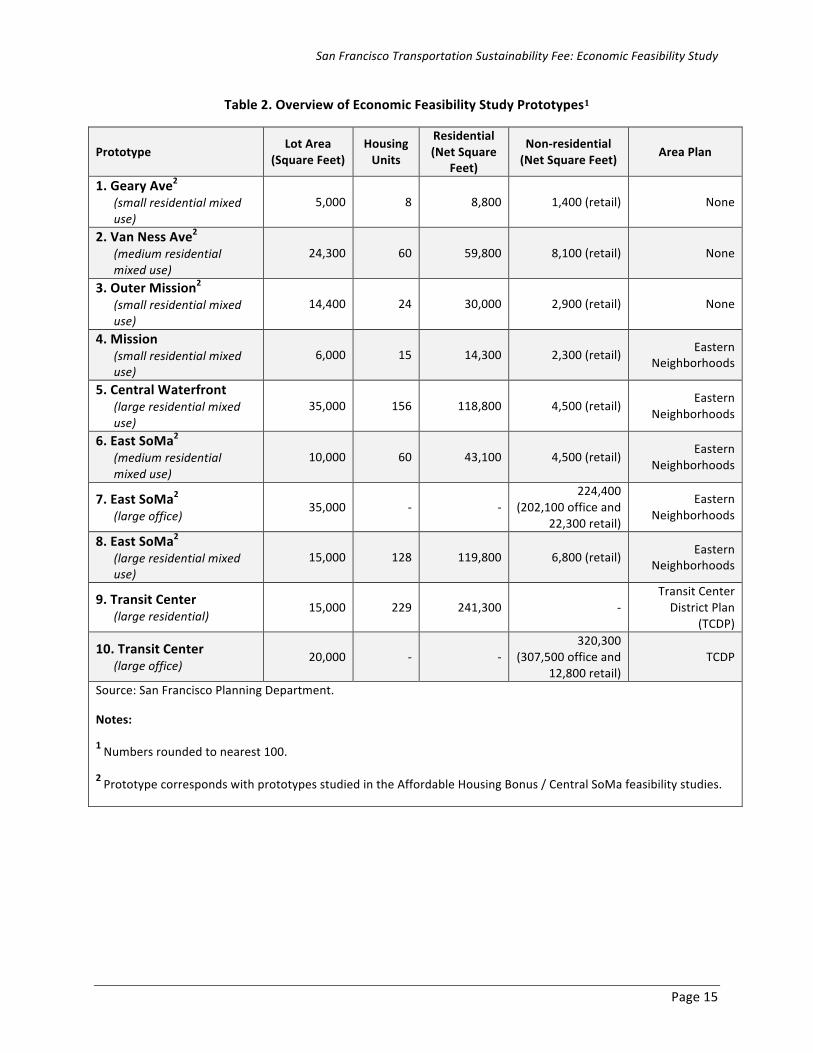
The development revenue and cost assumptions were developed based on developer input and data gathered from a variety of real estate professionals, including market specialists, real estate brokers and general contractors. Figure 3 shows locations throughout the City of the development prototypes analyzed for the feasibility study and Table 2 provides an overview of the prototypes.
San Francisco Transportation Sustainability Fee: Economic Feasibility Study
Page 14
Figure 3. TSF Economic Feasibility Study Prototypes & Adopted Area Plans
1 Corresponds with Affordable Housing Bonus / Central SoMa feasibility studies.
San Francisco Transportation Sustainability Fee: Economic Feasibility Study
Page 15
Table 2. Overview of Economic Feasibility Study Prototypes1
Prototype Lot Area
(Square Feet) Housing Units
Residential (Net Square
Feet)
Non-‐residential (Net Square Feet) Area Plan
1. Geary Ave2 (small residential mixed use)
5,000 8 8,800 1,400 (retail) None
2. Van Ness Ave2 (medium residential mixed use)
24,300 60 59,800 8,100 (retail) None
3. Outer Mission2 (small residential mixed use)
14,400 24 30,000 2,900 (retail) None
4. Mission (small residential mixed use)
6,000 15 14,300 2,300 (retail) Eastern Neighborhoods
5. Central Waterfront (large residential mixed use)
35,000 156 118,800 4,500 (retail) Eastern
Neighborhoods
6. East SoMa2 (medium residential mixed use)
10,000 60 43,100 4,500 (retail) Eastern
Neighborhoods
7. East SoMa2 (large office) 35,000 -‐ -‐
224,400 (202,100 office and
22,300 retail)
Eastern Neighborhoods
8. East SoMa2 (large residential mixed use)
15,000 128 119,800 6,800 (retail) Eastern Neighborhoods
9. Transit Center (large residential) 15,000 229 241,300 -‐
Transit Center District Plan
(TCDP)
10. Transit Center (large office) 20,000 -‐ -‐
320,300 (307,500 office and
12,800 retail) TCDP
Source: San Francisco Planning Department.
Notes:
1 Numbers rounded to nearest 100.
2 Prototype corresponds with prototypes studied in the Affordable Housing Bonus / Central SoMa feasibility studies.
San Francisco Transportation Sustainability Fee: Economic Feasibility Study
Page 16
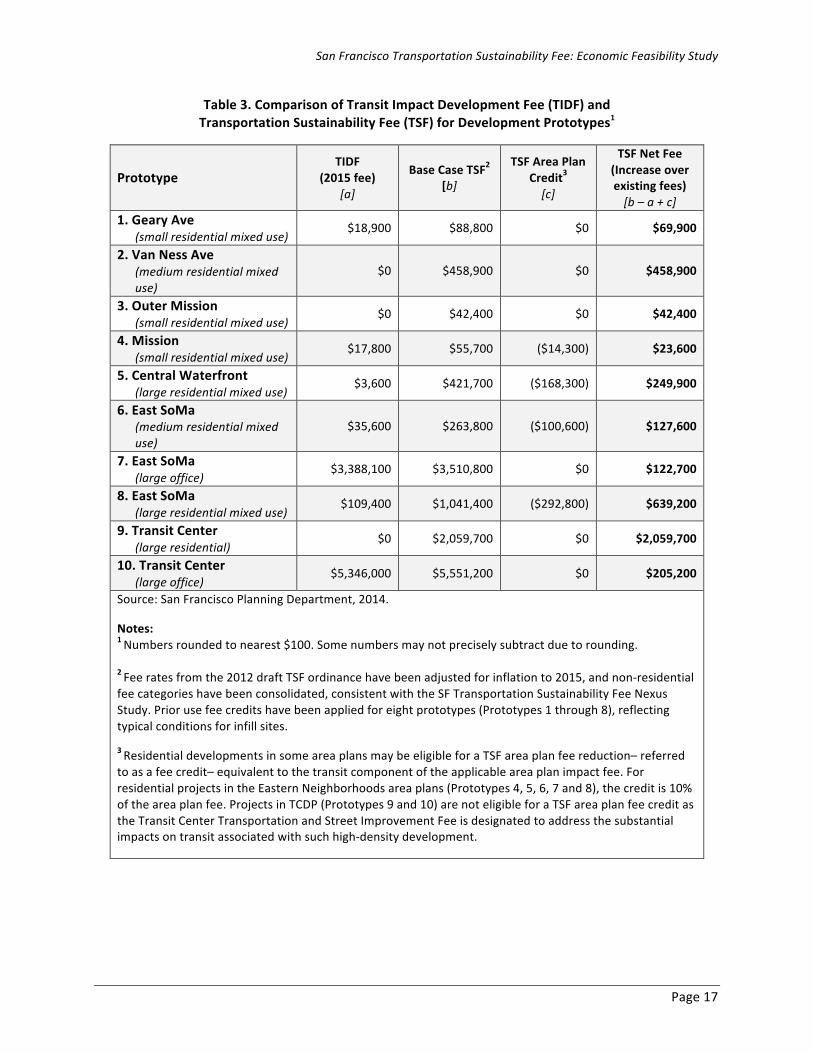
C. Transportation Impact Fees
In order to evaluate the impact of the TSF on new development, Seifel worked with City staff to calculate transportation impact fees and other development impact fees for each of the feasibility study prototypes. Table 3 compares the transportation fee obligation for each of the prototypes currently under the TIDF with the Base Case TSF levels, which are defined as the fee rates in the 2012 Draft TSF Ordinance (adjusted for inflation to 2015 dollars) with the proposed consolidation of non-‐residential fee categories. (Refer back to Section III.A for more information.)
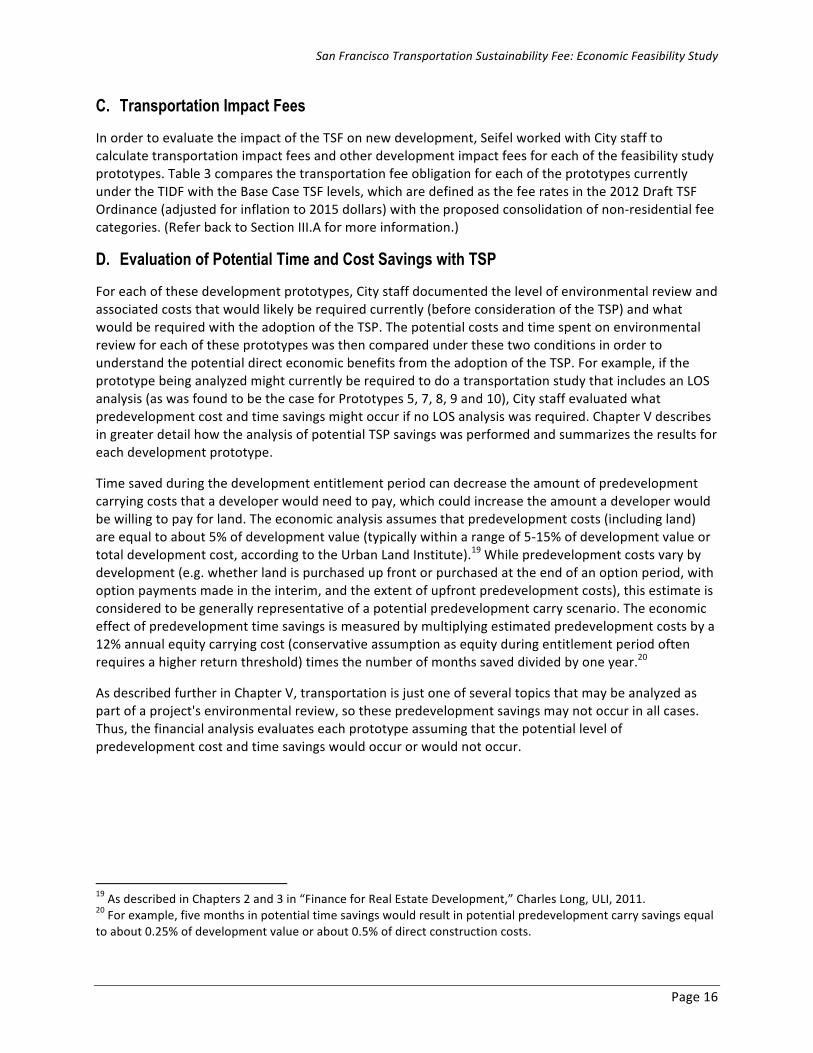
D. Evaluation of Potential Time and Cost Savings with TSP
For each of these development prototypes, City staff documented the level of environmental review and associated costs that would likely be required currently (before consideration of the TSP) and what would be required with the adoption of the TSP. The potential costs and time spent on environmental review for each of these prototypes was then compared under these two conditions in order to understand the potential direct economic benefits from the adoption of the TSP. For example, if the prototype being analyzed might currently be required to do a transportation study that includes an LOS analysis (as was found to be the case for Prototypes 5, 7, 8, 9 and 10), City staff evaluated what predevelopment cost and time savings might occur if no LOS analysis was required. Chapter V describes in greater detail how the analysis of potential TSP savings was performed and summarizes the results for each development prototype.
Time saved during the development entitlement period can decrease the amount of predevelopment carrying costs that a developer would need to pay, which could increase the amount a developer would be willing to pay for land. The economic analysis assumes that predevelopment costs (including land) are equal to about 5% of development value (typically within a range of 5-‐15% of development value or total development cost, according to the Urban Land Institute).19 While predevelopment costs vary by development (e.g. whether land is purchased up front or purchased at the end of an option period, with option payments made in the interim, and the extent of upfront predevelopment costs), this estimate is considered to be generally representative of a potential predevelopment carry scenario. The economic effect of predevelopment time savings is measured by multiplying estimated predevelopment costs by a 12% annual equity carrying cost (conservative assumption as equity during entitlement period often requires a higher return threshold) times the number of months saved divided by one year.20
As described further in Chapter V, transportation is just one of several topics that may be analyzed as part of a project's environmental review, so these predevelopment savings may not occur in all cases. Thus, the financial analysis evaluates each prototype assuming that the potential level of predevelopment cost and time savings would occur or would not occur.
19 As described in Chapters 2 and 3 in “Finance for Real Estate Development,” Charles Long, ULI, 2011. 20 For example, five months in potential time savings would result in potential predevelopment carry savings equal to about 0.25% of development value or about 0.5% of direct construction costs.
San Francisco Transportation Sustainability Fee: Economic Feasibility Study
Page 17
Table 3. Comparison of Transit Impact Development Fee (TIDF) and Transportation Sustainability Fee (TSF) for Development Prototypes1
Prototype TIDF
(2015 fee)
[a]
Base Case TSF2 [b]
TSF Area Plan Credit3 [c]
TSF Net Fee (Increase over existing fees) [b – a + c]
1. Geary Ave (small residential mixed use) $18,900 $88,800 $0 $69,900
2. Van Ness Ave (medium residential mixed use)
$0 $458,900 $0 $458,900
3. Outer Mission (small residential mixed use) $0 $42,400 $0 $42,400
4. Mission (small residential mixed use) $17,800 $55,700 ($14,300) $23,600
5. Central Waterfront (large residential mixed use) $3,600 $421,700 ($168,300) $249,900
6. East SoMa (medium residential mixed use)
$35,600 $263,800 ($100,600) $127,600
7. East SoMa (large office) $3,388,100 $3,510,800 $0 $122,700
8. East SoMa (large residential mixed use) $109,400 $1,041,400 ($292,800) $639,200
9. Transit Center (large residential) $0 $2,059,700 $0 $2,059,700
10. Transit Center (large office) $5,346,000 $5,551,200 $0 $205,200
Source: San Francisco Planning Department, 2014.
Notes: 1 Numbers rounded to nearest $100. Some numbers may not precisely subtract due to rounding.
2 Fee rates from the 2012 draft TSF ordinance have been adjusted for inflation to 2015, and non-‐residential fee categories have been consolidated, consistent with the SF Transportation Sustainability Fee Nexus Study. Prior use fee credits have been applied for eight prototypes (Prototypes 1 through 8), reflecting typical conditions for infill sites.
3 Residential developments in some area plans may be eligible for a TSF area plan fee reduction– referred to as a fee credit– equivalent to the transit component of the applicable area plan impact fee. For residential projects in the Eastern Neighborhoods area plans (Prototypes 4, 5, 6, 7 and 8), the credit is 10% of the area plan fee. Projects in TCDP (Prototypes 9 and 10) are not eligible for a TSF area plan fee credit as the Transit Center Transportation and Street Improvement Fee is designated to address the substantial impacts on transit associated with such high-‐density development.
San Francisco Transportation Sustainability Fee: Economic Feasibility Study
Page 18
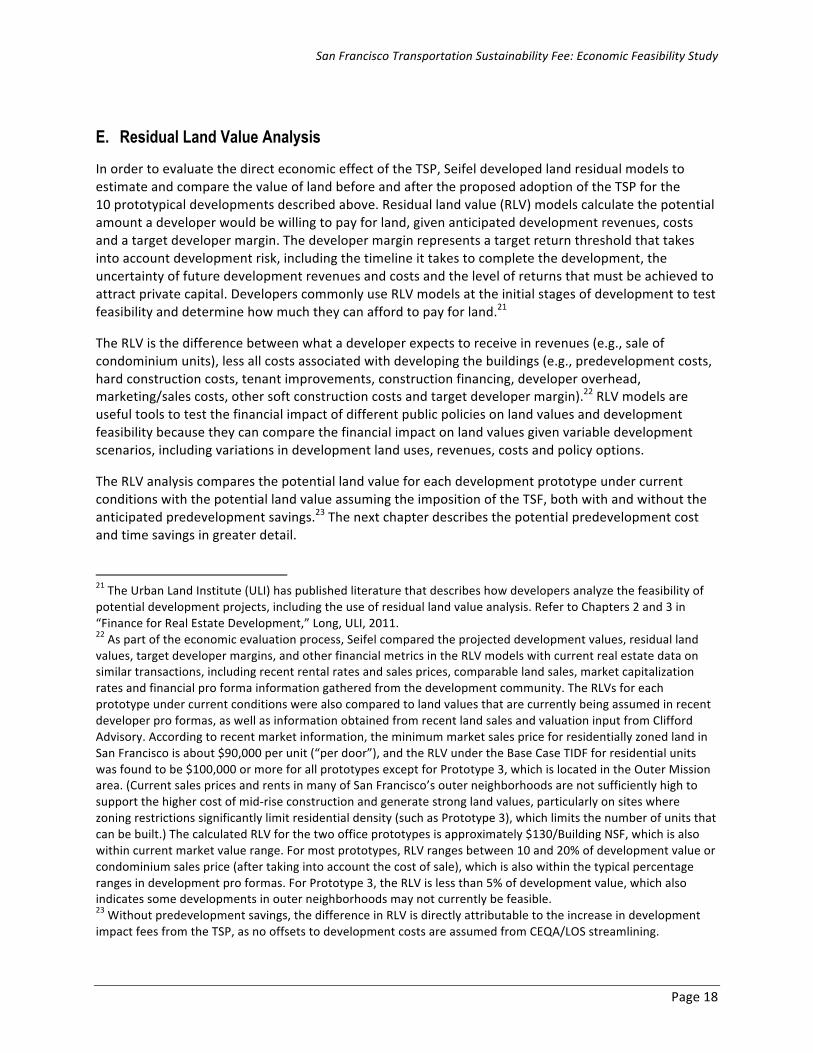
E. Residual Land Value Analysis
In order to evaluate the direct economic effect of the TSP, Seifel developed land residual models to estimate and compare the value of land before and after the proposed adoption of the TSP for the 10 prototypical developments described above. Residual land value (RLV) models calculate the potential amount a developer would be willing to pay for land, given anticipated development revenues, costs and a target developer margin. The developer margin represents a target return threshold that takes into account development risk, including the timeline it takes to complete the development, the uncertainty of future development revenues and costs and the level of returns that must be achieved to attract private capital. Developers commonly use RLV models at the initial stages of development to test feasibility and determine how much they can afford to pay for land.21
The RLV is the difference between what a developer expects to receive in revenues (e.g., sale of condominium units), less all costs associated with developing the buildings (e.g., predevelopment costs, hard construction costs, tenant improvements, construction financing, developer overhead, marketing/sales costs, other soft construction costs and target developer margin).22 RLV models are useful tools to test the financial impact of different public policies on land values and development feasibility because they can compare the financial impact on land values given variable development scenarios, including variations in development land uses, revenues, costs and policy options.
The RLV analysis compares the potential land value for each development prototype under current conditions with the potential land value assuming the imposition of the TSF, both with and without the anticipated predevelopment savings.23 The next chapter describes the potential predevelopment cost and time savings in greater detail.
21 The Urban Land Institute (ULI) has published literature that describes how developers analyze the feasibility of potential development projects, including the use of residual land value analysis. Refer to Chapters 2 and 3 in “Finance for Real Estate Development,” Long, ULI, 2011. 22 As part of the economic evaluation process, Seifel compared the projected development values, residual land values, target developer margins, and other financial metrics in the RLV models with current real estate data on similar transactions, including recent rental rates and sales prices, comparable land sales, market capitalization rates and financial pro forma information gathered from the development community. The RLVs for each prototype under current conditions were also compared to land values that are currently being assumed in recent developer pro formas, as well as information obtained from recent land sales and valuation input from Clifford Advisory. According to recent market information, the minimum market sales price for residentially zoned land in San Francisco is about $90,000 per unit (“per door”), and the RLV under the Base Case TIDF for residential units was found to be $100,000 or more for all prototypes except for Prototype 3, which is located in the Outer Mission area. (Current sales prices and rents in many of San Francisco’s outer neighborhoods are not sufficiently high to support the higher cost of mid-‐rise construction and generate strong land values, particularly on sites where zoning restrictions significantly limit residential density (such as Prototype 3), which limits the number of units that can be built.) The calculated RLV for the two office prototypes is approximately $130/Building NSF, which is also within current market value range. For most prototypes, RLV ranges between 10 and 20% of development value or condominium sales price (after taking into account the cost of sale), which is also within the typical percentage ranges in development pro formas. For Prototype 3, the RLV is less than 5% of development value, which also indicates some developments in outer neighborhoods may not currently be feasible. 23 Without predevelopment savings, the difference in RLV is directly attributable to the increase in development impact fees from the TSP, as no offsets to development costs are assumed from CEQA/LOS streamlining.
San Francisco Transportation Sustainability Fee: Economic Feasibility Study
Page 19
V. Cost and Time Savings from CEQA / Level of Service Reform As previously described, the removal of LOS analysis under CEQA reform would eliminate the need for intersection LOS analysis for projects that require a transportation impact study (TIS), which is one of the main drivers of the overall schedule of the environmental review (and subsequently, the development entitlement process). Eliminating the LOS analysis could simplify the transportation analysis and decrease the amount of time spent on environmental review. This study evaluates the potential financial impact of both the direct time and cost savings that some projects may experience as a result of these improvements to the environmental review process from the TSP, as further described below.
A. Direct Time Savings
The time savings that an individual project may experience would vary depending on its level of required environmental review. Under CEQA, there are three major levels of environmental review documents, listed in ascending order of complexity and time required:
1. Exemption (i.e. a Categorical Exemption (Cat Ex) or Community Plan Exemption (CPE)) 2. Mitigated Negative Declaration (MND) 3. Environmental Impact Report (EIR)
The level of required environmental review and type of document to be prepared largely depends on the size and scale of the proposed project, its location and whether or not it may benefit from – or be “tiered” from – a previous EIR, such as the City’s Housing Element EIR or the Eastern Neighborhoods Area Plan and Rezoning EIR. For example, a Community Plan Exemption (CPE) document can only be prepared for a qualifying project within a plan area that does not result in any new significant impacts or require any new mitigation above and beyond what is analyzed in the Area Plan EIR.
After CEQA/LOS reform is implemented through the TSP, project sponsors may experience two types of potential direct time savings:
1. Time savings associated with not having to do an LOS analysis as part of the Transportation Impact Study.
2. Time savings associated with streamlining the overall environmental review process, with the greatest savings potentially occurring in situations where the level of environmental review for a project can be reduced (for example, a Mitigated Negative Declaration or Exemption instead of an EIR). This latter scenario is somewhat rare and would happen in instances where a project is required to undergo a more extensive level of environmental review solely due to transportation LOS impacts.
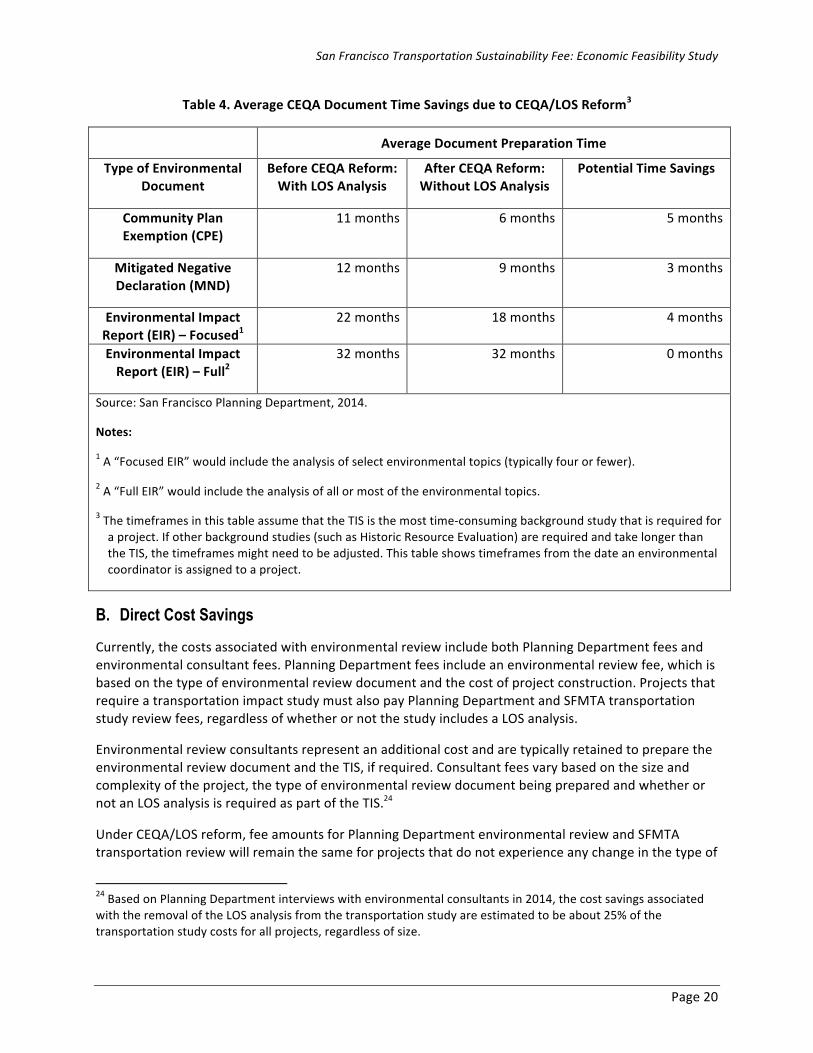
Table 4 shows that the potential average time savings due to the removal of the LOS analysis requirement in the overall CEQA document preparation ranges from zero to five months, assuming that this does not change the level of environmental review required.
Greater time savings may be possible in situations where the removal of the LOS analysis results in a lower level of environmental review than would otherwise be required. However, the CEQA review process is just one part of the overall predevelopment timeline, which also includes obtaining land use entitlements and other project approvals. For this reason, the overall project entitlement time savings may not be as great as the potential CEQA time savings.
San Francisco Transportation Sustainability Fee: Economic Feasibility Study
Page 20
Table 4. Average CEQA Document Time Savings due to CEQA/LOS Reform3
Average Document Preparation Time
Type of Environmental Document
Before CEQA Reform: With LOS Analysis
After CEQA Reform: Without LOS Analysis
Potential Time Savings
Community Plan Exemption (CPE)
11 months 6 months 5 months
Mitigated Negative Declaration (MND)
12 months 9 months 3 months
Environmental Impact Report (EIR) – Focused1
22 months 18 months 4 months
Environmental Impact Report (EIR) – Full2
32 months 32 months 0 months
Source: San Francisco Planning Department, 2014.
Notes:
1 A “Focused EIR” would include the analysis of select environmental topics (typically four or fewer).
2 A “Full EIR” would include the analysis of all or most of the environmental topics.
3 The timeframes in this table assume that the TIS is the most time-‐consuming background study that is required for a project. If other background studies (such as Historic Resource Evaluation) are required and take longer than the TIS, the timeframes might need to be adjusted. This table shows timeframes from the date an environmental coordinator is assigned to a project.
B. Direct Cost Savings
Currently, the costs associated with environmental review include both Planning Department fees and environmental consultant fees. Planning Department fees include an environmental review fee, which is based on the type of environmental review document and the cost of project construction. Projects that require a transportation impact study must also pay Planning Department and SFMTA transportation study review fees, regardless of whether or not the study includes a LOS analysis.
Environmental review consultants represent an additional cost and are typically retained to prepare the environmental review document and the TIS, if required. Consultant fees vary based on the size and complexity of the project, the type of environmental review document being prepared and whether or not an LOS analysis is required as part of the TIS.24
Under CEQA/LOS reform, fee amounts for Planning Department environmental review and SFMTA transportation review will remain the same for projects that do not experience any change in the type of
24 Based on Planning Department interviews with environmental consultants in 2014, the cost savings associated with the removal of the LOS analysis from the transportation study are estimated to be about 25% of the transportation study costs for all projects, regardless of size.
San Francisco Transportation Sustainability Fee: Economic Feasibility Study
Page 21
environmental document required. For instance, a project in an area plan may currently be required to prepare a TIS with a LOS analysis as part of a Community Plan Exemption (CPE). Under the proposed TSP, the project may still need to prepare a CPE, but it would include a simplified TIS without a LOS analysis. The Planning Department and SFMTA transportation fees would remain the same, but the project would benefit from consultant cost savings and time savings from not having to do the LOS analysis. As the environmental review document also incorporates technical analysis from the TIS, the consultant time required to prepare the environmental document would also be reduced, resulting in additional cost savings.
However, a project may experience greater cost savings if the removal of the LOS analysis results in a lesser level of environmental review being required. For instance, if a project no longer requires a focused EIR (which is conducted by environmental consultants) and could be eligible for a CPE (typically prepared in-‐house by Planning Department staff), the cost savings would be substantial.
C. Indirect Benefits
In addition to these direct benefits, CEQA/LOS reform would also result in greater certainty for project sponsors, as described earlier. As the environmental approvals must be completed prior to project approval hearings, these environmental approvals represent a significant risk to the developer, who must invest time and funds for environmental review of projects that might ultimately be rejected. Thus, any savings in environmental review time and costs can help reduce the pre-‐entitlement risk taken on by developers. Further, CEQA/LOS reform would simplify and minimize the time spent on environmental review, potentially reducing backlogs for City staff and shortening the predevelopment process for all projects, not just those benefitting from CEQA streamlining due to TSP.
While these indirect economic benefits could be significant to the development community, the financial analysis solely focuses on evaluating the direct time and cost savings in the preparation of the TIS and related CEQA documentation.
D. CEQA Streamlining Benefits for Feasibility Study Prototypes
The CEQA streamlining benefits associated with the implementation of the TSP were identified and analyzed for each of the development prototypes by comparing the scope of the environmental review with and without a LOS analysis. The level of environmental review for each prototype was determined based on the following information for each prototype:
• Project description, including land use, intensity of development, building envelope and project location.
• Environmental constraints associated with the project sites in these areas of the City. • Programmatic EIRs (typically from area plans) from which the project-‐level environmental
review documents could be tiered (where applicable). • Planning Department guidelines and standard practices for environmental review as of March
2015.
The Planning Department identified the technical studies that would be required on the topics of transportation25, air quality, noise, hazardous materials, wind, shadow, archeological resources, geology 25 The type of transportation study required was based on a calculation of the PM peak-‐hour automobile trips that would be generated by the development program identified for each prototype.
San Francisco Transportation Sustainability Fee: Economic Feasibility Study
Page 22
and historic resources. The level of environmental review was based on the findings typically associated with the conclusions of those studies.
The current level of environmental review for each prototype was then compared to the anticipated level of environmental review and transportation analysis that would be needed with the TSP, assuming no other environmental topic area (such as historic resources) would result in impacts that would cause a more stringent environmental review process.
The potential time and cost savings for each prototype was then estimated by Planning Department staff based on recent environmental review costs incurred for similar projects, in consultation with outside environmental consultants. Table 5 at the end of this Chapter summarizes the type of environmental review document that would be required for each feasibility study prototype with and without LOS reform under TSP. Each of the prototypes except Prototype 5 would require the same type of environmental review document, with and without TSP.
Prototypes 1 through 4 and Prototype 6 are smaller projects that would not currently require a LOS analysis. Therefore, under TSP there is no change to the transportation study or the environmental review process and no environmental review time or cost savings.
Prototypes 7 through 10 are all large projects within area plans and would require LOS analysis, according to current practices, but would not require LOS analysis under TSP. 26 Thus, each of these prototypes experiences a time savings of approximately five months and varied consultant costs savings, both associated with the preparation of a streamlined TIS.
Prototype 5 is a medium-‐sized project located in the Central Waterfront area of the Eastern Neighborhoods. Based on the project size, the background traffic conditions in the surrounding streets and the level of new development anticipated in the area, a LOS analysis of this project would likely identify a significant unavoidable traffic impact that would trigger the preparation of a focused EIR under current practice. Prototype 5 is unlikely to result in other significant unavoidable impacts; therefore, under the TSP, this project would no longer need to conduct an EIR, resulting in substantial time and cost savings. The combined cost savings of reduced Planning Department fees and consultant fees is approximately $560,000 and the associated time savings is approximately five months.27
In summary, this analysis demonstrates the potential variation in potential direct time and cost savings for environmental and transportation review with the TSP for a variety of development types throughout San Francisco, summarized below and in Table 5.
• With TSP, no time or cost savings are anticipated for Prototypes 1 through 4 and Prototype 6, which is primarily attributable to the small-‐scale of development that each represents.
• Prototype 5 is estimated to potentially receive the most significant level of cost savings with TSP, as the environmental review document would be modified from a CPE and a Focused EIR to a
26 For the purposes of this analysis, it was assumed that the governing environmental documents would enable this to occur. 27 Although the change in the scope of the environmental review would reduce the CEQA documentation timeline from 22 months to 6 months (a 16-‐month time savings), the timeline for the required entitlements could likely only be reduced by 5 months given that some of steps in the technical analysis and the approval process take a certain amount of time and would not be able to be further shortened with TSP. Therefore, a conservative estimate of 5 months of time savings is estimated to occur within the overall predevelopment timeline.
San Francisco Transportation Sustainability Fee: Economic Feasibility Study
Page 23
CPE. It would also likely benefit from time savings of 5 months in the predevelopment review process.
• Prototypes 7 through 10 are anticipated to experience more modest cost savings given that their level of environmental review would remain the same under TSP. These prototypes would also likely benefit from time savings of 5 months in the predevelopment review process.
As described above, the projected time and cost savings presented for each prototype assumes that no other type of topic area (such as historic resources) would result in further intensification of environmental review. In order to take into account the possibility that no time or cost savings might occur, the land residual analysis evaluates the financial impact with and without the potential predevelopment time and cost savings that are described in this Chapter.

San Francisco Transportation Sustainability Fee: Economic Feasibility Study
Page 24
Table 5. Potential Environmental Review Time and Cost Savings from CEQA/LOS Reform by Prototype
Prototype
Environmental Review Time Savings1 Environmental Review Cost Savings2 Environmental
Review Document: TIDF (Existing)
Environmental Review Document: TSP (Proposed)
Predevelopment Period Time Savings3
Planning Dept. Environmental Fee Savings
Estimated Consultant Cost
Savings
Total Environmental Cost Savings
1. Geary Ave (small residential mixed use) Class 32 CatEx Class 32 CatEx None $0 $0 $0
2. Van Ness Ave (medium residential mixed use) Class 32 CatEx Class 32 CatEx None $0 $0 $0
3. Outer Mission (small residential mixed use)
Class 32 CatEx Class 32 CatEx None $0 $0 $0
4. Mission (small residential mixed use)
CPE CPE None $0 $0 $0
5. Central Waterfront (large residential mixed use)
CPE + Focused EIR CPE 5 months $386,300 $175,000 $561,300
6. East SoMa (medium residential mixed use) CPE CPE None $0 $0 $0
7. East SoMa (large office) CPE + Focused EIR CPE + Focused EIR 5 months4 $0 $95,000 $95,000
8. East SoMa (large residential mixed use) CPE CPE 5 months4 $0 $25,000 $25,000
9. Transit Center (large residential) CPE CPE 5 months4 $0 $25,000 $25,000
10. Transit Center (large office) CPE CPE 5 months4 $0 $50,000 $50,000
Source: San Francisco Planning Department, 2014 Note: Numbers rounded to nearest $100. 1 This assumes that no other type of environmental review (such as historic resources) would result in further intensification of environmental review. As further described in this report, the land residual analysis accounts for an alternative environmental review situation where no time or cost savings would occur, as it evaluates the financial impact with and without the anticipated predevelopment savings from a streamlined CEQA process.
2 These cost savings do not include potential predevelopment savings associated with lower predevelopment carrying costs due to a shorter entitlement timeline, which is evaluated in the land residual models.
3 The predevelopment period includes both the environmental review and the entitlement process. Thus, changes to the environmental review timeline may not translate directly to equivalent time savings in the predevelopment period.
4 Time savings due to dissolution of transportation LOS analysis requirement.
San Francisco Transportation Sustainability Fee: Economic Feasibility Study
Page 25
VI. Results From Analysis of Base Case TSF Levels As described in Chapter IV on methodology, land residual models for ten typical developments were prepared to compare the estimated value of land before and after adoption of the proposed TSP. These development prototypes were chosen to best represent potential developments that might occur in different City neighborhoods, located inside and outside Plan Areas. The first stage of the analysis evaluates the potential financial impact by comparing the RLV under current conditions (referred to as Base Case TIDF) with the Base Case TSF scenario (with the introduction of the TSP, including the addition of fees at the "Base Case TSF" levels and CEQA/LOS reform).28 Given the variability in key cost factors for real estate development across San Francisco and the challenging development climate that has resulted from the real estate recession followed by rapid price appreciation in recent years, a decrease in RLV of -‐10% or less with the introduction of the TSP has been chosen as a reasonable indicator of ongoing feasibility.
Non-‐residential development would experience the least financial impact from TSP, as the Base Case TSF is about the same as the existing TIDF for most land uses. For example, the net increase in the impact fee burden for new office use would be about $.56/GSF, and retail development would experience a slight decrease in fees of about -‐$0.16/GSF at the Base Case TSF levels. (Please refer back to Table 1 and Chapter III for more information regarding existing and proposed TSF levels.)
With TSP, residential development would be subject to a new development impact fee, which would increase development costs by $6.19/GSF for the Base Case TSF scenario without consideration of fee credits or predevelopment savings. Based on a typical residential unit size of 950 net square feet,29 this translates to a potential increase in fees for the Base Case TSF scenario of about $7,400 per unit, or about 1-‐2% of direct construction cost depending on the type of construction and level of fee credits.
CEQA/LOS reform, once adopted, could help offset some of the financial impact of the TSF on new development or create an economic benefit for development. Based on the analysis presented in Chapter V, this streamlining could represent potential predevelopment cost and time savings for larger developments that currently require a transportation study as part of their environmental review in the following ways:
• Reduced City fees related to the current review of transportation studies. • Reduced costs in professional services related to transportation and environmental analysis
during the environmental process. • Potential for reduced carrying costs (for private capital) on predevelopment expenses resulting
from time savings of up to five months in the review process.30
28 As described in Chapter IV, the Base Case TSF scenario assumes the fee rates in the 2012 Draft TSF Ordinance, adjusted for inflation to 2015 dollars, taking into account the consolidation of non-‐residential fee categories. 29 The fee is based on a gross residential square foot basis, and this typical unit size is assumed to be about 1188 GSF based on a typical 80% efficiency for low-‐rise and mid-‐rise developments, as indicated by this study. Building area (per gross and net square foot) does not include square footage related to parking. 30 As described in Chapter IV, this analysis assumes predevelopment costs (including land) are equal to about 5% of development value, and the economic effect of predevelopment time savings is measured by multiplying the estimated predevelopment costs by a 12% annual equity carrying cost times the number of months saved divided by one year (i.e. 5 months/1 year or 42%) resulting in predevelopment savings at about 0.25% of development value, or about $2500 per unit for a condominium development with an average value of $1 million per unit.
San Francisco Transportation Sustainability Fee: Economic Feasibility Study
Page 26
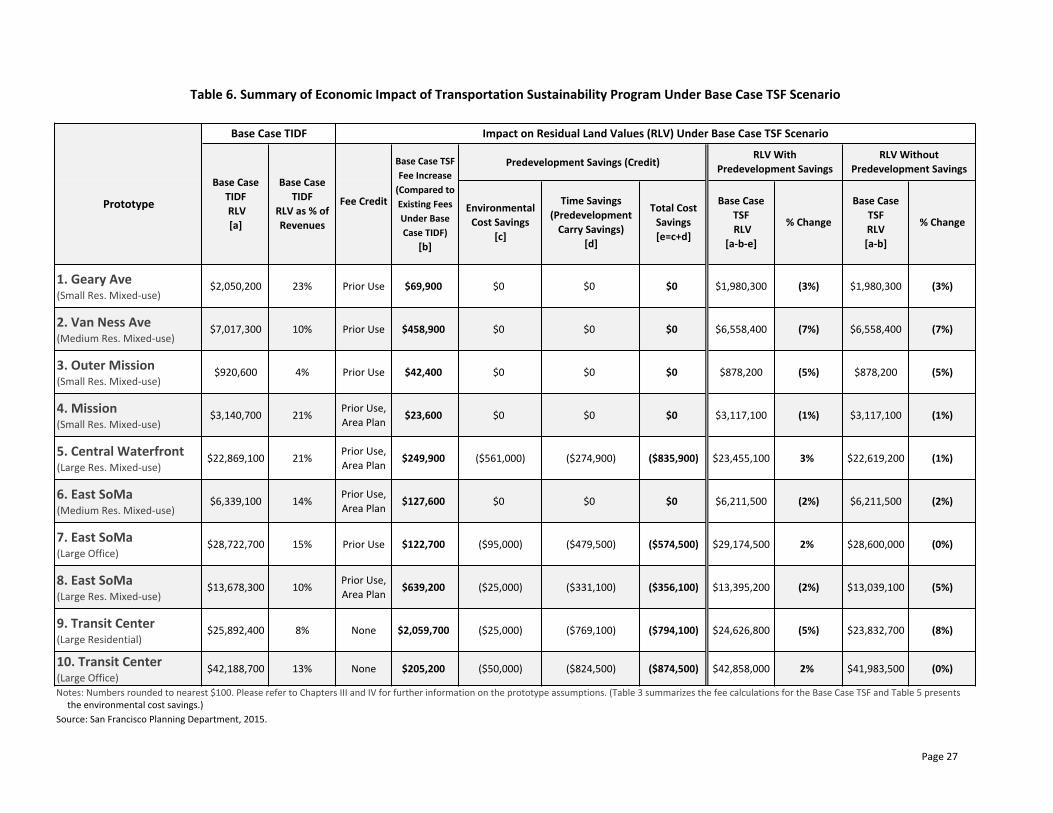
Table 6 on the following page summarizes the economic evaluation of the TSP program under the Base Case TSF scenario. As it shows, the residual land values for most of the prototypes range from about 10-‐20% of revenues, which is consistent with many recent development pro formas that were reviewed for this study.31 New development may not be currently feasible in City neighborhoods that have below-‐average price levels and rents, given the high cost of construction relative to potential revenues. The financial analysis indicates that this is the case for Prototype 3.32 While the imposition of the Base Case TSF will not cause developments similar to Prototype 3 to be infeasible, the TSF further distances these areas from development feasibility as it lowers the potential RLV.
As Table 6 shows, five of the prototypes (due to their development size and location) are not anticipated to receive any CEQA streamlining benefits (Prototypes 1 through 4 and Prototype 6). The remaining five prototypes could potentially benefit from reduced transportation and environmental costs and 5 months in predevelopment time savings, which would lower predevelopment carry costs (Prototypes 5 and 7 through 10). For three of these prototypes (Prototypes 5, 7 and 10), the potential benefits from CEQA streamlining could more than offset the increase in impact fees, and this results in an increase in residual land value when predevelopment savings are assumed to occur (RLV with predevelopment savings). Without predevelopment savings, the RLV decreases for all prototypes, ranging from about -‐1% to -‐8%, which is within the -‐10% feasibility threshold.
As described in Chapter III, about half of new housing units are projected to be developed in larger developments within area plans, some of which may be eligible for a fee credit that would help offset a portion of the financial impact from the TSF. Four of the prototypes are located within area plans that would be eligible for an area plan fee credit for residential development (Prototypes 4, 5, 6 and 8). In summary, the impact on RLV varies among the prototypes depending on the following:
• Land use: non-‐residential prototypes (Prototypes 7 and 10) have the smallest increase in impact fees due to the TSF, as the Base Case TSF is about the same as the TIDF, while residential developments experience the greatest increase in impact fees under the TSP.
• Environmental review & predevelopment savings: larger developments could potentially benefit from reduced transportation and environmental costs plus decreased predevelopment carry costs as a result of time savings from CEQA/LOS reform (Prototypes 5 and 7 through 10). These potential financial benefits are modeled in the “with predevelopment savings” scenario, and they are not assumed to occur in the “without predevelopment savings” scenario.
31 Please refer to Chapter IV and Appendix A for further information regarding the methodology used in this analysis. Revenues are equal to potential sales prices for condominiums or development values for rental property less sales expenses. 32 The RLV for Prototype 3 is below 5% of total development value and is less than $40,000 per housing unit, which is below the typical asking prices for land in San Francisco and is less than land values for similarly located properties with existing uses. This finding indicates that similar developments in the outer neighborhoods may not generate sufficient development value to enable developers to pay for property at its current market value (particularly considering many infill sites have existing development that is generating rental income) or generate sufficient developer margin to warrant private investment.
Page%27
Table&6.&Summary&of&Economic&Impact&of&Transportation&Sustainability&Program&Under&Base&Case&TSF&Scenario
Base&Case&TIDF Impact&on&Residual&Land&Values&(RLV)&Under&Base&Case&TSF&Scenario
Predevelopment&Savings&(Credit)
Fee&Credit
1.&Geary&Ave(Small%Res.%Mixed3use)
$2,050,200 23% Prior%Use $69,900 $0 $0 $0 $1,980,300 (3%) $1,980,300 (3%)
2.&Van&Ness&Ave(Medium%Res.%Mixed3use)
$7,017,300 10% Prior%Use $458,900 $0 $0 $0 $6,558,400 (7%) $6,558,400 (7%)
3.&Outer&Mission(Small%Res.%Mixed3use)
$920,600 4% Prior%Use $42,400 $0 $0 $0 $878,200 (5%) $878,200 (5%)
4.&Mission(Small%Res.%Mixed3use)
$3,140,700 21%Prior%Use,%Area%Plan
$23,600 $0 $0 $0 $3,117,100 (1%) $3,117,100 (1%)
5.&Central&Waterfront(Large%Res.%Mixed3use)
$22,869,100 21%Prior%Use,%Area%Plan
$249,900 ($561,000) ($274,900) ($835,900) $23,455,100 3% $22,619,200 (1%)
6.&East&SoMa(Medium%Res.%Mixed3use)
$6,339,100 14%Prior%Use,%Area%Plan
$127,600 $0 $0 $0 $6,211,500 (2%) $6,211,500 (2%)
7.&East&SoMa(Large%Office)
$28,722,700 15% Prior%Use $122,700 ($95,000) ($479,500) ($574,500) $29,174,500 2% $28,600,000 (0%)
8.&East&SoMa(Large%Res.%Mixed3use)
$13,678,300 10%Prior%Use,%Area%Plan
$639,200 ($25,000) ($331,100) ($356,100) $13,395,200 (2%) $13,039,100 (5%)
9.&Transit&Center(Large%Residential)%%!&&
$25,892,400 8% None $2,059,700 ($25,000) ($769,100) ($794,100) $24,626,800 (5%) $23,832,700 (8%)
10.&Transit&Center(Large%Office)
$42,188,700 13% None $205,200 ($50,000) ($824,500) ($874,500) $42,858,000 2% $41,983,500 (0%)
Notes:%Numbers%rounded%to%nearest%$100.%Please%refer%to%Chapters%III%and%IV%for%further%information%on%the%prototype%assumptions.%(Table%3%summarizes%the%fee%calculations%for%the%Base%Case%TSF%and%Table%5%presentsthe%environmental%cost%savings.)
Source:%San%Francisco%Planning%Department,%2015.
Total&Cost&Savings[e=c+d]
Base&Case&TIDF&RLV&&[a]
Prototype
Base&Case&TSF&Fee&Increase&(Compared&to&Existing&Fees&Under&Base&Case&TIDF)
[b]
Environmental&Cost&Savings&
[c]
Time&Savings&(Predevelopment&Carry&Savings)
[d]
RLV&With&Predevelopment&Savings
Base&Case&TIDF&
RLV&as&%&of&Revenues
RLV&Without&Predevelopment&Savings
Base&Case&TSF&RLV&[abbbe]
%&Change&&
Base&Case&TSF&RLV[abb]
%&Change
San Francisco Transportation Sustainability Fee: Economic Feasibility Study
Page 28
• Area Plan fee credits: residential developments located within certain Area Plans would be eligible for a partial fee credit (Prototypes 4, 5, 6 and 8) equivalent to the transit component of the Area Plan fee.
• Prior use fee credits: prototypes with existing buildings would be eligible to receive a fee credit for prior uses, which reduces the level of TIDF, TSF and area plan fees (Prototypes 1 through 8).
The financial analysis indicates that implementation of the proposed TSP at the Base Case TSF would have a modest financial impact on future development feasibility due to the combined effects described above under the potential development scenarios for each prototype:
• The difference in residual land values, with and without predevelopment savings, does not decrease by more than 10% for all prototypes.
• With predevelopment savings as a result of CEQA/LOS reform, residual land values could potentially increase under the TSP by about 2% to 3% where the streamlining benefits more than offset the increase in development costs with the TSP (Prototypes 5, 7 and 10). o If a project is currently required to undertake a transportation LOS analysis, the TSP will
provide modest economic benefits if the level of environmental review remains the same. (As shown in this study, a transportation LOS analysis is typically required for larger sized developments.) In these cases, the elimination of LOS analysis could reduce consultant costs by $25,000 to $95,000 and result in a time savings of 5 months during the entitlement period, which would potentially decrease predevelopment carrying costs. This scenario applies to four of the ten prototypes (Prototypes 7 through 10) evaluated in this study. For the office prototypes (Prototypes 7 and 10), the combination of consultant cost savings and predevelopment savings could fully offset the impact of the Base Case TSF level.
o Projects that would be eligible for a lesser level of environmental review as the result of CEQA/LOS reform would achieve the greatest economic benefit. For instance, one of the prototypes studied (Prototype 5) might be eligible for a Community Plan Exemption (CPE) under the TSP, as compared to a Focused Environmental Impact Report (FEIR) under current conditions. This could potentially result in direct cost savings of about $560,000 in environmental consultant/Planning Department fees and predevelopment time savings of 5 months, which could fully offset the impact of the Base Case TSF level.
• Without predevelopment time savings, residual land values are projected to decrease between about 0% to -‐8% for all prototypes.33 The greatest decrease in RLV occurs for residential projects located Outside Plan Areas or Inside Plan Areas where fee credits do not substantially offset the TSF (Prototypes 2, 3, 8 and 9).
As described above, the extent of the financial impact will vary depending on land use, whether or not the development is located in a Plan Area, whether it will benefit from the potential predevelopment time and cost savings and the level of fee credits. These findings are generally consistent with the prior (2012) economic analysis of the proposed TSP.
33 As no offsets to development costs are assumed from CEQA/LOS streamlining, the difference in RLV without predevelopment savings is directly attributable to the increase in development impact fees from the TSP.

San Francisco Transportation Sustainability Fee: Economic Feasibility Study
Page 29
VII. Sensitivity Analysis of Alternative TSF Levels The sensitivity analysis studies the effect of higher TSF levels, modeled at 125%, 150% and 250% of the Base Case TSF levels, which are within the maximum justified fee levels from the 2015 TSF Nexus Study. Table 7 summarizes and compares the fee levels for each scenario with the maximum justified fee amounts. The table indicates that the TSF fee levels evaluated in this sensitivity analysis would range from $6.19 at the Base Case TSF to $15.48/GSF at 250% TSF for residential development and from $14.43 at the Base Case TSF to $36.08/GSF at 250% TSF for non-‐residential development.
Table 7. TSF Sensitivity Analysis Scenarios (2015 Dollars)
Use Base Case TSF ($/GSF)
125% TSF ($/GSF)
150% TSF ($/GSF)
250% TSF ($/GSF)
Maximum Justified Fee1 (not modeled)
Residential $6.19 $7.74 $9.29 $15.48 $30.95 Non-‐residential $14.43 $18.04 $21.65 $36.08 $87.52 PDR2 $7.61 n/a n/a n/a $26.09 Note: 1 Maximum Justified Fee is not modeled but is presented in the San Francisco Transportation
Sustainability Fee Nexus Study (2015). 2 New development of PDR uses was not analyzed in the feasibility study.
The financial results for each of these sensitivity analysis scenarios are summarized in tables that are presented at the end of this report:
• Table 8 summarizes the results from the sensitivity analysis, as measured by the percentage change in RLV for each of the four alternative TSF levels (Base Case TSF, 125% TSF, 150% TSF and 250% TSF) compared to current conditions without TSP (Base Case TIDF).
• Table 9 summarizes the key prototype characteristics and findings that contribute to the sensitivity analysis results shown in Table 8 and the supporting tables.
• Tables 10.1 through 10.10 present the financial results for each prototype, comparing the total revenues and development costs under current conditions without TSP (Base Case TIDF) to each of the alternative TSF fee scenarios.
A. 125% TSF Scenario
Under the 125% TSF scenario, the TSF would increase by about $1.60/GSF for residential and about $3.60/GSF for non-‐residential development over the Base Case TSF, without consideration of any predevelopment savings or fee credits. Based on a typical residential unit size of 950 NSF, this translates to a potential increase in impact fees of about $9,200 per unit (or about $8/GSF) as compared to current conditions (Base Case TIDF) or about 1-‐2% of direct construction cost, depending on the type of construction and whether fee credits apply.
As described in the previous section, the proposed fees for non-‐residential development under the Base Case TSF scenario are about the same as the fees currently being charged (Base Case TIDF) on new development. Under the 125% TSF scenario, these fees would increase by about $4/GSF over current fee
San Francisco Transportation Sustainability Fee: Economic Feasibility Study
Page 30
levels. This would represent a direct construction cost increase of about 1% or less, depending on the type of construction and whether fee credits apply.34
The results of the sensitivity analysis indicate that the financial impact on new development for the 125% TSF scenario are similar to the results that were found at the Base Case TSF levels.
• The decrease in residual land values, with and without predevelopment savings, is less than or equal to -‐10% for all prototypes.
• With predevelopment savings, only Prototype 5 would receive CEQA streamlining benefits that would more than offset the increase in development costs with the TSP (showing a 2% increase in RLV for Prototype 5). The RLV with predevelopment savings for all of the other prototypes decreases by -‐1% to -‐8%.
• Without predevelopment savings, the greatest decrease in RLV occurs for residential development where area plan fee credits would not be applied (-‐10% for Prototype 9 in TCDP), and for residential projects located Outside Plan Areas or Inside Plan Areas where fee credits do not substantially offset the TSF (Prototypes 2, 3 and 8).
B. 150% TSF Scenario
Under the 150% TSF scenario, the TSF would increase by about $3.10/GSF for residential and about $ 7.20/GSF for non-‐residential development above the Base Case TSF level, without consideration of any predevelopment savings or fee credits.35 For the majority of prototypes, the change in RLV with and without predevelopment savings is less than 10%. However, two prototypes are more heavily impacted by fees at the 150% TSF level: the change in RLV exceeds -‐10% for Prototype 2 (with and without predevelopment savings) and for Prototype 9 (without predevelopment savings). Thus, TSF levels at 150% of the Base Case TSF could inhibit development feasibility in some cases, particularly if revenues were not at pace with development costs and fee credits do not substantially offset the TSF.
C. 250% TSF Scenario
Under the 250% TSF scenario, the TSF would increase by about $9.30/GSF for residential and about $21.65/GSF for non-‐residential development above the Base Case TSF level, without consideration of any predevelopment savings or fee credits.36 TSF levels at 250% could significantly inhibit development feasibility, as the residual land values for most of the prototypes would decrease by 10% or more, with or without predevelopment savings. These higher TSF levels would not be offset by potential CEQA streamlining benefits for any of the prototypes. This level of impact fee increase would substantially increase development costs and exceed the typical contingency allowances for potential increases in development costs that developers include in their development pro formas.
34 As previously described, TSF fee levels for non-‐residential land uses are proposed to be consolidated. Thus, the fee change differs slightly for retail and office, and non-‐residential uses are not eligible for area plan fee credits. 35 Under this 150% TSF scenario, development costs would increase by about $9/GSF for residential and about $8/GSF for non-‐residential compared to current conditions (Base Case TIDF) without consideration of fee credits or predevelopment savings, or an increase of about 2-‐3% of direct construction costs depending on the type of construction and whether fee credits apply. 36 Under this 250% TSF scenario, development costs would increase by about $15/GSF for residential and about $22/GSF for non-‐residential as compared to current conditions (Base Case TIDF) without consideration of fee credits or predevelopment savings, or an increase of about 4-‐6% of direct construction costs depending on the type of construction and whether fee credits apply.
San Francisco Transportation Sustainability Fee: Economic Feasibility Study
Page 31
VIII. Conclusion The Transportation Sustainability Program is designed to fund transportation projects to serve new growth and help streamline the transportation component of the City’s environmental review process. Overall, the TSF Economic Feasibility Study finds that the TSF does not significantly impact project viability at the Base Case TSF levels or at 125% of Base Case TSF, either with or without the anticipated predevelopment savings. New development in certain neighborhoods in the City that have lower than average price levels and rents may not be currently feasible given the high cost of construction relative to potential revenues. While the TSF itself will not cause these developments to be infeasible, the TSF further distances these areas from development feasibility.
The study also evaluated the impact of potential CEQA/LOS reform on development, which in some cases may partially or fully offset the impact of the TSF. Since transportation is only one of the potential environmental impacts to be analyzed during the environmental review process, the level of predevelopment savings a project will experience depends on whether or not CEQA/LOS reform results in substantial changes to the environmental review required. All projects that currently need to conduct a LOS analysis will experience modest economic benefits after this requirement is eliminated. For some projects, the benefit of CEQA/LOS reform will be more dramatic – in cases where the elimination of LOS analysis means that projects can undergo a lesser level of environmental review (for instance, going from a CPE plus Focused EIR to just a CPE), the potential time and cost savings are substantial.
For developments that do not currently need a transportation study (typically smaller developments), no direct predevelopment cost or time savings would likely occur as a result of CEQA/LOS reform. These developments would not receive a direct economic benefit from the TSP and would be subject to an increased impact fee burden under TSF. However, these types of developments may experience indirect benefits as CEQA/LOS reform may potentially shorten backlogs for City staff and streamline the environmental review process for all projects.
If the city’s real estate market were to experience a downturn and future revenue growth is not sufficient to cover construction costs and other development costs, then financial feasibility of new development will become more difficult, and new development will be more sensitive to higher impact fees. For all of these reasons, the study findings indicate that the TSF should be initially established at no more than 125% of the Base Case TSF level.
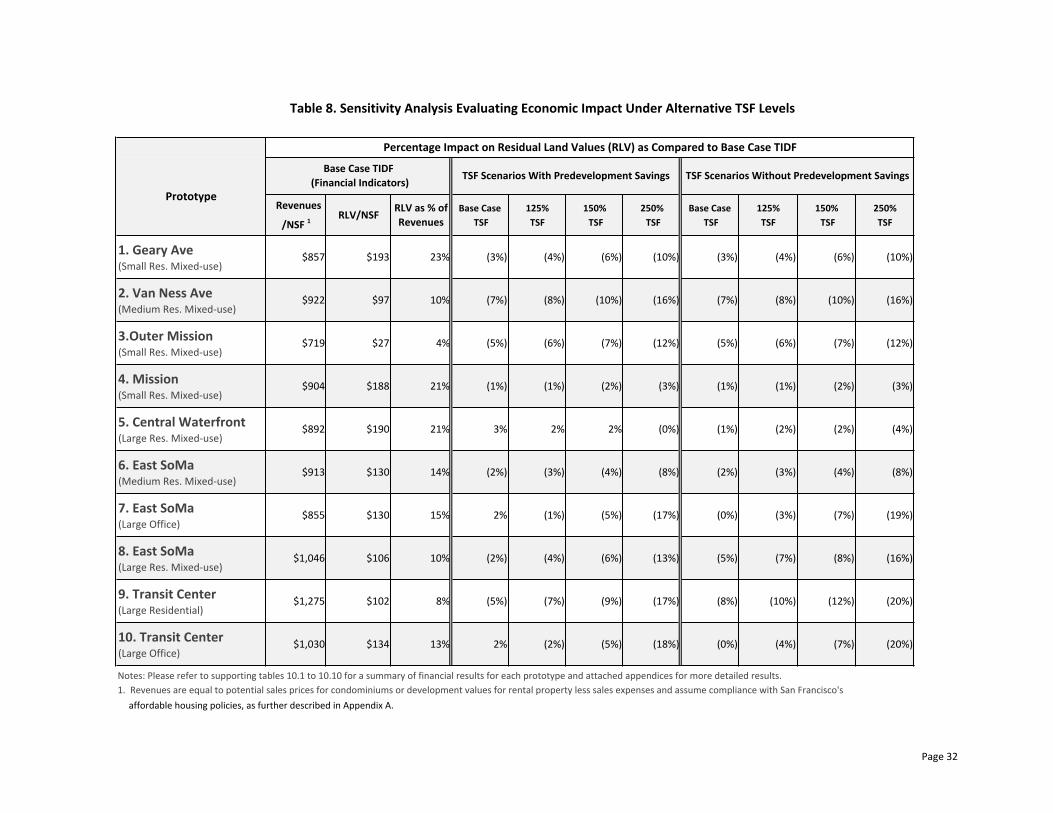
Page%32
Table&8.&Sensitivity&Analysis&Evaluating&Economic&Impact&Under&Alternative&TSF&LevelsTable&9.&Summary&of&Findings&From&TSF&Sensitivity&Analysis&for&Each&Prototype
Percentage&Impact&on&Residual&Land&Values&(RLV)&as&Compared&to&Base&Case&TIDFSummary&of&Key&Prototype&Characteristics
&&Revenues
/NSF&1RLV/NSF RLV&as&%&of&
RevenuesBase&Case
&TSF125%&TSF
150%&TSF
250%&TSF
Base&Case&TSF
125%&TSF
150%&TSF
250%TSF
1.&Geary&Ave(Small%Res.%Mixed3use)
$857% $193% 23% (3%) (4%) (6%) (10%) (3%) (4%) (6%) (10%)
2.&Van&Ness&Ave(Medium%Res.%Mixed3use)
$922% $97% 10% (7%) (8%) (10%) (16%) (7%) (8%) (10%) (16%)
3.Outer&Mission(Small%Res.%Mixed3use)
$719% $27% 4% (5%) (6%) (7%) (12%) (5%) (6%) (7%) (12%)
4.&Mission(Small%Res.%Mixed3use)
$904% $188% 21% (1%) (1%) (2%) (3%) (1%) (1%) (2%) (3%)
5.&Central&Waterfront(Large%Res.%Mixed3use)
$892% $190% 21% 3%% 2%% 2%% (0%) (1%) (2%) (2%) (4%)
6.&East&SoMa(Medium%Res.%Mixed3use)
$913% $130% 14% (2%) (3%) (4%) (8%) (2%) (3%) (4%) (8%)
7.&East&SoMa(Large%Office)
$855% $130% 15% 2%% (1%) (5%) (17%) (0%) (3%) (7%) (19%)
8.&East&SoMa(Large%Res.%Mixed3use)
$1,046% $106% 10% (2%) (4%) (6%) (13%) (5%) (7%) (8%) (16%)
9.&Transit&Center(Large%Residential)%%!&&
$1,275% $102% 8% (5%) (7%) (9%) (17%) (8%) (10%) (12%) (20%)
10.&Transit&Center(Large%Office)
$1,030% $134% 13% 2%% (2%) (5%) (18%) (0%) (4%) (7%) (20%)
affordable%housing%policies,%as%further%described%in%Appendix%A.%
Notes:%Please%refer%to%supporting%tables%10.1%to%10.10%for%a%summary%of%financial%results%for%each%prototype%and%attached%appendices%for%more%detailed%results.1.%%Revenues%are%equal%to%potential%sales%prices%for%condominiums%or%development%values%for%rental%property%less%sales%expenses%and%assume%compliance%with%San%Francisco's%
Prototype
TSF&Scenarios&With&Predevelopment&Savings TSF&Scenarios&Without&Predevelopment&SavingsBase&Case&TIDF&(Financial&Indicators)

Page%33
Table&9.&Summary&of&Findings&From&TSF&Sensitivity&Analysis&for&Each&PrototypeTable&6.&Summary&of&Economic&Impact&of&Transportation&Sustainability&Program&Under&Base&Case&TSF&Scenario
Summary&of&Key&Prototype&Characteristics &
Potential&Predevelopment& &Key&Contributors&to
Predominant&Use
Affordable&Housing Retail Building&
Height
RLV&Results&Under&Base&Case&
TIDF&1Area&Plan Fee&Credit
Savings&from&CEQA/LOS&Reform
&RLV&Results&Under&TSF&Sensitivity&Scenarios
1.&Geary&Ave(Small%Res.%Mixed3use)
Residential%
CondominiumNone
Ground%
Floor45%Feet Strong%RLV None Prior%Use None
Strong%RLV%and%prior%use%fee%credit%helps%offset%
impact%of%TSF%at%all%fee%levels.%
2.&Van&Ness&Ave(Medium%Res.%Mixed3use)
Residential%
CondominiumOnsite
Ground%
Floor80%Feet Moderate%RLV None Prior%Use None
While%prior%use%fee%credit%helps%offset%impact%of%TSF,%
RLV%is%significantly%reduced%at%150%%and%250%%
scenarios.
3.&Outer&Mission(Small%Res.%Mixed3use)
Residential%
CondominiumOnsite
Ground%
Floor65%Feet
Low%RLV%
(Development%not%
likely%feasible)
None Prior%Use None
While%prior%use%fee%credit%helps%offset%impact%of%TSF,%
lower%revenues%in%this%area%coupled%with%higher,%mid3
rise%construction%costs%hamper%development%
feasibility.
4.&Mission(Small%Res.%Mixed3use)
Residential%
CondominiumOnsite
Ground%
Floor50%Feet Strong%RLV
Eastern%
Neighborhoods
Prior%Use,%
Area%PlanNone
Strong%RLV%and%fee%credits%help%offset%impact%of%TSF%
at%all%fee%levels.%
5.&Central&Waterfront(Large%Res.%Mixed3use)
Residential%
RentalOnsite
Ground%
Floor65%Feet Strong%RLV
Eastern%
Neighborhoods
Prior%Use,%
Area%PlanSignificant
Strong%RLV,%predevelopment%savings%and%fee%credits%
help%offset%impact%of%TSF%at%all%fee%levels.%
6.&East&SoMa(Medium%Res.%Mixed3use)
Residential%
RentalOnsite
Ground%
Floor85%Feet Moderate%RLV
Eastern%
Neighborhoods
Prior%Use,%
Area%PlanNone
Fee%credits%and%moderate%RLV%help%offset%impact%of%
TSF%at%all%fee%levels.%
7.&East&SoMa(Large%Office)
OfficeJobs3Housing%
Linkage%Fee
Ground%
Floor160%Feet Moderate%RLV
Eastern%
NeighborhoodsPrior%Use Moderate
Minimal%impact%at%lower%TSF%levels%as%non3
residential%TIDF%is%close%to%Base%Case%TSF%levels.%
TSF%levels%at%250%%significantly%reduce%RLV.
8.&East&SoMa(Large%Res.%Mixed3use)
Residential%
CondominiumOnsite
Ground%
Floor160%Feet Moderate%RLV
Eastern%
Neighborhoods
Prior%Use,%
Area%PlanModerate
Predevelopment%savings%help%offset%impact,%but%
without%predevelopment%savings,%TSF%levels%at%250%%
significantly%reduce%RLV%despite%fee%credits.
9.&Transit&Center(Large%Residential)%%!&&
Residential%
Condominium
Affordable%
Housing%FeeNone 400%Feet Moderate%RLV
Transit%Center%
District%PlanNone Moderate
Predevelopment%savings%help%offset%impact,%but%
without%predevelopment%savings,%TSF%levels%at%150%%
and%250%%significantly%reduce%RLV.
10.&Transit&Center(Large%Office)
OfficeJobs3Housing%
Linkage%Fee
Ground%
Floor400%Feet Moderate%RLV
Transit%Center%
District%PlanNone Moderate
Minimal%impact%at%lower%TSF%levels%as%non3
residential%TIDF%is%close%to%Base%Case%TSF%levels.%
TSF%levels%at%250%%significantly%reduce%RLV.
Notes:%Please%refer%to%supporting%tables%10.1%to%10.10%for%a%summary%of%financial%results%for%each%prototype%and%attached%appendices%for%more%detailed%results.
1.%%Strong%RLV%indicates%values%exceeding%15%%of%revenues,%Moderate%RLV%indicates%values%between%about%5315%%of%revenues,%and%Low%RLV%indicates%values%below%5%%of%revenues.%%
Prototype
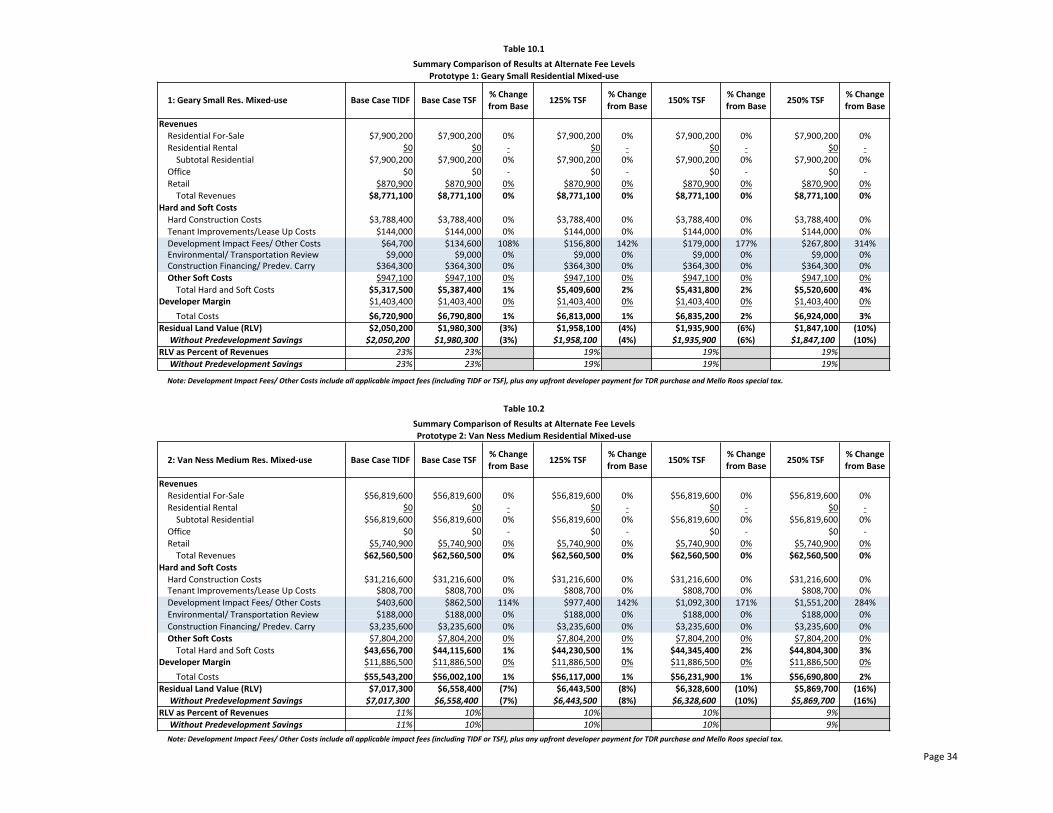
Table 10.1Summary Comparison of Results at Alternate Fee Levels
Prototype 1: Geary Small Residential Mixed-‐use
1: Geary Small Res. Mixed-‐use Base Case TIDF Base Case TSF % Change from Base 125% TSF % Change
from Base 150% TSF % Change from Base 250% TSF % Change
from Base
RevenuesResidential For-‐Sale $7,900,200 $7,900,200 0% $7,900,200 0% $7,900,200 0% $7,900,200 0%Residential Rental $0 $0 -‐ $0 -‐ $0 -‐ $0 -‐Subtotal Residential $7,900,200 $7,900,200 0% $7,900,200 0% $7,900,200 0% $7,900,200 0%
Office $0 $0 -‐ $0 -‐ $0 -‐ $0 -‐Retail $870,900 $870,900 0% $870,900 0% $870,900 0% $870,900 0% Total Revenues $8,771,100 $8,771,100 0% $8,771,100 0% $8,771,100 0% $8,771,100 0%
Hard and Soft CostsHard Construction Costs $3,788,400 $3,788,400 0% $3,788,400 0% $3,788,400 0% $3,788,400 0%Tenant Improvements/Lease Up Costs $144,000 $144,000 0% $144,000 0% $144,000 0% $144,000 0%Development Impact Fees/ Other Costs $64,700 $134,600 108% $156,800 142% $179,000 177% $267,800 314%Environmental/ Transportation Review $9,000 $9,000 0% $9,000 0% $9,000 0% $9,000 0%Construction Financing/ Predev. Carry $364,300 $364,300 0% $364,300 0% $364,300 0% $364,300 0%Other Soft Costs $947,100 $947,100 0% $947,100 0% $947,100 0% $947,100 0%Total Hard and Soft Costs $5,317,500 $5,387,400 1% $5,409,600 2% $5,431,800 2% $5,520,600 4%
Developer Margin $1,403,400 $1,403,400 0% $1,403,400 0% $1,403,400 0% $1,403,400 0%Total Costs $6,720,900 $6,790,800 1% $6,813,000 1% $6,835,200 2% $6,924,000 3%
Residual Land Value (RLV) $2,050,200 $1,980,300 (3%) $1,958,100 (4%) $1,935,900 (6%) $1,847,100 (10%) Without Predevelopment Savings $2,050,200 $1,980,300 (3%) $1,958,100 (4%) $1,935,900 (6%) $1,847,100 (10%)
RLV as Percent of Revenues 23% 23% 19% 19% 19% Without Predevelopment Savings 23% 23% 19% 19% 19%
Note: Development Impact Fees/ Other Costs include all applicable impact fees (including TIDF or TSF), plus any upfront developer payment for TDR purchase and Mello Roos special tax.
Table 10.2Summary Comparison of Results at Alternate Fee LevelsPrototype 2: Van Ness Medium Residential Mixed-‐use
2: Van Ness Medium Res. Mixed-‐use Base Case TIDF Base Case TSF % Change from Base 125% TSF % Change
from Base 150% TSF % Change from Base 250% TSF % Change
from Base
RevenuesResidential For-‐Sale $56,819,600 $56,819,600 0% $56,819,600 0% $56,819,600 0% $56,819,600 0%Residential Rental $0 $0 -‐ $0 -‐ $0 -‐ $0 -‐Subtotal Residential $56,819,600 $56,819,600 0% $56,819,600 0% $56,819,600 0% $56,819,600 0%
Office $0 $0 -‐ $0 -‐ $0 -‐ $0 -‐Retail $5,740,900 $5,740,900 0% $5,740,900 0% $5,740,900 0% $5,740,900 0% Total Revenues $62,560,500 $62,560,500 0% $62,560,500 0% $62,560,500 0% $62,560,500 0%
Hard and Soft CostsHard Construction Costs $31,216,600 $31,216,600 0% $31,216,600 0% $31,216,600 0% $31,216,600 0%Tenant Improvements/Lease Up Costs $808,700 $808,700 0% $808,700 0% $808,700 0% $808,700 0%Development Impact Fees/ Other Costs $403,600 $862,500 114% $977,400 142% $1,092,300 171% $1,551,200 284%Environmental/ Transportation Review $188,000 $188,000 0% $188,000 0% $188,000 0% $188,000 0%Construction Financing/ Predev. Carry $3,235,600 $3,235,600 0% $3,235,600 0% $3,235,600 0% $3,235,600 0%Other Soft Costs $7,804,200 $7,804,200 0% $7,804,200 0% $7,804,200 0% $7,804,200 0%Total Hard and Soft Costs $43,656,700 $44,115,600 1% $44,230,500 1% $44,345,400 2% $44,804,300 3%
Developer Margin $11,886,500 $11,886,500 0% $11,886,500 0% $11,886,500 0% $11,886,500 0%Total Costs $55,543,200 $56,002,100 1% $56,117,000 1% $56,231,900 1% $56,690,800 2%
Residual Land Value (RLV) $7,017,300 $6,558,400 (7%) $6,443,500 (8%) $6,328,600 (10%) $5,869,700 (16%) Without Predevelopment Savings $7,017,300 $6,558,400 (7%) $6,443,500 (8%) $6,328,600 (10%) $5,869,700 (16%)
RLV as Percent of Revenues 11% 10% 10% 10% 9% Without Predevelopment Savings 11% 10% 10% 10% 9%Note: Development Impact Fees/ Other Costs include all applicable impact fees (including TIDF or TSF), plus any upfront developer payment for TDR purchase and Mello Roos special tax.
Page 34
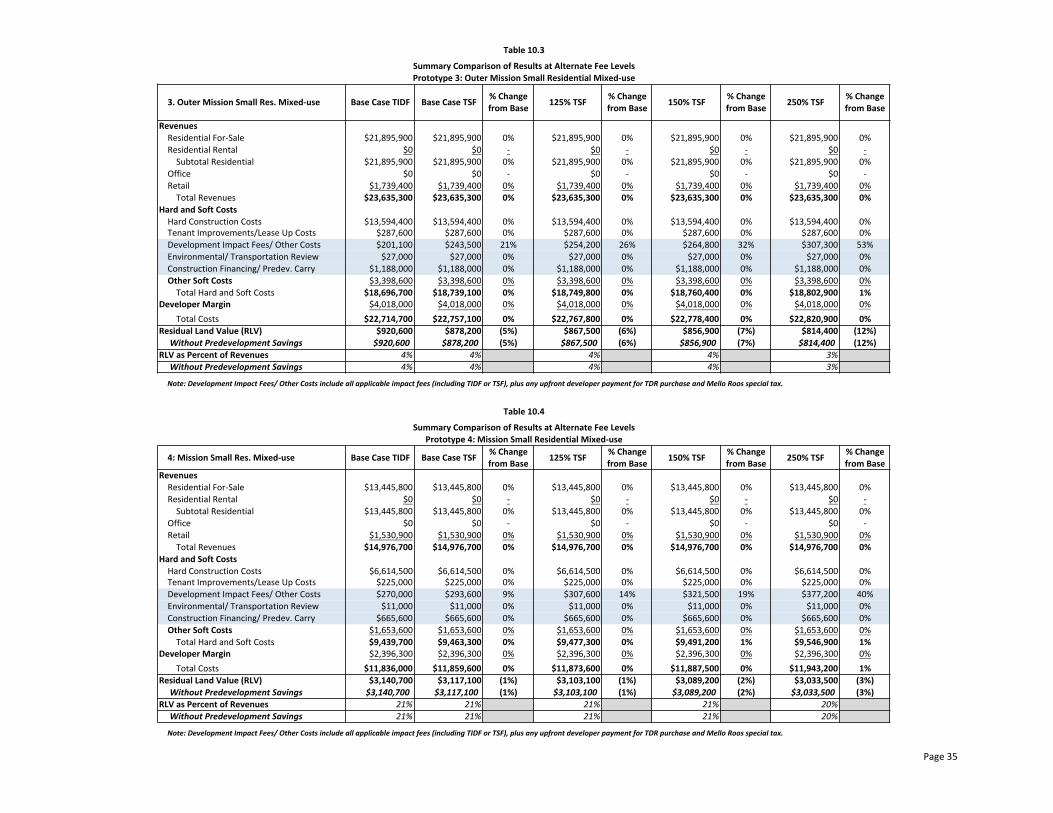
Table 10.3
Summary Comparison of Results at Alternate Fee LevelsPrototype 3: Outer Mission Small Residential Mixed-‐use
3. Outer Mission Small Res. Mixed-‐use Base Case TIDF Base Case TSF % Change from Base 125% TSF % Change
from Base 150% TSF % Change from Base 250% TSF % Change
from Base
RevenuesResidential For-‐Sale $21,895,900 $21,895,900 0% $21,895,900 0% $21,895,900 0% $21,895,900 0%Residential Rental $0 $0 -‐ $0 -‐ $0 -‐ $0 -‐Subtotal Residential $21,895,900 $21,895,900 0% $21,895,900 0% $21,895,900 0% $21,895,900 0%
Office $0 $0 -‐ $0 -‐ $0 -‐ $0 -‐Retail $1,739,400 $1,739,400 0% $1,739,400 0% $1,739,400 0% $1,739,400 0% Total Revenues $23,635,300 $23,635,300 0% $23,635,300 0% $23,635,300 0% $23,635,300 0%
Hard and Soft CostsHard Construction Costs $13,594,400 $13,594,400 0% $13,594,400 0% $13,594,400 0% $13,594,400 0%Tenant Improvements/Lease Up Costs $287,600 $287,600 0% $287,600 0% $287,600 0% $287,600 0%Development Impact Fees/ Other Costs $201,100 $243,500 21% $254,200 26% $264,800 32% $307,300 53%Environmental/ Transportation Review $27,000 $27,000 0% $27,000 0% $27,000 0% $27,000 0%Construction Financing/ Predev. Carry $1,188,000 $1,188,000 0% $1,188,000 0% $1,188,000 0% $1,188,000 0%Other Soft Costs $3,398,600 $3,398,600 0% $3,398,600 0% $3,398,600 0% $3,398,600 0%Total Hard and Soft Costs $18,696,700 $18,739,100 0% $18,749,800 0% $18,760,400 0% $18,802,900 1%
Developer Margin $4,018,000 $4,018,000 0% $4,018,000 0% $4,018,000 0% $4,018,000 0%Total Costs $22,714,700 $22,757,100 0% $22,767,800 0% $22,778,400 0% $22,820,900 0%
Residual Land Value (RLV) $920,600 $878,200 (5%) $867,500 (6%) $856,900 (7%) $814,400 (12%) Without Predevelopment Savings $920,600 $878,200 (5%) $867,500 (6%) $856,900 (7%) $814,400 (12%)
RLV as Percent of Revenues 4% 4% 4% 4% 3% Without Predevelopment Savings 4% 4% 4% 4% 3%
Note: Development Impact Fees/ Other Costs include all applicable impact fees (including TIDF or TSF), plus any upfront developer payment for TDR purchase and Mello Roos special tax.
Table 10.4
Summary Comparison of Results at Alternate Fee LevelsPrototype 4: Mission Small Residential Mixed-‐use
4: Mission Small Res. Mixed-‐use Base Case TIDF Base Case TSF % Change from Base 125% TSF % Change
from Base 150% TSF % Change from Base 250% TSF % Change
from BaseRevenuesResidential For-‐Sale $13,445,800 $13,445,800 0% $13,445,800 0% $13,445,800 0% $13,445,800 0%Residential Rental $0 $0 -‐ $0 -‐ $0 -‐ $0 -‐Subtotal Residential $13,445,800 $13,445,800 0% $13,445,800 0% $13,445,800 0% $13,445,800 0%
Office $0 $0 -‐ $0 -‐ $0 -‐ $0 -‐Retail $1,530,900 $1,530,900 0% $1,530,900 0% $1,530,900 0% $1,530,900 0% Total Revenues $14,976,700 $14,976,700 0% $14,976,700 0% $14,976,700 0% $14,976,700 0%
Hard and Soft CostsHard Construction Costs $6,614,500 $6,614,500 0% $6,614,500 0% $6,614,500 0% $6,614,500 0%Tenant Improvements/Lease Up Costs $225,000 $225,000 0% $225,000 0% $225,000 0% $225,000 0%Development Impact Fees/ Other Costs $270,000 $293,600 9% $307,600 14% $321,500 19% $377,200 40%Environmental/ Transportation Review $11,000 $11,000 0% $11,000 0% $11,000 0% $11,000 0%Construction Financing/ Predev. Carry $665,600 $665,600 0% $665,600 0% $665,600 0% $665,600 0%Other Soft Costs $1,653,600 $1,653,600 0% $1,653,600 0% $1,653,600 0% $1,653,600 0%Total Hard and Soft Costs $9,439,700 $9,463,300 0% $9,477,300 0% $9,491,200 1% $9,546,900 1%
Developer Margin $2,396,300 $2,396,300 0% $2,396,300 0% $2,396,300 0% $2,396,300 0%Total Costs $11,836,000 $11,859,600 0% $11,873,600 0% $11,887,500 0% $11,943,200 1%
Residual Land Value (RLV) $3,140,700 $3,117,100 (1%) $3,103,100 (1%) $3,089,200 (2%) $3,033,500 (3%) Without Predevelopment Savings $3,140,700 $3,117,100 (1%) $3,103,100 (1%) $3,089,200 (2%) $3,033,500 (3%)
RLV as Percent of Revenues 21% 21% 21% 21% 20% Without Predevelopment Savings 21% 21% 21% 21% 20%
Note: Development Impact Fees/ Other Costs include all applicable impact fees (including TIDF or TSF), plus any upfront developer payment for TDR purchase and Mello Roos special tax.
Page 35
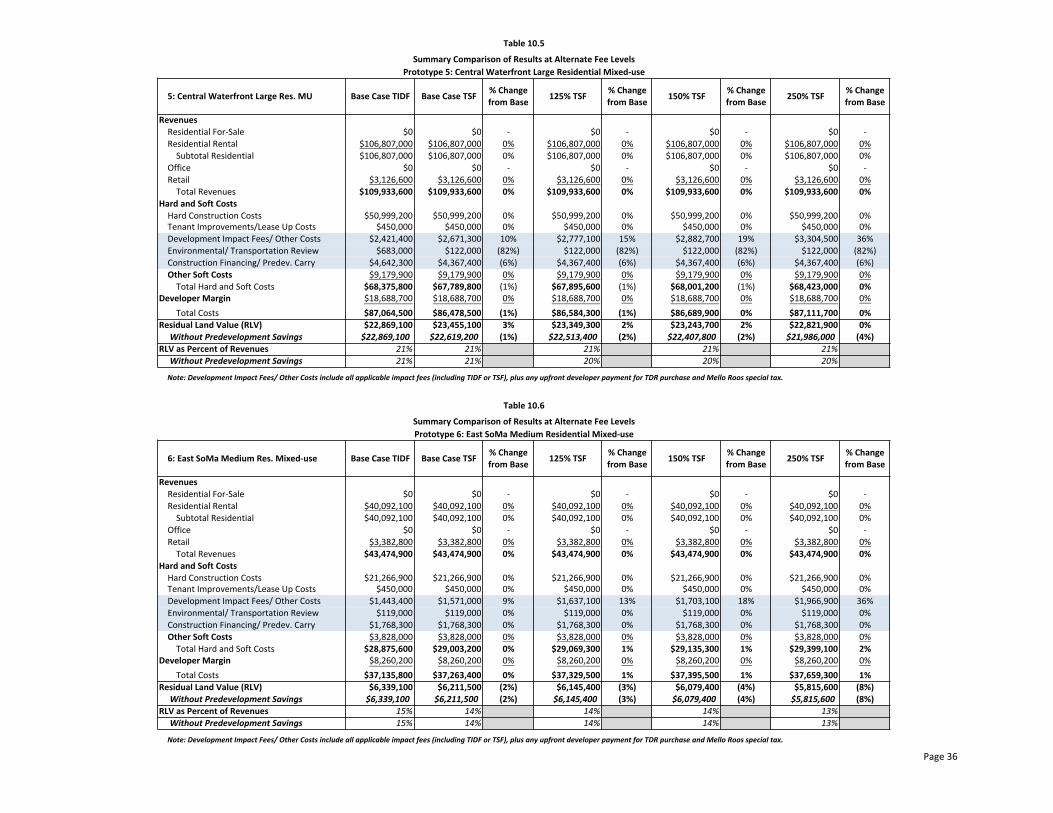
Table 10.5
Summary Comparison of Results at Alternate Fee LevelsPrototype 5: Central Waterfront Large Residential Mixed-‐use
5: Central Waterfront Large Res. MU Base Case TIDF Base Case TSF % Change from Base 125% TSF % Change
from Base 150% TSF % Change from Base 250% TSF % Change
from Base
RevenuesResidential For-‐Sale $0 $0 -‐ $0 -‐ $0 -‐ $0 -‐Residential Rental $106,807,000 $106,807,000 0% $106,807,000 0% $106,807,000 0% $106,807,000 0%Subtotal Residential $106,807,000 $106,807,000 0% $106,807,000 0% $106,807,000 0% $106,807,000 0%
Office $0 $0 -‐ $0 -‐ $0 -‐ $0 -‐Retail $3,126,600 $3,126,600 0% $3,126,600 0% $3,126,600 0% $3,126,600 0% Total Revenues $109,933,600 $109,933,600 0% $109,933,600 0% $109,933,600 0% $109,933,600 0%
Hard and Soft CostsHard Construction Costs $50,999,200 $50,999,200 0% $50,999,200 0% $50,999,200 0% $50,999,200 0%Tenant Improvements/Lease Up Costs $450,000 $450,000 0% $450,000 0% $450,000 0% $450,000 0%Development Impact Fees/ Other Costs $2,421,400 $2,671,300 10% $2,777,100 15% $2,882,700 19% $3,304,500 36%Environmental/ Transportation Review $683,000 $122,000 (82%) $122,000 (82%) $122,000 (82%) $122,000 (82%)Construction Financing/ Predev. Carry $4,642,300 $4,367,400 (6%) $4,367,400 (6%) $4,367,400 (6%) $4,367,400 (6%)Other Soft Costs $9,179,900 $9,179,900 0% $9,179,900 0% $9,179,900 0% $9,179,900 0%Total Hard and Soft Costs $68,375,800 $67,789,800 (1%) $67,895,600 (1%) $68,001,200 (1%) $68,423,000 0%
Developer Margin $18,688,700 $18,688,700 0% $18,688,700 0% $18,688,700 0% $18,688,700 0%Total Costs $87,064,500 $86,478,500 (1%) $86,584,300 (1%) $86,689,900 0% $87,111,700 0%
Residual Land Value (RLV) $22,869,100 $23,455,100 3% $23,349,300 2% $23,243,700 2% $22,821,900 0% Without Predevelopment Savings $22,869,100 $22,619,200 (1%) $22,513,400 (2%) $22,407,800 (2%) $21,986,000 (4%)
RLV as Percent of Revenues 21% 21% 21% 21% 21% Without Predevelopment Savings 21% 21% 20% 20% 20%
Note: Development Impact Fees/ Other Costs include all applicable impact fees (including TIDF or TSF), plus any upfront developer payment for TDR purchase and Mello Roos special tax.
Table 10.6
Summary Comparison of Results at Alternate Fee LevelsPrototype 6: East SoMa Medium Residential Mixed-‐use
6: East SoMa Medium Res. Mixed-‐use Base Case TIDF Base Case TSF % Change from Base 125% TSF % Change
from Base 150% TSF % Change from Base 250% TSF % Change
from Base
RevenuesResidential For-‐Sale $0 $0 -‐ $0 -‐ $0 -‐ $0 -‐Residential Rental $40,092,100 $40,092,100 0% $40,092,100 0% $40,092,100 0% $40,092,100 0%Subtotal Residential $40,092,100 $40,092,100 0% $40,092,100 0% $40,092,100 0% $40,092,100 0%
Office $0 $0 -‐ $0 -‐ $0 -‐ $0 -‐Retail $3,382,800 $3,382,800 0% $3,382,800 0% $3,382,800 0% $3,382,800 0% Total Revenues $43,474,900 $43,474,900 0% $43,474,900 0% $43,474,900 0% $43,474,900 0%
Hard and Soft CostsHard Construction Costs $21,266,900 $21,266,900 0% $21,266,900 0% $21,266,900 0% $21,266,900 0%Tenant Improvements/Lease Up Costs $450,000 $450,000 0% $450,000 0% $450,000 0% $450,000 0%Development Impact Fees/ Other Costs $1,443,400 $1,571,000 9% $1,637,100 13% $1,703,100 18% $1,966,900 36%Environmental/ Transportation Review $119,000 $119,000 0% $119,000 0% $119,000 0% $119,000 0%Construction Financing/ Predev. Carry $1,768,300 $1,768,300 0% $1,768,300 0% $1,768,300 0% $1,768,300 0%Other Soft Costs $3,828,000 $3,828,000 0% $3,828,000 0% $3,828,000 0% $3,828,000 0%Total Hard and Soft Costs $28,875,600 $29,003,200 0% $29,069,300 1% $29,135,300 1% $29,399,100 2%
Developer Margin $8,260,200 $8,260,200 0% $8,260,200 0% $8,260,200 0% $8,260,200 0%Total Costs $37,135,800 $37,263,400 0% $37,329,500 1% $37,395,500 1% $37,659,300 1%
Residual Land Value (RLV) $6,339,100 $6,211,500 (2%) $6,145,400 (3%) $6,079,400 (4%) $5,815,600 (8%) Without Predevelopment Savings $6,339,100 $6,211,500 (2%) $6,145,400 (3%) $6,079,400 (4%) $5,815,600 (8%)
RLV as Percent of Revenues 15% 14% 14% 14% 13% Without Predevelopment Savings 15% 14% 14% 14% 13%
Note: Development Impact Fees/ Other Costs include all applicable impact fees (including TIDF or TSF), plus any upfront developer payment for TDR purchase and Mello Roos special tax.
Page 36
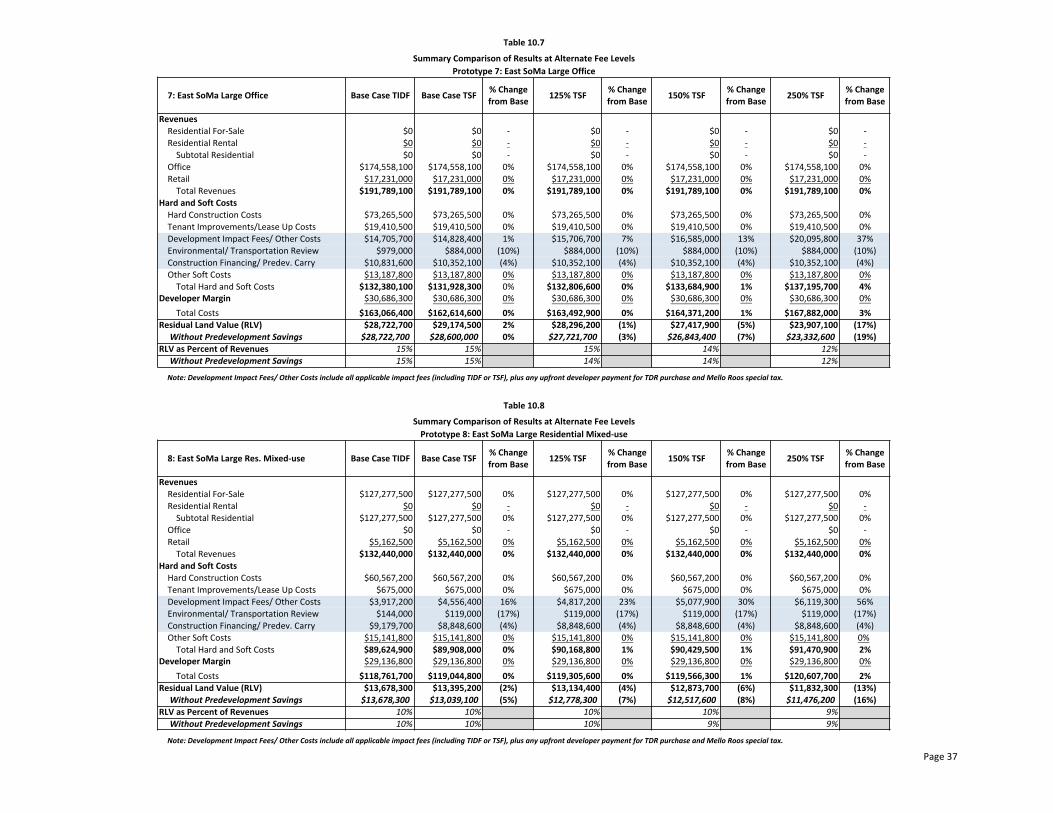
Table 10.7
Summary Comparison of Results at Alternate Fee LevelsPrototype 7: East SoMa Large Office
7: East SoMa Large Office Base Case TIDF Base Case TSF % Change from Base 125% TSF % Change
from Base 150% TSF % Change from Base 250% TSF % Change
from Base
RevenuesResidential For-‐Sale $0 $0 -‐ $0 -‐ $0 -‐ $0 -‐Residential Rental $0 $0 -‐ $0 -‐ $0 -‐ $0 -‐Subtotal Residential $0 $0 -‐ $0 -‐ $0 -‐ $0 -‐
Office $174,558,100 $174,558,100 0% $174,558,100 0% $174,558,100 0% $174,558,100 0%Retail $17,231,000 $17,231,000 0% $17,231,000 0% $17,231,000 0% $17,231,000 0% Total Revenues $191,789,100 $191,789,100 0% $191,789,100 0% $191,789,100 0% $191,789,100 0%
Hard and Soft CostsHard Construction Costs $73,265,500 $73,265,500 0% $73,265,500 0% $73,265,500 0% $73,265,500 0%Tenant Improvements/Lease Up Costs $19,410,500 $19,410,500 0% $19,410,500 0% $19,410,500 0% $19,410,500 0%Development Impact Fees/ Other Costs $14,705,700 $14,828,400 1% $15,706,700 7% $16,585,000 13% $20,095,800 37%Environmental/ Transportation Review $979,000 $884,000 (10%) $884,000 (10%) $884,000 (10%) $884,000 (10%)Construction Financing/ Predev. Carry $10,831,600 $10,352,100 (4%) $10,352,100 (4%) $10,352,100 (4%) $10,352,100 (4%)Other Soft Costs $13,187,800 $13,187,800 0% $13,187,800 0% $13,187,800 0% $13,187,800 0%Total Hard and Soft Costs $132,380,100 $131,928,300 0% $132,806,600 0% $133,684,900 1% $137,195,700 4%
Developer Margin $30,686,300 $30,686,300 0% $30,686,300 0% $30,686,300 0% $30,686,300 0%Total Costs $163,066,400 $162,614,600 0% $163,492,900 0% $164,371,200 1% $167,882,000 3%
Residual Land Value (RLV) $28,722,700 $29,174,500 2% $28,296,200 (1%) $27,417,900 (5%) $23,907,100 (17%) Without Predevelopment Savings $28,722,700 $28,600,000 0% $27,721,700 (3%) $26,843,400 (7%) $23,332,600 (19%)
RLV as Percent of Revenues 15% 15% 15% 14% 12% Without Predevelopment Savings 15% 15% 14% 14% 12%
Note: Development Impact Fees/ Other Costs include all applicable impact fees (including TIDF or TSF), plus any upfront developer payment for TDR purchase and Mello Roos special tax.
Table 10.8
Summary Comparison of Results at Alternate Fee LevelsPrototype 8: East SoMa Large Residential Mixed-‐use
8: East SoMa Large Res. Mixed-‐use Base Case TIDF Base Case TSF % Change from Base 125% TSF % Change
from Base 150% TSF % Change from Base 250% TSF % Change
from Base
RevenuesResidential For-‐Sale $127,277,500 $127,277,500 0% $127,277,500 0% $127,277,500 0% $127,277,500 0%Residential Rental $0 $0 -‐ $0 -‐ $0 -‐ $0 -‐Subtotal Residential $127,277,500 $127,277,500 0% $127,277,500 0% $127,277,500 0% $127,277,500 0%
Office $0 $0 -‐ $0 -‐ $0 -‐ $0 -‐Retail $5,162,500 $5,162,500 0% $5,162,500 0% $5,162,500 0% $5,162,500 0% Total Revenues $132,440,000 $132,440,000 0% $132,440,000 0% $132,440,000 0% $132,440,000 0%
Hard and Soft CostsHard Construction Costs $60,567,200 $60,567,200 0% $60,567,200 0% $60,567,200 0% $60,567,200 0%Tenant Improvements/Lease Up Costs $675,000 $675,000 0% $675,000 0% $675,000 0% $675,000 0%Development Impact Fees/ Other Costs $3,917,200 $4,556,400 16% $4,817,200 23% $5,077,900 30% $6,119,300 56%Environmental/ Transportation Review $144,000 $119,000 (17%) $119,000 (17%) $119,000 (17%) $119,000 (17%)Construction Financing/ Predev. Carry $9,179,700 $8,848,600 (4%) $8,848,600 (4%) $8,848,600 (4%) $8,848,600 (4%)Other Soft Costs $15,141,800 $15,141,800 0% $15,141,800 0% $15,141,800 0% $15,141,800 0%Total Hard and Soft Costs $89,624,900 $89,908,000 0% $90,168,800 1% $90,429,500 1% $91,470,900 2%
Developer Margin $29,136,800 $29,136,800 0% $29,136,800 0% $29,136,800 0% $29,136,800 0%Total Costs $118,761,700 $119,044,800 0% $119,305,600 0% $119,566,300 1% $120,607,700 2%
Residual Land Value (RLV) $13,678,300 $13,395,200 (2%) $13,134,400 (4%) $12,873,700 (6%) $11,832,300 (13%) Without Predevelopment Savings $13,678,300 $13,039,100 (5%) $12,778,300 (7%) $12,517,600 (8%) $11,476,200 (16%)
RLV as Percent of Revenues 10% 10% 10% 10% 9% Without Predevelopment Savings 10% 10% 10% 9% 9%
Note: Development Impact Fees/ Other Costs include all applicable impact fees (including TIDF or TSF), plus any upfront developer payment for TDR purchase and Mello Roos special tax.
Page 37
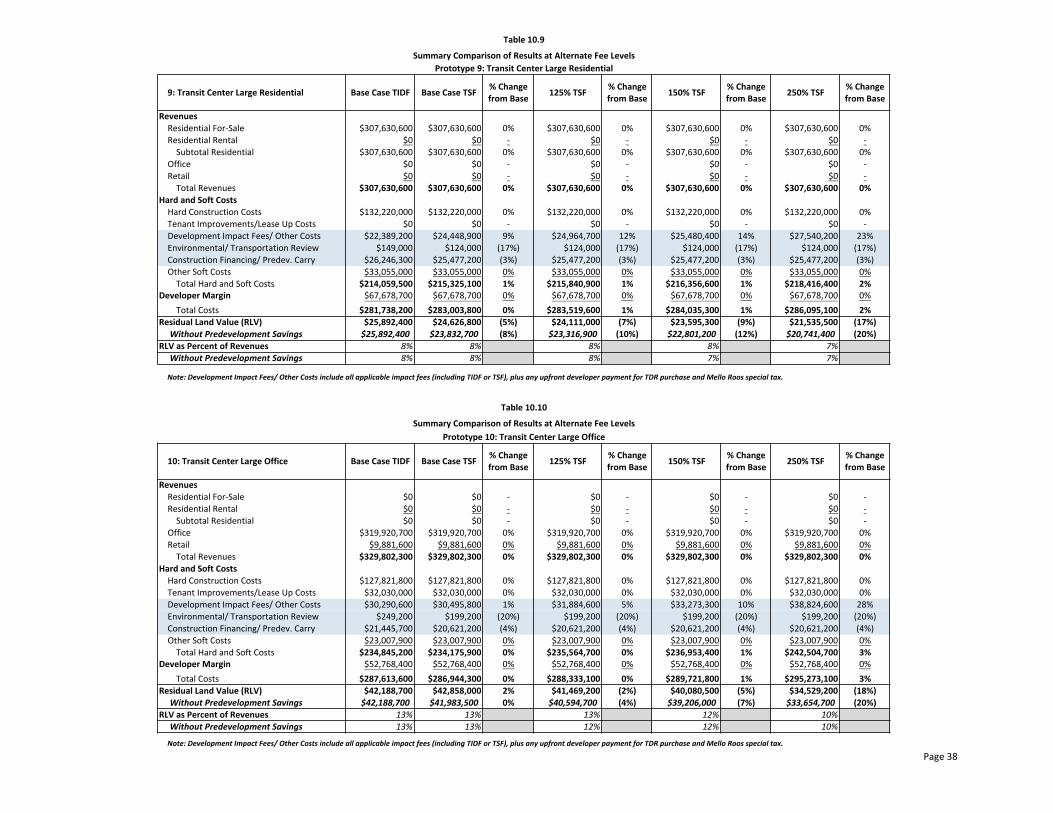
Table 10.9
Summary Comparison of Results at Alternate Fee LevelsPrototype 9: Transit Center Large Residential
9: Transit Center Large Residential Base Case TIDF Base Case TSF % Change from Base 125% TSF % Change
from Base 150% TSF % Change from Base 250% TSF % Change
from Base
RevenuesResidential For-‐Sale $307,630,600 $307,630,600 0% $307,630,600 0% $307,630,600 0% $307,630,600 0%Residential Rental $0 $0 -‐ $0 -‐ $0 -‐ $0 -‐Subtotal Residential $307,630,600 $307,630,600 0% $307,630,600 0% $307,630,600 0% $307,630,600 0%
Office $0 $0 -‐ $0 -‐ $0 -‐ $0 -‐Retail $0 $0 -‐ $0 -‐ $0 -‐ $0 -‐ Total Revenues $307,630,600 $307,630,600 0% $307,630,600 0% $307,630,600 0% $307,630,600 0%
Hard and Soft CostsHard Construction Costs $132,220,000 $132,220,000 0% $132,220,000 0% $132,220,000 0% $132,220,000 0%Tenant Improvements/Lease Up Costs $0 $0 -‐ $0 -‐ $0 -‐ $0 -‐Development Impact Fees/ Other Costs $22,389,200 $24,448,900 9% $24,964,700 12% $25,480,400 14% $27,540,200 23%Environmental/ Transportation Review $149,000 $124,000 (17%) $124,000 (17%) $124,000 (17%) $124,000 (17%)Construction Financing/ Predev. Carry $26,246,300 $25,477,200 (3%) $25,477,200 (3%) $25,477,200 (3%) $25,477,200 (3%)Other Soft Costs $33,055,000 $33,055,000 0% $33,055,000 0% $33,055,000 0% $33,055,000 0%Total Hard and Soft Costs $214,059,500 $215,325,100 1% $215,840,900 1% $216,356,600 1% $218,416,400 2%
Developer Margin $67,678,700 $67,678,700 0% $67,678,700 0% $67,678,700 0% $67,678,700 0%Total Costs $281,738,200 $283,003,800 0% $283,519,600 1% $284,035,300 1% $286,095,100 2%
Residual Land Value (RLV) $25,892,400 $24,626,800 (5%) $24,111,000 (7%) $23,595,300 (9%) $21,535,500 (17%) Without Predevelopment Savings $25,892,400 $23,832,700 (8%) $23,316,900 (10%) $22,801,200 (12%) $20,741,400 (20%)
RLV as Percent of Revenues 8% 8% 8% 8% 7% Without Predevelopment Savings 8% 8% 8% 7% 7%
Note: Development Impact Fees/ Other Costs include all applicable impact fees (including TIDF or TSF), plus any upfront developer payment for TDR purchase and Mello Roos special tax.
Table 10.10
Summary Comparison of Results at Alternate Fee LevelsPrototype 10: Transit Center Large Office
10: Transit Center Large Office Base Case TIDF Base Case TSF % Change from Base 125% TSF % Change
from Base 150% TSF % Change from Base 250% TSF % Change
from Base
RevenuesResidential For-‐Sale $0 $0 -‐ $0 -‐ $0 -‐ $0 -‐Residential Rental $0 $0 -‐ $0 -‐ $0 -‐ $0 -‐Subtotal Residential $0 $0 -‐ $0 -‐ $0 -‐ $0 -‐
Office $319,920,700 $319,920,700 0% $319,920,700 0% $319,920,700 0% $319,920,700 0%Retail $9,881,600 $9,881,600 0% $9,881,600 0% $9,881,600 0% $9,881,600 0% Total Revenues $329,802,300 $329,802,300 0% $329,802,300 0% $329,802,300 0% $329,802,300 0%
Hard and Soft CostsHard Construction Costs $127,821,800 $127,821,800 0% $127,821,800 0% $127,821,800 0% $127,821,800 0%Tenant Improvements/Lease Up Costs $32,030,000 $32,030,000 0% $32,030,000 0% $32,030,000 0% $32,030,000 0%Development Impact Fees/ Other Costs $30,290,600 $30,495,800 1% $31,884,600 5% $33,273,300 10% $38,824,600 28%Environmental/ Transportation Review $249,200 $199,200 (20%) $199,200 (20%) $199,200 (20%) $199,200 (20%)Construction Financing/ Predev. Carry $21,445,700 $20,621,200 (4%) $20,621,200 (4%) $20,621,200 (4%) $20,621,200 (4%)Other Soft Costs $23,007,900 $23,007,900 0% $23,007,900 0% $23,007,900 0% $23,007,900 0%Total Hard and Soft Costs $234,845,200 $234,175,900 0% $235,564,700 0% $236,953,400 1% $242,504,700 3%
Developer Margin $52,768,400 $52,768,400 0% $52,768,400 0% $52,768,400 0% $52,768,400 0%Total Costs $287,613,600 $286,944,300 0% $288,333,100 0% $289,721,800 1% $295,273,100 3%
Residual Land Value (RLV) $42,188,700 $42,858,000 2% $41,469,200 (2%) $40,080,500 (5%) $34,529,200 (18%) Without Predevelopment Savings $42,188,700 $41,983,500 0% $40,594,700 (4%) $39,206,000 (7%) $33,654,700 (20%)
RLV as Percent of Revenues 13% 13% 13% 12% 10% Without Predevelopment Savings 13% 13% 12% 12% 10%
Note: Development Impact Fees/ Other Costs include all applicable impact fees (including TIDF or TSF), plus any upfront developer payment for TDR purchase and Mello Roos special tax.
Page 38
San Francisco Transportation Sustainability Fee: Economic Feasibility Study
Appendices • Appendix A: Methodology and Sources • Appendix Tables A-‐1 through A-‐10: Summary Results by Prototype • Appendix Tables B-‐1 through B-‐10: Summary Financial Pro Forma by Prototype • Appendix Tables C-‐1 through C-‐2: Development Revenue and Cost Assumptions by Prototype
Appendix A Page 1
Appendix A: Methodology and Sources This appendix summarizes the methodology and sources used to evaluate the potential impact of the proposed Transportation Sustainability Program (TSP) on prototypical development types (prototypes) commonly found in San Francisco. As described in the main body of the report, a land residual analysis was performed to evaluate how the proposed Transportation Sustainability Fee (TSF) would increase development costs and affect overall development feasibility, as measured by changes in residual land value (RLV). This analysis also examines and models the potential economic benefits of streamlining the City’s environmental review process as a result of California Environmental Quality Act (CEQA)/Level of Service (LOS) reform, which could result in predevelopment time and cost savings.
The financial analysis evaluates each prototype assuming that predevelopment cost and time savings would or would not occur as a result of TSP (with and without predevelopment savings). This reflects the possibility that no CEQA streamlining could occur if another type of environmental topic area (such as historic resources) would result in further intensification of environmental review.
Working in close collaboration with City staff, Seifel performed the following steps, each of which is further described below:
A. Selection of Prototypes B. Preparation of Residual Land Value (RLV) Models C. Overview of Development Assumptions for RLV Analysis D. Information Sources
The following tables are included within this appendix and present the financial results for each prototype and the key development assumptions for each prototype used in the analysis:
• Appendix Tables A-‐1 through A-‐10 present the summary results for each prototype. • Appendix Tables B-‐1 through B-‐10 present the summary financial pro forma for each prototype. • Appendix Tables C-‐1 through C-‐2 present the development revenue and cost assumptions for
each prototype.
A. Selection of Prototypes A variety of prototypical development types (prototypes) were evaluated for potential inclusion in the study, based on a review of development pipeline data and an analysis of infill sites that may be suitable for development (that are either currently vacant or with existing buildings that are 1-‐2 stories tall). Based on a comprehensive analysis of prototypical projects, 10 prototypes were selected for analysis, representing a variety of lot sizes, building heights, development sizes, land use, zoning designations and locations. Eight of these prototypes are residential (seven of which are mixed-‐use with retail on the ground floor) and two are office prototypes (each with retail on the ground floor). Chapter IV of this report summarizes the key characteristics of each of these prototypes.
1. Definition of Development Program A customized development program for each prototype was developed based on a typical site within a geographic area, which is considered to be generally representative of development opportunities in

Appendix A Page 2
that area.1 The lot size and an assumed zoning designation were used to a) calculate the potential building envelope, b) define what would likely be built on the ground floor and on the upper floors, c) determine the likely location and number of parking spaces (including the potential use of stackers) and d) estimate gross and net building square footage, after taking account for key building requirements, including rear and/or side yard set backs that reduce the building footprint and vertical building step backs that reduce floor plates as the building increases in height. A brief overview of the prototypical building types, building efficiencies and parking is summarized below.
a. Building/Construction Type Five building types, organized by height and construction type, encompass the majority of developments being built in San Francisco, and two prototypes were analyzed for each of these five building types:
• Low-‐Rise 40-‐58 Feet: Has the greatest geographic presence throughout the City and the greatest variety in size of development. Most Low-‐Rise development is residential, ranging from small projects with 5 or fewer units to large, 200-‐unit projects. Residential mixed-‐use Prototypes 1 and 4 represent this type of construction.
• Mid-‐Rise 65-‐68 Feet: Has become more prevalent in the City, particularly in the easternmost neighborhoods that are in Area Plans. Development for this building type is predominately residential (typically with 20 units or more) but some smaller office buildings are being built at this height. Residential mixed-‐use Prototypes 3 and 5 represent this type of construction.
• Mid-‐Rise 80-‐85 Feet: Has also become more prevalent in the easternmost neighborhoods. Development for this building type is predominately residential (typically with 50 units or more) but some smaller office buildings are being built at this height. Residential mixed-‐use Prototypes 2 and 6 represent this type of construction.
• High-‐Rise 120-‐160 Feet: Primarily allowed in the downtown, eastern SoMa and Mission Bay areas, and both office and residential buildings are being developed at this height. Office Prototype 7 and residential mixed-‐use Prototype 8 represent this type of construction.
• High-‐Rise Above 240 Feet: Only allowed in a few neighborhoods, primarily in the financial district and eastern SoMa areas. Residential Prototype 9 and office Prototype 10 represent this type of construction, both assumed to be located in the Transit Center District Plan Area.
b. Building Efficiency Building efficiency refers to the percentage of building square footage that is sellable or rentable (net square footage or NSF) as compared to overall gross building square feet (GSF), reflecting a deduction for common area space such as lobbies, hallways and community spaces. Smaller projects tend to have lower efficiencies due to the high proportion of common area, and high-‐rise projects also tend to have lower efficiencies due to life safety measures and slim building profiles. Building efficiencies range from 73 percent (%) to 80% for the residential prototypes, with high-‐rise construction being the least efficient. Building efficiencies for the office prototypes range from 83% to 90%.2
1 Although soft sites were analyzed in order to develop and test key development assumptions related to development capacity, the prototypes are designed to generally reflect what may be developed within each area (e.g. Prototype 1 reflects what might be prototypically developed along Geary Avenue).
2 For the purposes of this analysis, the calculated building efficiencies were used to represent the leasable square footage for both residential and office uses. In the case of office, this is likely a conservative assumption as often a portion of common area, such as bathrooms, are included within the leasable area that is used to calculate the rent a tenant must pay. Based on a review of the development pro formas and discussions with office developers, the assumed efficiencies are within the range of what is typically being used by developers.

Appendix A Page 3
c. Parking Building heights, the number of units and the applicable zoning requirements for parking affect the overall amount of parking provided and parking related construction costs. In order to best represent the variety of parking development options currently being utilized, the prototypes include parking that is constructed at-‐grade (podium parking) and below grade (underground parking). In recent years, developers have been increasingly using mechanical lift equipment that enables multiple parking spaces to be located in the same parking space footprint, referred to as parking “stackers.” In addition, the ratio of parking spaces per unit/SF has decreased over the past decade as a result of changes in City zoning, as well as changes in consumer preference and development feasibility.
Based on these factors, only the Low-‐Rise Residential Mixed-‐Use Prototypes 1 and 4 have a parking ratio of 1.0 parking space per unit with the remaining residential prototypes having parking ratios ranging from 0.5 to 0.75 parking spaces per unit. Given their assumed zoning, parking square footage in the two office prototypes is limited to 7% of the gross floor area.
B. Preparation of Residual Land Value (RLV) Models The residual land value (RLV) is the difference between what a developer expects to receive in revenues, (e.g., sale of condominium units after taking into account sales related expenses) less all costs associated with developing the buildings (e.g., predevelopment costs, hard construction costs, financing, developer overhead, marketing/sales costs, other soft construction costs and developer margin or return). Land residual models for each prototype were created to compare the potential financial impact on RLV of the TSF at various fee levels under two underlying economic benefit scenarios: with and without predevelopment savings from CEQA/LOS reform.
In summary, the RLV is calculated using the following formula, which represents a static basis for determining project feasibility:
Revenues (based on sales prices for condominiums or development value for rental property less sales-‐related costs)
Less: Basic Development Costs (including hard construction, tenant improvements, development impact fees, other development related costs, financing and other soft costs)
Less: Developer Margin (which represents the margin (or return) that needs to be achieved in order for the project to be considered potentially feasible by the development community)
= Residual Land Value
C. Overview of Development Assumptions for RLV Analysis The next four sections describe how the revenues, basic development costs, developer margin and RLV were projected for each prototype. Appendix Tables C-‐1 and C-‐2 present the key development assumptions used to analyze each prototype.
Sensitivity analysis was performed during 2014 and 2015 on various development assumptions, and the RLV results were compared to data on land sales comparables in order to inform the analysis presented in the appendix tables. These findings are considered to be generally representative of real estate feasibility given a long-‐range view of real estate cycles in San Francisco.
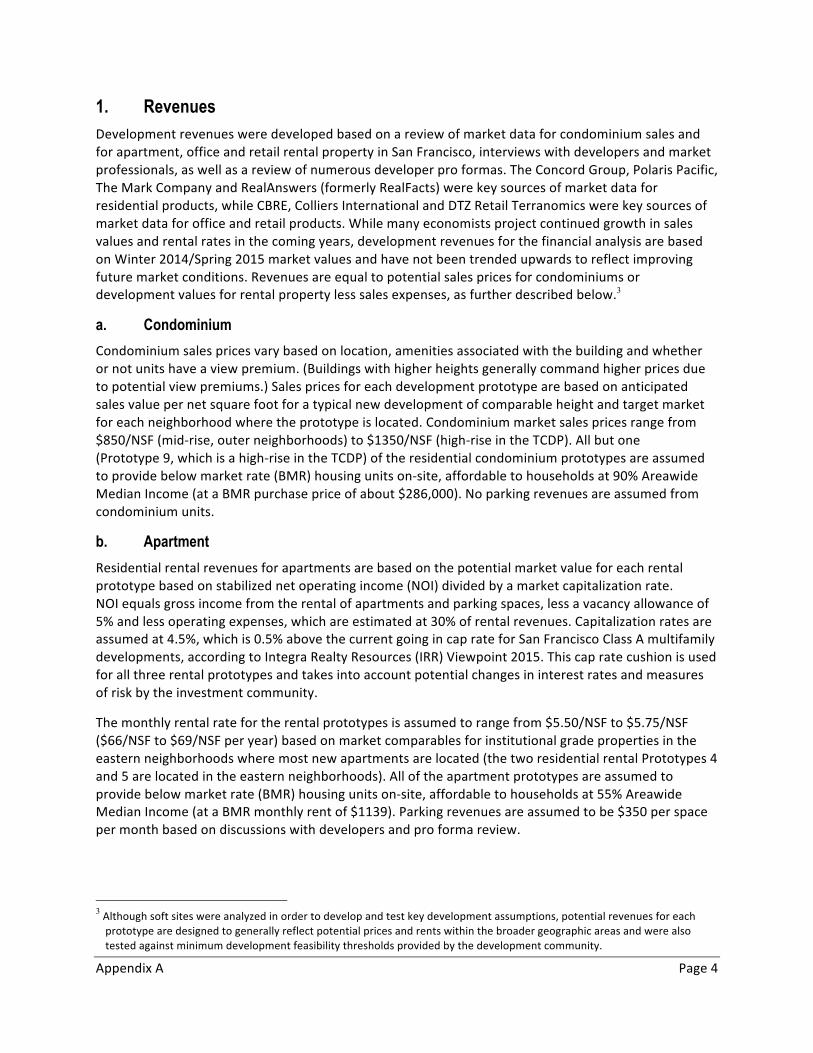
Appendix A Page 4
1. Revenues Development revenues were developed based on a review of market data for condominium sales and for apartment, office and retail rental property in San Francisco, interviews with developers and market professionals, as well as a review of numerous developer pro formas. The Concord Group, Polaris Pacific, The Mark Company and RealAnswers (formerly RealFacts) were key sources of market data for residential products, while CBRE, Colliers International and DTZ Retail Terranomics were key sources of market data for office and retail products. While many economists project continued growth in sales values and rental rates in the coming years, development revenues for the financial analysis are based on Winter 2014/Spring 2015 market values and have not been trended upwards to reflect improving future market conditions. Revenues are equal to potential sales prices for condominiums or development values for rental property less sales expenses, as further described below.3
a. Condominium Condominium sales prices vary based on location, amenities associated with the building and whether or not units have a view premium. (Buildings with higher heights generally command higher prices due to potential view premiums.) Sales prices for each development prototype are based on anticipated sales value per net square foot for a typical new development of comparable height and target market for each neighborhood where the prototype is located. Condominium market sales prices range from $850/NSF (mid-‐rise, outer neighborhoods) to $1350/NSF (high-‐rise in the TCDP). All but one (Prototype 9, which is a high-‐rise in the TCDP) of the residential condominium prototypes are assumed to provide below market rate (BMR) housing units on-‐site, affordable to households at 90% Areawide Median Income (at a BMR purchase price of about $286,000). No parking revenues are assumed from condominium units.
b. Apartment Residential rental revenues for apartments are based on the potential market value for each rental prototype based on stabilized net operating income (NOI) divided by a market capitalization rate. NOI equals gross income from the rental of apartments and parking spaces, less a vacancy allowance of 5% and less operating expenses, which are estimated at 30% of rental revenues. Capitalization rates are assumed at 4.5%, which is 0.5% above the current going in cap rate for San Francisco Class A multifamily developments, according to Integra Realty Resources (IRR) Viewpoint 2015. This cap rate cushion is used for all three rental prototypes and takes into account potential changes in interest rates and measures of risk by the investment community.
The monthly rental rate for the rental prototypes is assumed to range from $5.50/NSF to $5.75/NSF ($66/NSF to $69/NSF per year) based on market comparables for institutional grade properties in the eastern neighborhoods where most new apartments are located (the two residential rental Prototypes 4 and 5 are located in the eastern neighborhoods). All of the apartment prototypes are assumed to provide below market rate (BMR) housing units on-‐site, affordable to households at 55% Areawide Median Income (at a BMR monthly rent of $1139). Parking revenues are assumed to be $350 per space per month based on discussions with developers and pro forma review.
3 Although soft sites were analyzed in order to develop and test key development assumptions, potential revenues for each prototype are designed to generally reflect potential prices and rents within the broader geographic areas and were also tested against minimum development feasibility thresholds provided by the development community.

Appendix A Page 5
c. Office Office revenues are based on the potential market value for office based on stabilized net operating income (NOI) divided by a market capitalization rate. Given the significant demand from larger, technology-‐oriented tenants, pro formas for office developments are now more commonly using triple net rents (NNN) or something akin to modified gross (MG) rather than full service (FS) rents to calculate NOI. For purposes of this analysis, the following assumptions are made based on interviews with office developers and a review of pro formas for downtown office buildings submitted in response to the Transbay Joint Powers Authority developer solicitations.
Office NOI equals gross income from rents and parking spaces. Office NOI is calculated based on eastern SoMa and downtown office rents ranging from $54/NSF to $66/NSF per year less a vacancy allowance of 10% and less landlord operating expenses/contingency at 10% of rental revenues. (NOI ranges from $43/NSF to $53/NSF.) Parking revenues are assumed to be $450 per space per month with parking operating expenses at 30% of parking revenues. Capitalization rates are assumed at 5%, which is 0.5% above the current going in cap rate for San Francisco Class A CBD office, according to IRR Viewpoint 2015.
d. Retail Retail revenues are based on the potential market value for office based on stabilized net operating income (NOI) divided by a market capitalization rate. Similar NOI equals gross income from rents and parking spaces, less a vacancy allowance of 5% and less operating expenses, which are estimated at 30% of rental revenues.
Retail rental rates range from $4.00/NSF to $5.00/NSF ($48/NSF to $60/NSF per year), which recognizes that some developments are likely to occur in areas that do not currently have established retail districts, and developers may need to incentivize occupancy with free rent or tenant improvement concessions. Retail NOI is calculated based on these rents less a vacancy allowance of 10% and less landlord operating expenses/contingency at 10% of rental revenues. (NOI ranges from $38/NSF to $48/NSF.) Monthly parking revenues range from $100 to $150 per space, with parking operating expenses at 30% of parking revenues, reflecting the fact that retail parking revenues are not anticipated to represent a significant source of income. Capitalization rates are assumed at 6%, which is 0.5% above the current going in cap rate for San Francisco Class A neighborhood retail according to IRR Viewpoint 2015.
e. Sales Expenses Sales expenses include brokerage fees and City transfer taxes, and these expenses are deducted from the sales and rental revenue proceeds in order to generate net development revenues for the financial analysis. Transfer taxes are based on the City’s transfer tax schedule, which is calculated according to building value, and are assumed to be paid by the developer. All of the condominium prototypes are assumed to have sales expenses equal to 5.5% of sales price, representing an allowance for sales related expenses and transfer tax. Office and apartment prototypes are assumed to have sales expenses equal to 3.5% percent of sales price, representing an allowance for transfer tax and brokerage fees. Sales expenses for retail space are assumed to be the same as the major land use type for each prototype, i.e. if retail is located on the ground floor of an apartment building, the sales expenses are equal to 3.5% of sales price.
Appendix A Page 6
2. Development Costs Development costs consist of five key categories: hard construction costs and tenant improvements (collectively referred to as direct costs); development impact fees and other costs; environmental and transportation review costs; construction financing; and other soft costs. Land costs are calculated based on the RLV, as described above. Direct construction costs represent the majority of development costs. 4
a. Direct Construction Costs Direct construction costs include hard construction costs related to building, parking and site work (including general contractor overhead, profit and general conditions) plus tenant improvements. As the type and location of parking varies significantly across building types, parking hard construction costs are estimated separately from the hard construction costs for the residential, retail and/or office components. The parking costs were then added to the hard construction costs for each land use by prototype and compared with developer pro formas and contractor estimates for projects in this building type, as well as information on construction costs provided by the San Francisco Department of Building Inspection. These costs were also compared to the residential construction cost estimates assembled for the Mayor’s Office of Housing in 2012, and the costs were found to be generally consistent, after taking into account an inflationary adjustment of 15-‐20% since 2012, reflecting the rapid increase in construction costs over the past three years.
Tenant improvements are assumed to be the landlord or developer’s share of what is required to be installed in order to accommodate occupancy by retail and/or office tenants. The following costs for each building and land use type were developed based on interviews with a range of developers and general contractors, recent development pro formas and information on construction costs provided by the San Francisco Department of Building Inspection.
Hard Construction Cost Contingency • A 10% contingency was added to all hard construction cost estimates, including parking.
Parking Hard Construction
• Podium Parking (at-‐grade or partially below grade at $120/GSF of Parking Area). • Underground Parking (1 level below grade at $140/GSF of Parking Area). • Underground Parking (2 level below grade at $160/GSF of Parking Area). • Stackers (assumes puzzle stackers at cost of $15,000 per space for parking lift system plus
additional costs related to mechanical and electrical systems, plus site accommodations). Residential Hard Construction
• Low-‐Rise 40-‐58 Feet: Type V over Type I podium construction at $240/GSF to $260/GSF of Residential Area.5
• Mid-‐Rise 65-‐68 Feet: Type III/Modified Type III construction at $270/GSF of Residential Area. • Mid-‐Rise 80-‐85 Feet: Type I construction at $300/GSF of Residential Area.
4 Development cost information was provided by the San Francisco Department of Building Inspection and a range of real estate professionals, including developer members of the Urban Land Institute, SPUR and San Francisco Housing Action Coalition, as well as general contractors (including Webcor, Cahill, Swinerton and Build GC).
5 This construction cost range assumes construction labor at prevailing wages and takes into account the fact that there may be site constraints, such as the need for pilings. The two low-‐rise prototypes have different heights and significantly different unit sizes as well as potential site conditions, given their locations. Citywide, low-‐rise developments may be able to achieve greater efficiencies and have significantly lower costs for wood frame development.
Appendix A Page 7
• High-‐Rise 120-‐160 Feet: Type I construction at $320/GSF of Residential Area (reflects added life safety requirements plus construction premium for smaller sized upper floors).
• High-‐Rise Above 240 Feet: Type I construction at $340/GSF of Residential Area (reflects added life safety requirements plus construction premium for additional smaller sized upper floors).
With parking construction costs, direct construction costs for the residential prototypes (including ground floor retail and associated tenant improvements) range from $290/GSF to $400/GSF, or between about $380/NSF to $550/NSF.
According to interviews with general contractors and developers, condominiums typically cost about 5% or more per square foot of residential building area than apartments because they have higher finishes and amenities, and some of this additional cost may be recaptured during the sales process as unit upgrades. Rental units are typically smaller in size than condominium developments and therefore typically cost more per square foot due to the higher ratio of kitchen and bathrooms to overall square footage. Based on reviewing numerous developer pro formas for both condominium and rental units, the above construction costs are assumed to be within the range of current construction costs for both condominium and rental units. In addition, as separately noted below, a contingency allowance of 10% is added to these costs to reflect the preliminary nature of these estimates.
Retail Hard Construction and Tenant Improvements • Retail on Ground Floor: Podium construction at $225/GSF plus landlord paid Tenant
Improvements at $100/NSF Office Hard Construction and Tenant Improvements
• High-‐Rise 160 Feet: Type I construction with added life safety requirements at $250/GSF plus landlord paid tenant improvements at $85/NSF)
• High-‐Rise 400 Feet: Type I construction with added life safety requirements at $300/GSF, which takes in to account significant building step backs on the upper floors that translates to higher costs per GSF on upper floors, plus landlord paid tenant Improvements at $85/NSF)
With parking construction costs and contingency, hard construction costs for the office prototypes range from about $290/GSF to $330/GSF. With ground floor retail and associated tenant improvements, direct construction costs for the office prototypes range from $400/NSF to $500/NSF.
b. Development Impact Fees/Other Costs Development impact fees and other costs include water and wastewater capacity fees, school fees, citywide and area plan specific impact fees and are calculated based on the 2014 Planning Department Fee Schedule. All but one prototype assumes the onsite provision of affordable housing; High-‐Rise Prototype 9 assumes the payment of an affordable housing fee. The two office prototypes, as well as ground floor retail uses, include the payment of a jobs-‐housing linkage fee.
For each prototype, the model assumes a variable level of development impact fees under the following scenarios:
• Base Case TIDF, which reflects current conditions without implementation of the TSP and continuation of TIDF.
Appendix A Page 8
• Base Case TSF, which assumes the TSP is implemented and assumes TSF fee rates based on the 2012 Draft TSF Ordinance Levels.6
• Sensitivity analysis at three alternative fee levels at 125%, 150% and 250% of Base Case TSF.
Where applicable, area plan and prior use fee credits were calculated and credited in the model of each TSF scenario.
Prototypes 9 and 10 are located in the Transit Center District Plan and are assumed to be part of its Mello Roos Community Facilities District. For Prototype 9, which is a residential condominium, the developer is assumed to pay the Mello Roos special tax starting at Certificate of Occupancy until the units are sold and then the homeowners would fully assume the annual special tax burden. For Prototype 10, the developer or landlord is also assumed to pay the Mello Roos special tax starting at Certificate of Occupancy until the office is leased. Upon lease-‐up, the landlord is assumed to either pass the special tax on to the tenants through a NNN lease or incorporate the special tax into its operating expenses (the operating expense allowance of $6.60/NSF would more than cover the $4.36/SF Mello Roos special tax for a 30 story office building).
c. Environmental and Transportation Review Costs As described in Chapter V, City staff documented the level of environmental review and associated costs that would likely be currently required (i.e. before consideration of the TSP or Base Case TIDF) and what would be required with the adoption of the TSP (Base Case TSF). Then, the potential costs and time spent on environmental review for each of these prototypes was compared under these two cases in order to understand the potential direct economic benefits from the adoption of the TSP. The analysis also analyzes each prototype with and without predevelopment savings, which takes into account the possibility that no CEQA streamlining could occur if another type of environmental topic area (such as historic resources) would result in further intensification of environmental review.
d. Construction Financing and Predevelopment Carry Savings Construction financing typically represents the major source of capital that pays for development costs during construction. Construction terms vary depending on market conditions, developer financial capacity, developer track record and the construction lender. The construction interest rate is assumed at 5.5% for all prototypes with a loan fee of 1-‐1.25%, depending on loan size. The loan amount is based on about a 60-‐65% loan to development cost (considered to be approximately equal to a 50% loan to value) at an average outstanding balance of 60% of development costs. The term of the construction loan is directly related to project timing, as the construction loan is the primary source of capital during the construction and absorption phase (sales for condominiums and lease-‐up for rentals).
The construction period for each prototype increases according to development size and complexity: with construction on the small residential projects assumed to occur in 18 months, construction on medium sized projects assumed at 21 months, and construction on the larger and high-‐rise developments taking 24-‐30 months. Absorption for each prototype is based on recent market trends and interviews with developers, with average unit absorption per month for condominiums ranging from about 2 (for small developments) to 9 (for 100-‐200 unit developments) and 20 units per month for apartments. Office absorption is assumed to average 200,000-‐250,000 square feet per year, with a small amount of pre-‐leasing assumed for office, retail and apartments.
6 As described in Chapter III, the Base Case TSF scenario assumes the fee rates in the 2012 Draft TSF Ordinance, adjusted for inflation to 2015 dollars, taking into account the consolidation of non-‐residential fee categories.
Appendix A Page 9
As described in the main body of the report, predevelopment time savings due to CEQA/LOS reform are considered to reduce private carrying costs related to those developments that may benefit from CEQA streamlining. Consistent with the prior 2012 analysis, the study assumes predevelopment costs (including land) are equal to about 5% of development value (typically within a range of 5-‐15% of development value or total development cost according to the Urban Land Institute).7
Predevelopment cost savings are measured by multiplying these estimated predevelopment costs by a 12% annual equity carrying cost (conservative assumption as equity during entitlement period typically achieves a higher return threshold) times the number of months saved divided by one year (i.e. 5 months/1 year):8
5% of revenues multiplied by 12% carrying cost multiplied by 42% (5/12 months) = .252% of revenues
While predevelopment costs vary by development (e.g. whether land is purchased up front or purchased at the end of an option period, with option payments made in the interim, and the extent of upfront predevelopment costs), this estimate is considered to be generally representative of a potential predevelopment carry scenario.
e. Other Soft Costs Other soft costs include all other indirect construction costs such as architectural design, engineering, legal fees, building permit fees, marketing and other sales/leasing related development costs. These costs are calculated as a percentage of hard construction costs based on a review of pro formas and interviews with developers and real estate professionals. Other soft costs for the residential condominium prototypes are assumed at 25% of hard construction costs while rental prototypes (both residential and commercial) that have less extensive sales and marketing costs are assumed at 18% of hard construction costs.
3. Developer Margin Developers, lenders and investors evaluate and measure returns in several ways. Based on input from real estate developers, equity investors and lenders, and discussions with City staff, developer margin is measured in the following ways.
• Residential: Target developer margin, as measured by return on development cost and return on net sales price for condominiums:
• Low-‐Rise 40-‐58 Feet: 15-‐20% return on total development cost (assumed at 19% return on development cost, or 16% threshold for return on net sales for condominiums)
• Mid-‐Rise 65 Feet: 20-‐22% on total development cost (assumed at 21% return on development cost, or 17% threshold for return on net sales for condominiums)
• Mid-‐Rise and High-‐Rise, 80-‐160 Feet: 22-‐24% on total development cost (assumed at 23% return on development cost, or 19% threshold for return on net sales for condominiums)
• High-‐Rise above 240 Feet: 28-‐30% on total development cost (assumed at 29% return on development cost, or 22% threshold for return on net sales for condominiums)
7 Refer to Chapters 2 and 3, Finance for Real Estate Development, Charles Long, Urban Land Institute, 2011. 8 Conceptually, this means a five month time savings would translate to predevelopment savings of about $2,520/unit for a typically priced $1,000,000 condominium, which is approximately equal 0.5% of direct construction costs.
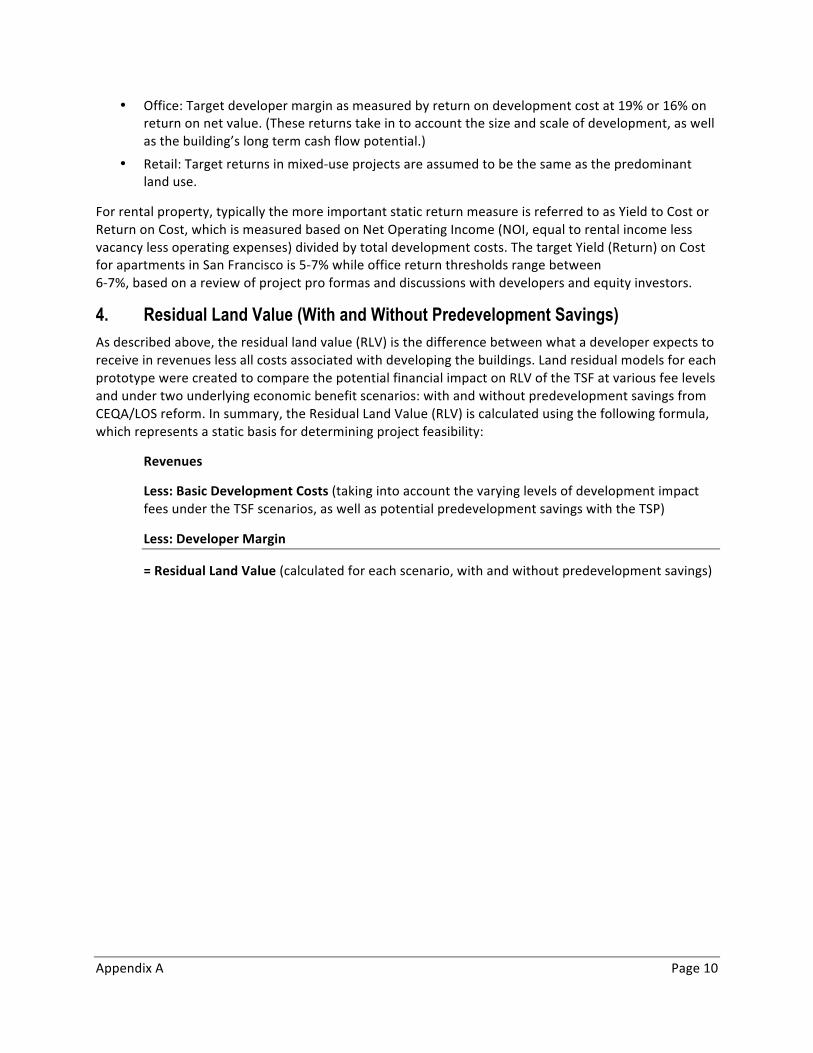
Appendix A Page 10
• Office: Target developer margin as measured by return on development cost at 19% or 16% on return on net value. (These returns take in to account the size and scale of development, as well as the building’s long term cash flow potential.)
• Retail: Target returns in mixed-‐use projects are assumed to be the same as the predominant land use.
For rental property, typically the more important static return measure is referred to as Yield to Cost or Return on Cost, which is measured based on Net Operating Income (NOI, equal to rental income less vacancy less operating expenses) divided by total development costs. The target Yield (Return) on Cost for apartments in San Francisco is 5-‐7% while office return thresholds range between 6-‐7%, based on a review of project pro formas and discussions with developers and equity investors.
4. Residual Land Value (With and Without Predevelopment Savings) As described above, the residual land value (RLV) is the difference between what a developer expects to receive in revenues less all costs associated with developing the buildings. Land residual models for each prototype were created to compare the potential financial impact on RLV of the TSF at various fee levels and under two underlying economic benefit scenarios: with and without predevelopment savings from CEQA/LOS reform. In summary, the Residual Land Value (RLV) is calculated using the following formula, which represents a static basis for determining project feasibility:
Revenues
Less: Basic Development Costs (taking into account the varying levels of development impact fees under the TSF scenarios, as well as potential predevelopment savings with the TSP)
Less: Developer Margin
= Residual Land Value (calculated for each scenario, with and without predevelopment savings)
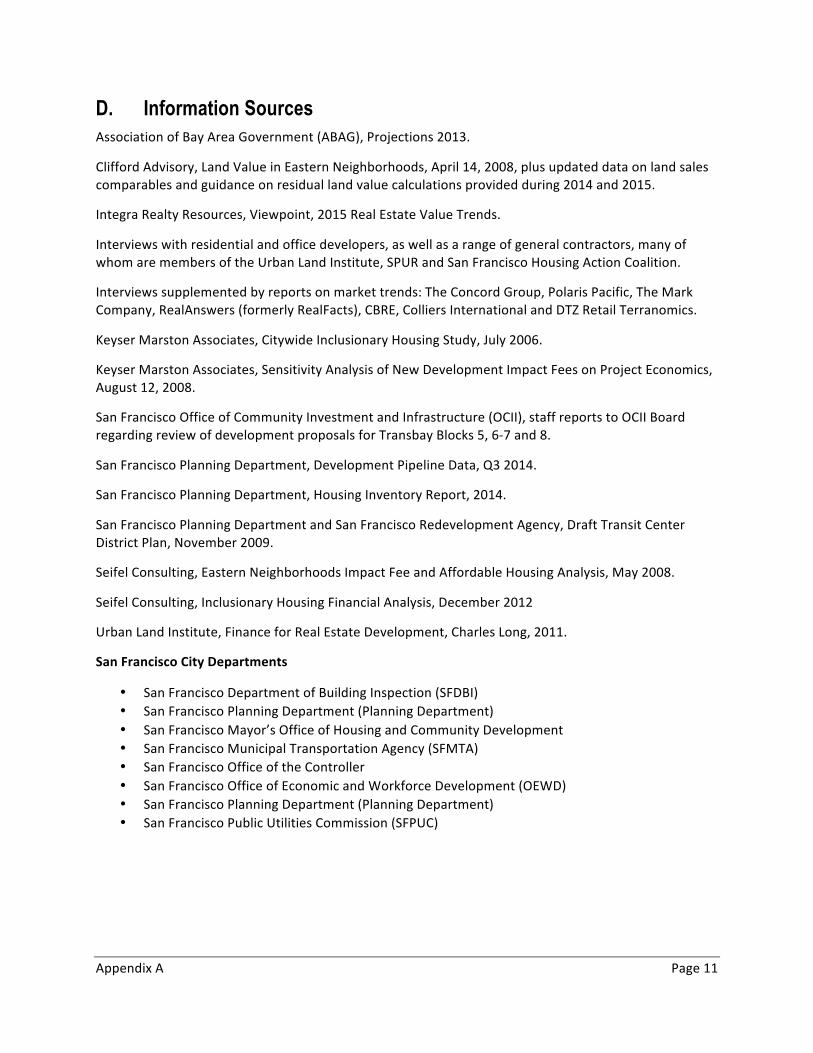
Appendix A Page 11
D. Information Sources Association of Bay Area Government (ABAG), Projections 2013.
Clifford Advisory, Land Value in Eastern Neighborhoods, April 14, 2008, plus updated data on land sales comparables and guidance on residual land value calculations provided during 2014 and 2015.
Integra Realty Resources, Viewpoint, 2015 Real Estate Value Trends.
Interviews with residential and office developers, as well as a range of general contractors, many of whom are members of the Urban Land Institute, SPUR and San Francisco Housing Action Coalition.
Interviews supplemented by reports on market trends: The Concord Group, Polaris Pacific, The Mark Company, RealAnswers (formerly RealFacts), CBRE, Colliers International and DTZ Retail Terranomics.
Keyser Marston Associates, Citywide Inclusionary Housing Study, July 2006.
Keyser Marston Associates, Sensitivity Analysis of New Development Impact Fees on Project Economics, August 12, 2008.
San Francisco Office of Community Investment and Infrastructure (OCII), staff reports to OCII Board regarding review of development proposals for Transbay Blocks 5, 6-‐7 and 8.
San Francisco Planning Department, Development Pipeline Data, Q3 2014.
San Francisco Planning Department, Housing Inventory Report, 2014.
San Francisco Planning Department and San Francisco Redevelopment Agency, Draft Transit Center District Plan, November 2009.
Seifel Consulting, Eastern Neighborhoods Impact Fee and Affordable Housing Analysis, May 2008.
Seifel Consulting, Inclusionary Housing Financial Analysis, December 2012
Urban Land Institute, Finance for Real Estate Development, Charles Long, 2011.
San Francisco City Departments
• San Francisco Department of Building Inspection (SFDBI) • San Francisco Planning Department (Planning Department) • San Francisco Mayor’s Office of Housing and Community Development • San Francisco Municipal Transportation Agency (SFMTA) • San Francisco Office of the Controller • San Francisco Office of Economic and Workforce Development (OEWD) • San Francisco Planning Department (Planning Department) • San Francisco Public Utilities Commission (SFPUC)

Appendix Table A-1Prototype 1 Summary Results
Comparison for Base Case TIDF and Base Case TSF
1a. Summary of Development Program - Geary Small Residential Mixed-useSite Area and Constraints
Lot Size 5,000 SFExisting Prior Use 600 GSF
Development ProgramDescription Low-RiseMaximum Height 45 FeetResidential Units 8 Units
Average Unit Size (NSF) 1,100 NSFResidential Density 70 Units per acre
Building Size (NSF) 10,240 NSFBuilding Size GSF (without parking) 12,950 GSFFAR 3.3Residential Parking Ratio 1.0 Spaces per UnitTotal Parking Spaces 8
Parking Construction Type (# of levels) Podium (1)
1b. Summary of Financial Analysis - Geary Small Residential Mixed-usePrototype 1 Base Case TIDF Base Case TSF Difference
1: Geary Small Res. Mixed-use Total % of Revenues TSF Total % of
Revenues Total % Change
RevenuesResidential For-Sale $7,900,200 90% $7,900,200 90% $0 0.0%Residential Rental $0 0% $0 0% $0 -
Subtotal Residential $7,900,200 90% $7,900,200 90% $0 0.0%Office $0 0% $0 0% $0 -Retail $870,900 10% $870,900 10% $0 0.0% Total Revenues $8,771,100 100% $8,771,100 100% $0 0.0%
Hard and Soft CostsHard Construction Costs $3,788,400 43% $3,788,400 43% $0 0.0%Tenant Improvements/Lease Up Costs $144,000 2% $144,000 2% $0 0.0%Development Impact Fees/Other Costs $64,700 1% $134,600 2% $69,900 108%Environmental/Transportation Review $9,000 0% $9,000 0% $0 0.0%Construction Financing/Predev. Carry $364,300 4% $364,300 4% $0 0.0%Other Soft Costs $947,100 11% $947,100 11% $0 0.0%
Total Hard and Soft Costs $5,317,500 61% $5,387,400 61% $69,900 1.3%Developer Margin $1,403,400 16% $1,403,400 16% $0 0.0%
Total Costs $6,720,900 77% $6,790,800 77% $69,900 1.0%Residual Land Value $2,050,200 23% $1,980,300 23% ($69,900) (3.4%)
Without Predevelopment Savings $2,050,200 23% $1,980,300 23% ($69,900) (3.4%)Developer Margin/ Total Dev. Costs 19% 19%Note: Numbers rounded to nearest $100. Development Impact Fees/ Other Costs include all applicable impact fees (including TIDF or TSF), plus any upfront developer payment for TDR purchase and Mello Roos special tax.
Appendix Tables A | Page 1
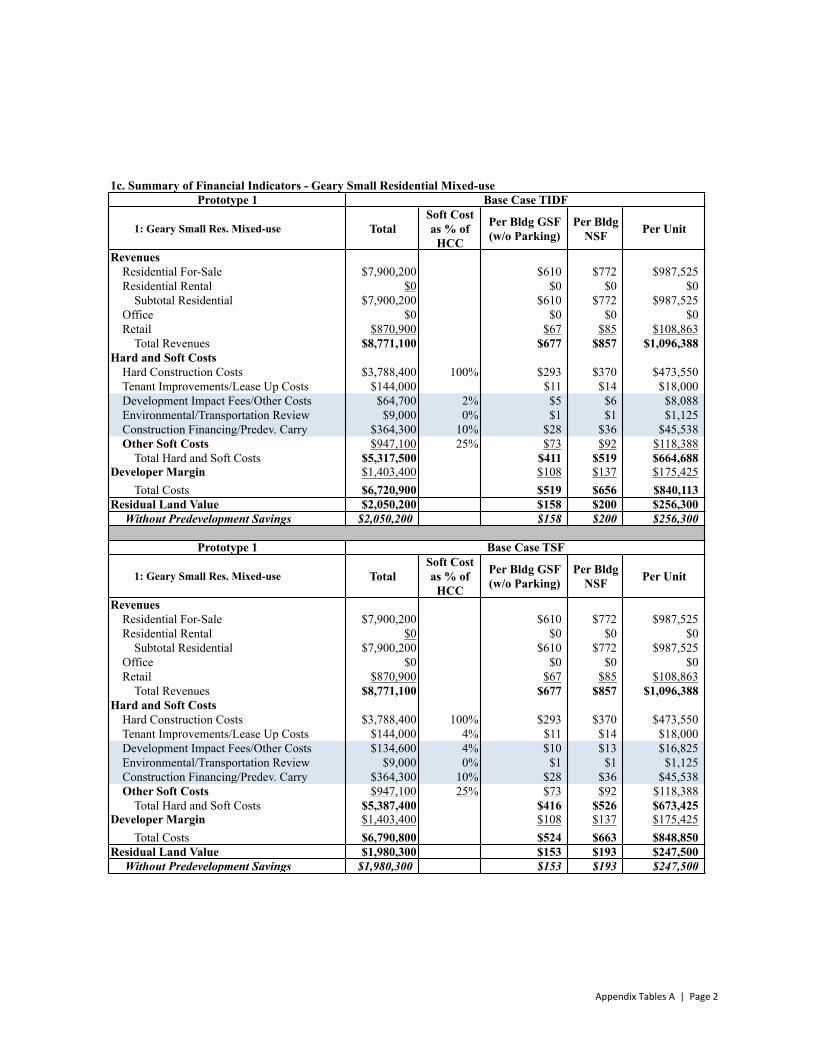
1c. Summary of Financial Indicators - Geary Small Residential Mixed-usePrototype 1 Base Case TIDF
1: Geary Small Res. Mixed-use TotalSoft Cost as % of
HCC
Per Bldg GSF (w/o Parking)
Per Bldg NSF Per Unit
RevenuesResidential For-Sale $7,900,200 $610 $772 $987,525Residential Rental $0 $0 $0 $0
Subtotal Residential $7,900,200 $610 $772 $987,525Office $0 $0 $0 $0Retail $870,900 $67 $85 $108,863 Total Revenues $8,771,100 $677 $857 $1,096,388
Hard and Soft CostsHard Construction Costs $3,788,400 100% $293 $370 $473,550Tenant Improvements/Lease Up Costs $144,000 $11 $14 $18,000Development Impact Fees/Other Costs $64,700 2% $5 $6 $8,088Environmental/Transportation Review $9,000 0% $1 $1 $1,125Construction Financing/Predev. Carry $364,300 10% $28 $36 $45,538Other Soft Costs $947,100 25% $73 $92 $118,388
Total Hard and Soft Costs $5,317,500 $411 $519 $664,688Developer Margin $1,403,400 $108 $137 $175,425
Total Costs $6,720,900 $519 $656 $840,113Residual Land Value $2,050,200 $158 $200 $256,300
Without Predevelopment Savings $2,050,200 $158 $200 $256,300
Prototype 1 Base Case TSF
1: Geary Small Res. Mixed-use TotalSoft Cost as % of
HCC
Per Bldg GSF (w/o Parking)
Per Bldg NSF Per Unit
RevenuesResidential For-Sale $7,900,200 $610 $772 $987,525Residential Rental $0 $0 $0 $0
Subtotal Residential $7,900,200 $610 $772 $987,525Office $0 $0 $0 $0Retail $870,900 $67 $85 $108,863 Total Revenues $8,771,100 $677 $857 $1,096,388
Hard and Soft CostsHard Construction Costs $3,788,400 100% $293 $370 $473,550Tenant Improvements/Lease Up Costs $144,000 4% $11 $14 $18,000Development Impact Fees/Other Costs $134,600 4% $10 $13 $16,825Environmental/Transportation Review $9,000 0% $1 $1 $1,125Construction Financing/Predev. Carry $364,300 10% $28 $36 $45,538Other Soft Costs $947,100 25% $73 $92 $118,388
Total Hard and Soft Costs $5,387,400 $416 $526 $673,425Developer Margin $1,403,400 $108 $137 $175,425
Total Costs $6,790,800 $524 $663 $848,850Residual Land Value $1,980,300 $153 $193 $247,500
Without Predevelopment Savings $1,980,300 $153 $193 $247,500
Appendix Tables A | Page 2
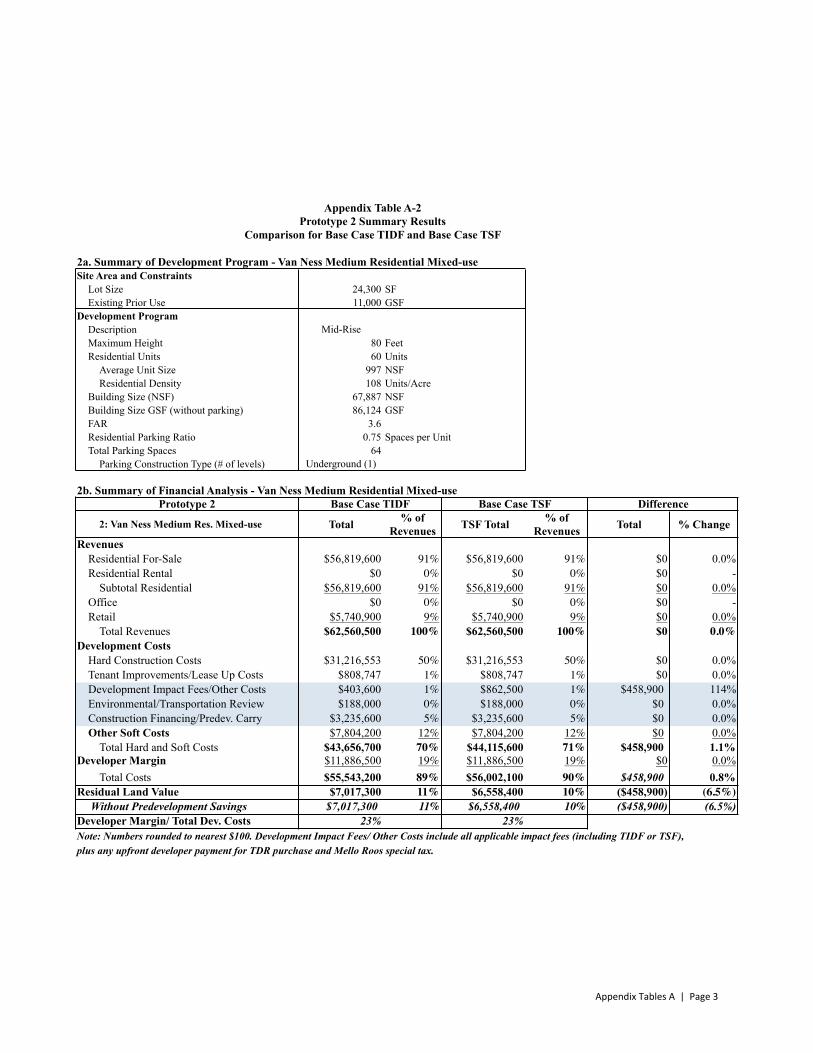
Appendix Table A-2Prototype 2 Summary Results
Comparison for Base Case TIDF and Base Case TSF
2a. Summary of Development Program - Van Ness Medium Residential Mixed-useSite Area and Constraints
Lot Size 24,300 SFExisting Prior Use 11,000 GSF
Development ProgramDescription Mid-RiseMaximum Height 80 FeetResidential Units 60 Units
Average Unit Size 997 NSFResidential Density 108 Units/Acre
Building Size (NSF) 67,887 NSFBuilding Size GSF (without parking) 86,124 GSFFAR 3.6Residential Parking Ratio 0.75 Spaces per UnitTotal Parking Spaces 64
Parking Construction Type (# of levels) Underground (1)
2b. Summary of Financial Analysis - Van Ness Medium Residential Mixed-usePrototype 2 Base Case TIDF Base Case TSF Difference
2: Van Ness Medium Res. Mixed-use Total % of Revenues TSF Total % of
Revenues Total % Change
RevenuesResidential For-Sale $56,819,600 91% $56,819,600 91% $0 0.0%Residential Rental $0 0% $0 0% $0 -
Subtotal Residential $56,819,600 91% $56,819,600 91% $0 0.0%Office $0 0% $0 0% $0 -Retail $5,740,900 9% $5,740,900 9% $0 0.0% Total Revenues $62,560,500 100% $62,560,500 100% $0 0.0%
Development CostsHard Construction Costs $31,216,553 50% $31,216,553 50% $0 0.0%Tenant Improvements/Lease Up Costs $808,747 1% $808,747 1% $0 0.0%Development Impact Fees/Other Costs $403,600 1% $862,500 1% $458,900 114%Environmental/Transportation Review $188,000 0% $188,000 0% $0 0.0%Construction Financing/Predev. Carry $3,235,600 5% $3,235,600 5% $0 0.0%Other Soft Costs $7,804,200 12% $7,804,200 12% $0 0.0%
Total Hard and Soft Costs $43,656,700 70% $44,115,600 71% $458,900 1.1%Developer Margin $11,886,500 19% $11,886,500 19% $0 0.0%
Total Costs $55,543,200 89% $56,002,100 90% $458,900 0.8%Residual Land Value $7,017,300 11% $6,558,400 10% ($458,900) (6.5%)
Without Predevelopment Savings $7,017,300 11% $6,558,400 10% ($458,900) (6.5%)Developer Margin/ Total Dev. Costs 23% 23%Note: Numbers rounded to nearest $100. Development Impact Fees/ Other Costs include all applicable impact fees (including TIDF or TSF), plus any upfront developer payment for TDR purchase and Mello Roos special tax.
Appendix Tables A | Page 3
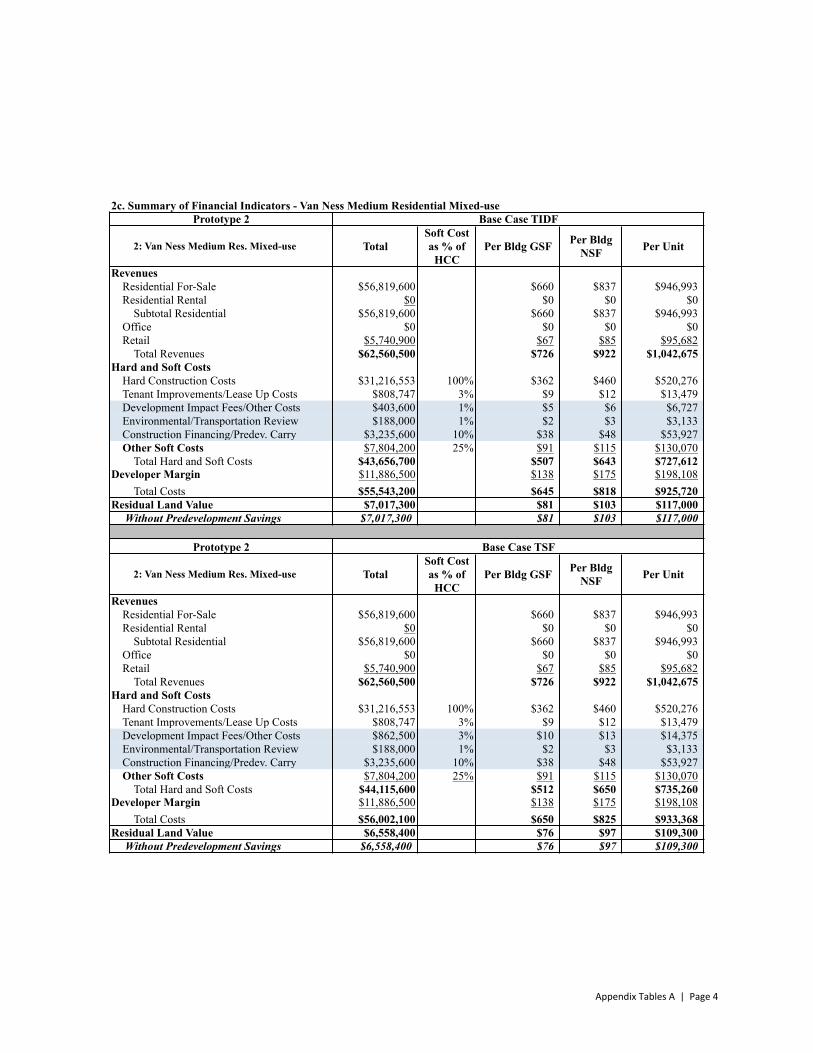
2c. Summary of Financial Indicators - Van Ness Medium Residential Mixed-usePrototype 2 Base Case TIDF
2: Van Ness Medium Res. Mixed-use TotalSoft Cost as % of
HCCPer Bldg GSF Per Bldg
NSF Per Unit
RevenuesResidential For-Sale $56,819,600 $660 $837 $946,993Residential Rental $0 $0 $0 $0
Subtotal Residential $56,819,600 $660 $837 $946,993Office $0 $0 $0 $0Retail $5,740,900 $67 $85 $95,682 Total Revenues $62,560,500 $726 $922 $1,042,675
Hard and Soft CostsHard Construction Costs $31,216,553 100% $362 $460 $520,276Tenant Improvements/Lease Up Costs $808,747 3% $9 $12 $13,479Development Impact Fees/Other Costs $403,600 1% $5 $6 $6,727Environmental/Transportation Review $188,000 1% $2 $3 $3,133Construction Financing/Predev. Carry $3,235,600 10% $38 $48 $53,927Other Soft Costs $7,804,200 25% $91 $115 $130,070
Total Hard and Soft Costs $43,656,700 $507 $643 $727,612Developer Margin $11,886,500 $138 $175 $198,108
Total Costs $55,543,200 $645 $818 $925,720Residual Land Value $7,017,300 $81 $103 $117,000
Without Predevelopment Savings $7,017,300 $81 $103 $117,000
Prototype 2 Base Case TSF
2: Van Ness Medium Res. Mixed-use TotalSoft Cost as % of
HCCPer Bldg GSF Per Bldg
NSF Per Unit
RevenuesResidential For-Sale $56,819,600 $660 $837 $946,993Residential Rental $0 $0 $0 $0
Subtotal Residential $56,819,600 $660 $837 $946,993Office $0 $0 $0 $0Retail $5,740,900 $67 $85 $95,682 Total Revenues $62,560,500 $726 $922 $1,042,675
Hard and Soft CostsHard Construction Costs $31,216,553 100% $362 $460 $520,276Tenant Improvements/Lease Up Costs $808,747 3% $9 $12 $13,479Development Impact Fees/Other Costs $862,500 3% $10 $13 $14,375Environmental/Transportation Review $188,000 1% $2 $3 $3,133Construction Financing/Predev. Carry $3,235,600 10% $38 $48 $53,927Other Soft Costs $7,804,200 25% $91 $115 $130,070
Total Hard and Soft Costs $44,115,600 $512 $650 $735,260Developer Margin $11,886,500 $138 $175 $198,108
Total Costs $56,002,100 $650 $825 $933,368Residual Land Value $6,558,400 $76 $97 $109,300
Without Predevelopment Savings $6,558,400 $76 $97 $109,300
Appendix Tables A | Page 4
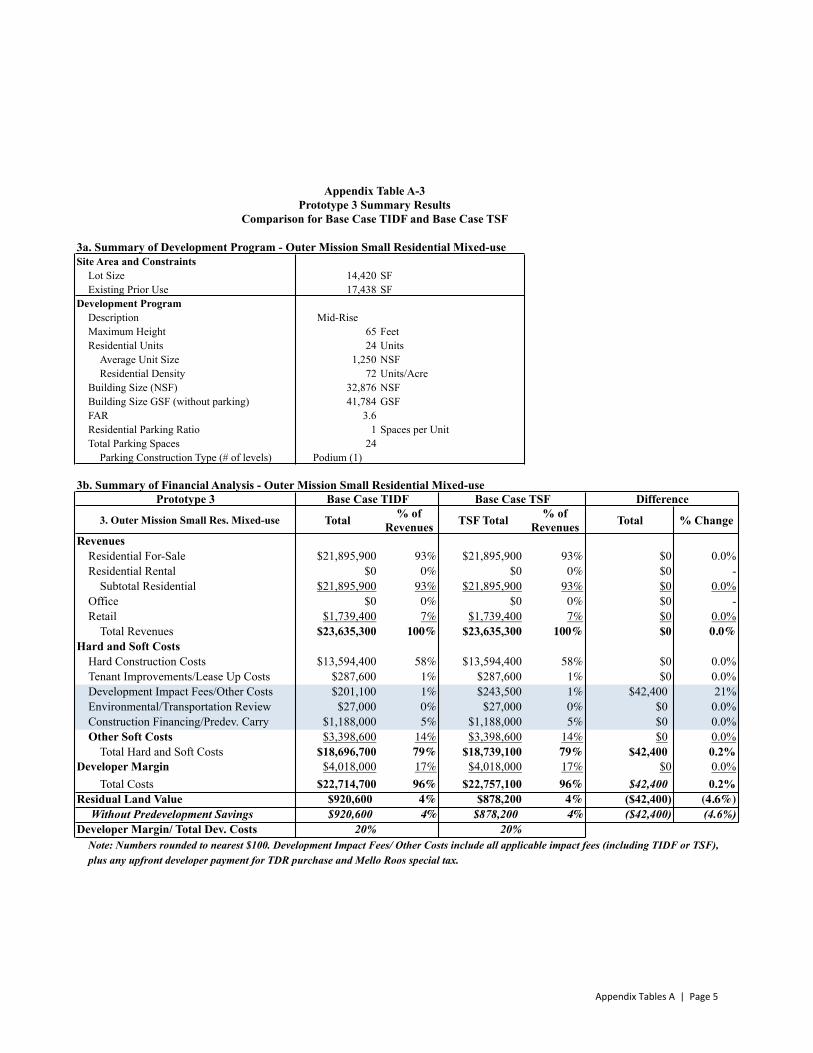
Appendix Table A-3Prototype 3 Summary Results
Comparison for Base Case TIDF and Base Case TSF
3a. Summary of Development Program - Outer Mission Small Residential Mixed-useSite Area and Constraints
Lot Size 14,420 SFExisting Prior Use 17,438 SF
Development ProgramDescription Mid-RiseMaximum Height 65 FeetResidential Units 24 Units
Average Unit Size 1,250 NSFResidential Density 72 Units/Acre
Building Size (NSF) 32,876 NSFBuilding Size GSF (without parking) 41,784 GSFFAR 3.6Residential Parking Ratio 1 Spaces per UnitTotal Parking Spaces 24
Parking Construction Type (# of levels) Podium (1)
3b. Summary of Financial Analysis - Outer Mission Small Residential Mixed-usePrototype 3 Base Case TIDF Base Case TSF Difference
3. Outer Mission Small Res. Mixed-use Total % of Revenues TSF Total % of
Revenues Total % Change
RevenuesResidential For-Sale $21,895,900 93% $21,895,900 93% $0 0.0%Residential Rental $0 0% $0 0% $0 -
Subtotal Residential $21,895,900 93% $21,895,900 93% $0 0.0%Office $0 0% $0 0% $0 -Retail $1,739,400 7% $1,739,400 7% $0 0.0% Total Revenues $23,635,300 100% $23,635,300 100% $0 0.0%
Hard and Soft CostsHard Construction Costs $13,594,400 58% $13,594,400 58% $0 0.0%Tenant Improvements/Lease Up Costs $287,600 1% $287,600 1% $0 0.0%Development Impact Fees/Other Costs $201,100 1% $243,500 1% $42,400 21%Environmental/Transportation Review $27,000 0% $27,000 0% $0 0.0%Construction Financing/Predev. Carry $1,188,000 5% $1,188,000 5% $0 0.0%Other Soft Costs $3,398,600 14% $3,398,600 14% $0 0.0%
Total Hard and Soft Costs $18,696,700 79% $18,739,100 79% $42,400 0.2%Developer Margin $4,018,000 17% $4,018,000 17% $0 0.0%
Total Costs $22,714,700 96% $22,757,100 96% $42,400 0.2%Residual Land Value $920,600 4% $878,200 4% ($42,400) (4.6%)
Without Predevelopment Savings $920,600 4% $878,200 4% ($42,400) (4.6%)Developer Margin/ Total Dev. Costs 20% 20%
Note: Numbers rounded to nearest $100. Development Impact Fees/ Other Costs include all applicable impact fees (including TIDF or TSF), plus any upfront developer payment for TDR purchase and Mello Roos special tax.
Appendix Tables A | Page 5
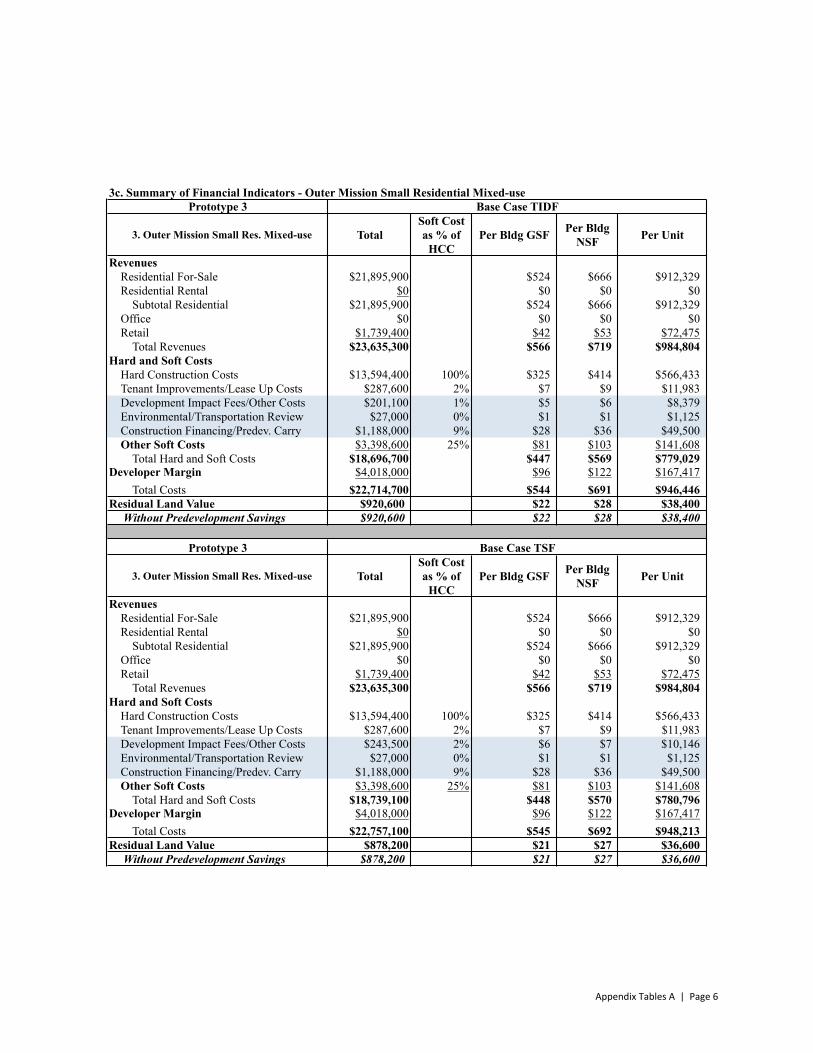
3c. Summary of Financial Indicators - Outer Mission Small Residential Mixed-usePrototype 3 Base Case TIDF
3. Outer Mission Small Res. Mixed-use TotalSoft Cost as % of
HCCPer Bldg GSF Per Bldg
NSF Per Unit
RevenuesResidential For-Sale $21,895,900 $524 $666 $912,329Residential Rental $0 $0 $0 $0
Subtotal Residential $21,895,900 $524 $666 $912,329Office $0 $0 $0 $0Retail $1,739,400 $42 $53 $72,475 Total Revenues $23,635,300 $566 $719 $984,804
Hard and Soft CostsHard Construction Costs $13,594,400 100% $325 $414 $566,433Tenant Improvements/Lease Up Costs $287,600 2% $7 $9 $11,983Development Impact Fees/Other Costs $201,100 1% $5 $6 $8,379Environmental/Transportation Review $27,000 0% $1 $1 $1,125Construction Financing/Predev. Carry $1,188,000 9% $28 $36 $49,500Other Soft Costs $3,398,600 25% $81 $103 $141,608
Total Hard and Soft Costs $18,696,700 $447 $569 $779,029Developer Margin $4,018,000 $96 $122 $167,417
Total Costs $22,714,700 $544 $691 $946,446Residual Land Value $920,600 $22 $28 $38,400
Without Predevelopment Savings $920,600 $22 $28 $38,400
Prototype 3 Base Case TSF
3. Outer Mission Small Res. Mixed-use TotalSoft Cost as % of
HCCPer Bldg GSF Per Bldg
NSF Per Unit
RevenuesResidential For-Sale $21,895,900 $524 $666 $912,329Residential Rental $0 $0 $0 $0
Subtotal Residential $21,895,900 $524 $666 $912,329Office $0 $0 $0 $0Retail $1,739,400 $42 $53 $72,475 Total Revenues $23,635,300 $566 $719 $984,804
Hard and Soft CostsHard Construction Costs $13,594,400 100% $325 $414 $566,433Tenant Improvements/Lease Up Costs $287,600 2% $7 $9 $11,983Development Impact Fees/Other Costs $243,500 2% $6 $7 $10,146Environmental/Transportation Review $27,000 0% $1 $1 $1,125Construction Financing/Predev. Carry $1,188,000 9% $28 $36 $49,500Other Soft Costs $3,398,600 25% $81 $103 $141,608
Total Hard and Soft Costs $18,739,100 $448 $570 $780,796Developer Margin $4,018,000 $96 $122 $167,417
Total Costs $22,757,100 $545 $692 $948,213Residual Land Value $878,200 $21 $27 $36,600
Without Predevelopment Savings $878,200 $21 $27 $36,600
Appendix Tables A | Page 6
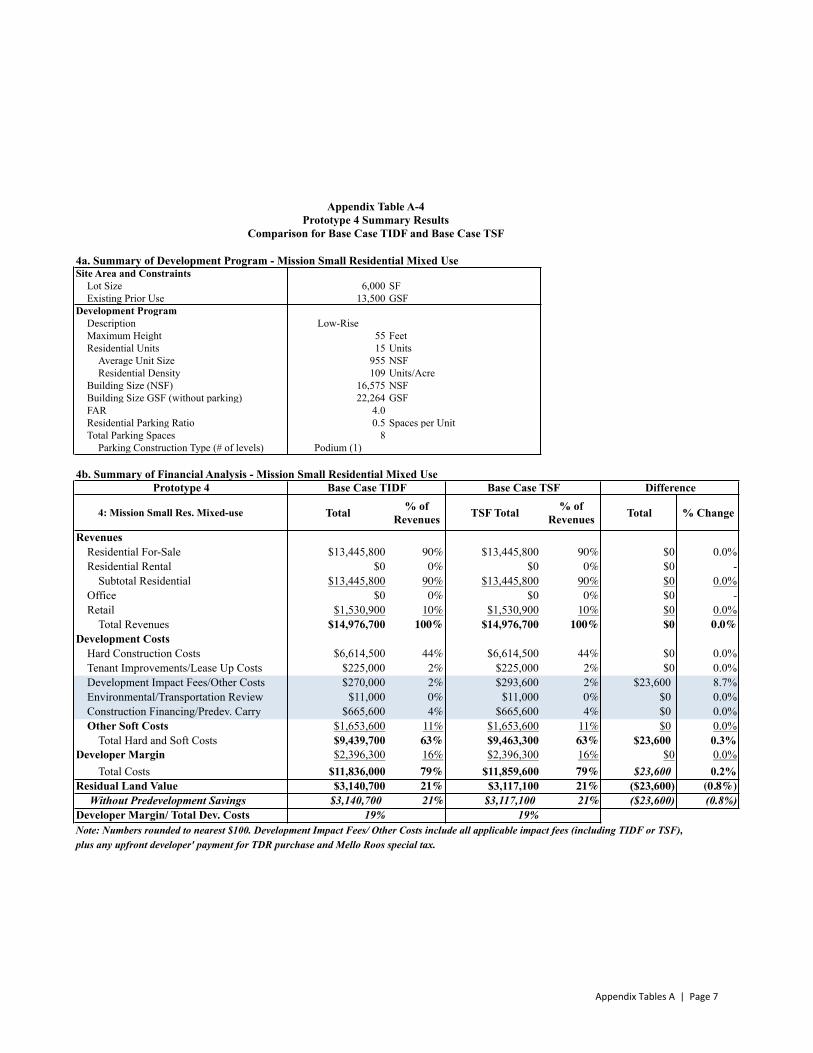
Appendix Table A-4Prototype 4 Summary Results
Comparison for Base Case TIDF and Base Case TSF
4a. Summary of Development Program - Mission Small Residential Mixed UseSite Area and Constraints
Lot Size 6,000 SFExisting Prior Use 13,500 GSF
Development ProgramDescription Low-RiseMaximum Height 55 FeetResidential Units 15 Units
Average Unit Size 955 NSFResidential Density 109 Units/Acre
Building Size (NSF) 16,575 NSFBuilding Size GSF (without parking) 22,264 GSFFAR 4.0Residential Parking Ratio 0.5 Spaces per UnitTotal Parking Spaces 8
Parking Construction Type (# of levels) Podium (1)
4b. Summary of Financial Analysis - Mission Small Residential Mixed UsePrototype 4 Base Case TIDF Base Case TSF Difference
4: Mission Small Res. Mixed-use Total % of Revenues TSF Total % of
Revenues Total % Change
RevenuesResidential For-Sale $13,445,800 90% $13,445,800 90% $0 0.0%Residential Rental $0 0% $0 0% $0 -
Subtotal Residential $13,445,800 90% $13,445,800 90% $0 0.0%Office $0 0% $0 0% $0 -Retail $1,530,900 10% $1,530,900 10% $0 0.0% Total Revenues $14,976,700 100% $14,976,700 100% $0 0.0%
Development CostsHard Construction Costs $6,614,500 44% $6,614,500 44% $0 0.0%Tenant Improvements/Lease Up Costs $225,000 2% $225,000 2% $0 0.0%Development Impact Fees/Other Costs $270,000 2% $293,600 2% $23,600 8.7%Environmental/Transportation Review $11,000 0% $11,000 0% $0 0.0%Construction Financing/Predev. Carry $665,600 4% $665,600 4% $0 0.0%Other Soft Costs $1,653,600 11% $1,653,600 11% $0 0.0%
Total Hard and Soft Costs $9,439,700 63% $9,463,300 63% $23,600 0.3%Developer Margin $2,396,300 16% $2,396,300 16% $0 0.0%
Total Costs $11,836,000 79% $11,859,600 79% $23,600 0.2%Residual Land Value $3,140,700 21% $3,117,100 21% ($23,600) (0.8%)
Without Predevelopment Savings $3,140,700 21% $3,117,100 21% ($23,600) (0.8%)Developer Margin/ Total Dev. Costs 19% 19%Note: Numbers rounded to nearest $100. Development Impact Fees/ Other Costs include all applicable impact fees (including TIDF or TSF), plus any upfront developer' payment for TDR purchase and Mello Roos special tax.
Appendix Tables A | Page 7
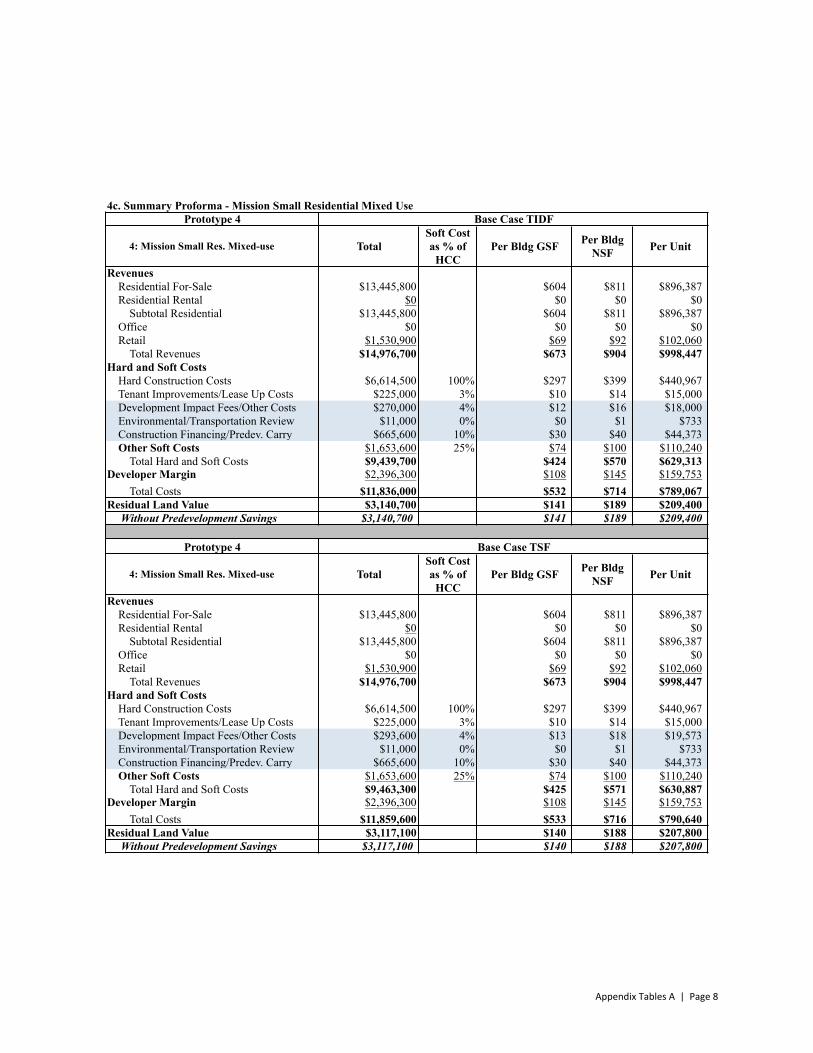
4c. Summary Proforma - Mission Small Residential Mixed UsePrototype 4 Base Case TIDF
4: Mission Small Res. Mixed-use TotalSoft Cost as % of
HCCPer Bldg GSF Per Bldg
NSF Per Unit
RevenuesResidential For-Sale $13,445,800 $604 $811 $896,387Residential Rental $0 $0 $0 $0
Subtotal Residential $13,445,800 $604 $811 $896,387Office $0 $0 $0 $0Retail $1,530,900 $69 $92 $102,060 Total Revenues $14,976,700 $673 $904 $998,447
Hard and Soft CostsHard Construction Costs $6,614,500 100% $297 $399 $440,967Tenant Improvements/Lease Up Costs $225,000 3% $10 $14 $15,000Development Impact Fees/Other Costs $270,000 4% $12 $16 $18,000Environmental/Transportation Review $11,000 0% $0 $1 $733Construction Financing/Predev. Carry $665,600 10% $30 $40 $44,373Other Soft Costs $1,653,600 25% $74 $100 $110,240
Total Hard and Soft Costs $9,439,700 $424 $570 $629,313Developer Margin $2,396,300 $108 $145 $159,753
Total Costs $11,836,000 $532 $714 $789,067Residual Land Value $3,140,700 $141 $189 $209,400
Without Predevelopment Savings $3,140,700 $141 $189 $209,400
Prototype 4 Base Case TSF
4: Mission Small Res. Mixed-use TotalSoft Cost as % of
HCCPer Bldg GSF Per Bldg
NSF Per Unit
RevenuesResidential For-Sale $13,445,800 $604 $811 $896,387Residential Rental $0 $0 $0 $0
Subtotal Residential $13,445,800 $604 $811 $896,387Office $0 $0 $0 $0Retail $1,530,900 $69 $92 $102,060 Total Revenues $14,976,700 $673 $904 $998,447
Hard and Soft CostsHard Construction Costs $6,614,500 100% $297 $399 $440,967Tenant Improvements/Lease Up Costs $225,000 3% $10 $14 $15,000Development Impact Fees/Other Costs $293,600 4% $13 $18 $19,573Environmental/Transportation Review $11,000 0% $0 $1 $733Construction Financing/Predev. Carry $665,600 10% $30 $40 $44,373Other Soft Costs $1,653,600 25% $74 $100 $110,240
Total Hard and Soft Costs $9,463,300 $425 $571 $630,887Developer Margin $2,396,300 $108 $145 $159,753
Total Costs $11,859,600 $533 $716 $790,640Residual Land Value $3,117,100 $140 $188 $207,800
Without Predevelopment Savings $3,117,100 $140 $188 $207,800
Appendix Tables A | Page 8
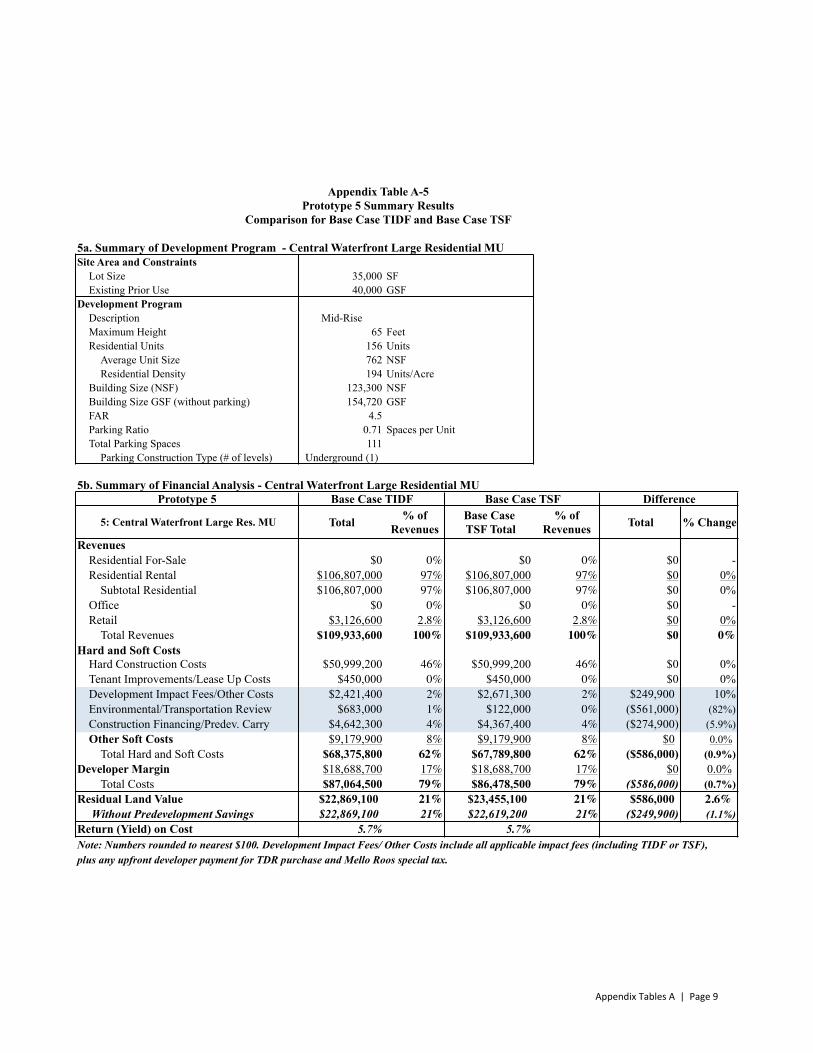
Appendix Table A-5Prototype 5 Summary Results
Comparison for Base Case TIDF and Base Case TSF
5a. Summary of Development Program - Central Waterfront Large Residential MUSite Area and Constraints
Lot Size 35,000 SFExisting Prior Use 40,000 GSF
Development ProgramDescription Mid-RiseMaximum Height 65 FeetResidential Units 156 Units
Average Unit Size 762 NSFResidential Density 194 Units/Acre
Building Size (NSF) 123,300 NSFBuilding Size GSF (without parking) 154,720 GSFFAR 4.5Parking Ratio 0.71 Spaces per UnitTotal Parking Spaces 111
Parking Construction Type (# of levels) Underground (1)
5b. Summary of Financial Analysis - Central Waterfront Large Residential MUPrototype 5 Base Case TIDF Base Case TSF Difference
5: Central Waterfront Large Res. MU Total % of Revenues
Base Case TSF Total
% of Revenues Total % Change
RevenuesResidential For-Sale $0 0% $0 0% $0 -Residential Rental $106,807,000 97% $106,807,000 97% $0 0%
Subtotal Residential $106,807,000 97% $106,807,000 97% $0 0%Office $0 0% $0 0% $0 -Retail $3,126,600 2.8% $3,126,600 2.8% $0 0% Total Revenues $109,933,600 100% $109,933,600 100% $0 0%
Hard and Soft CostsHard Construction Costs $50,999,200 46% $50,999,200 46% $0 0%Tenant Improvements/Lease Up Costs $450,000 0% $450,000 0% $0 0%Development Impact Fees/Other Costs $2,421,400 2% $2,671,300 2% $249,900 10%Environmental/Transportation Review $683,000 1% $122,000 0% ($561,000) (82%)Construction Financing/Predev. Carry $4,642,300 4% $4,367,400 4% ($274,900) (5.9%)Other Soft Costs $9,179,900 8% $9,179,900 8% $0 0.0%
Total Hard and Soft Costs $68,375,800 62% $67,789,800 62% ($586,000) (0.9%)Developer Margin $18,688,700 17% $18,688,700 17% $0 0.0%
Total Costs $87,064,500 79% $86,478,500 79% ($586,000) (0.7%)Residual Land Value $22,869,100 21% $23,455,100 21% $586,000 2.6%
Without Predevelopment Savings $22,869,100 21% $22,619,200 21% ($249,900) (1.1%)Return (Yield) on Cost 5.7% 5.7%Note: Numbers rounded to nearest $100. Development Impact Fees/ Other Costs include all applicable impact fees (including TIDF or TSF), plus any upfront developer payment for TDR purchase and Mello Roos special tax.
Appendix Tables A | Page 9
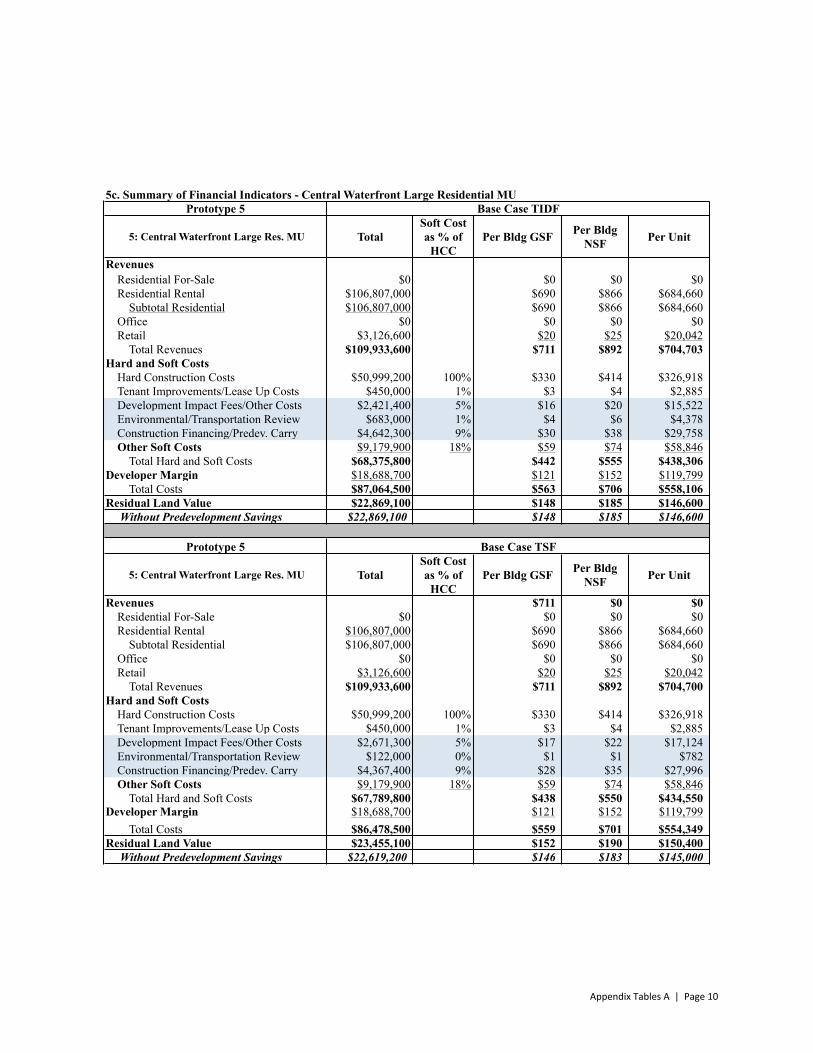
5c. Summary of Financial Indicators - Central Waterfront Large Residential MUPrototype 5 Base Case TIDF
5: Central Waterfront Large Res. MU TotalSoft Cost as % of
HCCPer Bldg GSF Per Bldg
NSF Per Unit
RevenuesResidential For-Sale $0 $0 $0 $0Residential Rental $106,807,000 $690 $866 $684,660
Subtotal Residential $106,807,000 $690 $866 $684,660Office $0 $0 $0 $0Retail $3,126,600 $20 $25 $20,042 Total Revenues $109,933,600 $711 $892 $704,703
Hard and Soft CostsHard Construction Costs $50,999,200 100% $330 $414 $326,918Tenant Improvements/Lease Up Costs $450,000 1% $3 $4 $2,885Development Impact Fees/Other Costs $2,421,400 5% $16 $20 $15,522Environmental/Transportation Review $683,000 1% $4 $6 $4,378Construction Financing/Predev. Carry $4,642,300 9% $30 $38 $29,758Other Soft Costs $9,179,900 18% $59 $74 $58,846
Total Hard and Soft Costs $68,375,800 $442 $555 $438,306Developer Margin $18,688,700 $121 $152 $119,799
Total Costs $87,064,500 $563 $706 $558,106Residual Land Value $22,869,100 $148 $185 $146,600
Without Predevelopment Savings $22,869,100 $148 $185 $146,600
Prototype 5 Base Case TSF
5: Central Waterfront Large Res. MU TotalSoft Cost as % of
HCCPer Bldg GSF Per Bldg
NSF Per Unit
Revenues $711 $0 $0Residential For-Sale $0 $0 $0 $0Residential Rental $106,807,000 $690 $866 $684,660
Subtotal Residential $106,807,000 $690 $866 $684,660Office $0 $0 $0 $0Retail $3,126,600 $20 $25 $20,042 Total Revenues $109,933,600 $711 $892 $704,700
Hard and Soft CostsHard Construction Costs $50,999,200 100% $330 $414 $326,918Tenant Improvements/Lease Up Costs $450,000 1% $3 $4 $2,885Development Impact Fees/Other Costs $2,671,300 5% $17 $22 $17,124Environmental/Transportation Review $122,000 0% $1 $1 $782Construction Financing/Predev. Carry $4,367,400 9% $28 $35 $27,996Other Soft Costs $9,179,900 18% $59 $74 $58,846
Total Hard and Soft Costs $67,789,800 $438 $550 $434,550Developer Margin $18,688,700 $121 $152 $119,799
Total Costs $86,478,500 $559 $701 $554,349Residual Land Value $23,455,100 $152 $190 $150,400
Without Predevelopment Savings $22,619,200 $146 $183 $145,000
Appendix Tables A | Page 10
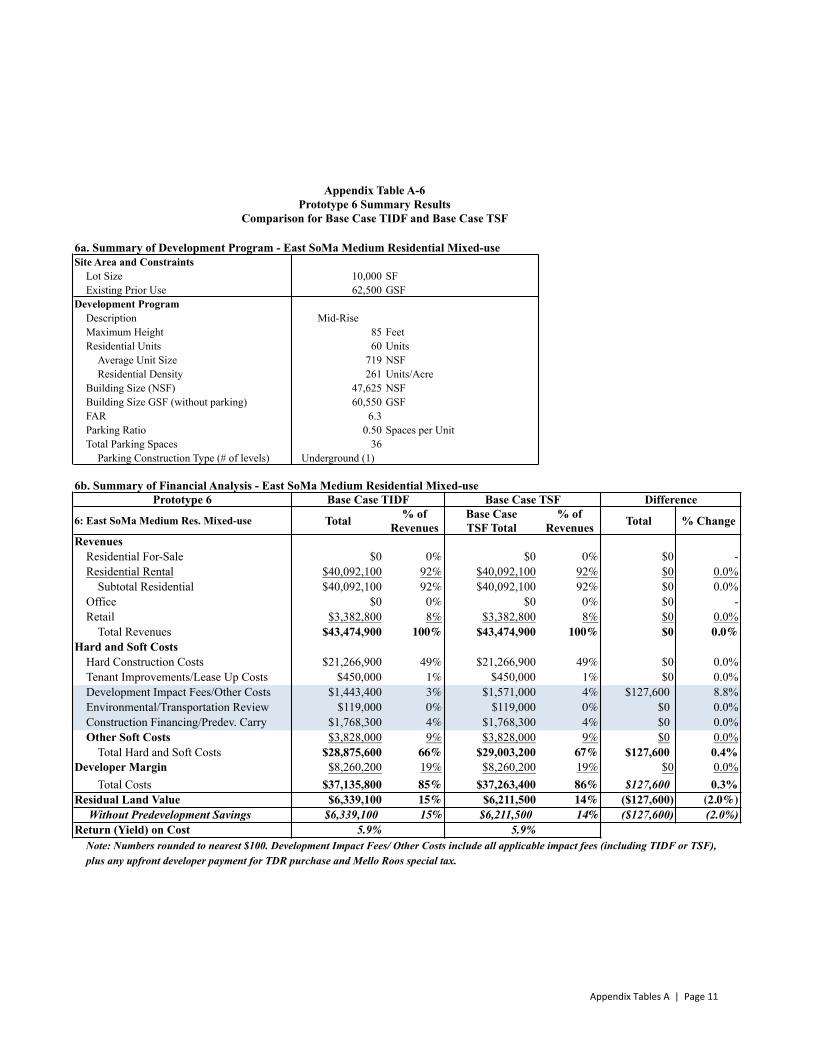
Appendix Table A-6Prototype 6 Summary Results
Comparison for Base Case TIDF and Base Case TSF
6a. Summary of Development Program - East SoMa Medium Residential Mixed-useSite Area and Constraints
Lot Size 10,000 SFExisting Prior Use 62,500 GSF
Development ProgramDescription Mid-RiseMaximum Height 85 FeetResidential Units 60 Units
Average Unit Size 719 NSFResidential Density 261 Units/Acre
Building Size (NSF) 47,625 NSFBuilding Size GSF (without parking) 60,550 GSFFAR 6.3Parking Ratio 0.50 Spaces per UnitTotal Parking Spaces 36
Parking Construction Type (# of levels) Underground (1)
6b. Summary of Financial Analysis - East SoMa Medium Residential Mixed-usePrototype 6 Base Case TIDF Base Case TSF Difference
6: East SoMa Medium Res. Mixed-use Total % of Revenues
Base CaseTSF Total
% of Revenues Total % Change
RevenuesResidential For-Sale $0 0% $0 0% $0 -Residential Rental $40,092,100 92% $40,092,100 92% $0 0.0%
Subtotal Residential $40,092,100 92% $40,092,100 92% $0 0.0%Office $0 0% $0 0% $0 -Retail $3,382,800 8% $3,382,800 8% $0 0.0% Total Revenues $43,474,900 100% $43,474,900 100% $0 0.0%
Hard and Soft CostsHard Construction Costs $21,266,900 49% $21,266,900 49% $0 0.0%Tenant Improvements/Lease Up Costs $450,000 1% $450,000 1% $0 0.0%Development Impact Fees/Other Costs $1,443,400 3% $1,571,000 4% $127,600 8.8%Environmental/Transportation Review $119,000 0% $119,000 0% $0 0.0%Construction Financing/Predev. Carry $1,768,300 4% $1,768,300 4% $0 0.0%Other Soft Costs $3,828,000 9% $3,828,000 9% $0 0.0%
Total Hard and Soft Costs $28,875,600 66% $29,003,200 67% $127,600 0.4%Developer Margin $8,260,200 19% $8,260,200 19% $0 0.0%
Total Costs $37,135,800 85% $37,263,400 86% $127,600 0.3%Residual Land Value $6,339,100 15% $6,211,500 14% ($127,600) (2.0%)
Without Predevelopment Savings $6,339,100 15% $6,211,500 14% ($127,600) (2.0%)Return (Yield) on Cost 5.9% 5.9%
Note: Numbers rounded to nearest $100. Development Impact Fees/ Other Costs include all applicable impact fees (including TIDF or TSF), plus any upfront developer payment for TDR purchase and Mello Roos special tax.
Appendix Tables A | Page 11
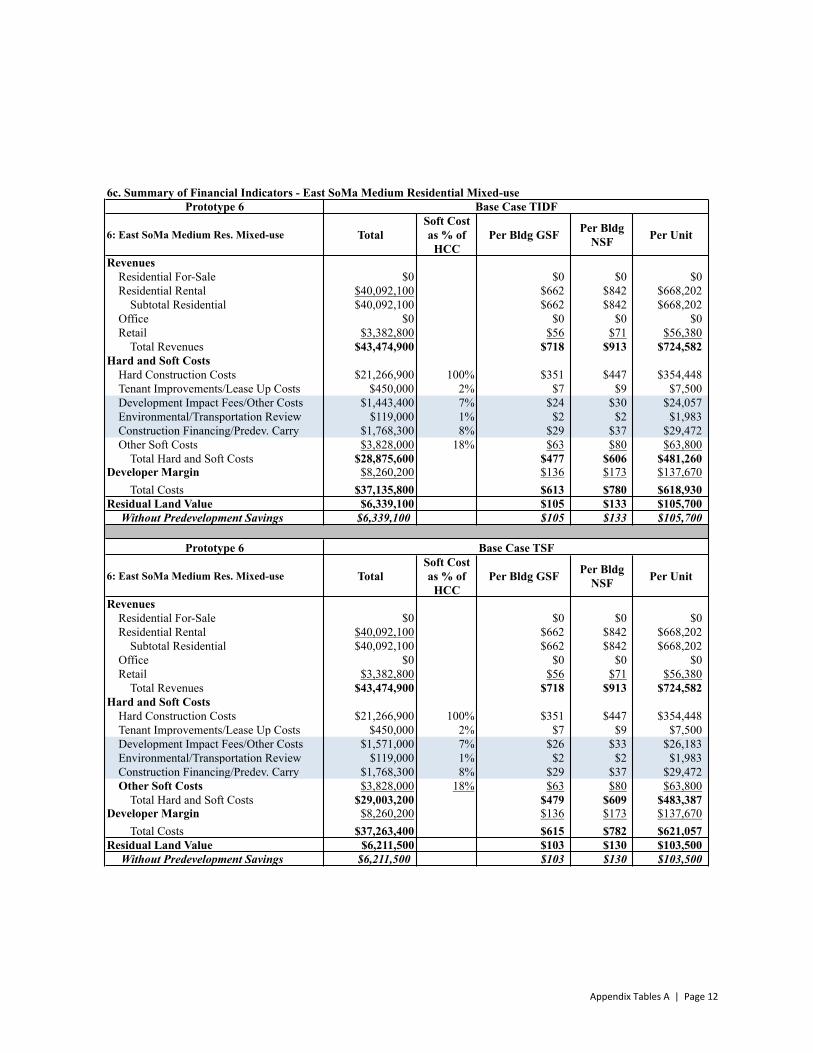
6c. Summary of Financial Indicators - East SoMa Medium Residential Mixed-usePrototype 6 Base Case TIDF
6: East SoMa Medium Res. Mixed-use TotalSoft Cost as % of
HCCPer Bldg GSF Per Bldg
NSF Per Unit
RevenuesResidential For-Sale $0 $0 $0 $0Residential Rental $40,092,100 $662 $842 $668,202
Subtotal Residential $40,092,100 $662 $842 $668,202Office $0 $0 $0 $0Retail $3,382,800 $56 $71 $56,380 Total Revenues $43,474,900 $718 $913 $724,582
Hard and Soft CostsHard Construction Costs $21,266,900 100% $351 $447 $354,448Tenant Improvements/Lease Up Costs $450,000 2% $7 $9 $7,500Development Impact Fees/Other Costs $1,443,400 7% $24 $30 $24,057Environmental/Transportation Review $119,000 1% $2 $2 $1,983Construction Financing/Predev. Carry $1,768,300 8% $29 $37 $29,472Other Soft Costs $3,828,000 18% $63 $80 $63,800
Total Hard and Soft Costs $28,875,600 $477 $606 $481,260Developer Margin $8,260,200 $136 $173 $137,670
Total Costs $37,135,800 $613 $780 $618,930Residual Land Value $6,339,100 $105 $133 $105,700
Without Predevelopment Savings $6,339,100 $105 $133 $105,700
Prototype 6 Base Case TSF
6: East SoMa Medium Res. Mixed-use TotalSoft Cost as % of
HCCPer Bldg GSF Per Bldg
NSF Per Unit
RevenuesResidential For-Sale $0 $0 $0 $0Residential Rental $40,092,100 $662 $842 $668,202
Subtotal Residential $40,092,100 $662 $842 $668,202Office $0 $0 $0 $0Retail $3,382,800 $56 $71 $56,380 Total Revenues $43,474,900 $718 $913 $724,582
Hard and Soft CostsHard Construction Costs $21,266,900 100% $351 $447 $354,448Tenant Improvements/Lease Up Costs $450,000 2% $7 $9 $7,500Development Impact Fees/Other Costs $1,571,000 7% $26 $33 $26,183Environmental/Transportation Review $119,000 1% $2 $2 $1,983Construction Financing/Predev. Carry $1,768,300 8% $29 $37 $29,472Other Soft Costs $3,828,000 18% $63 $80 $63,800
Total Hard and Soft Costs $29,003,200 $479 $609 $483,387Developer Margin $8,260,200 $136 $173 $137,670
Total Costs $37,263,400 $615 $782 $621,057Residual Land Value $6,211,500 $103 $130 $103,500
Without Predevelopment Savings $6,211,500 $103 $130 $103,500
Appendix Tables A | Page 12
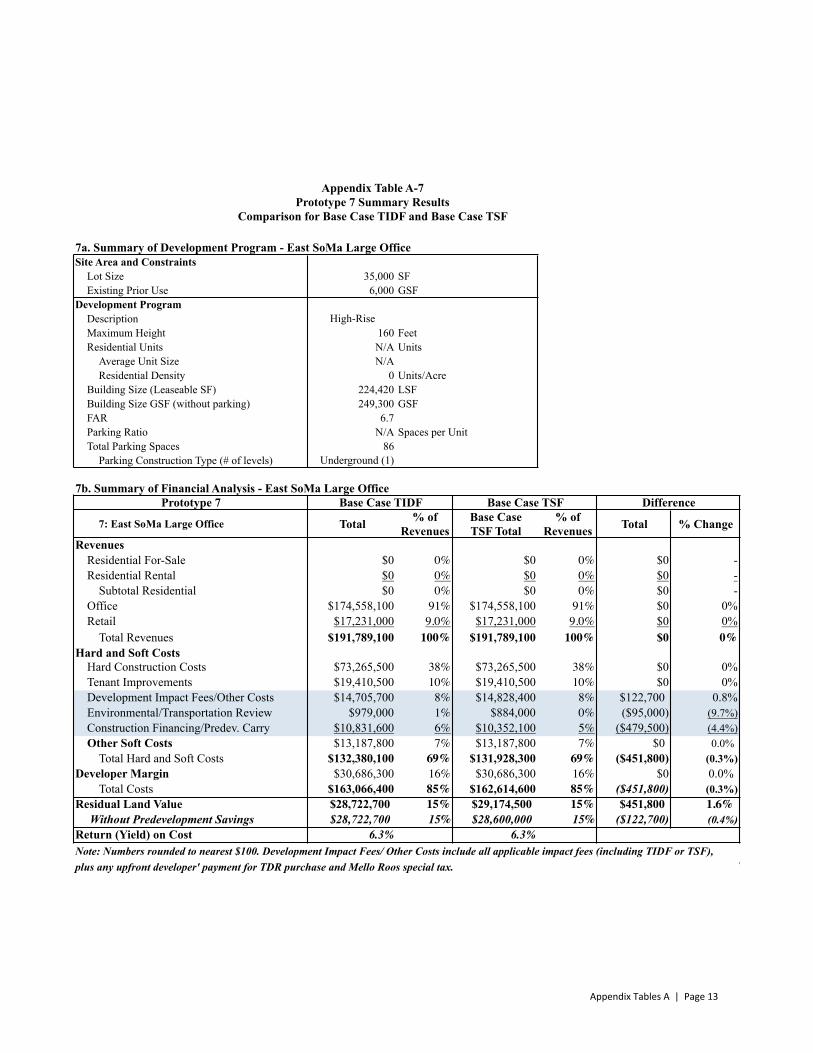
Appendix Table A-7Prototype 7 Summary Results
Comparison for Base Case TIDF and Base Case TSF
Sum
7a. Summary of Development Program - East SoMa Large Office Site Area and Constraints
Lot Size 35,000 SFExisting Prior Use 6,000 GSF
Development ProgramDescription High-RiseMaximum Height 160 FeetResidential Units N/A Units
Average Unit Size N/AResidential Density 0 Units/Acre
Building Size (Leaseable SF) 224,420 LSFBuilding Size GSF (without parking) 249,300 GSFFAR 6.7Parking Ratio N/A Spaces per UnitTotal Parking Spaces 86
Parking Construction Type (# of levels) Underground (1)
7b. Summary of Financial Analysis - East SoMa Large Office Prototype 7 Base Case TIDF Base Case TSF Difference
7: East SoMa Large Office Total % of Revenues
Base CaseTSF Total
% of Revenues Total % Change
RevenuesResidential For-Sale $0 0% $0 0% $0 -Residential Rental $0 0% $0 0% $0 -
Subtotal Residential $0 0% $0 0% $0 -Office $174,558,100 91% $174,558,100 91% $0 0%Retail $17,231,000 9.0% $17,231,000 9.0% $0 0% Total Revenues $191,789,100 100% $191,789,100 100% $0 0%
Hard and Soft CostsHard Construction Costs $73,265,500 38% $73,265,500 38% $0 0%Tenant Improvements $19,410,500 10% $19,410,500 10% $0 0%Development Impact Fees/Other Costs $14,705,700 8% $14,828,400 8% $122,700 0.8%Environmental/Transportation Review $979,000 1% $884,000 0% ($95,000) (9.7%)Construction Financing/Predev. Carry $10,831,600 6% $10,352,100 5% ($479,500) (4.4%)Other Soft Costs $13,187,800 7% $13,187,800 7% $0 0.0%
Total Hard and Soft Costs $132,380,100 69% $131,928,300 69% ($451,800) (0.3%)Developer Margin $30,686,300 16% $30,686,300 16% $0 0.0%
Total Costs $163,066,400 85% $162,614,600 85% ($451,800) (0.3%)Residual Land Value $28,722,700 15% $29,174,500 15% $451,800 1.6%
Without Predevelopment Savings $28,722,700 15% $28,600,000 15% ($122,700) (0.4%)Return (Yield) on Cost 6.3% 6.3%Note: Numbers rounded to nearest $100. Development Impact Fees/ Other Costs include all applicable impact fees (including TIDF or TSF), plus any upfront developer' payment for TDR purchase and Mello Roos special tax. TSF increase
Appendix Tables A | Page 13

7c. Summary of Financial Indicators - East SoMa Large Office Prototype 7 Base Case TIDF
7: East SoMa Large Office TotalSoft Cost as % of
HCCPer Bldg GSF Per Bldg
LSF Per Unit
RevenuesResidential For-Sale $0 $0 $0 N/AResidential Rental $0 $0 $0 N/A
Subtotal Residential $0 $0 $0 N/AOffice $174,558,100 $700 $778 N/ARetail $17,231,000 $69 $77 N/A Total Revenues $191,789,100 $769 $855 N/A
Hard and Soft CostsHard Construction Costs $73,265,500 100% $294 $326 N/ATenant Improvements $19,410,500 26% $78 $86 N/ADevelopment Impact Fees/Other Costs $14,705,700 20% $59 $66 N/AEnvironmental/Transportation Review $979,000 1% $4 $4 N/AConstruction Financing/Predev. Carry $10,831,600 15% $43 $48 N/AOther Soft Costs $13,187,800 18% $53 $59 N/A
Total Hard and Soft Costs $132,380,100 $531 $590 N/ADeveloper Margin $30,686,300 $123 $137 N/A
Total Costs $163,066,400 $654 $727 N/AResidual Land Value $28,722,700 $115 $128 N/A
Without Predevelopment Savings $28,722,700 $115 $128 N/A
Prototype 7 Base Case TSF
7: East SoMa Large Office TotalSoft Cost as % of
HCCPer Bldg GSF Per Bldg
LSF Per Unit
Revenues
Residential For-Sale $0 $0 $0 N/AResidential Rental $0 $0 $0 N/A
Subtotal Residential $0 $0 $0 N/AOffice $174,558,100 $700 $778 N/ARetail $17,231,000 $69 $77 N/A Total Revenues $191,789,100 $769 $855 N/A
Hard and Soft CostsHard Construction Costs $73,265,500 100% $294 $326 N/ATenant Improvements $19,410,500 26% $78 $86 N/ADevelopment Impact Fees/Other Costs $14,828,400 20% $59 $66 N/AEnvironmental/Transportation Review $884,000 1% $4 $4 N/AConstruction Financing/Predev. Carry $10,352,100 14% $42 $46 N/AOther Soft Costs $13,187,800 18% $53 $59 N/A
Total Hard and Soft Costs $131,928,300 $529 $588 N/ADeveloper Margin $30,686,300 $123 $137 N/A
Total Costs $162,614,600 $652 $725 N/AResidual Land Value $29,174,500 $117 $130 N/A
Without Predevelopment Savings $28,600,000 $115 $127 N/A
Appendix Tables A | Page 14
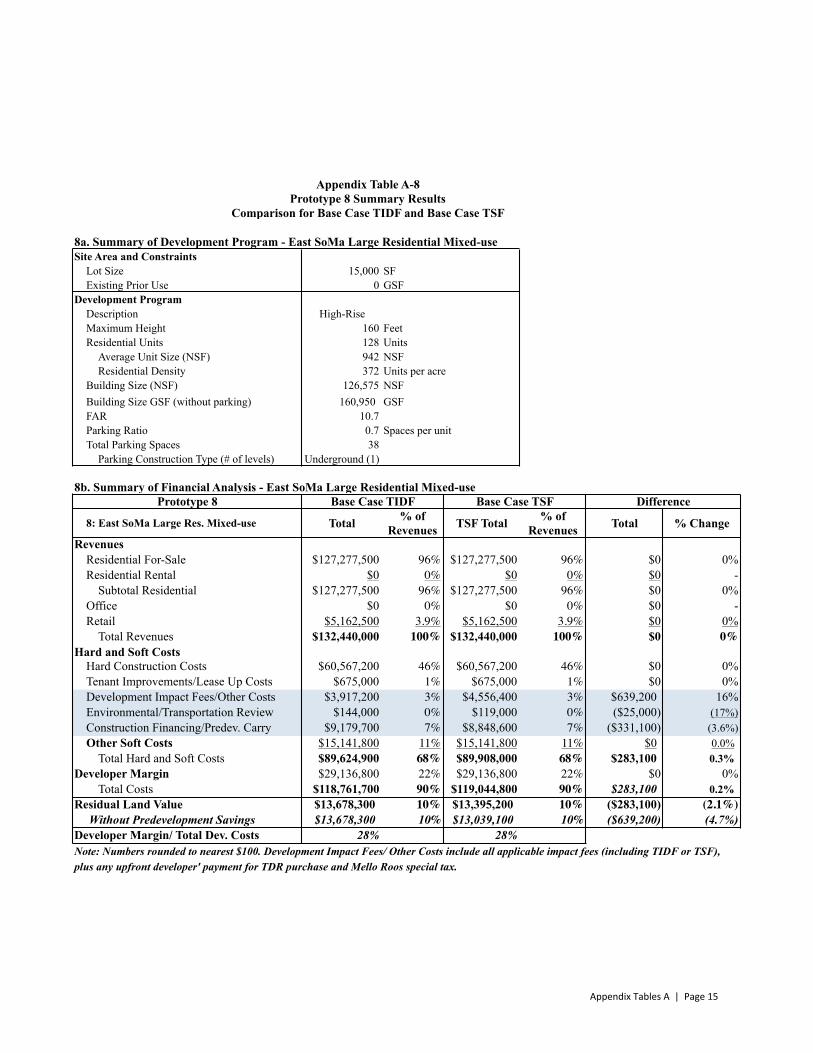
Appendix Table A-8Prototype 8 Summary Results
Comparison for Base Case TIDF and Base Case TSF
8a. Summary of Development Program - East SoMa Large Residential Mixed-useSite Area and Constraints
Lot Size 15,000 SFExisting Prior Use 0 GSF
Development ProgramDescription High-RiseMaximum Height 160 FeetResidential Units 128 Units
Average Unit Size (NSF) 942 NSFResidential Density 372 Units per acre
Building Size (NSF) 126,575 NSFBuilding Size GSF (without parking) 160,950 GSFFAR 10.7Parking Ratio 0.7 Spaces per unitTotal Parking Spaces 38
Parking Construction Type (# of levels) Underground (1)
8b. Summary of Financial Analysis - East SoMa Large Residential Mixed-usePrototype 8 Base Case TIDF Base Case TSF Difference
8: East SoMa Large Res. Mixed-use Total % of Revenues TSF Total % of
Revenues Total % Change
RevenuesResidential For-Sale $127,277,500 96% $127,277,500 96% $0 0%Residential Rental $0 0% $0 0% $0 -
Subtotal Residential $127,277,500 96% $127,277,500 96% $0 0%Office $0 0% $0 0% $0 -Retail $5,162,500 3.9% $5,162,500 3.9% $0 0% Total Revenues $132,440,000 100% $132,440,000 100% $0 0%
Hard and Soft CostsHard Construction Costs $60,567,200 46% $60,567,200 46% $0 0%Tenant Improvements/Lease Up Costs $675,000 1% $675,000 1% $0 0%Development Impact Fees/Other Costs $3,917,200 3% $4,556,400 3% $639,200 16%Environmental/Transportation Review $144,000 0% $119,000 0% ($25,000) (17%)Construction Financing/Predev. Carry $9,179,700 7% $8,848,600 7% ($331,100) (3.6%)Other Soft Costs $15,141,800 11% $15,141,800 11% $0 0.0%
Total Hard and Soft Costs $89,624,900 68% $89,908,000 68% $283,100 0.3%Developer Margin $29,136,800 22% $29,136,800 22% $0 0%
Total Costs $118,761,700 90% $119,044,800 90% $283,100 0.2%Residual Land Value $13,678,300 10% $13,395,200 10% ($283,100) (2.1%)
Without Predevelopment Savings $13,678,300 10% $13,039,100 10% ($639,200) (4.7%)Developer Margin/ Total Dev. Costs 28% 28%Note: Numbers rounded to nearest $100. Development Impact Fees/ Other Costs include all applicable impact fees (including TIDF or TSF), plus any upfront developer' payment for TDR purchase and Mello Roos special tax.
Appendix Tables A | Page 15

8c. Summary of Financial Indicators - East SoMa Large Residential Mixed-usePrototype 8 Base Case TIDF
8: East SoMa Large Residential Mixed-use TotalSoft Cost as % of
HCCPer Bldg GSF Per Bldg
NSF Per Unit
Total Net RevenuesResidential For-Sale $127,277,500 $804 $1,006 $994,355Residential Rental $0 $0 $0 $0
Subtotal Residential $127,277,500 $804 $1,006 $994,355Office $0 $0 $0 $0Retail $5,162,500 $33 $41 $40,332 Total Revenues $132,440,000 $837 $1,046 $1,034,688
Development CostsHard Construction Costs $60,567,200 100% $383 $479 $473,181Tenant Improvements/Lease Up Costs $675,000 1% $4 $5 $5,273Development Impact Fees/Other Costs $3,917,200 6% $25 $31 $30,603Environmental/Transportation Review $144,000 0% $1 $1 $1,125Construction Financing/Predev. Carry $9,179,700 15% $58 $73 $71,716Other Soft Costs $15,141,800 25% $96 $120 $118,295
Total Hard and Soft Costs $89,624,900 $566 $708 $700,195Developer Margin $29,136,800 $184 $230 $227,631
Total Costs $118,761,700 $750 $938 $927,826Residual Land Value $13,678,300 $86 $108 $106,900
Without Predevelopment Savings $13,678,300 $86 $108 $106,900
Prototype 8 Base Case TSF
8: East SoMa Large Residential Mixed-use TotalSoft Cost as % of
HCCPer Bldg GSF Per Bldg
NSF Per Unit
Total Net RevenuesResidential For-Sale $127,277,500 $804 $1,006 $994,355Residential Rental $0 $0 $0 $0
Subtotal Residential $127,277,500 $804 $1,006 $994,355Office $0 $0 $0 $0Retail $5,162,500 $33 $41 $40,332 Total Revenues $132,440,000 $1,046 $1,046 $1,034,688
Development CostsHard Construction Costs $60,567,200 100% $383 $479 $473,181Tenant Improvements/Lease Up Costs $675,000 1% $4 $5 $5,273Development Impact Fees/Other Costs $4,556,400 8% $29 $36 $35,597Environmental/Transportation Review $119,000 0% $1 $1 $930Construction Financing/Predev. Carry $8,848,600 15% $56 $70 $69,130Other Soft Costs $15,141,800 25% $96 $120 $118,295
Total Hard and Soft Costs $89,908,000 $568 $710 $702,406Developer Margin $29,136,800 $184 $230 $227,631
Total Costs $119,044,800 $752 $941 $930,038Residual Land Value $13,395,200 $85 $106 $104,700
Without Predevelopment Savings $13,039,100 $82 $103 $101,900
Appendix Tables A | Page 16
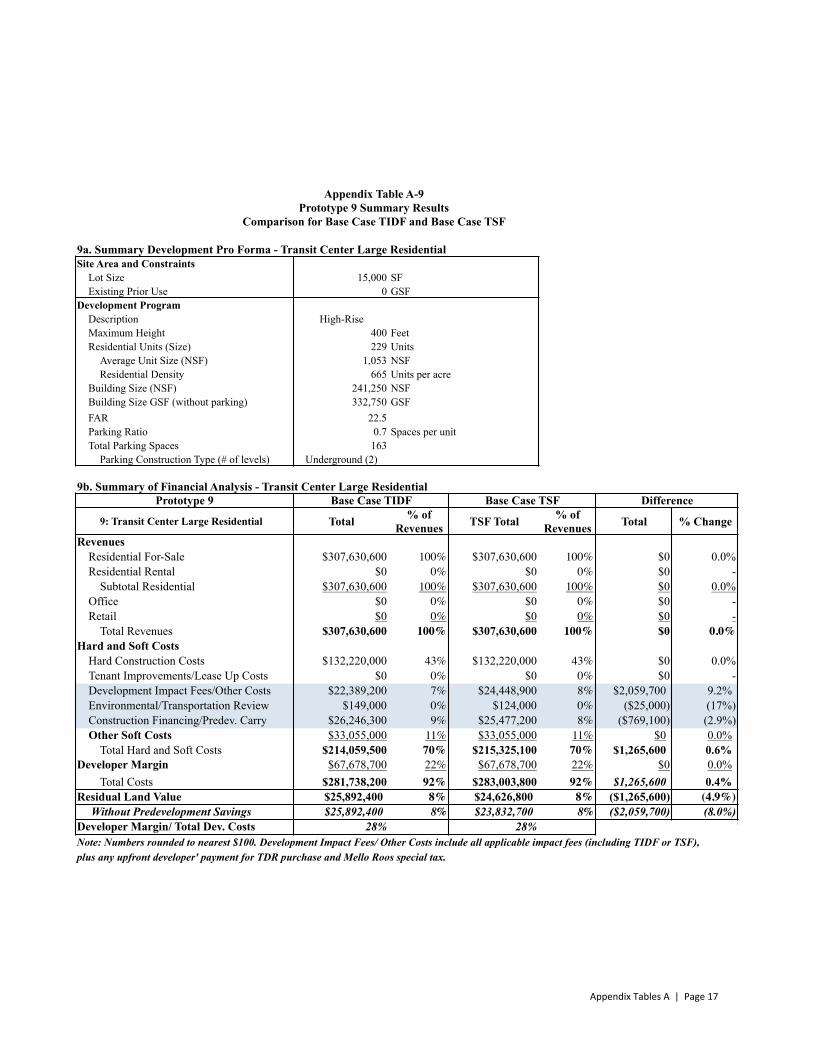
Appendix Table A-9Prototype 9 Summary Results
Comparison for Base Case TIDF and Base Case TSF
9a. Summary Development Pro Forma - Transit Center Large ResidentialSite Area and Constraints
Lot Size 15,000 SFExisting Prior Use 0 GSF
Development ProgramDescription High-RiseMaximum Height 400 FeetResidential Units (Size) 229 Units
Average Unit Size (NSF) 1,053 NSFResidential Density 665 Units per acre
Building Size (NSF) 241,250 NSFBuilding Size GSF (without parking) 332,750 GSFFAR 22.5Parking Ratio 0.7 Spaces per unitTotal Parking Spaces 163
Parking Construction Type (# of levels) Underground (2)
9b. Summary of Financial Analysis - Transit Center Large ResidentialPrototype 9 Base Case TIDF Base Case TSF Difference
9: Transit Center Large Residential Total % of Revenues TSF Total % of
Revenues Total % Change
RevenuesResidential For-Sale $307,630,600 100% $307,630,600 100% $0 0.0%Residential Rental $0 0% $0 0% $0 -
Subtotal Residential $307,630,600 100% $307,630,600 100% $0 0.0%Office $0 0% $0 0% $0 -Retail $0 0% $0 0% $0 - Total Revenues $307,630,600 100% $307,630,600 100% $0 0.0%
Hard and Soft CostsHard Construction Costs $132,220,000 43% $132,220,000 43% $0 0.0%Tenant Improvements/Lease Up Costs $0 0% $0 0% $0 -Development Impact Fees/Other Costs $22,389,200 7% $24,448,900 8% $2,059,700 9.2%Environmental/Transportation Review $149,000 0% $124,000 0% ($25,000) (17%)Construction Financing/Predev. Carry $26,246,300 9% $25,477,200 8% ($769,100) (2.9%)Other Soft Costs $33,055,000 11% $33,055,000 11% $0 0.0%
Total Hard and Soft Costs $214,059,500 70% $215,325,100 70% $1,265,600 0.6%Developer Margin $67,678,700 22% $67,678,700 22% $0 0.0%
Total Costs $281,738,200 92% $283,003,800 92% $1,265,600 0.4%Residual Land Value $25,892,400 8% $24,626,800 8% ($1,265,600) (4.9%)
Without Predevelopment Savings $25,892,400 8% $23,832,700 8% ($2,059,700) (8.0%)Developer Margin/ Total Dev. Costs 28% 28% TSP increaseNote: Numbers rounded to nearest $100. Development Impact Fees/ Other Costs include all applicable impact fees (including TIDF or TSF), plus any upfront developer' payment for TDR purchase and Mello Roos special tax.
Appendix Tables A | Page 17

9c. Summary of Financial Indicators - Transit Center Large ResidentialPrototype 9 Base Case TIDF
9: Transit Center Large Residential TotalSoft Cost as % of
HCCPer Bldg GSF Per Bldg
NSF Per Unit
RevenuesResidential For-Sale $307,630,600 $925 $1,275 $1,343,365Residential Rental $0 $0 $0 $0
Subtotal Residential $307,630,600 $925 $1,275 $1,343,365Office $0 $0 $0 $0Retail $0 $0 $0 $0 Total Revenues $307,630,600 $925 $1,275 $1,343,365
Hard and Soft CostsHard Construction Costs $132,220,000 100% $397 $548 $577,380Tenant Improvements/Lease Up Costs $0 0% $0 $0 $0Development Impact Fees/Other Costs $22,389,200 17% $67 $93 $97,769Environmental/Transportation Review $149,000 0% $0 $1 $651Construction Financing/Predev. Carry $26,246,300 20% $79 $109 $114,613Other Soft Costs $33,055,000 25% $99 $137 $144,345
Total Hard and Soft Costs $214,059,500 $643 $887 $934,758Developer Margin $67,678,700 $203 $281 $295,540
Total Costs $281,738,200 $847 $1,168 $1,230,298Residual Land Value $25,892,400 $78 $107 $113,100
Without Predevelopment Savings $25,892,400 $78 $107 $113,100
Prototype 9 Base Case TSF
9: Transit Center Large Residential TotalSoft Cost as % of
HCCPer Bldg GSF Per Bldg
NSF Per Unit
RevenuesResidential For-Sale $307,630,600 $925 $1,275 $1,343,365Residential Rental $0 $0 $0 $0
Subtotal Residential $307,630,600 $925 $1,275 $1,343,365Office $0 $0 $0 $0Retail $0 $0 $0 $0 Total Revenues $307,630,600 $925 $1,275 $1,343,365
Hard and Soft CostsHard Construction Costs $132,220,000 100% $397 $548 $577,380Tenant Improvements/Lease Up Costs $0 0% $0 $0 $0Development Impact Fees/Other Costs $24,448,900 18% $73 $101 $106,764Environmental/Transportation Review $124,000 0% $0 $1 $541Construction Financing/Predev. Carry $25,477,200 19% $77 $106 $111,254Other Soft Costs $33,055,000 25% $99 $137 $144,345
Total Hard and Soft Costs $215,325,100 $647 $893 $940,284Developer Margin $67,678,700 $203 $281 $295,540
Total Costs $283,003,800 $850 $1,173 $1,235,824Residual Land Value $24,626,800 $74 $102 $107,500
Without Predevelopment Savings $23,832,700 $72 $99 $104,100
Appendix Tables A | Page 18

Appendix Table A-10Prototype 10 Summary Results
Comparison for Base Case TIDF and Base Case TSF
10a. Summary of Development Program - Transit Center Large OfficeSite Area and Constraints
Lot Size 20,000 SFExisting Prior Use 0 GSF
Development ProgramDescription High-RiseMaximum Height 400 Feet
Residential Units N/A UnitsAverage Unit Size N/A NSF
Residential Density 0 Units/AcreBuilding Size (Leaseable SF) 320,300 LSFBuilding Size GSF (without parking) 384,700 GSFFAR 19.39Parking Ratio N/A Spaces per UnitTotal Parking Spaces 93
Parking Construction Type (# of levels) Underground (2)
10b. Summary of Financial Analysis - Transit Center Large OfficePrototype 10 Base Case TIDF Base Case TSF Difference
10: Transit Center Large Office Total % of Revenues
Base CaseTSF Total
% of Revenues Total % Change
RevenuesResidential For-Sale $0 0% $0 0% $0 -Residential Rental $0 0% $0 0% $0 -
Subtotal Residential $0 0% $0 0% $0 -Office $319,920,700 97% $319,920,700 97% $0 0.0%Retail $9,881,600 3% $9,881,600 3% $0 0.0% Total Revenues $329,802,300 100% $329,802,300 100% $0 0.0%
Hard and Soft CostsHard Construction Costs $127,821,800 39% $127,821,800 39% $0 0.0%Tenant Improvements/Lease Up Costs $32,030,000 10% $32,030,000 10% $0 0.0%Development Impact Fees/Other Costs $30,290,600 9% $30,495,800 9% $205,200 0.7%Environmental/Transportation Review $249,200 0% $199,200 0% ($50,000) (20%)Construction Financing/Predev. Carry $21,445,700 7% $20,621,200 6% ($824,500) (3.8%)Other Soft Costs $23,007,900 7% $23,007,900 7% $0 0.0%
Total Hard and Soft Costs $234,845,200 71% $234,175,900 71% ($669,300) (0.3%)Developer Margin $52,768,400 16% $52,768,400 16% $0 0.0%
Total Costs $287,613,600 87% $286,944,300 87% ($669,300) (0.2%)Residual Land Value $42,188,700 13% $42,858,000 13% $669,300 1.6%
Without Predevelopment Savings $42,188,700 13% $41,983,500 13% ($205,200) (0.5%)Return (Yield) on Cost 6.2% 6.2% TSP increaseNote: Numbers rounded to nearest $100. Development Impact Fees/ Other Costs include all applicable impact fees (including TIDF or TSF), plus any upfront developer' payment for TDR purchase and Mello Roos special tax.
Appendix Tables A | Page 19

10c. Summary of Financial Indicators - Transit Center Large OfficePrototype 10 Base Case TIDF
10: Transit Center Large Office TotalSoft Cost as % of
HCCPer Bldg GSF Per Bldg
NSF Per Unit
RevenuesResidential For-Sale $0 $0 $0 N/AResidential Rental $0 $0 $0 N/A
Subtotal Residential $0 $0 $0 N/AOffice $319,920,700 $832 $999 N/ARetail $9,881,600 $26 $31 N/A Total Revenues $329,802,300 $857 $1,030 N/A
Hard and Soft CostsHard Construction Costs $127,821,800 100% $332 $399 N/ATenant Improvements/Lease Up Costs $32,030,000 25% $83 $100 N/ADevelopment Impact Fees/Other Costs $30,290,600 24% $79 $95 N/AEnvironmental/Transportation Review $249,200 0% $1 $1 N/AConstruction Financing/Predev. Carry $21,445,700 17% $56 $67 N/AOther Soft Costs $23,007,900 18% $60 $72 N/A
Total Hard and Soft Costs $234,845,200 $610 $733 N/ADeveloper Margin $52,768,400 $137 $165 N/A
Total Costs $287,613,600 $748 $898 N/AResidual Land Value $42,188,700 $110 $132 N/A
Without Predevelopment Savings $42,188,700 $110 $132 N/A
Prototype 10 Base Case TSF
10: Transit Center Large Office TotalSoft Cost as % of
HCCPer Bldg GSF Per Bldg
NSF Per Unit
RevenuesResidential For-Sale $0 $0 $0 N/AResidential Rental $0 $0 $0 N/A
Subtotal Residential $0 $0 $0 N/AOffice $319,920,700 $832 $999 N/ARetail $9,881,600 $26 $31 N/A Total Revenues $329,802,300 $857 $1,030 N/A
Hard and Soft CostsHard Construction Costs $127,821,800 100% $332 $399 N/ATenant Improvements/Lease Up Costs $32,030,000 25% $83 $100 N/ADevelopment Impact Fees/Other Costs $30,495,800 24% $79 $95 N/AEnvironmental/Transportation Review $199,200 0% $1 $1 N/AConstruction Financing/Predev. Carry $20,621,200 16% $54 $64 N/AOther Soft Costs $23,007,900 18% $60 $72 N/A
Total Hard and Soft Costs $234,175,900 $609 $731 N/ADeveloper Margin $52,768,400 $137 $165 N/A
Total Costs $286,944,300 $746 $896 N/AResidual Land Value $42,858,000 $111 $134 N/A
Without Predevelopment Savings $41,983,500 $109 $131 N/A
Appendix Tables A | Page 20
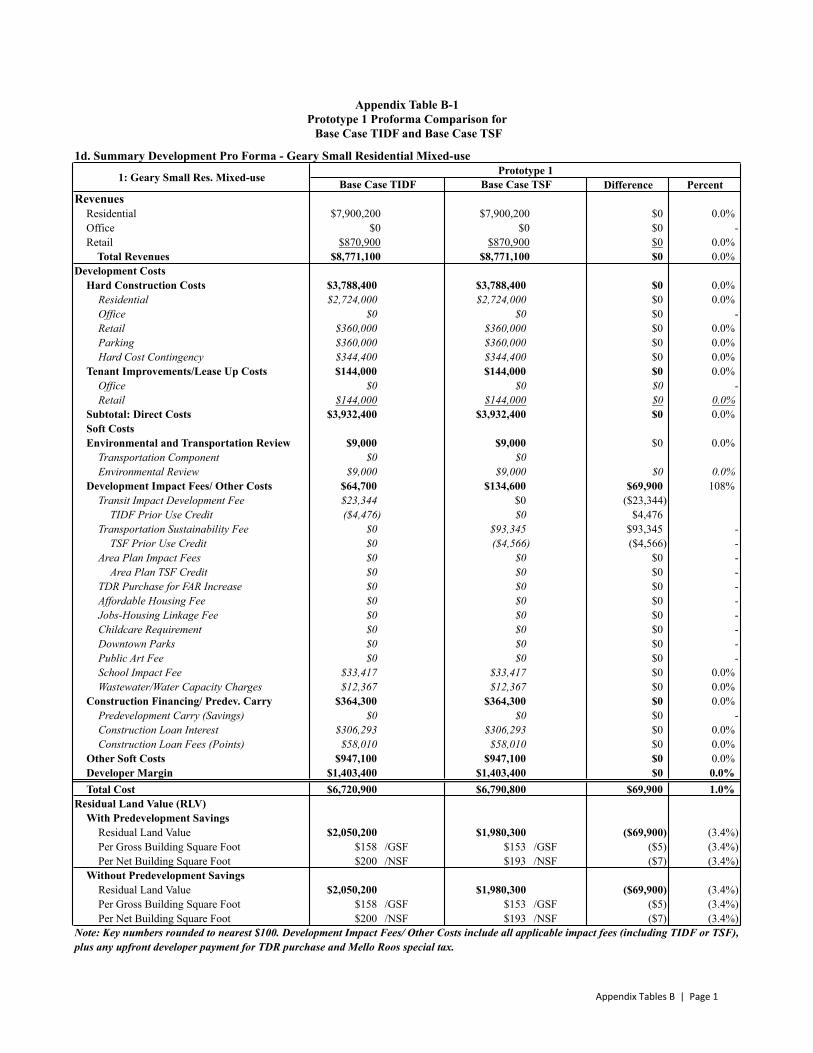
Appendix Table B-1Prototype 1 Proforma Comparison for Base Case TIDF and Base Case TSF
1d. Summary Development Pro Forma - Geary Small Residential Mixed-usePrototype 1
Base Case TIDF Base Case TSF Difference PercentRevenues
Residential $7,900,200 $7,900,200 $0 0.0%Office $0 $0 $0 -Retail $870,900 $870,900 $0 0.0% Total Revenues $8,771,100 $8,771,100 $0 0.0%
Development CostsHard Construction Costs $3,788,400 $3,788,400 $0 0.0%
Residential $2,724,000 $2,724,000 $0 0.0%Office $0 $0 $0 -Retail $360,000 $360,000 $0 0.0%Parking $360,000 $360,000 $0 0.0%Hard Cost Contingency $344,400 $344,400 $0 0.0%
Tenant Improvements/Lease Up Costs $144,000 $144,000 $0 0.0%Office $0 $0 $0 -Retail $144,000 $144,000 $0 0.0%
Subtotal: Direct Costs $3,932,400 $3,932,400 $0 0.0%Soft CostsEnvironmental and Transportation Review $9,000 $9,000 $0 0.0%
Transportation Component $0 $0Environmental Review $9,000 $9,000 $0 0.0%
Development Impact Fees/ Other Costs $64,700 $134,600 $69,900 108%Transit Impact Development Fee $23,344 $0 ($23,344)
TIDF Prior Use Credit ($4,476) $0 $4,476Transportation Sustainability Fee $0 $93,345 $93,345 -
TSF Prior Use Credit $0 ($4,566) ($4,566) -Area Plan Impact Fees $0 $0 $0 -
Area Plan TSF Credit $0 $0 $0 -TDR Purchase for FAR Increase $0 $0 $0 -Affordable Housing Fee $0 $0 $0 -Jobs-Housing Linkage Fee $0 $0 $0 -Childcare Requirement $0 $0 $0 -Downtown Parks $0 $0 $0 -Public Art Fee $0 $0 $0 -School Impact Fee $33,417 $33,417 $0 0.0%Wastewater/Water Capacity Charges $12,367 $12,367 $0 0.0%
Construction Financing/ Predev. Carry $364,300 $364,300 $0 0.0%Predevelopment Carry (Savings) $0 $0 $0 -Construction Loan Interest $306,293 $306,293 $0 0.0%Construction Loan Fees (Points) $58,010 $58,010 $0 0.0%
Other Soft Costs $947,100 $947,100 $0 0.0%Developer Margin $1,403,400 $1,403,400 $0 0.0%Total Cost $6,720,900 $6,790,800 $69,900 1.0%
Residual Land Value (RLV)With Predevelopment Savings
Residual Land Value $2,050,200 $1,980,300 ($69,900) (3.4%)Per Gross Building Square Foot $158 /GSF $153 /GSF ($5) (3.4%)Per Net Building Square Foot $200 /NSF $193 /NSF ($7) (3.4%)
Without Predevelopment SavingsResidual Land Value $2,050,200 $1,980,300 ($69,900) (3.4%)Per Gross Building Square Foot $158 /GSF $153 /GSF ($5) (3.4%)Per Net Building Square Foot $200 /NSF $193 /NSF ($7) (3.4%)
Note: Key numbers rounded to nearest $100. Development Impact Fees/ Other Costs include all applicable impact fees (including TIDF or TSF), plus any upfront developer payment for TDR purchase and Mello Roos special tax.
1: Geary Small Res. Mixed-use
Appendix Tables B | Page 1
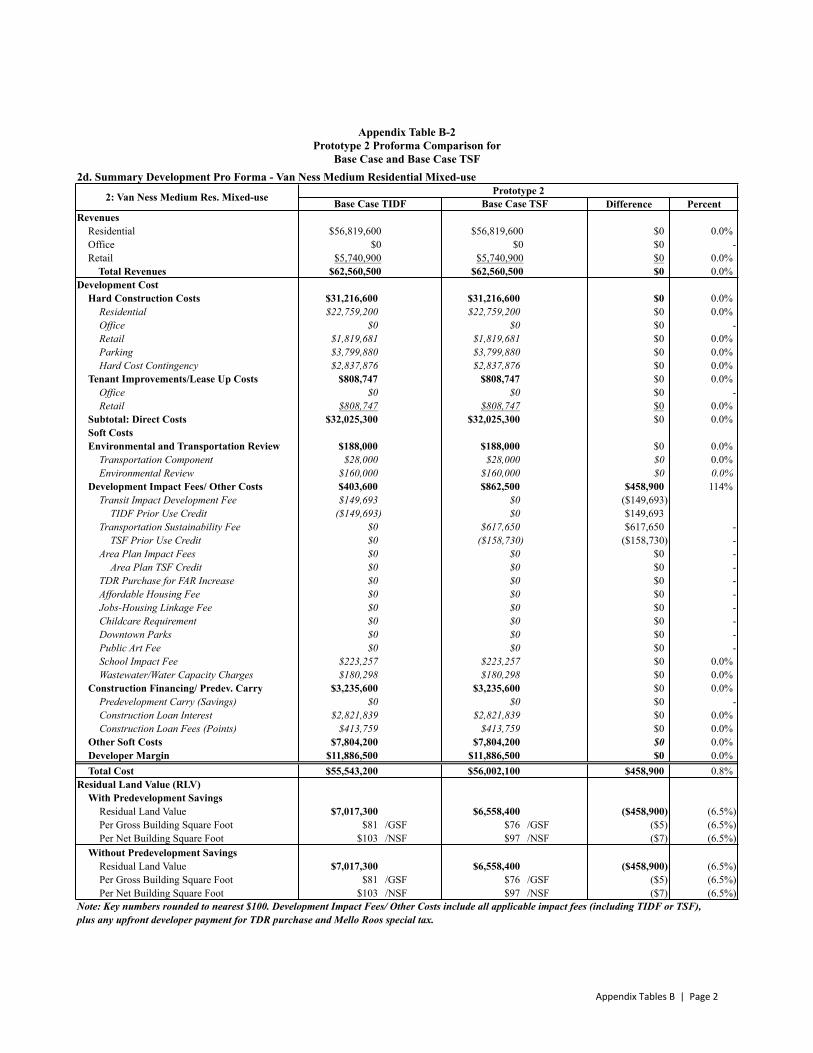
Appendix Table B-2Prototype 2 Proforma Comparison for
Base Case and Base Case TSF2d. Summary Development Pro Forma - Van Ness Medium Residential Mixed-use
Prototype 2Base Case TIDF Base Case TSF Difference Percent
RevenuesResidential $56,819,600 $56,819,600 $0 0.0%Office $0 $0 $0 -Retail $5,740,900 $5,740,900 $0 0.0% Total Revenues $62,560,500 $62,560,500 $0 0.0%
Development CostHard Construction Costs $31,216,600 $31,216,600 $0 0.0%
Residential $22,759,200 $22,759,200 $0 0.0%Office $0 $0 $0 -Retail $1,819,681 $1,819,681 $0 0.0%Parking $3,799,880 $3,799,880 $0 0.0%Hard Cost Contingency $2,837,876 $2,837,876 $0 0.0%
Tenant Improvements/Lease Up Costs $808,747 $808,747 $0 0.0%Office $0 $0 $0 -Retail $808,747 $808,747 $0 0.0%
Subtotal: Direct Costs $32,025,300 $32,025,300 $0 0.0%Soft CostsEnvironmental and Transportation Review $188,000 $188,000 $0 0.0%
Transportation Component $28,000 $28,000 $0 0.0%Environmental Review $160,000 $160,000 $0 0.0%
Development Impact Fees/ Other Costs $403,600 $862,500 $458,900 114%Transit Impact Development Fee $149,693 $0 ($149,693)
TIDF Prior Use Credit ($149,693) $0 $149,693Transportation Sustainability Fee $0 $617,650 $617,650 -
TSF Prior Use Credit $0 ($158,730) ($158,730) -Area Plan Impact Fees $0 $0 $0 -
Area Plan TSF Credit $0 $0 $0 -TDR Purchase for FAR Increase $0 $0 $0 -Affordable Housing Fee $0 $0 $0 -Jobs-Housing Linkage Fee $0 $0 $0 -Childcare Requirement $0 $0 $0 -Downtown Parks $0 $0 $0 -Public Art Fee $0 $0 $0 -School Impact Fee $223,257 $223,257 $0 0.0%Wastewater/Water Capacity Charges $180,298 $180,298 $0 0.0%
Construction Financing/ Predev. Carry $3,235,600 $3,235,600 $0 0.0%Predevelopment Carry (Savings) $0 $0 $0 -Construction Loan Interest $2,821,839 $2,821,839 $0 0.0%Construction Loan Fees (Points) $413,759 $413,759 $0 0.0%
Other Soft Costs $7,804,200 $7,804,200 $0 0.0%Developer Margin $11,886,500 $11,886,500 $0 0.0%Total Cost $55,543,200 $56,002,100 $458,900 0.8%
Residual Land Value (RLV)With Predevelopment Savings
Residual Land Value $7,017,300 $6,558,400 ($458,900) (6.5%)Per Gross Building Square Foot $81 /GSF $76 /GSF ($5) (6.5%)Per Net Building Square Foot $103 /NSF $97 /NSF ($7) (6.5%)
Without Predevelopment SavingsResidual Land Value $7,017,300 $6,558,400 ($458,900) (6.5%)Per Gross Building Square Foot $81 /GSF $76 /GSF ($5) (6.5%)Per Net Building Square Foot $103 /NSF $97 /NSF ($7) (6.5%)
Note: Key numbers rounded to nearest $100. Development Impact Fees/ Other Costs include all applicable impact fees (including TIDF or TSF), plus any upfront developer payment for TDR purchase and Mello Roos special tax.
2: Van Ness Medium Res. Mixed-use
Appendix Tables B | Page 2
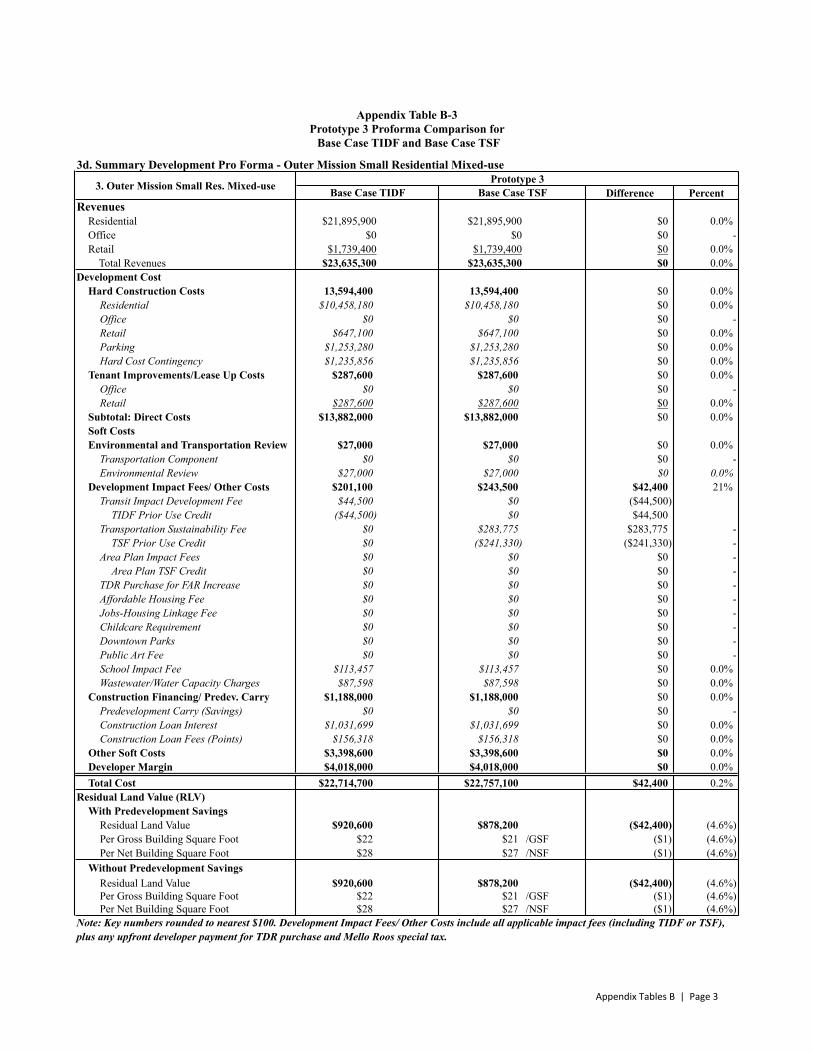
Appendix Table B-3Prototype 3 Proforma Comparison for Base Case TIDF and Base Case TSF
3d. Summary Development Pro Forma - Outer Mission Small Residential Mixed-usePrototype 3
Base Case TIDF Base Case TSF Difference PercentRevenues
Residential $21,895,900 $21,895,900 $0 0.0%Office $0 $0 $0 -Retail $1,739,400 $1,739,400 $0 0.0% Total Revenues $23,635,300 $23,635,300 $0 0.0%
Development CostHard Construction Costs 13,594,400 13,594,400 $0 0.0%
Residential $10,458,180 $10,458,180 $0 0.0%Office $0 $0 $0 -Retail $647,100 $647,100 $0 0.0%Parking $1,253,280 $1,253,280 $0 0.0%Hard Cost Contingency $1,235,856 $1,235,856 $0 0.0%
Tenant Improvements/Lease Up Costs $287,600 $287,600 $0 0.0%Office $0 $0 $0 -Retail $287,600 $287,600 $0 0.0%
Subtotal: Direct Costs $13,882,000 $13,882,000 $0 0.0%Soft CostsEnvironmental and Transportation Review $27,000 $27,000 $0 0.0%
Transportation Component $0 $0 $0 -Environmental Review $27,000 $27,000 $0 0.0%
Development Impact Fees/ Other Costs $201,100 $243,500 $42,400 21%Transit Impact Development Fee $44,500 $0 ($44,500)
TIDF Prior Use Credit ($44,500) $0 $44,500Transportation Sustainability Fee $0 $283,775 $283,775 -
TSF Prior Use Credit $0 ($241,330) ($241,330) -Area Plan Impact Fees $0 $0 $0 -
Area Plan TSF Credit $0 $0 $0 -TDR Purchase for FAR Increase $0 $0 $0 -Affordable Housing Fee $0 $0 $0 -Jobs-Housing Linkage Fee $0 $0 $0 -Childcare Requirement $0 $0 $0 -Downtown Parks $0 $0 $0 -Public Art Fee $0 $0 $0 -School Impact Fee $113,457 $113,457 $0 0.0%Wastewater/Water Capacity Charges $87,598 $87,598 $0 0.0%
Construction Financing/ Predev. Carry $1,188,000 $1,188,000 $0 0.0%Predevelopment Carry (Savings) $0 $0 $0 -Construction Loan Interest $1,031,699 $1,031,699 $0 0.0%Construction Loan Fees (Points) $156,318 $156,318 $0 0.0%
Other Soft Costs $3,398,600 $3,398,600 $0 0.0%Developer Margin $4,018,000 $4,018,000 $0 0.0%Total Cost $22,714,700 $22,757,100 $42,400 0.2%
Residual Land Value (RLV)With Predevelopment Savings
Residual Land Value $920,600 $878,200 ($42,400) (4.6%)Per Gross Building Square Foot $22 $21 /GSF ($1) (4.6%)Per Net Building Square Foot $28 $27 /NSF ($1) (4.6%)
Without Predevelopment SavingsResidual Land Value $920,600 $878,200 ($42,400) (4.6%)Per Gross Building Square Foot $22 $21 /GSF ($1) (4.6%)Per Net Building Square Foot $28 $27 /NSF ($1) (4.6%)
Note: Key numbers rounded to nearest $100. Development Impact Fees/ Other Costs include all applicable impact fees (including TIDF or TSF), plus any upfront developer payment for TDR purchase and Mello Roos special tax.
3. Outer Mission Small Res. Mixed-use
Appendix Tables B | Page 3

Appendix Table B-4Prototype 4 Proforma Comparison for
Base Case and Base Case TSF
4d. Summary Development Pro Forma - Mission Small Residential Mixed UsePrototype 4
Base Case TIDF Base Case TSF Difference PercentRevenues
Residential $13,445,800 $13,445,800 $0 0.0%Office $0 $0 $0 -Retail $1,530,900 $1,530,900 $0 0.0% Total Revenues $14,976,700 $14,976,700 $0 0.0%
Development CostHard Construction Costs $6,614,500 $6,614,500 $0 0.0%
Residential $5,138,640 $5,138,640 $0 0.0%Office $0 $0 $0 -Retail $562,500 $562,500 $0 0.0%Parking $312,000 $312,000 $0 0.0%Hard Cost Contingency $601,314 $601,314 $0 0.0%
Tenant Improvements/Lease Up Costs $225,000 $225,000 $0 0.0%Office $0 $0 $0 -Retail $225,000 $225,000 $0 0.0%
Subtotal: Direct Costs $6,839,500 $6,839,500 $0 0.0%Soft CostsEnvironmental and Transportation Review $11,000 $11,000 $0 0.0%
Transportation Component $0 $0 $0 -Environmental Review $11,000 $11,000 $0 0.0%
Development Impact Fees/ Other Costs $270,000 $293,600 $23,600 9%Transit Impact Development Fee $36,475 $0 ($36,475)
TIDF Prior Use Credit ($18,650) $0 $18,650Transportation Sustainability Fee $0 $158,414 $158,414 -
TSF Prior Use Credit $0 ($102,735) ($102,735) -Area Plan Impact Fees $160,968 $160,968 $0 0.0%
Area Plan TSF Credit $0 ($14,277) ($14,277) -TDR Purchase for FAR Increase $0 $0 $0 -Affordable Housing Fee $0 $0 $0 -Jobs-Housing Linkage Fee $0 $0 $0 -Childcare Requirement $0 $0 $0 -Downtown Parks $0 $0 $0 -Public Art (% of Hard cost) $0 $0 $0 -School Impact Fee $58,121 $58,121 $0 0.0%Wastewater/Water Capacity Charge $33,099 $33,099 $0 0.0%
Construction Financing/ Predev. Carry $665,600 $665,600 $0 0.0%Predevelopment Carry (Savings) $0 $0 $0 -Construction Loan Interest $566,578 $566,578 $0 0.0%Construction Loan Fees (Points) $99,052 $99,052 $0 0.0%Other Soft Costs $1,653,600 $1,653,600 $0 0.0%
Developer Margin $2,396,300 $2,396,300 $0 0.0%Total Cost $11,836,000 $11,859,600 $23,600 0.2%
Residual Land Value (RLV)With Predevelopment Savings
Residual Land Value $3,140,700 $3,117,100 ($23,600) (0.8%)Per Gross Building Square Foot $141 $140 /GSF ($1) (0.8%)Per Net Building Square Foot $189 $188 /NSF ($1) (0.8%)
Without Predevelopment SavingsResidual Land Value $3,140,700 $3,117,100 ($23,600) (0.8%)Per Gross Building Square Foot $141 $140 /GSF ($1) (0.8%)Per Net Building Square Foot $189 $188 /NSF ($1) (0.8%)
Note: Key numbers rounded to nearest $100. Development Impact Fees/ Other Costs include all applicable impact fees (including TIDF or TSF), plus any upfront developer payment for TDR purchase and Mello Roos special tax.
4: Mission Small Res. Mixed-use
Appendix Tables B | Page 4
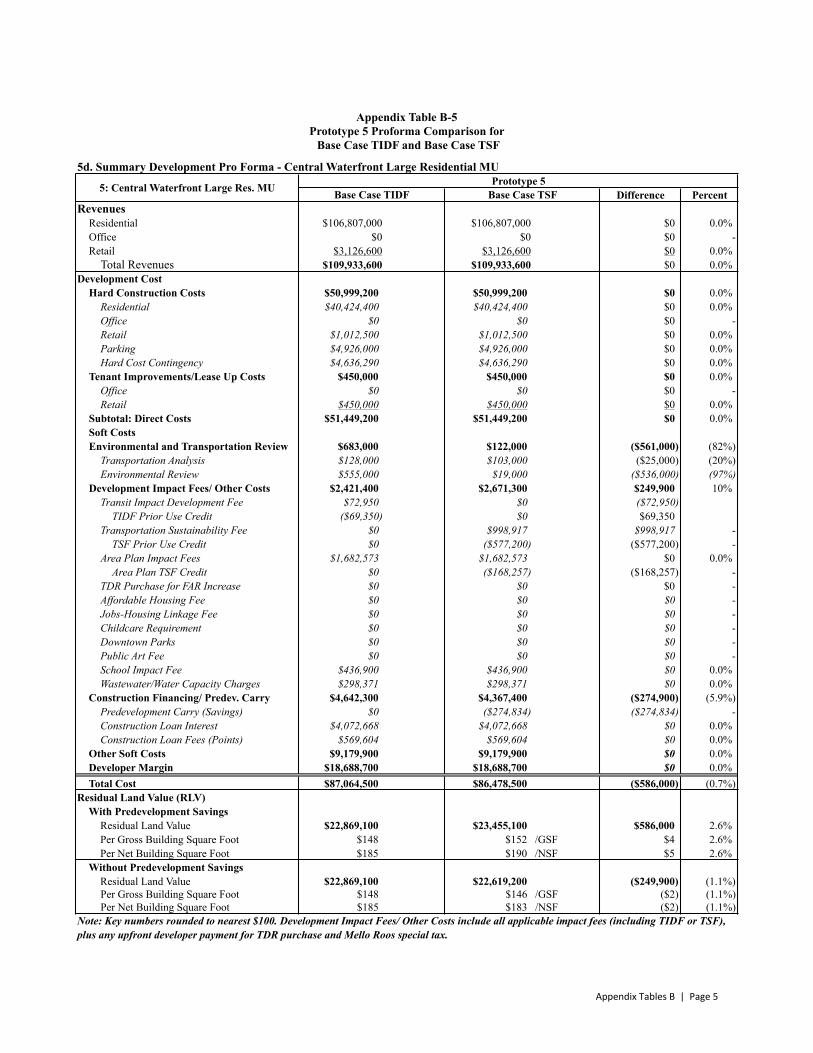
Appendix Table B-5Prototype 5 Proforma Comparison for Base Case TIDF and Base Case TSF
5d. Summary Development Pro Forma - Central Waterfront Large Residential MUPrototype 5
Base Case TIDF Base Case TSF Difference PercentRevenues
Residential $106,807,000 $106,807,000 $0 0.0%Office $0 $0 $0 -Retail $3,126,600 $3,126,600 $0 0.0% Total Revenues $109,933,600 $109,933,600 $0 0.0%
Development CostHard Construction Costs $50,999,200 $50,999,200 $0 0.0%
Residential $40,424,400 $40,424,400 $0 0.0%Office $0 $0 $0 -Retail $1,012,500 $1,012,500 $0 0.0%Parking $4,926,000 $4,926,000 $0 0.0%Hard Cost Contingency $4,636,290 $4,636,290 $0 0.0%
Tenant Improvements/Lease Up Costs $450,000 $450,000 $0 0.0%Office $0 $0 $0 -Retail $450,000 $450,000 $0 0.0%
Subtotal: Direct Costs $51,449,200 $51,449,200 $0 0.0%Soft CostsEnvironmental and Transportation Review $683,000 $122,000 ($561,000) (82%)
Transportation Analysis $128,000 $103,000 ($25,000) (20%)Environmental Review $555,000 $19,000 ($536,000) (97%)
Development Impact Fees/ Other Costs $2,421,400 $2,671,300 $249,900 10%Transit Impact Development Fee $72,950 $0 ($72,950)
TIDF Prior Use Credit ($69,350) $0 $69,350Transportation Sustainability Fee $0 $998,917 $998,917 -
TSF Prior Use Credit $0 ($577,200) ($577,200) -Area Plan Impact Fees $1,682,573 $1,682,573 $0 0.0%
Area Plan TSF Credit $0 ($168,257) ($168,257) -TDR Purchase for FAR Increase $0 $0 $0 -Affordable Housing Fee $0 $0 $0 -Jobs-Housing Linkage Fee $0 $0 $0 -Childcare Requirement $0 $0 $0 -Downtown Parks $0 $0 $0 -Public Art Fee $0 $0 $0 -School Impact Fee $436,900 $436,900 $0 0.0%Wastewater/Water Capacity Charges $298,371 $298,371 $0 0.0%
Construction Financing/ Predev. Carry $4,642,300 $4,367,400 ($274,900) (5.9%)Predevelopment Carry (Savings) $0 ($274,834) ($274,834) -Construction Loan Interest $4,072,668 $4,072,668 $0 0.0%Construction Loan Fees (Points) $569,604 $569,604 $0 0.0%
Other Soft Costs $9,179,900 $9,179,900 $0 0.0%Developer Margin $18,688,700 $18,688,700 $0 0.0%Total Cost $87,064,500 $86,478,500 ($586,000) (0.7%)
Residual Land Value (RLV)With Predevelopment Savings
Residual Land Value $22,869,100 $23,455,100 $586,000 2.6%Per Gross Building Square Foot $148 $152 /GSF $4 2.6%Per Net Building Square Foot $185 $190 /NSF $5 2.6%
Without Predevelopment SavingsResidual Land Value $22,869,100 $22,619,200 ($249,900) (1.1%)Per Gross Building Square Foot $148 $146 /GSF ($2) (1.1%)Per Net Building Square Foot $185 $183 /NSF ($2) (1.1%)
Note: Key numbers rounded to nearest $100. Development Impact Fees/ Other Costs include all applicable impact fees (including TIDF or TSF),plus any upfront developer payment for TDR purchase and Mello Roos special tax.
5: Central Waterfront Large Res. MU
Appendix Tables B | Page 5

Appendix Table B-6Prototype 6 Proforma Comparison for Base Case TIDF and Base Case TSF
6d. Summary Development Pro Forma - East SoMa Medium Residential Mixed-usePrototype 6
Base Case TIDF Base Case TSF Difference PercentRevenues
Residential $40,092,100 $40,092,100 $0 0.0%Office $0 $0 $0 -Retail $3,382,800 $3,382,800 $0 0.0% Total Revenues $43,474,900 $43,474,900 $0 0.0%
Development CostHard Construction Costs $21,266,900 $21,266,900 $0 0.0%
Residential $16,665,000 $16,665,000 $0 0.0%Office $0 $0 $0 -Retail $1,012,500 $1,012,500 $0 0.0%Parking $1,656,000 $1,656,000 $0 0.0%Hard Cost Contingency $1,933,350 $1,933,350 $0 0.0%
Tenant Improvements/Lease Up Costs $450,000 $450,000 $0 0.0%Office $0 $0 $0 -Retail $450,000 $450,000 $0 0.0%
Subtotal: Direct Costs $21,716,900 $21,716,900 $0 0.0%Soft CostsEnvironmental and Transportation Review $119,000 $119,000 $0 0.0%
Transportation Component $103,000 $103,000 $0 0.0%Environmental Review $16,000 $16,000 $0 0.0%
Development Impact Fees/ Other Costs $1,443,400 $1,571,000 $127,600 8.8%Transit Impact Development Fee $72,950 $0 ($72,950)
TIDF Prior Use Credit ($37,300) $0 $37,300Transportation Sustainability Fee $0 $416,005 $416,005 -
TSF Prior Use Credit $0 ($152,200) ($152,200) -Area Plan Impact Fees $1,090,931 $1,090,936 $5 0.0%
Area Plan TSF Credit $0 ($100,589) ($100,589) -TDR Purchase for FAR Increase $0 $0 $0 -Affordable Housing Fee $0 $0 $0 -Jobs-Housing Linkage Fee $0 $0 $0 -Childcare Requirement $0 $0 $0 -Downtown Parks $0 $0 $0 -Public Art Fee $0 $0 $0 -School Impact Fee $162,866 $162,866 $0 0.0%Wastewater/Water Capacity Charge $153,983 $153,983 $0 0.0%
Construction Financing/ Predev. Carry $1,768,300 $1,768,300 $0 0.0%Predevelopment Carry (Savings) $0 $0 $0 -Construction Loan Interest $1,486,706 $1,486,706 $0 0.0%Construction Loan Fees (Points) $281,573 $281,573 $0 0.0%
Other Soft Costs $3,828,000 $3,828,000 $0 0.0%Developer Margin $8,260,200 $8,260,200 $0 0.0%Total Cost $37,135,800 $37,263,400 $127,600 0.3%
Residual Land Value (RLV)With Predevelopment Savings
Residual Land Value $6,339,100 $6,211,500 ($127,600) (2.0%)Per Gross Building Square Foot $104.69 $103 /GSF ($2) (2.0%)Per Net Building Square Foot $133 $130 /NSF ($3) (2.0%)
Without Predevelopment SavingsResidual Land Value $6,339,100 $6,211,500 ($127,600) (2.0%)Per Gross Building Square Foot $105 $103 /GSF ($2) (2.0%)Per Net Building Square Foot $133 $130 /NSF ($3) (2.0%)
Note: Key numbers rounded to nearest $100. Development Impact Fees/ Other Costs include all applicable impact fees (including TIDF or TSF), plus any upfront developer payment for TDR purchase and Mello Roos special tax.
6: East SoMa Medium Res. Mixed-use
Appendix Tables B | Page 6
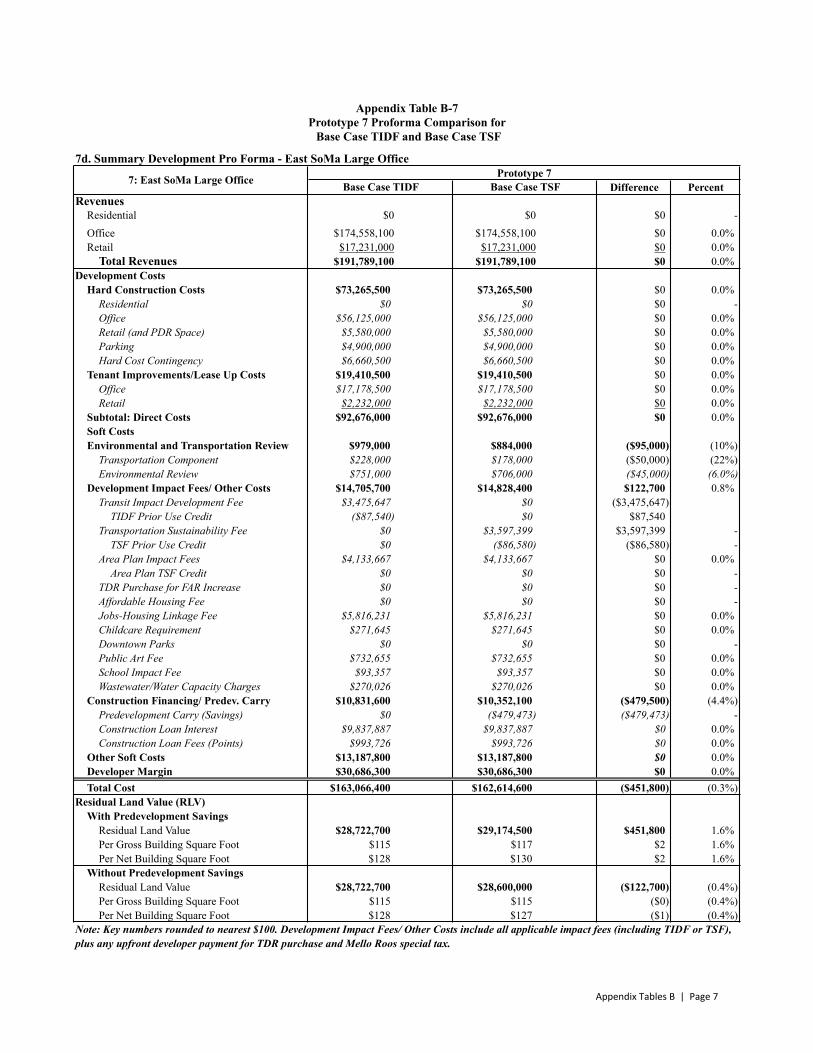
Appendix Table B-7Prototype 7 Proforma Comparison for Base Case TIDF and Base Case TSF
7d. Summary Development Pro Forma - East SoMa Large OfficePrototype 7
Base Case TIDF Base Case TSF Difference PercentRevenues
Residential $0 $0 $0 -Office $174,558,100 $174,558,100 $0 0.0%Retail $17,231,000 $17,231,000 $0 0.0% Total Revenues $191,789,100 $191,789,100 $0 0.0%
Development CostsHard Construction Costs $73,265,500 $73,265,500 $0 0.0%
Residential $0 $0 $0 -Office $56,125,000 $56,125,000 $0 0.0%Retail (and PDR Space) $5,580,000 $5,580,000 $0 0.0%Parking $4,900,000 $4,900,000 $0 0.0%Hard Cost Contingency $6,660,500 $6,660,500 $0 0.0%
Tenant Improvements/Lease Up Costs $19,410,500 $19,410,500 $0 0.0%Office $17,178,500 $17,178,500 $0 0.0%Retail $2,232,000 $2,232,000 $0 0.0%
Subtotal: Direct Costs $92,676,000 $92,676,000 $0 0.0%Soft CostsEnvironmental and Transportation Review $979,000 $884,000 ($95,000) (10%)
Transportation Component $228,000 $178,000 ($50,000) (22%)Environmental Review $751,000 $706,000 ($45,000) (6.0%)
Development Impact Fees/ Other Costs $14,705,700 $14,828,400 $122,700 0.8%Transit Impact Development Fee $3,475,647 $0 ($3,475,647)
TIDF Prior Use Credit ($87,540) $0 $87,540Transportation Sustainability Fee $0 $3,597,399 $3,597,399 -
TSF Prior Use Credit $0 ($86,580) ($86,580) -Area Plan Impact Fees $4,133,667 $4,133,667 $0 0.0%
Area Plan TSF Credit $0 $0 $0 -TDR Purchase for FAR Increase $0 $0 $0 -Affordable Housing Fee $0 $0 $0 -Jobs-Housing Linkage Fee $5,816,231 $5,816,231 $0 0.0%Childcare Requirement $271,645 $271,645 $0 0.0%Downtown Parks $0 $0 $0 -Public Art Fee $732,655 $732,655 $0 0.0%School Impact Fee $93,357 $93,357 $0 0.0%Wastewater/Water Capacity Charges $270,026 $270,026 $0 0.0%
Construction Financing/ Predev. Carry $10,831,600 $10,352,100 ($479,500) (4.4%)Predevelopment Carry (Savings) $0 ($479,473) ($479,473) -Construction Loan Interest $9,837,887 $9,837,887 $0 0.0%Construction Loan Fees (Points) $993,726 $993,726 $0 0.0%
Other Soft Costs $13,187,800 $13,187,800 $0 0.0%Developer Margin $30,686,300 $30,686,300 $0 0.0%Total Cost $163,066,400 $162,614,600 ($451,800) (0.3%)
Residual Land Value (RLV)With Predevelopment Savings
Residual Land Value $28,722,700 $29,174,500 $451,800 1.6%Per Gross Building Square Foot $115 $117 $2 1.6%Per Net Building Square Foot $128 $130 $2 1.6%
Without Predevelopment SavingsResidual Land Value $28,722,700 $28,600,000 ($122,700) (0.4%)Per Gross Building Square Foot $115 $115 ($0) (0.4%)Per Net Building Square Foot $128 $127 ($1) (0.4%)
Note: Key numbers rounded to nearest $100. Development Impact Fees/ Other Costs include all applicable impact fees (including TIDF or TSF), plus any upfront developer payment for TDR purchase and Mello Roos special tax.
7: East SoMa Large Office
Appendix Tables B | Page 7

Appendix Table B-8Prototype 8 Proforma Comparison for Base Case TIDF and Base Case TSF
8d. Summary Development Pro Forma - East SoMa Large ResidentialPrototype 8
Base Case TIDF Base Case TSF Difference PercentRevenues
Residential $127,277,500 $127,277,500 $0 0.0%Office $0 $0 $0 -Retail $5,162,500 $5,162,500 $0 0.0% Total Revenues $132,440,000 $132,440,000 $0 0.0%
Development Cost $0 -Hard Construction Costs $60,567,200 $60,567,200 $0 0.0%
Residential $48,243,200 $48,243,200 $0 0.0%Office $0 $0 $0 -Retail $1,687,500 $1,687,500 $0 0.0%Parking $5,130,400 $5,130,400 $0 0.0%Hard Cost Contingency $5,506,110 $5,506,110 $0 0.0%
Tenant Improvements/Lease Up Costs $675,000 $675,000 $0 0.0%Office $0 $0 $0 -Retail $675,000 $675,000 $0 0.0%
Subtotal: Direct Costs $61,242,200 $61,242,200 $0 0.0%Soft CostsEnvironmental and Transportation Review $144,000 $119,000 ($25,000) (17%)
Transportation Component $128,000 $103,000 ($25,000) (20%)Environmental Review $16,000 $16,000 $0 0.0%
Development Impact Fees/ Other Costs $3,917,200 $4,556,400 $639,200 16%Transit Impact Development Fee $109,425 $0 ($109,425) (100%)
TIDF Prior Use Credit $0 $0 $0 -Transportation Sustainability Fee $0 $1,041,429 $1,041,429 -
TSF Prior Use Credit $0 $0 $0 -Area Plan Impact Fees $3,055,184 $3,055,189 $5 0.0%
Area Plan TSF Credit $0 ($292,776) ($292,776) -TDR Purchase for FAR Increase $0 $0 $0 -Affordable Housing Fee $0 $0 $0 -Jobs-Housing Linkage Fee $0 $0 $0 -Childcare Requirement $0 $0 $0 -Downtown Parks $0 $0 $0 -Public Art Fee $0 $0 $0 -School Impact Fee $440,534 $440,534 $0 0.0%Wastewater/Water Capacity Charges $312,023 $312,023 $0 0.0%
Construction Financing/ Predev. Carry $9,179,700 $8,848,600 ($331,100) (3.6%)Predevelopment Carry (Savings) $0 ($331,100) ($331,100) -Construction Loan Interest $8,478,963 $8,478,963 $0 0.0%Construction Loan Fees (Points) $700,741 $700,741 $0 0.0%
Other Soft Costs $15,141,800 $15,141,800 $0 0.0%Developer Margin $29,136,800 $29,136,800 $0 0.0%Total Cost 118,761,700 119,044,800 $283,100 0.2%
Residual Land Value (RLV)With Predevelopment Savings
Residual Land Value $13,678,300 $13,395,200 ($283,100) (2.1%)Per Gross Building Square Foot $86 $85 /GSF ($2) (2.1%)Per Net Building Square Foot $108 $106 /NSF ($2) (2.1%)
Without Predevelopment SavingsResidual Land Value $13,678,300 $13,039,100 ($639,200) (4.7%)Per Gross Building Square Foot $86 $82 /GSF ($4) (4.7%)Per Net Building Square Foot $108 $103 /NSF ($5) (4.7%)
Note: Key numbers rounded to nearest $100. Development Impact Fees/ Other Costs include all applicable impact fees (including TIDF or TSF), plus any upfront developer payment for TDR purchase and Mello Roos special tax.
8: East SoMa Large Res. Mixed-use
Appendix Tables B | Page 8
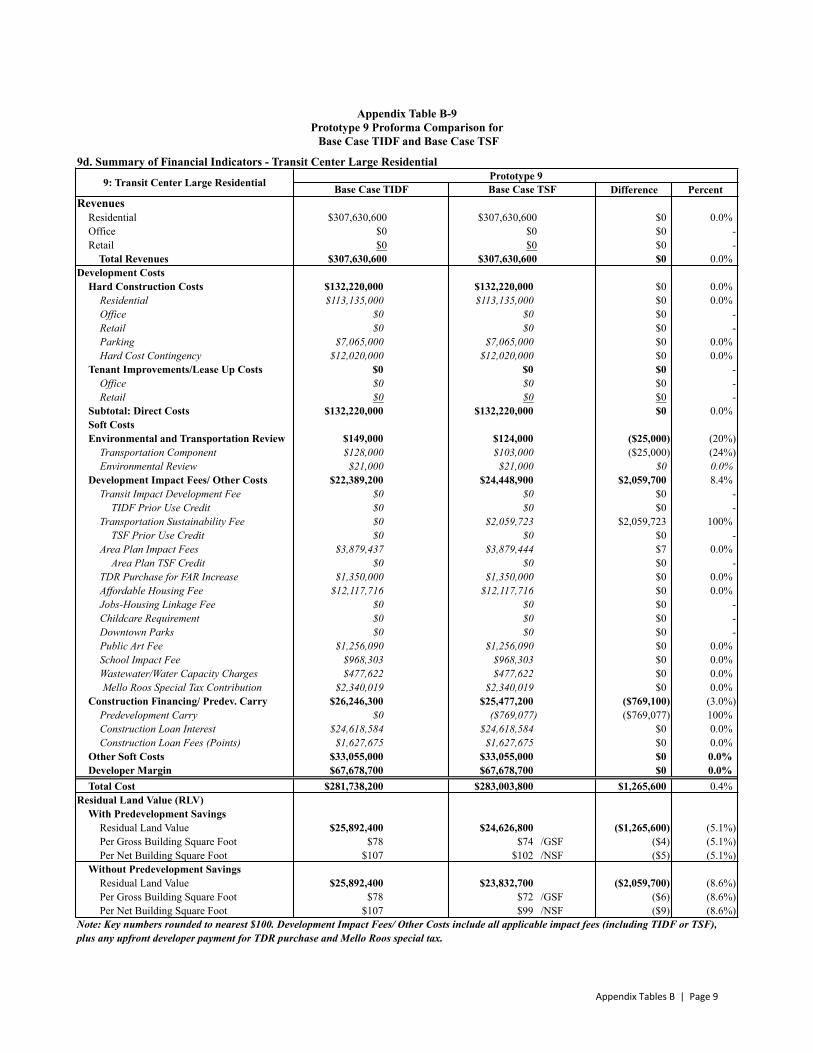
Appendix Table B-9Prototype 9 Proforma Comparison for Base Case TIDF and Base Case TSF
9d. Summary of Financial Indicators - Transit Center Large ResidentialPrototype 9
Base Case TIDF Base Case TSF Difference PercentRevenues
Residential $307,630,600 $307,630,600 $0 0.0%Office $0 $0 $0 -Retail $0 $0 $0 - Total Revenues $307,630,600 $307,630,600 $0 0.0%
Development CostsHard Construction Costs $132,220,000 $132,220,000 $0 0.0%
Residential $113,135,000 $113,135,000 $0 0.0%Office $0 $0 $0 -Retail $0 $0 $0 -Parking $7,065,000 $7,065,000 $0 0.0%Hard Cost Contingency $12,020,000 $12,020,000 $0 0.0%
Tenant Improvements/Lease Up Costs $0 $0 $0 -Office $0 $0 $0 -Retail $0 $0 $0 -
Subtotal: Direct Costs $132,220,000 $132,220,000 $0 0.0%Soft CostsEnvironmental and Transportation Review $149,000 $124,000 ($25,000) (20%)
Transportation Component $128,000 $103,000 ($25,000) (24%)Environmental Review $21,000 $21,000 $0 0.0%
Development Impact Fees/ Other Costs $22,389,200 $24,448,900 $2,059,700 8.4%Transit Impact Development Fee $0 $0 $0 -
TIDF Prior Use Credit $0 $0 $0 -Transportation Sustainability Fee $0 $2,059,723 $2,059,723 100%
TSF Prior Use Credit $0 $0 $0 -Area Plan Impact Fees $3,879,437 $3,879,444 $7 0.0%
Area Plan TSF Credit $0 $0 $0 -TDR Purchase for FAR Increase $1,350,000 $1,350,000 $0 0.0%Affordable Housing Fee $12,117,716 $12,117,716 $0 0.0%Jobs-Housing Linkage Fee $0 $0 $0 -Childcare Requirement $0 $0 $0 -Downtown Parks $0 $0 $0 -Public Art Fee $1,256,090 $1,256,090 $0 0.0%School Impact Fee $968,303 $968,303 $0 0.0%Wastewater/Water Capacity Charges $477,622 $477,622 $0 0.0% Mello Roos Special Tax Contribution $2,340,019 $2,340,019 $0 0.0%
Construction Financing/ Predev. Carry $26,246,300 $25,477,200 ($769,100) (3.0%)Predevelopment Carry $0 ($769,077) ($769,077) 100%Construction Loan Interest $24,618,584 $24,618,584 $0 0.0%Construction Loan Fees (Points) $1,627,675 $1,627,675 $0 0.0%
Other Soft Costs $33,055,000 $33,055,000 $0 0.0%Developer Margin $67,678,700 $67,678,700 $0 0.0%Total Cost $281,738,200 $283,003,800 $1,265,600 0.4%
Residual Land Value (RLV)With Predevelopment Savings
Residual Land Value $25,892,400 $24,626,800 ($1,265,600) (5.1%)Per Gross Building Square Foot $78 $74 /GSF ($4) (5.1%)Per Net Building Square Foot $107 $102 /NSF ($5) (5.1%)
Without Predevelopment SavingsResidual Land Value $25,892,400 $23,832,700 ($2,059,700) (8.6%)Per Gross Building Square Foot $78 $72 /GSF ($6) (8.6%)Per Net Building Square Foot $107 $99 /NSF ($9) (8.6%)
Note: Key numbers rounded to nearest $100. Development Impact Fees/ Other Costs include all applicable impact fees (including TIDF or TSF), plus any upfront developer payment for TDR purchase and Mello Roos special tax.
9: Transit Center Large Residential
Appendix Tables B | Page 9
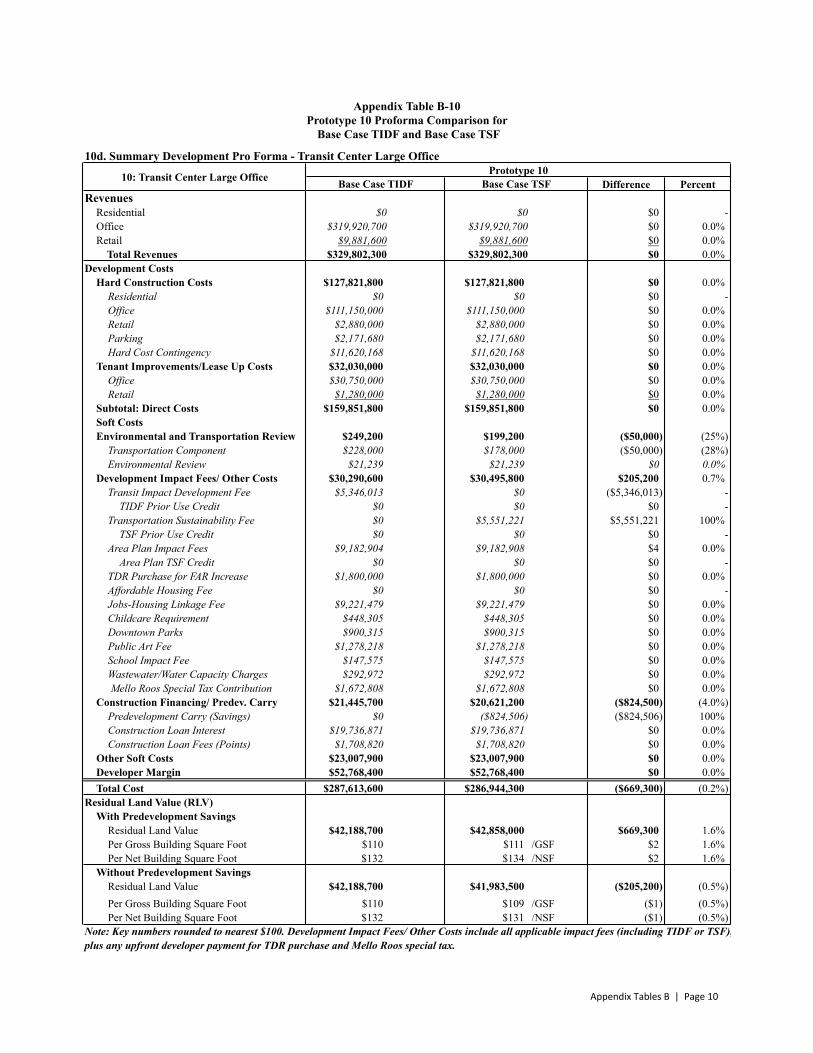
Appendix Table B-10Prototype 10 Proforma Comparison for
Base Case TIDF and Base Case TSF
10d. Summary Development Pro Forma - Transit Center Large OfficePrototype 10
Base Case TIDF Base Case TSF Difference PercentRevenues
Residential $0 $0 $0 -Office $319,920,700 $319,920,700 $0 0.0%Retail $9,881,600 $9,881,600 $0 0.0% Total Revenues $329,802,300 $329,802,300 $0 0.0%
Development CostsHard Construction Costs $127,821,800 $127,821,800 $0 0.0%
Residential $0 $0 $0 -Office $111,150,000 $111,150,000 $0 0.0%Retail $2,880,000 $2,880,000 $0 0.0%Parking $2,171,680 $2,171,680 $0 0.0%Hard Cost Contingency $11,620,168 $11,620,168 $0 0.0%
Tenant Improvements/Lease Up Costs $32,030,000 $32,030,000 $0 0.0%Office $30,750,000 $30,750,000 $0 0.0%Retail $1,280,000 $1,280,000 $0 0.0%
Subtotal: Direct Costs $159,851,800 $159,851,800 $0 0.0%Soft CostsEnvironmental and Transportation Review $249,200 $199,200 ($50,000) (25%)
Transportation Component $228,000 $178,000 ($50,000) (28%)Environmental Review $21,239 $21,239 $0 0.0%
Development Impact Fees/ Other Costs $30,290,600 $30,495,800 $205,200 0.7%Transit Impact Development Fee $5,346,013 $0 ($5,346,013) -
TIDF Prior Use Credit $0 $0 $0 -Transportation Sustainability Fee $0 $5,551,221 $5,551,221 100%
TSF Prior Use Credit $0 $0 $0 -Area Plan Impact Fees $9,182,904 $9,182,908 $4 0.0%
Area Plan TSF Credit $0 $0 $0 -TDR Purchase for FAR Increase $1,800,000 $1,800,000 $0 0.0%Affordable Housing Fee $0 $0 $0 -Jobs-Housing Linkage Fee $9,221,479 $9,221,479 $0 0.0%Childcare Requirement $448,305 $448,305 $0 0.0%Downtown Parks $900,315 $900,315 $0 0.0%Public Art Fee $1,278,218 $1,278,218 $0 0.0%School Impact Fee $147,575 $147,575 $0 0.0%Wastewater/Water Capacity Charges $292,972 $292,972 $0 0.0% Mello Roos Special Tax Contribution $1,672,808 $1,672,808 $0 0.0%
Construction Financing/ Predev. Carry $21,445,700 $20,621,200 ($824,500) (4.0%)Predevelopment Carry (Savings) $0 ($824,506) ($824,506) 100%Construction Loan Interest $19,736,871 $19,736,871 $0 0.0%Construction Loan Fees (Points) $1,708,820 $1,708,820 $0 0.0%
Other Soft Costs $23,007,900 $23,007,900 $0 0.0%Developer Margin $52,768,400 $52,768,400 $0 0.0%Total Cost $287,613,600 $286,944,300 ($669,300) (0.2%)
Residual Land Value (RLV)With Predevelopment Savings
Residual Land Value $42,188,700 $42,858,000 $669,300 1.6%Per Gross Building Square Foot $110 $111 /GSF $2 1.6%Per Net Building Square Foot $132 $134 /NSF $2 1.6%
Without Predevelopment SavingsResidual Land Value $42,188,700 $41,983,500 ($205,200) (0.5%)Per Gross Building Square Foot $110 $109 /GSF ($1) (0.5%)Per Net Building Square Foot $132 $131 /NSF ($1) (0.5%)
Note: Key numbers rounded to nearest $100. Development Impact Fees/ Other Costs include all applicable impact fees (including TIDF or TSF), plus any upfront developer payment for TDR purchase and Mello Roos special tax.
10: Transit Center Large Office
Appendix Tables B | Page 10
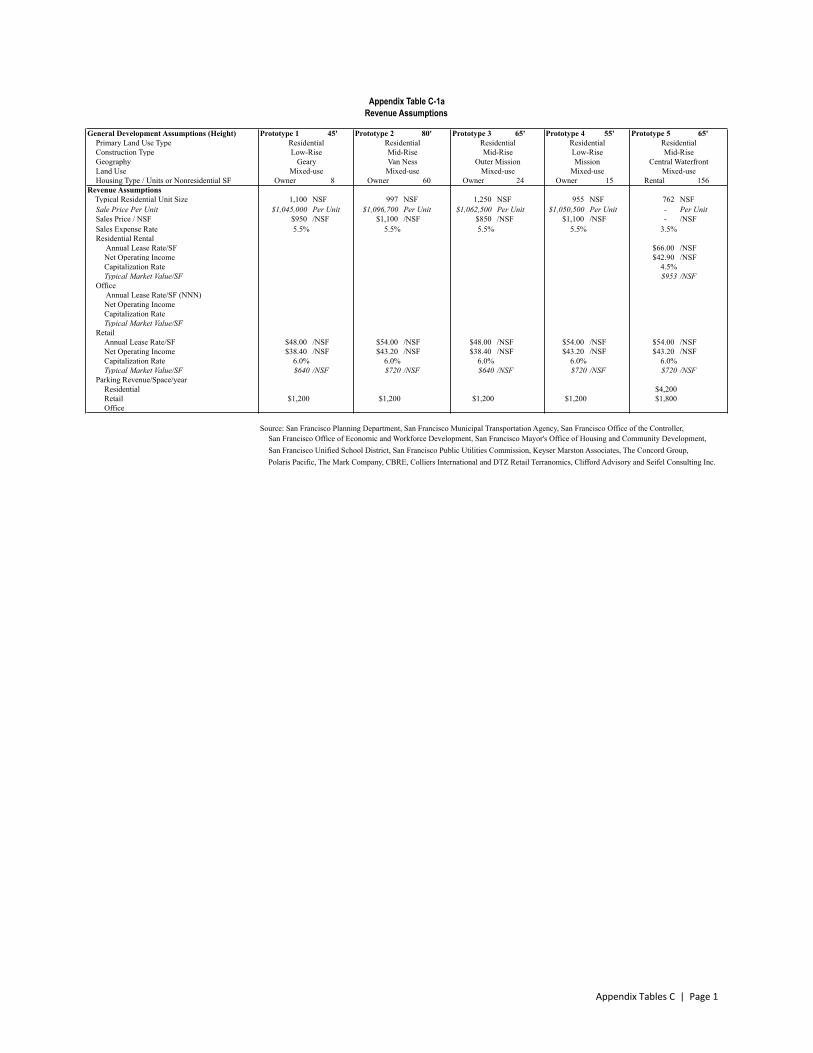
Appendix Table C-�a Appendix T able C-2x����������5HYHQXH Assumptions Development Assumptions
General Development Assumptions (Height) Prototype 1 45' Prototype 2 80' Prototype 3 65' Prototype 4 55' Prototype 5 65'Primary Land Use Type Residential Residential Residential Residential Residential ResidentialConstruction Type Low-Rise Mid-Rise Mid-Rise Low-Rise Mid-Rise Mid-RiseGeographyLand Use Housing Type / Units or Nonresidential SF Owner 8 Owner 60 Owner 24 Owner 15 Rental 156
Mixed-use Mixed-use Mixed-use Mixed-use Mixed-useGeary MissionOuter MissionVan Ness Central Waterfront
Revenue Assumptions Typical Residential Unit Size 1,100 NSF 997 NSF 1,250 NSF 955 NSF 762 NSF
Sale Price Per Unit $1,045,000 Per Unit $1,096,700 Per Unit $1,062,500 Per Unit $1,050,500 Per Unit - Per UnitSales Price / NSF $950 /NSF $1,100 /NSF $850 /NSF $1,100 /NSF - /NSFSales Expense Rate 5.5% 5.5% 5.5% 5.5% 3.5%Residential Rental
Annual Lease Rate/SF - /NSF - /NSF - /NSF - /NSF $66.00 /NSFNet Operating Income $42.90 /NSFCapitalization Rate 4.5% 4.5% 4.5% 4.5% 4.5%Typical Market Value/SF $0 /NSF $910 /NSF $0 /NSF $0 /NSF $953 /NSF
Office Annual Lease Rate/SF (NNN) - /NSF - /NSF - /NSF - /NSF - /NSFNet Operating IncomeCapitalization Rate 5.0% 5.0% 5.0% 5.0% 5.0%Typical Market Value/SF - /NSF - /NSF - /NSF - /NSF - /NSF
RetailAnnual Lease Rate/SF $48.00 /NSF $54.00 /NSF $48.00 /NSF $54.00 /NSF $54.00 /NSFNet Operating Income $38.40 /NSF $43.20 /NSF $38.40 /NSF $43.20 /NSF $43.20 /NSFCapitalization Rate 6.0% 6.0% 6.0% 6.0% 6.0%Typical Market Value/SF $640 /NSF $720 /NSF $640 /NSF $720 /NSF $720 /NSF
Parking Revenue/Space/yearResidential $4,200Retail $1,200 $1,200 $1,200 $1,200 $1,800Office $4,800 $4,800 $4,800 $4,800 $4,800
Source: San Francisco Planning Department, San Francisco Municipal Transportation Agency, San Francisco Office of the Controller, San Francisco Office of Economic and Workforce Development, San Francisco Mayor's Office of Housing and Community Development,San Francisco Unified School District, San Francisco Public Utilities Commission, Keyser Marston Associates, The Concord Group,Polaris Pacific, The Mark Company, CBRE, Colliers International and DTZ Retail Terranomics, Clifford Advisory and Seifel Consulting Inc.
Appendix Tables C | Page 1
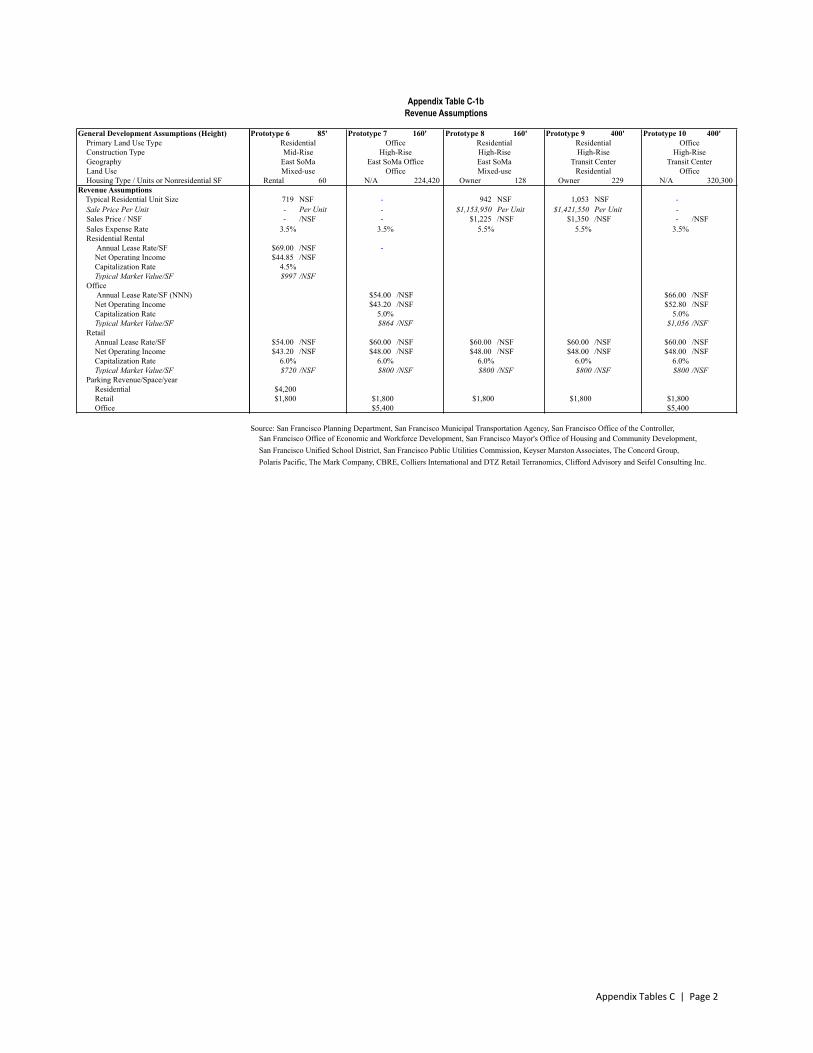
Appendix Table C2-aDevelopment Cost Assumptions
General Development Assumptions (Height)Primary Land Use TypeConstruction TypeGeographyLand Use Housing Type / Units or Nonresidential SF
Revenue Assumptions Typical Residential Unit Size
Sale Price Per UnitSales Price / NSFSales Expense RateResidential Rental
Annual Lease Rate/SFNet Operating IncomeCapitalization RateTypical Market Value/SF
Office Annual Lease Rate/SF (NNN)Net Operating IncomeCapitalization RateTypical Market Value/SF
RetailAnnual Lease Rate/SFNet Operating IncomeCapitalization RateTypical Market Value/SF
Parking Revenue/Space/yearResidentialRetailOffice
Appendix Table C��E����5HYHQXH Assumptions Development Assumptions
Prototype 6 85' Prototype 7 160' Prototype 8 160' Prototype 9 400' Prototype 10 400'Residential Office Residential ResidentialMid-Rise High-Rise High-Rise High-Rise
Rental 60 N/A 224,420 Owner 128 Owner 229 N/A 320,300 Mixed-use Office Mixed-use Residential Office
East SoMa Office East SoMa Transit Center Transit CenterEast SoMa
OfficeHigh-Rise
719 NSF - 942 NSF 1,053 NSF - - Per Unit - $1,153,950 Per Unit $1,421,550 Per Unit - - /NSF - $1,225 /NSF $1,350 /NSF - /NSF
3.5% 3.5% 5.5% 5.5% 3.5%
$69.00 /NSF - /NSF - /NSF - /NSF - /NSF$44.85 /NSF
4.5% 5.0% 4.5% 4.5% 5.0%$997 /NSF $868 /NSF $868 /NSF $0 /NSF $0 /NSF
- /NSF $54.00 /NSF - /NSF - /NSF $66.00 /NSF$43.20 /NSF $52.80 /NSF
5.0% 5.0% 5.0% 5.0% 5.0%- /NSF $864 /NSF - /NSF - /NSF $1,056 /NSF
$54.00 /NSF $60.00 /NSF $60.00 /NSF $60.00 /NSF $60.00 /NSF$43.20 /NSF $48.00 /NSF $48.00 /NSF $48.00 /NSF $48.00 /NSF
6.0% 6.0% 6.0% 6.0% 6.0%$720 /NSF $800 /NSF $800 /NSF $800 /NSF $800 /NSF
$4,200 $4,200 $4,200$1,800 $1,800 $1,800 $1,800 $1,800$4,800 $5,400 $5,400 $5,400 $5,400
Source: San Francisco Planning Department, San Francisco Municipal Transportation Agency, San Francisco Office of the Controller, San Francisco Office of Economic and Workforce Development, San Francisco Mayor's Office of Housing and Community Development,San Francisco Unified School District, San Francisco Public Utilities Commission, Keyser Marston Associates, The Concord Group,Polaris Pacific, The Mark Company, CBRE, Colliers International and DTZ Retail Terranomics, Clifford Advisory and Seifel Consulting Inc.
Appendix Tables C | Page 2

Appendix Table &�2a Appendix Table C-2xDevelopment Cost Assumptions Development Assumptions
General Development Assumptions (Height) Prototype 1 45' Prototype 2 80' Prototype 3 65' Prototype 4 55' Prototype 5 65'Primary Land Use Type Residential Residential Residential Residential Residential ResidentialConstruction Type Low-Rise Mid-Rise Mid-Rise Low-Rise Mid-Rise Mid-RiseGeographyLand Use Housing Type / Units or Nonresidential SF Owner 8 Owner 60 Owner 24 Owner 15 Rental 156
Development CostsHard Construction Costs
Residential $240 $300 $270 $260 $270Office $240 /GSF $240 /GSF $240 /GSF $240 /GSF $240 /GSFRetail $225 /GSF $225 /GSF $225 /GSF $225 /GSF $225 /GSFParking $120 /GSF $140 /GSF $120 /GSF $120 /GSF $140 /GSF
Stacker cost $15,000 /space $15,000 /space $15,000 /space $15,000 /space $15,000 /spaceParking Construction Type Podium (1) Underground (1) Podium (1) Podium (1) Underground (1)
Hard Construction Costs/ GSF $293 /GSF $362 /GSF $325 /GSF $297 /GSF $330 /GSFOffice Tenant Improvements/Lease Up Costs $85 /LSF $85 /LSF $85 /LSF $85 /LSF $85 /LSFRetail Tenant Improvements/Lease Up Costs $100 /LSF $100 /LSF $100 /LSF $100 /LSF $100 /LSFDirect Construction Costs/ NSF $384 /NSF $472 /NSF $422 /NSF $413 /NSF $417 /NSFDirect Construction Costs/ Unit $491,550 /Unit $533,755 /Unit $578,417 /Unit $440,967 /Unit $329,803 /UnitSoft Costs
Transportation and Environmental ReviewTransportation Review $0 sum $27,859 sum $0 sum $0 sum $27,859 sum
SF Planning $0 Value $23,365 Value $0 Value $0 Value $23,365 ValueSFMTA $0 Value $4,494 Value $0 Value $0 Value $4,494 Value
Transp. Consultant $0 Value $0 Value $0 Value $0 Value $100,000 ValueTSP Cost Savings $0 Value $0 Value $0 Value $0 Value $25,000 Value
Environmental Review $9,295 sum $84,855 sum $27,347 sum $11,466 sum $791,626 sumSF Planning $9,295 Value $84,855 Value $27,347 Value $11,466 Value $405,346 Value
TSP Cost Savings $0 Value $0 Value $0 Value $0 Value $386,280 ValueCEQA Consultant $0 Value $75,000 Value $0 Value $0 Value $150,000 Value
TSP Cost Savings $0 Value $0 Value $0 Value $0 Value $150,000 ValueDevelopment Impact Fees/ Other Costs
Transit Impact Development Fee Residential $0.0 /GSF $0.0 /GSF $0.0 /GSF $0.0 /GSF $0.0 /GSF Office $13.87 /GSF $13.87 /GSF $13.87 /GSF $13.87 /GSF $13.87 /GSF Retail $14.59 /GSF $14.59 /GSF $14.59 /GSF $14.59 /GSF $14.59 /GSFTransportation Sustainability Fee Residential $6.19 /GSF $6.19 /GSF $6.19 /GSF $6.19 /GSF $6.19 /GSF Non-Residential (Office) $14.43 /GSF $14.43 /GSF $14.43 /GSF $14.43 /GSF $14.43 /GSF Non-Residential (Retail) $14.43 /GSF $14.43 /GSF $14.43 /GSF $14.43 /GSF $14.43 /GSFArea Plan Impact Fees $0 Value $0 Value $0 Value $160,968 Value $1,682,573 ValueTDR Purchase for FARAffordable Housing Fee $0.0 Value $0 Value $0.0 Value $0.0 Value $0 ValueJobs-Housing Linkage Fee
Office $0.00 /GSF $0.00 /GSF $0.00 /GSF $0.00 /GSF $0.00 /GSFRetail $0.00 /GSF $0.00 /GSF $0.00 /GSF $0.00 /GSF $0.00 /GSF
Childcare Fee (Office) $0.0 /Office GSF $0.00 /Office GSF $0.0 /Office GSF $0.0 /Office GSF $0.00 /Office GSFDowntown Parks Fee (Office) $0.0 /Office GSF $0.00 /Office GSF $0.0 /Office GSF $0.0 /Office GSF $0.00 /Office GSFPublic Art Fee (Non-Residential) 0% of Hard costs $0.00 of Hard costs 0% of Hard costs 0% of Hard costs 0% of Hard costsSchool Impact Fee Residential $2.91 /GSF $2.91 /GSF $2.91 /GSF $2.91 /GSF $2.91 /GSF Office $0.389 /GSF $0.389 /GSF $0.389 /GSF $0.389 /GSF $0.389 /GSF Retail $0.243 /GSF $0.243 /GSF $0.243 /GSF $0.243 /GSF $0.243 /GSFWastewater/Water Capacity Charges
Total Charges $12,367 Value $180,298 Value $87,598 Value $33,099 Value $298,371 ValueMello Roos Special Tax During Sale/Lease-Up $0 /GSF $0 /GSF $0 /GSF $0 /GSF $0 /GSF
Construction FinancingConstruction Timing 24 Months 31 Months 30 Months 26 Months 26 MonthsConstruction Interest Rate 5.5% 5.5% 5.5% 5.5% 5.5%Loan Fee (Points) as a % of Loan Amount 1.25% 1.25% 1.25% 1.25% 1.00%
Other Soft Costs (as a % of Hard Costs) 25% 25% 25% 25% 18%Target Return on Total Development Cost 19% 23% 21% 19% 21%Developer Margin (as a % of Value/Net Proceeds) 16% 19% 17% 16% 17%
Mixed-use Mixed-use Mixed-use Mixed-use Mixed-useGeary MissionOuter MissionVan Ness Central Waterfront
Appendix Tables C | Page 3
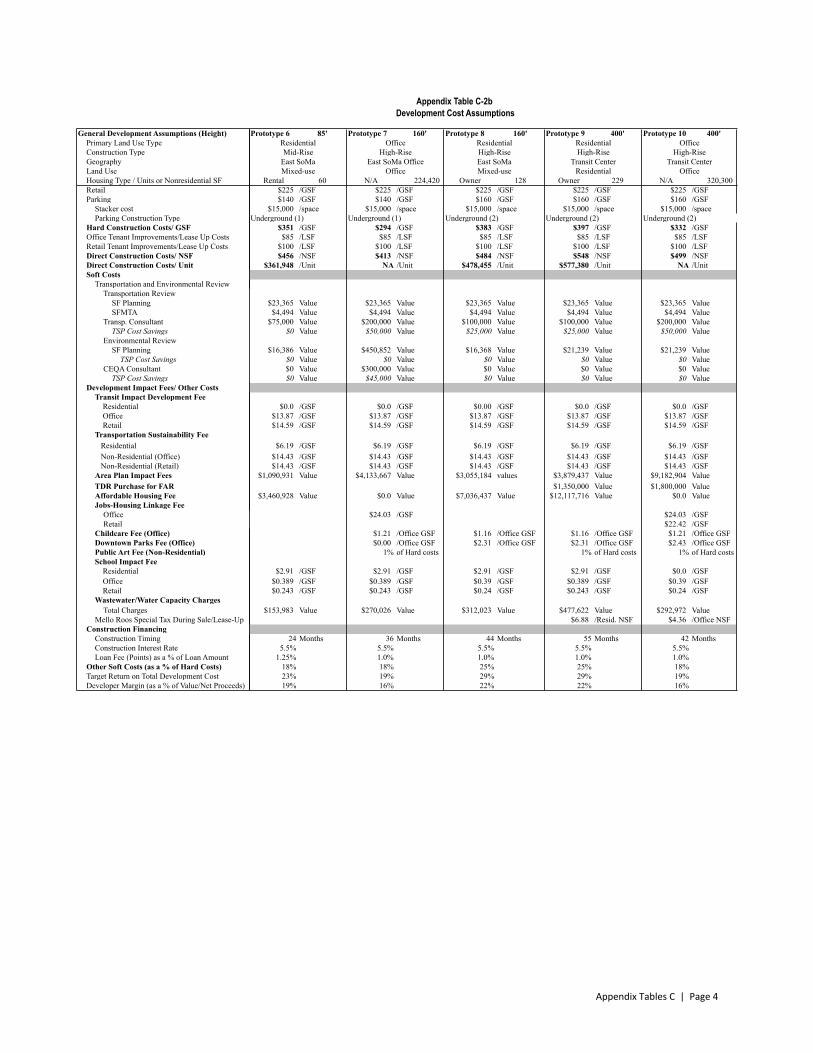
Appendix Table C2-aDevelopment Cost Assumptions
General Development Assumptions (Height)Primary Land Use TypeConstruction TypeGeographyLand Use Housing Type / Units or Nonresidential SFRetailParking
Stacker costParking Construction Type
Hard Construction Costs/ GSFOffice Tenant Improvements/Lease Up CostsRetail Tenant Improvements/Lease Up CostsDirect Construction Costs/ NSFDirect Construction Costs/ UnitSoft Costs
Transportation and Environmental ReviewTransportation Review
SF PlanningSFMTA
Transp. ConsultantTSP Cost Savings
Environmental Review SF Planning
TSP Cost SavingsCEQA Consultant
TSP Cost SavingsDevelopment Impact Fees/ Other Costs
Transit Impact Development Fee Residential Office RetailTransportation Sustainability Fee Residential Non-Residential (Office) Non-Residential (Retail)Area Plan Impact FeesTDR Purchase for FARAffordable Housing FeeJobs-Housing Linkage Fee
OfficeRetail
Childcare Fee (Office)Downtown Parks Fee (Office)Public Art Fee (Non-Residential)School Impact Fee Residential Office RetailWastewater/Water Capacity Charges
Total ChargesMello Roos Special Tax During Sale/Lease-Up
Construction FinancingConstruction TimingConstruction Interest RateLoan Fee (Points) as a % of Loan Amount
Other Soft Costs (as a % of Hard Costs)Target Return on Total Development CostDeveloper Margin (as a % of Value/Net Proceeds)
����Appendix Table &-2EDevelopment &RVW�Assumptions Development Assumptions
Prototype 6 85' Prototype 7 160' Prototype 8 160' Prototype 9 400' Prototype 10 400'Residential Office Residential ResidentialMid-Rise High-Rise High-Rise High-Rise
Rental 60 N/A 224,420 Owner 128 Owner 229 N/A 320,300 Mixed-use Office Mixed-use Residential Office
East SoMa Office East SoMa Transit Center Transit CenterEast SoMa
OfficeHigh-Rise
$225 /GSF $225 /GSF $225 /GSF $225 /GSF $225 /GSF$140 /GSF $140 /GSF $160 /GSF $160 /GSF $160 /GSF
$15,000 /space $15,000 /space $15,000 /space $15,000 /space $15,000 /spaceUnderground (1) Underground (1) Underground (2) Underground (2) Underground (2)
$351 /GSF $294 /GSF $383 /GSF $397 /GSF $332 /GSF$85 /LSF $85 /LSF $85 /LSF $85 /LSF $85 /LSF
$100 /LSF $100 /LSF $100 /LSF $100 /LSF $100 /LSF$456 /NSF $413 /NSF $484 /NSF $548 /NSF $499 /NSF
$361,948 /Unit NA /Unit $478,455 /Unit $577,380 /Unit NA /Unit
$27,859 sum $27,859 sum $27,859 sum $27,859 sum $27,859 sum$23,365 Value $23,365 Value $23,365 Value $23,365 Value $23,365 Value$4,494 Value $4,494 Value $4,494 Value $4,494 Value $4,494 Value
$75,000 Value $200,000 Value $100,000 Value $100,000 Value $200,000 Value$0 Value $50,000 Value $25,000 Value $25,000 Value $50,000 Value
$16,386 sum $450,852 sum $16,368 sum $21,239 sum $21,239 sum$16,386 Value $450,852 Value $16,368 Value $21,239 Value $21,239 Value
$0 Value $0 Value $0 Value $0 Value $0 Value$0 Value $300,000 Value $0 Value $0 Value $0 Value$0 Value $45,000 Value $0 Value $0 Value $0 Value
$0.0 /GSF $0.0 /GSF $0.00 /GSF $0.0 /GSF $0.0 /GSF$13.87 /GSF $13.87 /GSF $13.87 /GSF $13.87 /GSF $13.87 /GSF$14.59 /GSF $14.59 /GSF $14.59 /GSF $14.59 /GSF $14.59 /GSF
$6.19 /GSF $6.19 /GSF $6.19 /GSF $6.19 /GSF $6.19 /GSF$14.43 /GSF $14.43 /GSF $14.43 /GSF $14.43 /GSF $14.43 /GSF$14.43 /GSF $14.43 /GSF $14.43 /GSF $14.43 /GSF $14.43 /GSF
$1,090,931 Value $4,133,667 Value $3,055,184 values $3,879,437 Value $9,182,904 Value$1,350,000 Value $1,800,000 Value
$3,460,928 Value $0.0 Value $7,036,437 Value $12,117,716 Value $0.0 Value
$0.00 /GSF $24.03 /GSF $0.00 /GSF $0.00 /GSF $24.03 /GSF$0.00 /GSF $22.42 /GSF $0.00 /GSF $0.00 /GSF $22.42 /GSF$0.00 /Office GSF $1.21 /Office GSF $1.16 /Office GSF $1.16 /Office GSF $1.21 /Office GSF$0.0 /Office GSF $0.00 /Office GSF $2.31 /Office GSF $2.31 /Office GSF $2.43 /Office GSF
0% of Hard costs 1% of Hard costs 0% of Hard costs 1% of Hard costs 1% of Hard costs
$2.91 /GSF $2.91 /GSF $2.91 /GSF $2.91 /GSF $0.0 /GSF$0.389 /GSF $0.389 /GSF $0.39 /GSF $0.389 /GSF $0.39 /GSF$0.243 /GSF $0.243 /GSF $0.24 /GSF $0.243 /GSF $0.24 /GSF
$153,983 Value $270,026 Value $312,023 Value $477,622 Value $292,972 Value4.50$ Res/GSF 4.00$ Res/GSF 5.00$ Res/GSF $6.88 /Resid. NSF $4.36 /Office NSF
24 Months 36 Months 44 Months 55 Months 42 Months5.5% 5.5% 5.5% 5.5% 5.5%
1.25% 1.0% 1.0% 1.0% 1.0%18% 18% 25% 25% 18%23% 19% 29% 29% 19%19% 16% 22% 22% 16%
Appendix Tables C | Page 4