Embed Size (px)
Citation preview
Sampling
By the end of this session the students should be able to
a) Define sampling
b) Know different types of sampling in qualitative and quantitative studies
c) Know the different sampling techniques
d) Calculate sample size
e) Know about sampling errors, and various ethical issues

A sample is a subset of a population

What is Sampling
Sampling is the process of selecting a number of study units from a defined population
Questioned to be answered
What is the group of people ( study population, we are interested in, from which we want to draw a sample?
How many people do we need in our sample ?
How will these people be selected?

Problem Study population Study unit
Malnutrition related to weaning in district X
High drop- out rates in primary school in district Y
In appropriate record keeping of hypertensive patients registered in hospital Z
All children 6-24 months of age in district X
All primary schools in district Y
All records of hypertensive patients in hospital Z
One child between 6 and 24 months in district X
One primary school in district Y
One record of a hypertensive patient registered in hospital Z

Types of Sampling
1) Non Probability Sampling
2) Probability Sampling

Non probability sampling Done in qualitative studies
Aim is to get rough impression of how certain variables manifest themselves in a study population or identifying unknown variables
Representativeness of the sample is not a primary concern
Results cannot be applied to the whole population

Methods of non probability
sampling Purposive sampling:
Sampling is done on the basis of pre determined idea (clinical knowledge). The results of such a sample cannot be generalized e.g
extreme case sampling such as people with very good and very bad compliance or
well nourished and malnourished children of same age group
Snowball or chain sampling for locating key informants. In sociology and statistics research, snowball sampling[1] (or chain sampling, chain-referral sampling, referral sampling[2][3]) is a non-probability sampling technique where existing study subjects recruit future subjects from among their acquaintances. Thus the sample group appears to grow like a rolling snowball (similarly to breadth-first search (BFS) in computer science). As the sample builds up, enough data are gathered to be useful for research.
Homogenous sampling (people of similar social and health Issues)
Purposive sampling
• Extreme case sampling
• Snowball sampling
• Homogenous
Quota
convenience

Convenience sampling
Also known as accidental sampling. It is a method in which for convenience sake , the study units that happen to be available at the time of data collection are selected in the sample e.g
First 10 patients in the clinic
Students in the first two rows
First 6 persons coming to a shopping mall

Convenience sampling

Quota sampling
In this type of sampling, the strata or specific groups of population are identified and the researcher determines the proportion of elements needed from the various segments e.g
Fixed numbers of males and females or fixed numbers of educated and uneducated persons
Results cannot be applied to the total population
Probability Sampling
Any method of sampling that utilizes some form of random selection is known as probability sampling
It ensures that the different units in your study population have equal chance of being chosen

Sampling frame
A sampling frame is a list of members of universe or study population from which the sample may be drawn.
Accuracy and completeness of sampling frame influences the quality of the sample drawn from it.

Sampling Techniques for
probability sampling
Simple random sampling
Systematic sampling
Stratified sampling
Cluster sampling
Multi- stage sampling

Simple Random Sampling
The sampling procedure that gives every unit in the universe / study population an equal chance or opportunity of being selected e.g
Drawing lots ( lottery method) : The numbers or the names are all put in a box and the required numbers are are picked out like a lottery, as a game of chance.
Random digit tables

Simple Random Sampling

Systematic Sampling A pre determined system is followed e.g
A systematic sample consist of numbers picked at regular intervals from a random list of all eligible numbers
Have total number of unit in the population
Decide the sample size
Calculate the sampling ratio i.e 100 out of 1000=1:10, 370 out of 1600=1:4:3 round it to nearest whole number e.g 1:4
Select randomly the first unit and interview every 10th or 4th (kth)

Systematic Random Sampling

Cluster sampling
In this case , the enumeration units are not individuals, but groups or clusters such as families ,villages, schools, hospitals, wards etc are selected.
Clusters can be selected randomly
Number all the units and draw random sample or a systematic sample from selected cluster
It is done when the list of entire area is not available and for immunization coverage evaluation surveys

Stratified Sampling
It is the method of choice when the characteristics of interest is influenced by the different sections of population. E.g age , sex economic status, religeon.
The population is divided into different subgroups or strata according to their characteristics
Random or stratified sampling is then done
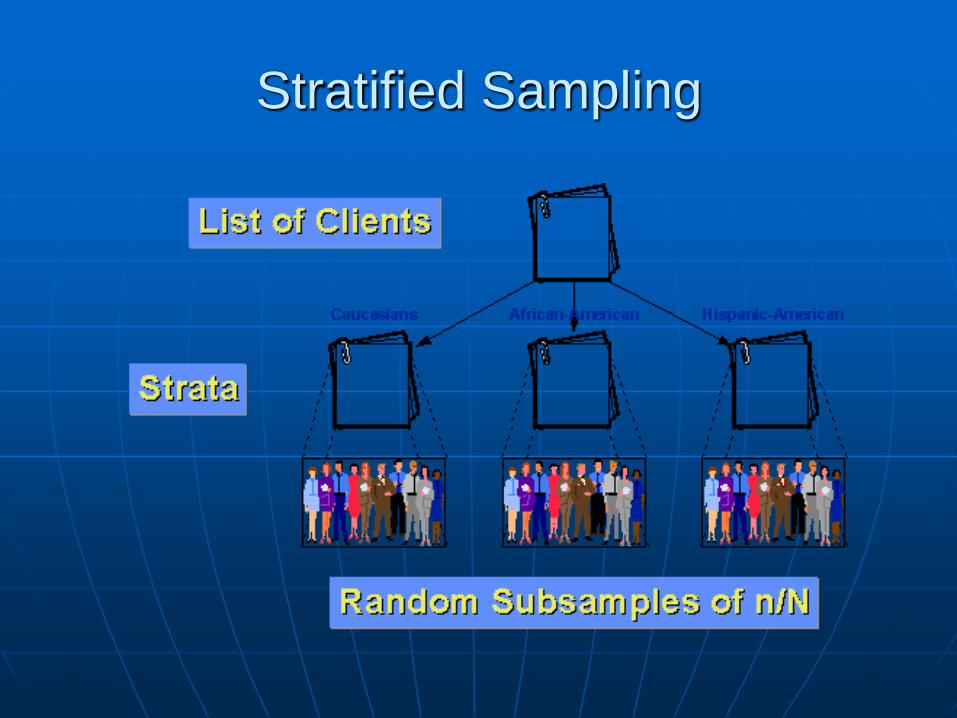
Stratified Sampling

Multistage sampling
Sampling is done in two or more stages
It is done when the population of entire district or country is to be studied e.g
There are 50 schools in the district with total enrolment of 10,000 students and we have to draw multistage sample of 200 students.
10 out of 50 schools are selected randomly
Then random selection of 4 classes from each school (40 classes)
5 students from each class (200 students)

Advantages and disadvantages of
probability and non probability
sampling
Advantages
Probability Non probability
Minimum bias Convenient
Results can be Less time
Generalized consuming
Allows for estimation Economical
of sampling error
More authentic Less skillful

Disadvantages
Probability Non probability
Expensive Results cannot be Inconvenient generalized
Time consuming Maximum bias
Problematic with Authenticity very large population debatable
Technical,skillful
Bias in Sampling Sampling bias is mostly classified as
a subtype of selection bias.
It is a systematic error in sampling procedure, which lead to distortion in the results of the study.
A sample is also biased if certain members are underrepresented or overrepresented relative to others in the population

Bias in Sampling
Bias in the sampling can be reduced by increasing the sample size.

Sampling error The variation of results of one sample
from another sample taken from same population is called the sampling error.
Whereas ,In a random sample , the sample mean is not very different from the true population mean.
However repeated samples show different results.
It occurs because data is collected from a sample and not from entire population.

Sampling Error
In random sample , the factors that contribute or influence sampling error are
a) size of sample (as the sample size increases , the
sampling error decreases)
b) the natural variability of individual reading
(as the individual readings vary from one another, we get more variability from one sample to another

Sampling error will always cause the mean of the sample to deviate from mean of population.
The greater the difference between the sample mean and the population mean specified by the null hypothesis, the less probable it is that the sample really come from the specified population

Concept of Standard Error
Frequency Distribution of different sample means drawn from the same population follows normal distribution curve.
Mean of the sample mean is practically the same as the population mean.
In other words sample means are distributed normally about the population mean.
Standard Error
The standard deviation of the means is a measure of the sampling error and is called standard error or standard error of the mean.
Formula
S.E =σ∕√ n n
95% of the sample means lie within limits of two standard error [μ±2 σ∕√n ] on either side of the true or population mean.

Ethical considerations
If the recommendations from study are to be implemented to the entire population, one has the ethical obligation to draw a representative sample
Develop definition of study population and study unit
select appropriate sampling procedure
State how will you try to avoid possible bias

Sample size calculation
Size of the sample depends upon
Prevalence of the disease or the mean magnitude of the attribute of interest
The degree of permissible error

Sample size calculation Formula
Sample Size(N)=SD2× 1-P
SE2 P
SD= 1.96 at 95% CL
SE= e.g. 7%(acceptable level of error 5%- 15%
P = e.g. 5%
1-P = 95%

Sample size calculation
Sample size(N)=1.962 × 95
0.072 5
=784x19
=14896