Embed Size (px)
Citation preview

Report No. CDOT-DTD-R-2002-12
Final Report
SAMPLING LOCATION IMPACT ON MEASURED ASPHALT CONTENT OF HOT MIX ASPHALT Mohammad Abu-Hassan University of Colorado at Denver
Final Report November 2002

Technical Report Documentation Page
1. Report No. CDOT-DTD-R-2002-12
2. Government Accession No.
3. Recipient’s Catalog No. 5. Report Date November 2002
4. Title and Subtitle SAMPLING LOCATION IMPACT ON MEASURED ASPHALT CONTENT OF HOT MIX ASPHALT
6. Performing Organization Code
7. Author(s) Mohammad Abu-Hasssan
8. Performing Organization Report No. CDOT-DTD-R-2002-12
10. Work Unit No. (TRAIS)
9. Performing Organization Name and Address Colorado Department of Transportation 4201 E. Arkansas Ave. Denver, Colorado 80222
11. Contract or Grant No.
13. Type of Report and Period Covered 12. Sponsoring Agency Name and Address Colorado Department of Transportation 4201 E. Arkansas Ave. Denver, Colorado 80222 14. Sponsoring Agency Code
15. Supplementary Notes Prepared in Cooperation with the U.S. Department of Transportation, Federal Highway Administration 16. Abstract In May 2000, CDOT requested a forensic study of a project located on I- 25 north of Denver. The request was made because, within a year of the 1997 overlay, longitudinal cracking appeared in the surface. Transverse cracks were attributed to reflective cracking. However, the longitudinal cracks appeared to be surface initiated. In October 2000, a forensic team reviewed the project and established a sampling and testing plan to take cores from the roadway. Based on data analysis of the cores, the higher than expected in-place air voids, the low effective asphalt, and segregation within the mat, all contributed to the early cracking. The forensic team suggested that CDOT investigate the sampling locations for hot mix asphalt (HMA) that are allowed by Colorado Procedure 41 to determine if all locations provide statistically equivalent asphalt contents. This study indicates that there is no statistically significant difference in asphalt content of the allowed CDOT sampling locations. This study suggests that no changes are needed to CP41 for sampling all hot mix asphalt. 17. Key Words asphalt, segregation, binder, sampling location, sample reduction, asphalt content
18. Distribution Statement No restrictions. This document available to the public through the National Technical Information Service 5285 Port Royal Road Springfield, VA, 2216.
19. Security Classif. (of this report)
20. Security Classif. (of this page)
21. No. of Pages 40
22. Price

SAMPLING LOCATION IMPACT ON MEASURED ASPHALT CONTENT OF HOT MIX ASPHALT
by
Mohammad Abu-Hassan University of Colorado at Denver
Report No. CDOT-DTD-R-2002-12
Prepared by Colorado Department of Transportation
Research Branch
Sponsored by the Colorado Department of Transportation
In Cooperation with the U.S. Department of Transportation Federal Highway Administration
November 2002
Colorado Department of Transportation Research Branch
4201 E. Arkansas Ave. Denver, CO 80222
(303) 757-9506

DISCLAIMER The content of this report reflects the views of the author, who is responsible for the facts and
accuracy of the data presented herein. The content does not necessarily reflect the official
views of the Colorado Department of Transportation or the Federal Highway Administration.
This report does not constitute a standard, specification, or regulation.

ACKNOWLEDGEMENTS
The author would like to express his gratitude to the many people who assisted in
performing this study. Thank you to Kim Gilbert (CDOT-Staff Materials) for setting up
sampling locations and dates.
Special thanks to the project managers and laborers who were very helpful with the
sampling.
The author gratefully acknowledges Naser Abu-Hejleh (CDOT-Research) who provided
numerous ideas and suggestions for data analysis.

iii
EXECUTIVE SUMMARY A 1997 overlay on I-25 north of Denver experienced early cracking. While the
transverse cracking could be attributed to reflective cracking, there was no obvious
explanation for the longitudinal cracking. A team of national asphalt experts analyzed
cores and slabs from I-25 and concluded that a number of variables contributed to the
longitudinal cracking. One of the variables was low percent asphalt content. The asphalt
content was 0.5 % lower than the percent asphalt measured for Quality Control/Quality
Acceptance (QC/QA) data.
Investigation of the QC/QA data showed that project sampling was done from the
windrow. The cores taken for the study were believed to be more representative of the
material that was placed behind the paver. The study panel suggested that CDOT
investigate if the various sampling locations produced results that were consistent with
the material behind the paver.
Colorado Procedure 41 (CP 41) allows three different locations for sampling. These
locations are method A at the plant with a tube sampler, method B at the point of
delivery, and method C behind the paver. Method A has two different procedures for
sampling at the plant silo. With the first procedure the sampler tube is placed under the
silo before the discharge of mixture. With the second procedure the tube is swung
through the discharge steam. Method B is sampling from the point of delivery. Samples
may be taken from the windrow or the paver screws. Method C allows sampling behind
the paver. Samples may be collected either with or without a template.
This study compared the asphalt content (%) of samples taken by each method with the %
asphalt content of the mixture taken from behind the paver with a template. The purpose
was to ascertain if all methods provide unbiased test results of hot mix asphalt (HMA).
Statistically, it made no significant difference which sampling method was followed.
Therefore, CP41 and its various options should remain in place.

iv
TABLE OF CONTENTS
1.0 INTRODUCTION…………………………………………..…...1
2.0 SAMPLING (Colorado Procedure 41-98…………..………..….2
3.0 CP 41 SAMPLING BITUMINOUS PAVING MIXTURES……3
3.1 Tube Sampler……………………………………………..3
3.2 Point of Delivery …………………………………………3
3.3 Behind Paver…….………………………………………..4
4.0 REDUCING FIELD SAMPLES………………………………...5
5.0 DETERMINATION OF THE ASPHALT CONTENT…………5
6.0 RESULTS………………………………………………………..6
7.0 DISCUSSION OF RESULTS..………………………………….8
8.0 CONCLUSIONS………..…………………………………….…9
9.0 RECOMMENDATIONS………………………………………10
APPENDIX A…………………………………..….…………….…..A-1
APPENDIX B………………………………………………………..B-1
APPENDIX C………………………………………………………..C-1

v
LIST OF TABLES
2.1 Sampling locations and methods……………..……...………….2
6.1 %AC for all different methods in each project..…….…………..7
6.2 x, σ , and COV of ratios for each method…….…………………8
A-1 Ratio of % A.C. of all method to the % A.C. of samples behind the
paver with template………….……………………..……………….A-10
A-2 Probability density of each method……………………...…..A-11
LIST OF FIGURES
A-1 % AC for each project using all methods…………….……....A-1
A-2 Probability density of each method…………………………A-11
1
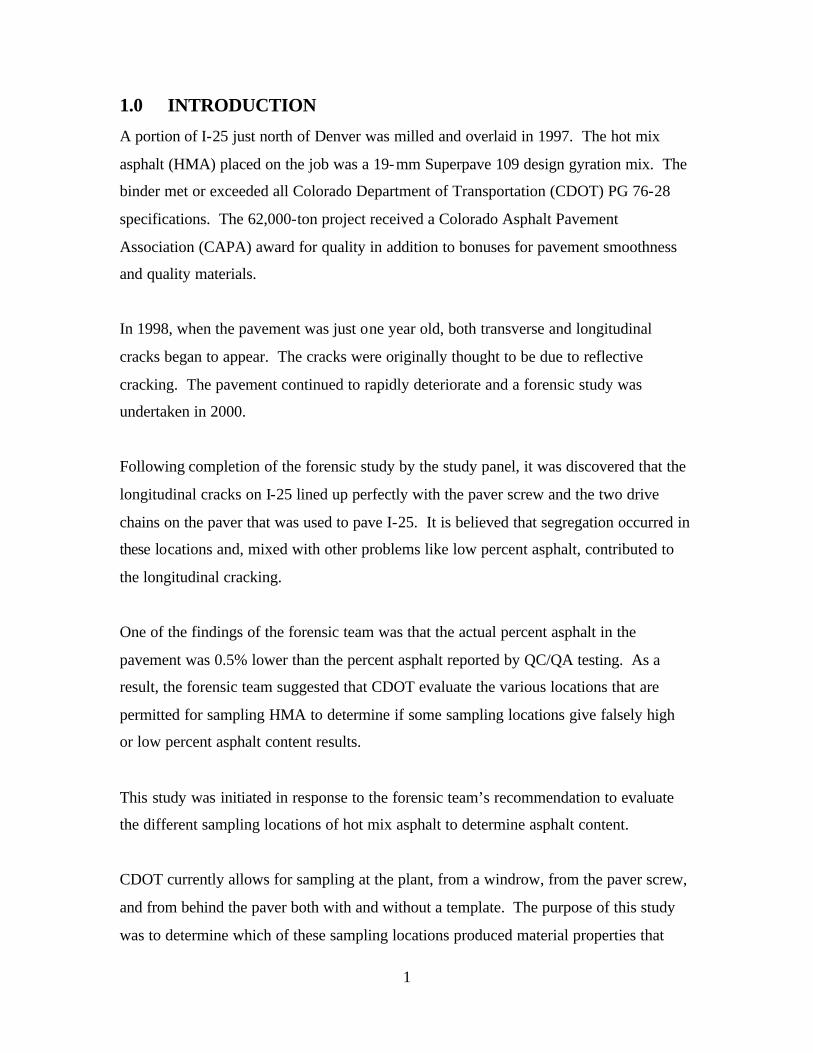
1.0 INTRODUCTION
A portion of I-25 just north of Denver was milled and overlaid in 1997. The hot mix
asphalt (HMA) placed on the job was a 19-mm Superpave 109 design gyration mix. The
binder met or exceeded all Colorado Department of Transportation (CDOT) PG 76-28
specifications. The 62,000-ton project received a Colorado Asphalt Pavement
Association (CAPA) award for quality in addition to bonuses for pavement smoothness
and quality materials.
In 1998, when the pavement was just one year old, both transverse and longitudinal
cracks began to appear. The cracks were originally thought to be due to reflective
cracking. The pavement continued to rapidly deteriorate and a forensic study was
undertaken in 2000.
Following completion of the forensic study by the study panel, it was discovered that the
longitudinal cracks on I-25 lined up perfectly with the paver screw and the two drive
chains on the paver that was used to pave I-25. It is believed that segregation occurred in
these locations and, mixed with other problems like low percent asphalt, contributed to
the longitudinal cracking.
One of the findings of the forensic team was that the actual percent asphalt in the
pavement was 0.5% lower than the percent asphalt reported by QC/QA testing. As a
result, the forensic team suggested that CDOT evaluate the various locations that are
permitted for sampling HMA to determine if some sampling locations give falsely high
or low percent asphalt content results.
This study was initiated in response to the forensic team’s recommendation to evaluate
the different sampling locations of hot mix asphalt to determine asphalt content.
CDOT currently allows for sampling at the plant, from a windrow, from the paver screw,
and from behind the paver both with and without a template. The purpose of this study
was to determine which of these sampling locations produced material properties that

2
were representative of those behind the paver. The objective of this study was only to
evaluate the impact that the sampling location of the hot mix asphalt had on the measured
asphalt content (%). This study did not take into consideration other mix characteristics
such as gradation, volumetric properties or mechanical properties.
The material used in this study was sampled from CDOT projects. Only grading S and
grading SX mixes were included in this study. Sampling was done per CP 41. (See
Appendix B)
2.0 SAMPLING (Colorado Procedure 41-98)
Asphalt mixtures were sampled in accordance with CP 41-98. Three different locations
were used to sample the mixture. Each location was sampled with two different methods.
It was important to understand how these different sampling methods influence the test
results. The locations and methods used are shown in Table 2.1. There was a total of 3
locations and 6 methods.
Table 2.1 Sampling Locations and Methods
Location Method
Positioning tube sampler before mix discharge Asphalt plant
Swinging tube sampler through the mix discharge
From the windrow Point of delivery
From the paver screws
Using a template Behind the paver before compaction
Without using a template
Sampling correctly is as important as testing correctly. The samples must represent the
condition and the nature of the pavement. Two important considerations must be kept in
mind when sampling. First, avoid segregation. Second, prevent contamination of any
foreign matter on the sample.

3
After sampling was completed, material was split according to CP 55-97 (See Appendix
C) and tested to determine the asphalt binder content.
3.0 CP 41 SAMPLING BITUMINOUS PAVING MIXTURES
The following sampling locations and methods were used for this study.
3.1 Tube Sampler
Sampling at the plant is a convenient method to obtain samples. Often, a field laboratory
and a laboratory technician are located at the plant. This allows for a quick turnaround
time on quality control tests. The main disadvantage of this method is that the absorption
of asphalt into the aggregate may not be complete. This lack of absorption could affect
factors such as voids in mineral aggregate (VMA) and air voids, which are not being
measured by this study. It should be noted that Colorado Procedure-Laboratory 5115 has
time requirements to ensure absorption.
Samples obtained at the plant were taken from the hot-mix plant silo discharge chute.
Two methods were followed. Both methods required a tube sampler, tube sampler
holder, and a container having a tight fitting lid. These methods are
1. Swing Silo
During the discharge of mixture, swing the tube through the discharge stream.
2. Static Silo
Prior to the discharge, center the sampling tube directly under the discharge flow.
After the mixture has been discharged from the silo, return the tube holder to the storage
position away from the point of discharge. To avoid segregation, strike off any material
above the top rim of the tube sampler.
3.2 Point of Delivery
This location may provide a slow turnaround time due to transporting the sample from
the plant to the project (which might take from 30 minutes to two hours), transporting

4
samples from the project to the laboratory, and reheating the samples for testing.
However, absorption will occur during this time and the mix will better represent the mix
placed on the road.
A square ended shovel and a container with a tight fitting lid are required. In this
method, two different sampling procedures are followed.
1. Sampling from the windrow prior to laydown.
Three different locations are randomly selected. Material should be removed from
one side of the windrow for the full depth to expose a face. Using the square shovel,
trench the exposed face from bottom to top. Mixtures from all three locations are
placed into the container to obtain the required sample.
2. Sampling from paving screws.
While the paver is in motion and with the screws at least two-thirds covered with the
mixture, three increments of mixture are taken ahead of the paving screws.
3.3 Behind Paver
A square ended shovel and a container having a tight fitting lid, templates are optional.
In this method, two procedures are allowed. One uses a template and the other doesn’t
use a template. For either procedure, three different locations are randomly selected, and
sampled.
When using a template, place the templates in three different locations before the paver
arrives. These templates may have strings attached so the templates can be located after
the paver goes over them. The mix collected on the three templates is placed into the
container.
When not using a template, a full depth of material behind the paver should be taken
immediately. These samples should exclude any underlying material, such as tack coat,
and should be taken from three randomly selected locations.

5
4.0 CP 55 REDUCING FIELD SAMPLES (SELECTION BY CROSS
SECTION)
Samples were reduced for testing per CP 55, Method D.
In this method, a small, flat, square end scoop with square sides, a putty knife and two
slats having a height at least one inch taller than the sides of the splitting pan, are needed.
The mixture is placed into the pan per Method 2. In this method, the can containing the
sample is placed into the splitting pan with the opening of the can resting downwards on
the bottom of the pan. The can of mix is then lifted approximately one inch above the
splitting pan. The can of mix is moved in a circular motion, allowing the mix to trail out
of the can. The material should be placed into the splitting pan in not less than two
complete circular motions. If segregation is visible, the material should be turned over
onto itself using the scoop.
A sample is obtained by pushing a dividing slat vertically through the entire width of the
sample until it contacts the bottom of the pan. A second slat is placed parallel to the first
and pushed vertically to the bottom of the pan. All of the material between the slats is
removed, including the fines. Additional samples are obtained by pushing one of the
slats vertically into the remaining material and repeating the aforementioned process.
5.0 DETERMINATION OF THE ASPHALT CONTENT (IGNITION METHOD)
The asphalt content (%) was determined using Colorado Procedure-Laboratory (CP-L)
5120. A sample of bituminous mixture was heated in an oven having a temperature of
538 oC (1000 oF) until the asphalt binder fraction was ignited and burned away. The
asphalt binder content was determined as follows:
100*)(
)()(
initialm
finalminitialmb W
WWP
−=

6
Where
Pb = Asphalt binder content, in percent, determined by the mass loss
measured on an external scale,
Wm(initial) = External scale weight (mass) of the bituminous mixture specimen
before ignition, grams,
Wm(final) = External scale weight (mass) of the bituminous mixture specimen after
ignition, grams.
A correction factor is normally applied to the burn-off results to obtain an accurate
asphalt content. No correction factor could be applied to any samples in this study. This
was not considered to be a problem as all samples were being compared, in an
uncorrected state, to the uncorrected value that was behind the paver, with a template.
The correction factor was likely the same regardless of sampling location.

7
6.0 RESULTS
Samples were taken from twenty-one different CDOT projects. On each project,
samples were collected from as many as three locations, with each location having up to
two methods. The locations for these methods were the plant (tube samplers), the point
of delivery, and behind the paver. Table 6.1 shows the asphalt content (%) collected
from different projects using all the above methods.
Table 6.1 %AC for All Samples Using All Methods
Method Project # Silo Silo Windrow Paver Screws Behind Paver Behind Paver
Swing Static No Template Template
2 0.00 0.00 5.71 5.85 5.63 5.733 0.00 0.00 5.83 5.54 5.41 5.584 4.81 5.05 0.00 4.35 4.87 5.085 4.96 4.94 0.00 5.01 4.96 5.066 0.00 0.00 0.00 5.55 4.95 4.907 0.00 0.00 0.00 5.14 5.12 5.018 0.00 0.00 0.00 5.18 5.25 5.269 0.00 0.00 0.00 5.21 5.34 5.35
10 0.00 0.00 0.00 6.57 6.19 6.09
11 0.00 0.00 0.00 6.16 5.61 5.7912 5.37 5.25 0.00 5.31 5.05 5.4213 5.16 5.77 0.00 5.39 5.40 5.3914 5.45 5.62 0.00 5.54 5.43 5.1116 5.05 5.17 0.00 5.02 4.97 5.1317 4.98 5.14 0.00 5.02 4.86 5.1118 0.00 0.00 0.00 6.26 6.20 6.2119 0.00 0.00 0.00 6.43 6.15 6.3220 0.00 0.00 0.00 4.65 4.31 4.4721 0.00 0.00 0.00 5.50 5.00 4.9922 4.77 5.08 5.56 5.47 5.37 5.4823 4.92 5.27 5.38 5.13 4.77 5.07
Note: Gray shading indicates the sampling method could not be used.
The data collected from behind the paver, using the template, was considered
representative of the pavement that will serve the road. All data from all other methods
were compared to the asphalt content (%) from the sample taken from behind the paver,
using templates. The ratios of the asphalt content (%) for all methods to the % AC using

8
templates are shown in Table A.1. The average of all ratios for each method was taken
utilizing Equation 6.1. The standard deviation (σ) was also calculated for each method
utilizing Equation 6.2. The coefficient of variation (COV), which expresses the
magnitude of the variability as a percentage of a fraction of the mean value, was
determined utilizing Equation 6.3. The COV must be less than 20% in order for the
method to be accepted as statistically similar to sampling from behind the paver with a
template. −x , σ, and COV for the ratio of each method are shown in Table 6.2.
(6.1) /∑=−
Nxx i
( ) (6.2) 1/2
∑ −
−=
−Nxxiσ
(6.3) −
=X
COVσ
Table 6.2 The Average Ratio, 1- Average Ratio, the Standard Deviation, and the Coefficient of Variation of Each Method
Silo swing Silo static Windrow Screws Behind paver
w/ no template
−x 0.9713 1.0099 1.0293 1.0154 0.9847
1−−x 0.0287 -0.0099 -0.0293 -0.0154 0.0153
σ 0.0508 0.0532 0.0291 0.0577 0.0301
COV 0.0523 0.0526 0.0283 0.0568 0.0306
Also, one may utilize the probability density charts to see the data distribution of each method, as shown in Table A.2 and Figure A.2.

9
7.0 DISCUSSION OF RESULTS
All methods have a COV of less than 20% and, therefore, are statistically similar to
sampling from behind the paver with a template. Sampling from the windrow had the
lowest COV at 0.0283. Sampling from behind the paver had the second lowest COV at
0.0306. Sampling from the screws or from the silo all provided COVs greater than 0.05.
8.0 CONCLUSIONS
All sampling locations for determing the asphalt content used in this study produced
similar asphalt content test results and are considered acceptable.
9.0 RECOMMENDATIONS
The scope of this study was limited to determining the asphalt content of the mix placed.
This study did not investigate gradation, addition of lime, volumetric properties or
mechanical properties of the mix. Further evaluation needs to be conducted to determine
if the location of sampling has an effect on these mix characteristics.
Based on the results from this study no changes are needed to CP-41. CDOT should
continue sampling for asphalt content (%) using the current procedure. However, when
possible the material should be sampled from behind the paver for testing as this material
is the most representative of actual material in-place.

A-2
Appendix A
Results of % AC from All Locations

A-2
A. Results of % A.C. from All Locations
Figure A.1 % AC for Each Project Using All Methods
4.00
4.50
5.00
5.50
6.00
6.50
7.00
Project # 2
% A
.C.
Pav
er s
crew
Win
drow
Tem
plat
e
No
tem
plat
e
4.00
4.50
5.00
5.50
6.00
6.50
7.00
Project # 3
% A
.C.
Win
drow
Pav
er s
crew
Tem
plat
e
No
tem
plat
e
4.00
4.50
5.00
5.50
6.00
6.50
7.00
Project # 4
% A
.C.
Silo
sw
ing
Silo
sta
tic
Pav
er s
crew
Tem
plat
e
No
tem
plat
e

A-3
4.00
4.50
5.00
5.50
6.00
6.50
7.00
Project # 5
% A
.C.
Silo
sw
ing
Silo
sta
tic
Pav
er s
crew
Tem
plat
e
No
tem
plat
e
4.00
4.50
5.00
5.50
6.00
6.50
7.00
Project # 6
% A
.C.
Pav
er s
crew
Tem
plat
e
No
tem
plat
e
4.00
4.50
5.00
5.50
6.00
6.50
7.00
Project # 7
% A
.C.
Pav
er s
crew
Tem
plat
e
No
Tem
plat
e

A-4
4.00
4.50
5.00
5.50
6.00
6.50
7.00
Project # 8
% A
.C.
Pav
er s
crew
Tem
plat
e
No
Tem
plat
e
4.00
4.50
5.00
5.50
6.00
6.50
7.00
Project # 9
% A
.C.
Pav
er s
crew
Tem
plat
e
No
Tem
plat
e
4.00
4.50
5.00
5.50
6.00
6.50
7.00
Project # 10
% A
.C.
Pav
er s
crew
Tem
plat
e
No
tem
plat
e

A-5
4.00
4.50
5.00
5.50
6.00
6.50
7.00
Project # 11
% A
.C.
Pav
er s
crew
Tem
plat
e
No
tem
plat
e
4.00
4.50
5.00
5.50
6.00
6.50
7.00
Project # 12
% A
.C.
Silo
sw
ing
Silo
sta
tic
Pav
er s
crew
Tem
plat
e
No
tem
plat
e
4.00
4.50
5.00
5.50
6.00
6.50
7.00
Project # 13
% A
.C.
Silo
sw
ing
Silo
sta
tic
Pav
er s
crew
Tem
plat
e
No
tem
plat
e

A-6
4.00
4.50
5.00
5.50
6.00
6.50
7.00
Project # 14
% A
.C.
Silo
sw
ing
Silo
sta
tic
Pav
er s
crew
Tem
plat
e
No
tem
plat
e
4.70
4.80
4.90
5.00
5.10
5.20
Project # 16
% A
.C.
Silo
sw
ing
Silo
sta
tic
Pav
er s
crew
Tem
plat
e
No
tem
plat
e
4.00
4.50
5.00
5.50
6.00
6.50
7.00
Project # 17
% A
.C.
Silo
sw
ing
Silo
sta
tic
Pav
er s
crew
Tem
plat
e
No
tem
plat
e

A-7
4.00
4.50
5.00
5.50
6.00
6.50
7.00
Project # 18
% A
.C.
Pav
er s
crew
Tem
plat
e
No
tem
plat
e
4.00
4.50
5.00
5.50
6.00
6.50
7.00
Project # 19
% A
.C.
Pav
er s
crew
Tem
plat
e
No
tem
plat
e
4.00
4.50
5.00
5.50
6.00
6.50
7.00
Project # 20
% A
.C.
Pav
er s
crew
Tem
plat
e
No
tem
plat
e

A-8
4.00
4.50
5.00
5.50
6.00
6.50
7.00
Project # 21
% A
.C.
Pav
er s
crew
Tem
plat
e
No
tem
plat
e
4
4.5
5
5.5
6
6.5
7
Project # 22
% A
.C.
Silo
sw
ing
Silo
sta
tic
Pav
er s
crew
Tem
plat
e
Win
drow
No
tem
plat
e
4
4.5
5
5.5
6
6.5
7
Project # 23
% A
.C.
Silo
sw
ing
Silo
sta
tic
Pav
er s
crew
Tem
plat
e
No
tem
plat
e
Win
drow

A-9
Table A.1 Ratio of % C of All Methods to the % AC of Samples Behind the Paver
with Template
Project # RSswing RSstatic Rwindrow Rscrews Rno template 2 0.9965 1.0209 0.98253 1.0448 0.9928 0.96954 0.9469 0.9941 0.8563 0.95875 0.9802 0.9763 0.9901 0.98026 1.1327 1.01027 1.0259 1.02208 0.9848 0.99819 0.9738 0.998110 1.0788 1.016411 1.0639 0.968912 0.9908 0.9686 0.9797 0.931713 0.9573 1.0705 1.0000 1.001914 1.0665 1.0998 1.0841 1.062615 16 0.9844 1.0078 0.9786 0.968817 0.9746 1.0059 0.9824 0.951118 1.0081 0.998419 1.0174 0.973120 1.0403 0.964221 1.1022 1.002022 0.8704 0.9270 1.0146 0.9982 0.979923 0.9704 1.0394 1.0611 1.0118 0.9408
Average 0.9713 1.0099 1.0293 1.0154 0.98471-average 0.0287 -0.0099 -0.0293 -0.0154 0.0153
Standard deviation 0.0508 0.0532 0.0291 0.0577 0.0301COV 0.0523 0.0526 0.0283 0.0568 0.0306
The shaded area means no data entry RSswing = Silo swing / Behind paver with template RSstatic = Silo static / Behind paver with template Rscrews= Screws / Behind paver with template Rwindrow = Windrow / Behind paver with template Rno template = Behind paver without template / Behind paver with template
( )
1/
/2
−
−
−
=
−
−=
=
∑
∑
XCOV
Nxx
Nxx
i
i
σ
σ
valuesdata ofNumber N variationoft coefficien The
deviation standard The (average) mean value The
==
==
−
COV
xσ

A-10
Table A.2 Probability Density of Each Method
RSswing Frequency
.85-.90 0
.901-.95 1
.951-1 7
1.001-1.05 0
1.051-1.1 1 1.101-1.15 0
RSstatic Frequency
.85-.90 0
.901-.95 1
.951-1 3
1.001-1.05 3
1.051-1.1 2 1.101-1.15 0
Rscrews Frequency .85-.9 1
.901-.95 0
.951-1 9 1.001-1.05 6 1.051-1.1 3 1.101-1.15 2 1.151-1.2 0
Figure A.2 Probability Density of Ratios in Each Method
Rno template Frequency .85-.9 0
.901-.95 2 .951-1 13
1.001-1.05 5 1.051-1.1 1 1.101-1.15 0 1.151-1.2 0
Rwindrow Frequency .85-.9 0
.901-.95 0 .951-1 1
1.001-1.05 2 1.051-1.1 1 1.101-1.15 0 1.151-1.2 0
The percentage of the range between 0.95 - 1.05
67
75
86 78
71
Histogram of % AC of Silo Swing to % AC of Behind the Paver (Template)
05
10
.85-.90 .901-.95 .951-1 1.001-1.05
1.051-1.1
1.101-1.15
% A.C (Silo swing)/% A.C. (Template)
Fre
qu
ency

A-11
Histogram of % AC of Silo Static To % AC of Behind the Paver (Template)
024
.85-.90 .901-.95 .951-1 1.001-1.05
1.051-1.1 1.101-1.15
% A.C (Silo static)/% A.C. (Template)
Fre
qu
ency
Histogram of % AC of Paver Screws to % AC of Behind the Paver (Template)
0
5
10
.85-.9 .901-.95 .951-1 1.001-1.05
1.051-1.1
1.101-1.15
1.151-1.2
% A.C (screws)/% A.C. (Template)
Fre
qu
ency
Histogram of % AC of Windrow to % AC of Behind the Paver (Template)
0123
.85-.9 .901-.95 .951-1 1.001-1.05
1.051-1.1
1.101-1.15
1.151-1.2
% A.C (windrow)/% A.C. (Template)
Fre
qu
ency
Histogram of % AC of Behind the Paver (No Template) to % AC of Behind the Paver (Template)
05
1015
.85-.9 .901-.95
.951-1 1.001-1.05
1.051-1.1
1.101-1.15
1.151-1.2
% A.C (No template)/% A.C. (Template)
Fre
qu
ency

B-1
Appendix B
Colorado Procedure 41-98
Standard Method of Test for
Sampling Bituminous Paving Mixtures

B-2
Colorado Procedure 41-98
Standard Method of Test for
Sampling Bituminous Paving Mixtures
This procedure modifies AASHTO T 168-91, AASHTO T 168-91 may not be used in-place of this procedure.
1. Scope 1.1 This procedure covers sampling of bituminous paving mixtures at points of manufacture, storage, or delivery. 1.1.1 Samples obtained by this procedure may be used for acceptance and quality control of bituminous paving mixtures. 1.2 This standard may involve hazardous materials, operations, and equipment. This standard does not purport to address all of the safety problems associated with its use. It is the responsibility of the user of this standard to establish appropriate safety and health practices and determine the applicability of regulatory limitations prior to use. 1.3 The values stated in acceptable English units are to be regarded as the standard. The values in parentheses are provided for information purposes only. 2. Referenced Documents 2.1 Colorado Procedures: CP 75 Stratified Random Sampling of Materials 3. Significance and Use 3.1 General: 3.1.1 Sampling is equally as important as the testing, and the sampler shall use every precaution to obtain samples that will yield an acceptable estimate of the nature and conditions of the materials which they represent.
3.1.2 Care shall be taken in sampling
to avoid segregation of the material
being sampled. Care shall be taken also
to prevent contamination by dust or
other foreign matter.
3.1.3 Samples to be used for acceptance or assurance testing shall be taken by the contractor or his representative. An authorized representative of the Colorado Department of Transportation shall be present during the sampling procedure. The CDOT Representative present shall take immediate possession of all samples taken. CDOT reserves the right to designate the method and location of material to be sampled. 4. Procedure 4.1 Sampling Equipment - The contractor shall provide equipment needed for safe and appropriate sampling. 4.2 Sample Handling - Combine all sample increments. Place sample in a suitable container having a tight fitting lid. 4.3 Sampling - The procedures for selecting samples are described in CP 75. The material shall be sampled using stratified random sampling from all of the material delivered to the job site.
METHOD A - TUBE SAMPLER 5. Apparatus 5.1 Tube sampler, with a minimum of 2-7/8 in. (73 mm) inside diameter, 16 gauge

B-3
minimum thickness, length and diameter variable with desired test specimen size.
5.2 Tube sampler holder with a metal collar into which the sampler fits, with a 3 ft. (1 m) handle or a tube sampler holder with suitable arm arrangement to hold two tube samplers which can be positioned directly beneath the discharge opening. 5.3 Container, of suitable capacity and having a tight fitting lid. 6. Procedure 6.1 Batch Plant and Storage Silos - Insert one or two tube samplers into the sampler holder arm while the arm is swung away from the discharge. Obtain one or more samples from the material being loaded into a single truck using one of the following methods: (1) during discharge of mixture, swing the arm holding the tube(s) through the discharge stream at a rate fast enough to obtain a representative sample filling the tube(s) (2) prior to the discharge, center the sampling tube(s) directly under the discharge flow. After the mixture has been discharged, return the apparatus to the storage position away from the point of discharge and remove the tube(s). Strike off any material above the top rim of the tube sampler.
METHOD B - POINT OF DELIVERY 7. Apparatus 7.1 Small flat scoop with vertical sides or square ended shovel. 7.2 Container, of suitable capacity and having a tight fitting lid. 8. Procedure 8.1 Sampling from the Windrow Prior to Laydown - Select three or more locations at random from the windrow. Samples of the windrow shall be secured at each location by removing material from one side of the windrow for the full depth to expose a face. Using the flat scoop, or a square shovel with sides, trench the exposed face from bottom
to top, taking care to avoid segregation of particle sizes. Combine the samples from the different locations to obtain the required sample size as specified in Section 11. 8.2 Sampling from Paving Machine Spreading Screws - While the paver is in motion, observe the operation of the spreading screws which transport the mixture from the slat feeders to either side of the paver. These screws should be operating eighty percent or more of the time and be at least two-thirds covered with the mixture, if this is not the case, samples taken from the screws may be segregated and this method of sampling should not be used. 8.2.1 If the conditions of 8.2 are met, obtain at least three approximately equal increments of mixture ahead of the spreading screws which transport the mixture from the slat feeders to either side of the paver as follows: insert the flat scoop or shovel into the mixture and remove the portion with minimal loss of the larger particles. 8.3 Sampling from a Conveyor Belt --CDOT no longer utilizes this sampling technique.
METHOD C - BEHIND PAVER 9. Apparatus 9.1 Small flat scoop, square ended shovel with vertical sides, or sampling device similar to Figure 41-1. 9.2 Container, of suitable capacity having a tight fitting lid. 10. Procedure 10.1 Sampling from the Roadway Prior to Compaction- Obtain at least three approximately equal increments, at a longitudinal location selected at random using CP 75, and combine to form a field sample whose quantity equals or exceeds the minimum recommended in Section 11.

B-4
10.1.1 Take all increments from the roadway immediately behind the machine for the full depth of the material, taking care to exclude any underlying material. Locate the sampling position across the width of the roadway using CP 75. When necessary, place templates on the existing roadway to
exclude any underlying material. Clearly mark the specified area from which each increment or sample is to be removed. Templates which are placed before the mixture is spread will be a definite aid in securing approximately equal increment weights.
10.2 Sampling from Roadway after Compaction - Select the areas to be sampled using CP 75 from the material in place. Obtain at least three approximately equal increments selected from the area being sampled. Take all increments from the roadway for the full depth of the material, taking care to exclude any underlying material. Each increment shall be obtained by coring, sawing, or other methods in such a manner as to ensure a minimum disturbance of the material. 11. Size of Sample 11.1 Number and Quantities of Field Samples: 11.1.1 The number of field samples required is specified in the Schedule for Minimum Materials Sampling, Testing, and Inspection contained in the CDOT Field Materials Manual. The CDOT Field Materials Manual specifies the quantities of sample required for testing in the Central Lab and the Region Lab. Project field tests will require a minimum sample size of 30 lbs (14 kg).
12. Shipping Samples 12.1 Transport samples in suitable containers having a tight fitting lid, so constructed as to preclude loss or contamination of any part of the sample, or damage to the contents from mishandling during shipment. 12.2 Samples shall have individual identification attached giving the information required by the sample user. Utilization of CDOT Form # 633, Sample Tag (Sacks), is required for all submitted samples. This information is included in CDOT Form # 157 and a sample form is shown in Chapter 400 of the CDOT Materials Manual.

C-1
Appendix C
Colorado Procedure 55-97
Standard Method of Test for
Reducing Field Samples of Hot Bituminous Pavements to Testing Size

C-2
Colorado Procedure 55-97
Standard Method of Test for
Reducing Field Samples of Hot Bituminous Pavements to Testing Size
This procedure modifies AASHTO T 248-89, AASHTO T 248-89 may not be used in place of this procedure.
1. SCOPE 1.1 These methods cover the reduction of field samples of hot bituminous pavements (HBP), having a nominal maximum size equal to or less than 1.5 in. (37.5 mm), to the appropriate size for testing, employing techniques that are intended to minimize variations in measured characteristics between the test samples so selected and the field sample. 1.2 The values stated in English units are to be regarded as the standard. 2. REFERENCED DOCUMENTS 2.3 Colorado Procedures:
CP 41 Sampling Bituminous Paving Mixtures
3. SIGNIFICANCE AND USE 3.1.1 The necessity for selecting representative samples and reducing them to test specimen size is emphasized in many test procedures. Using the proper equipment for the type of material to be reduced in size is important. However, unless used correctly, the final test specimen will not necessarily be representative of the total sample. 3.1.2 Specifications for HBP require sampling portions of the material for testing. Other factors being equal, larger samples will tend to be more representative of the total supply. These methods provide for reducing the large sample obtained in the field to a convenient size for conducting a number of tests to describe the material. The reduction is done in a manner such that the smaller portion is most likely to be a
representation of the field sample, and thus of the total supply. The individual test methods provide for minimum weights of material to be tested. 4. SAMPLING 4.1 The field sample of HBP shall be taken in accordance with CP 41, or as required by individual test methods. The user shall satisfy himself that the initial size of the field sample is adequate to accomplish all intended tests. 4.2 Before sample reduction, the field sample of HBP should be heated just until a temperature which allows for the easy separation of particles is attained. HBP samples should not be reheated more than necessary to separate particles. 5. SAMPLE PREPARATION HBP samples shall be prepared for the reduction required for Methods A, B, or D by using either method 1 or 2. 5.1 Method 1 5.1.1 APPARATUS 5.1.2 Apparatus shall consist of a small, flat, square end scoop with sides and a large flat-bottomed mixing pan. 5.1.3 PROCEDURE 5.1.4 Place the field sample of HBP into the mixing pan where there will be neither loss of material nor the accidental addition of foreign material. Mix the material thoroughly by turning the entire sample over three times. Flatten the sample in the pan to a uniform depth, which should be the same or lower than the sides of the scoop.

C-3
5.2 Method 2 5.2.1 APPARATUS 5.2.2 Apparatus shall consist of a small, flat, square end scoop with sides and a large flat-bottomed mixing pan. 5.2.3 PROCEDURE 5.2.4 Place the can containing the field sample of HBP into the mixing pan with the opening of the can resting downwards on the bottom of the pan. Elevate the can approximately 1 inch above the pan bottom. Move the can in a circular motion allowing a thin, uniform layer to form a trail behind the can. Try to distribute the material into two or more layers. If visible areas of segregation exist, mix the material thoroughly by turning the entire sample over onto itself using the scoop.
METHOD A - SELECTION BY SCOOP
6. APPARATUS 6.1 Apparatus shall consist of a small, flat, square end scoop with sides and a putty knife. 7. PROCEDURE 7.1 Prepare the sample for reduction per Section 5.1 or Section 5.2 7.2 Obtain a sample for each test by selecting at least three increments of material at random locations, using a small, flat, square end scoop. Insert the scoop to the full depth of the material. Every attempt should be made to minimize the loss of particles, especially large aggregate particles, over the sides of the scoop. A putty knife may be used to separate the material in the scoop from the material in the pan and also to cut increments of material from the main body of material in the scoop. Do not shake the material in the scoop to add small, additional amounts of material to the specimen, as this may introduce segregated material to the specimen. Combine the portions to obtain a test specimen having the required weight. Save
the remaining portion of the sample until tests are completed.
METHOD B - QUARTERING 8. APPARATUS 8.1 Apparatus shall consist of a small, flat, square end scoop with sides and a putty knife. 9. PROCEDURE 9.1 Prepare the sample for reduction per Section 5.1 or Section 5.2 9.2 Divide the mixture into four equal quarters with a square scoop and remove two diagonally opposite quarters, including all fine material. Successively mix and quarter the remaining material until the sample is reduced to the desired size. Save the remaining portion of the sample until tests are completed. METHOD C -MECHANICAL SPLITTER 10. APPARATUS 10.1 Sample Splitter - Sample splitters shall have an even number of equal width chutes, but not less than a total of eight for coarse aggregate, or twelve for fine-aggregate, which discharge alternatively to each side of the splitter. For HBP samples, the minimum width of the individual chutes shall be approximately 50 percent larger than the largest particles in the sample to be split (Note 1). The splitter shall be equipped with a minimum of two collection pans, having a width equal to or slightly less than the overall assembly of chutes in the splitter to hold the two halves of the sample following splitting. It shall also be equipped with a hopper, a flat scoop, putty knife or straight-edged pan which has a width equal to or slightly less than the overall width of the assembly of chutes, by which the sample may be fed at a controlled rate to the chutes. The splitter and accessory equipment shall be so designed that the sample will flow smoothly without

C-4
restriction or loss of material. A splitter brush should be used to clean the chutes of adhering fines. NOTE 1 - Mechanical splitters are commonly available in sizes adequate for coarse aggregate having the largest particle not over 1 1/2 in. (37.5 mm). 11. PROCEDURE 11.1 The riffle splitter must be clean and dry before use. Place the material into a large, flat bottomed mixing pan. Mix the material thoroughly. Using a flat scoop equal in width to the overall length of the riffles, remove material from the pan and slowly pour the material into the riffle splitter first from one side and then the other. Alternatively, use a flat, square end scoop to load the sample from the mixing pan into two extra splitter pans placed side by side. Slowly pour approximately half of the sample in the pan from one side and then reverse the ends of the pan and pour the remainder from the other side. A slight jarring action by the pan against the splitter helps keep the riffles from clogging. Uniformly distribute the sample from edge to edge, so that when it is introduced into the chutes, approximately equal amounts will flow through each chute. The rate at which the sample is introduced shall be such as to allow a free flow through the chutes into the receptacles below. Do not allow any of the riffles to become plugged since this will divert material to the two adjacent riffles and send too much material to the opposite receiving pan. 11.2 Reintroduce the portion of the sample from alternating receptacles into the splitter as many times as necessary to reduce the sample to the size specified for the intended test. Retain the portion of the material collected in the other receptacle at the last split until tests are completed. NOTE 2 - As an alternative to Section 11.2, further splitting to testing size can be achieved with Section 11.3. 11.3 After splitting the material into two or four equal measures (depending on the size of the field sample), leave the divided
sample in the splitter pans and place in the oven. Use the flat, square end scoop to obtain individual test samples of the required weight. Work from one end of the pan to the other. Insert the scoop to the full depth of the material. Every attempt should be made to minimize the loss of particles over the sides of the scoop. A putty knife may be used to separate the material in the scoop from the material in the pan and also to cut increments from the main body of material in the scoop. Do not shake the material in the scoop to add small, additional amounts to the specimen, as this may introduce segregated material to the specimen. Save the remaining portion of the sample until tests are completed.
METHOD D - SELECTION BY CROSS SECTION
12. APPARATUS 12.1 Apparatus shall consist of a small, flat, square end scoop with square sides; a putty knife; and two slats having a height at least one inch taller than the sides of the splitting pan. The slats shall conform within one inch to the sides of the pan, so that material can not fall from the vertical face into the sample being separated. 13. PROCEDURE 13.1 Prepare the sample for reduction per Section 5.1 or Section 5.2. 13.2 Obtain a sample for each test by pushing a dividing slat vertically through the entire width of the sample until it contacts the bottom of the pan. Next, place a second slat parallel to the first and push it vertically to the bottom of the pan. Remove all of the material between the slats. Take care to include all fines from the pan, the slat sides, and the utensil in the sample. Obtain additional samples by pushing one of the slats vertically into the remaining material and repeating the process. Save the remaining portion of the sample until tests are completed.

C-5
METHOD E - QUARTERMASTER MECHANICAL
SPLITTER 14. APPARATUS 14.1 Apparatus shall consist of a Quartermaster mechanical splitter and a spatula. 15. PROCEDURE 15.1 This procedure may be used for combining and splitting large samples for testing between two labs. 15.2 Close the hopper doors. Place the HBP material into the hopper and level it out with a spatula. Place 4 empty buckets tightly in each corner with the handles facing outward, away from the splitter. Turn the Quartermaster handle to the left. 15.3 For further reductions in sample size, choose two opposite corner containers and repeat Section 15.2