Embed Size (px)
Citation preview
00044981/81/050703-IO 102.00/o
tc 1981 Pergamon Press Ltd.
co d
D
D’ D”
E
uo B
d
4
SAMPLING ERRORS IN BLUNT DUST SAMPLERS ARISING FROM EXTERNAL WALL LOSS EFFECTS
J. H. VINCENT and H. GIBSON
Physics Branch, Institute of Occupational Medicine, 8 Roxburgh Place, Edinburgh EH8 9SU, U.K.
(Received in final form 21 July 1980)
Abstract-Evidence is given that, with some forms of blunt dust sampler under conditions relating to those encountered in practical occupational hygiene and environmental monitoring, particles which impact onto the outer surface of the sampler body may not adhere permanently, and may eventually enter the sampling orifice. The effect of such external wall loss is to bring about excess sampling, where errors as high as 100 % could arise. The problem is particularly important in the sampling of dry airborne particulates of the type commonly found in practical situations. For a given sampler configuration, the effect becomes more marked as the particle size increases or as the ratio of sampling velocity to ambient wind speed increases. We would expect it be greater for gritty, crystalline material than for smoother, amorphous material.
Possible mechanisms controlling external wall losses were examined, and it was concluded that particle ‘blow-off (as opposed to particle ‘bounce’) is the most plausible. On the basis of simple experiments, it might be possible to make corrections for the sampling errors in question, but caution is recommended in doing so because of the unpredictable effects of environmental factors such as temperature and relative humidity.
Of the possible practical solutions to the problem, it is felt that the best approach lies in the correct choice of sampler inlet design.
NOMENCLATURE
free stream dust concentration particle aerodynamic diameter (overbar denotes median value) sampler body diameter outer and inner diameters of the annulus of dust deposited on the front face of the disc-shaped blunt sampler sampling efficiency (or aspiration coefficient) free stream air velocity mean sampling velocity diameter of sampling orifice sampling parameter ( = volume of air sampled/ volume of air geometrically incident on the body)
and other nomenclature as defined in the text.
1. INTRODUCTION
The act of taking a sample from the ambient air for the purposes of determining the concentration of airborne
dust in the outside atmosphere or in the workplace involves the physical extraction of some of that air through some sort of orifice and subsequently through a tilter. This inevitably creates some disturbance to the ambient air itself. Dust sampling efficiency (E), some- times known as the aspiration coefficient, is defined as the ratio between the dust concentration in the air entering the sampler and that in the undisturbed ambient air. Massive particles are not able to follow
changes in the direction of movement of the surround- ing air near the sampler inlet, tending rather to travel straight ahead, and the result is that sampling efticiency can be widely different from unity.
All dust sampling devices in reality may be described as blunt samplers; that is, they present finite blockage to the movement of the ambient air. In the past, only the
limiting case of the thin-walled sampling tube (as used in isokinetic sampling) has been successfully described
by theory. Quite recently, however, some new attempts have been made to describe the processes governing
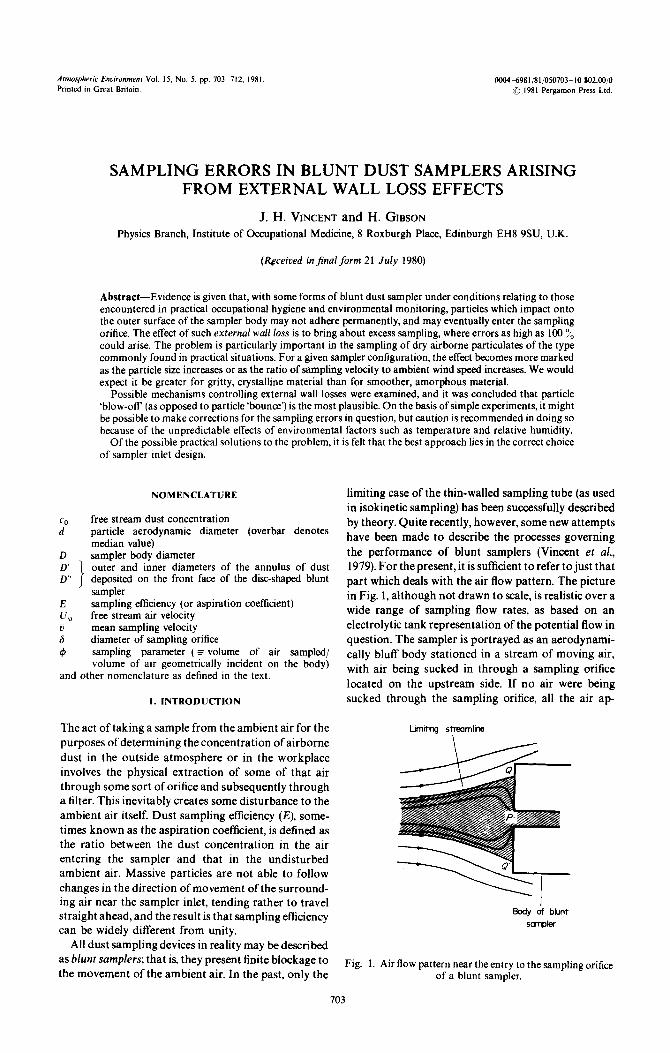
the performance of blunt samplers (Vincent et al., 1979). For the present, it is sufficient to refer to just that part which deals with the air flow pattern. The picture in Fig. 1, although not drawn to scale, is realistic over a wide range of sampling flow rates, as based on an
electrolytic tank representation of the potential flow in question. The sampler is portrayed as an aerodynami- cally bluff body stationed in a stream of moving air,
with air being sucked in through a sampling orifice located on the upstream side. If no air were being sucked through the sampling orifice, all the air ap-
Lknitq streamline \
Fig. 1. Air flow pattern near the entry to the sampling orifice of a blunt sampler.
703

704 J. H. VINCENT and H. GIBSON
proaching the bluff body would diverge to pass around it, with a single stagnation point (i.e., point of zero air
velocity) at point P. Massive airborne particles will tend to resist this divergence, and so their trajectories
will deviate from the airflow streamlines. Some par- ticles might therefore impact onto the surface of the
sampler body. When air is being extracted from the free stream and through the sampling orifice, some of the air approaching the body, having begun to diverge to pass around the outside of the body, converges again so as to enter the orifice. The limiting streamline is the one inside which (shaded area) all the air enters the orifice and outside which all the air bypasses the bluff body. Now the stagnation point is displaced so that,
for axisymmetric flow, it becomes a stagnation ring, passing through Q and Q’, its diameter increasing with the sampling flow rate. Particles in this flow may either pass around the outside of the body, impact onto the body, or enter the sampling orifice. Those impacting onto the outer front surface of the body may either adhere permanently, bounce or be blown off im-
mediately, or be re-entrained subsequently. Whatever their fate, it will be controlled largely by the motion of the air in the thin boundary layer close to the surface of the body, which may be converging towards or diverg- ing away from the sampling orifice depending on which side of the limiting streamline the impaction takes place. It is important to note at this stage that if a particle impacts onto the sampler body surface in the flow region which is converging, and if it fails to adhere permanently, then (neglecting gravity) it must eventu- ally enter the orifice and so be measured as having been
sampled. This would have the effect of making samp- ling efliciency higher than in the ideal case (where all particles adhere to solid surfaces on contact), and we
therefore refer to this phenomenon as excess sampling arising out of external wall losses. Clearly, such sampling errors could lead to unpredictability in sampler performance, and involve considerations which are not normally taken into account in such situations, notably those involving the physics of the forces acting between surfaces in contact. This paper sets out to examine whether the effects of excess sampling can be significant in practical sampling devices, and to develop a physical basis for its expla- nation so that those effects can be minimised in the future.
2. EVIDENCE OF EXCESSSAMPLING DUE TO EXTERNAL WALL LOSSES
2.1 Preuious work
In the field of dust sampling for occupational hygiene, there have always been reservations about the extent to which one may apply the results of laboratory wind tunnel tests using monodisperse liquid droplet aerosols to practical situations with ‘real’ dusts. Some justihcation for these reservations can be obtained, for example, by comparing the results of Ogden et al.
(1978) and Mark (1979) for the entry characteristics of
the MRE Type 113A Gravimetric Sampler (Casella (UK) Ltd.). This is the blunt dust sampler commonly used in British coal mines, consisting of a horizontal elutriator which admits to a filter only the so-called ‘respirable’ fraction. Entry of the dust-laden air to the elutriator takes place through a number of narrow horizontal slits located flush with the flat-nosed front of the instrument. The results of Ogden er al. were obtained using liquid droplet aerosols of di-(2- ethylhexyl) sebacate, while those of Mark were ob- tained using samples of polydisperse coal dust. Ogden et al. found that entry efficiency for a given wind speed fell steadily with increasing particle size. For the most part Mark found the same trend at the smaller particles sizes, but for particle aerodynamic diameter (i.e., the
diameter of a sphere of ‘unit’ density ( lo3 kgme3) and having the same falling speed as the particle in question) above about 10 pm found a sharp increase in sampling efficiency of the device. In this region, it appears therefore that the elutriator oversamples coal dust particles in comparison to liquid droplets.
2.2 New work
We have recently carried out wind tunnel experi- ments to investigate the sampling characteristics of a simple blunt sampler consisting of a 125 mm diameter circular cylinder with a 2 mm diameter orifice oriented
so as to face the wind. The wind speed was 2.4 ms- ’ and the sampling rate 2 1 min-‘. In runs with mono-
disperse liquid droplet aerosols (di-(2-ethylhexyl) se-
bacate, tagged with a fluorescent dye), produced using a spinning top aerosol generator, sampling efficiency for each particle size was determined from the fluorimetrically-determined amounts of aerosol col- lected in the sampler and in an upstream-mounted isokinetic sampler respectively. The details of the technique used where the same as those reported by Ogden et al. (1977) and by Vincent et al. (1979). Some experiments were also conducted with polydisperse, dry, solid dusts of brown aloxite, gritty and having narrow size distribution functions. The size charac- teristics of the various grades of these powders (ob- tained from Coulter analysis and normalised with respect to ‘unit’ density spheres) and other relevant properties are summarised in Table 1. For such dust particles, the sizes thus quoted are in close agreement with their aerodynamic diameters. (Throughout this
paper, all particle diameters quoted will in fact be aerodynamic diameters). The dusts were dispersed into the wind tunnel from a ‘rotating table’ dust feed apparatus via a compressed air-driven aspirator. The diameters of the actual airborne particles in the working section of the tunnel were, on the whole, smaller than indicated in the table (due to settling and other losses in the entrance section), and this will be reflected in the experimental results. Sampling effici- ency for a given dust particle diameter was obtained from the ratio of the overall dust mass concentrations entering the blunt sampler and the isokinetic sampler

Sampling errors in blunt dust samplers 705
Table I. Summary of the properties of the dust used in the sampling experiments (material supplied by Carborundum
Company Limitedp
Grade Coulter Counter data for particle ‘aerodynamic’ diameter in m
75% (d) 25% less than medium less than
~__ --- so 16 14 12
125 30 30 24 175 40 36 34 225 56 52 44
* Material: Brown aloxite (97%Al,O,, Z%TiO,, 1 % other). Density: 3.95 x IO3 kg rnw3,
scribed in Table I. For small values of d, the values of E obtained are in good agreement with those for the liquid droplets. At higher values of d, however, they rise sharply and exceed those for the droplets by as much as a factor of 2. This is the same general trend as reported by Mark (1979) for the MRE Type 113A instrument. Visual inspection of the deposit on the outer surface of the cylindrical sampler for this coarser dust revealed a circular-shaped dust-free zone im- mediately surrounding the sampling orifice (in con- trast to the more unifo~ deposit all the way up to the edge of the orifice for the finer dusts). When the outer surface of the cylinder in the vicinity of the sampling orifice was coated with a thin layer of grease in repeat runs, the values of E were seen to fall back into close agreement with those for the droplets.
respectively, multiplied by the ratio of the normalised A similar experiment was performed using an ORB
aerodynamic diameter distribution functions inhalable dust sampler (Ogden and Birkett, 1978). It (obtained by Cot&et analyses) in the same two consists of two hemispheres of diameter 59 mm samplers at the particle diameter in question. The pressed from thin brass sheet. The sampling head has results of the two experiments using these contrasting 32 entry ports of diameter 2Smm. equispaced, and types of aerosol are given in Fig. 2, where sampling drilled towards the centre of the resulting sphere at efficiency (E) is plotted as a function of particle latitude 20” (i.e., about 10 mm above the equator where aerodynamic diameter (d). For the liquid droplets, E the hemispheres join). The top hemisphere also carried falls steadily below unity as d is increased, following a thin brass ‘halo’ of width 6 mm and at Iattitude 33”. the trend predicted by theory (Vincent et al., 1979). The experiment in question was carried out at the This is the same general trend as that reported by recommended working sampling rate of 2 1 min - ’ in a Ogden et al. (I 978) for the MRE Type 113A Gravimet- wind velocity of 2.4 m s-‘, and using the aloxite dusts ric Sampler. The scatter in the data points is normal already referred to. The results are shown in Fig. 3. At for this type of experiment, experimental errors of the small values of d, sampling efficiency (E) falls away order of & 10 ‘4 mostly coming from limitations in steadily below unity as d is increased, in good agree- particle size measurement technique. The sampling ment with the results of Ogden and Birkett for the
efficiency characteristic for the aloxite dust was con- liquid droplet aerosols. But once again at higher values
structed from a number of separate runs made with a of d ( > 25 pm), E jumps to values exceeding unity. selection of the narrowly-graded dust batches de- Visual inspection (see Fig. 4) of the sampler after
12
I I
h r IO -
5 09 gj 08 0
f
w
07 /
06 f g 05
8 04
v
0 3-
02-
0 .- I
I , I 0 !O 20 30 40
Parncle &meter, jm
Fig. 2. Sampling efficiency of the cylindrical blunt sampler as a function of particle aerodynamic diameter. (Wind speed 2.4 m s- ‘; sampling flow rate, 2 1 min-I.) X: Liquid droplet aerosols; 0: Aloxite dust, Grade 50;
A: Aloxite dust. Grade 12.5: d: Aloxite dust V: Aloxite dust (outer surface of sampler greased) Grade 225.
Broken line from theory (Vincent ef al., lY7Y).

706 J. H. VINCENT and H. GIBSON
J
E p ‘O_\ - 09 % 08-
$J 07-
”
v
. .
I I I I I 0 IO 20 30 40
Partide diameter, pm
Fig. 3. Sampling efficiency of the ORB sampler as a function of particle aerodynamic diameter. (Sampling flow rate, 2
1 min-*.) X: Liquid droplet aerosols; air speed 2.7 m s- ’ (Ogden and
Birkett, 1978.) A: Aloxite dust, Grade 125 V: Aloxite dust, Grade 225 air speed, 2.4 m s- ‘. V: Aloxite dust, Grade 225, (outer surface of sampler greased)
exposure to the coarse dust in this regime again revealed dust-free zones adjacent to the orifices near the leading edge of the sampler (again not apparent for the finer dust). Again, when the outer surface of the sampler was coated with a thin layer of grease, E fell back closer to the liquid droplet results, although in this instance not back into complete agreement.
Further qualitative evidence of external wall losses was obtained by mounting a typical practical personal sampler (the Caselia Model T13032) on the lapel of a dummy torso in the wind tunnel, and exposing it to samples of the same aloxite dusts as before under realistic wind conditions (2.3 m s-l at normal inci- dence) and at the recommended working flow rate (2 1 min-I). The visual appearances of the dust de- posits on the outer face of the sampler after exposure to some fine and coarser grades of dust respectively as before are shown in Fig. 5. WhiIe the finer dust was deposited all the way up to the orifice edge, the coarser dust left the now-familiar clear circular zone im- mediately adjacent to the orifice.
Liquid droplets which impact onto the outer surface of a sampler will adhere permanently. But it has become clear from our preceding experiments and, retrospectively, those of Mark (1979), that dry dust particles adhere iess strongly and so may, under the right conditions, be removed. While it would appear that external wal1 losses, and therefore associated sampling errors, need to be reckoned with in practical situations, such considerations have not previously featured in environmental and workplace dust samp ling practice.
3. A BASK STUDY OF THE MECHANISMS OF EXTERNAL
WALL LOSSES IN BLUNT SAMPLERS
3.1 Background theory
The term ‘external wall losses’ is used to describe in general the inability of the solid external surface of a blunt sampler to retain an impacting particle. It could include particle ‘bounce’ which occurs above a critical value of the particle velocity normal to the wall on impact (Dahneke, 19731, being a function of particle and surface properties, and invoiving the ~oe~c~e~~ of resriturion. It could also include particle ‘blow-off which occurs when the fluid dynamical drag on a particle sitting in the shear boundary layer flow parallel to the wall exceeds a critical value controlled by the local friction force (Vincent and Humphries, 1978). Whether or not this involves the coe$icient ojdynamic friction or the coefficient ojstatic jrjctio~j~r ~~~djng or robbing depends on whether the particle in question is ever actually at rest in contact with the wal.
In the present experiments, particle bounce can be disposed of fairly quickly. This effect would be most marked at the location on a surface where the velocity of the impinging particle in the normal direction is a maximum, and for a bluff body this must be in the region of stagnation. Inspection of the distributions of dust on the leading surface of the ORB sampler (Fig. 4) reveals that this is clearly not the case. In any case, particle bounce is a phenomenon more commonly associated with relatively high velocity jets of dust- laden air, such as in particle impactors (Cheng and Yeh, 1978). From these qualitative arguments, we feel that particle bounce is not likely to be the main external wall loss mechanism in the blunt samplers of interest in this study.
Vincent and Humphries (1978)examined the impac- tion of airborne aloxite particles onto the front face of a flat disc placed normal to the airflow in a wind tunnel, and observed that, under certain conditions, particles were retained over the central area of the disc, but not near the edge. Theoretical explanation of these observ- ations was based on the mechanism of particle blow- off, and involved consideration of the viscous air flow in the boundary layer close to the surface of the disc, and the balance between drag and friction forces on a particle in contact with that surface. In that theory, it was assumed that the normal force holding a dust particle in contact with the surface is associated with short-range Van der Waals interactions, and is con- trolled not so much by the macroscopic size of the particle but by the considerably smaller radius of curvature which characterises the asperities which actually form the contact between the particle and the surface. For a given type of dusty material, it is reasonable to assume that this radius is constant. The details of the theory are given in the paper cited, but the main result is that the ratio between thediameter of the dust-covered part of the disc (D’) and the diameter of the disc itself (r>) is given approximately by

Fig
64 (b)
Sampling errors in blunt dust samplers
;. 4. Visual appearance of dust deposited on outer surface of the ORB sampler after exposure (wind speed, 2.3 m s-*; sampling flow rate, 2 1 min- I.)
Fine dust
Coarse dust + indicates point of normal incidence of the wind.

708 J. H. VINCENT and H. GIBSON
Fig, 5, Visual appearance of dust deposited on outer surface of the Casella Model T13032 Personal Sampler after exposure (wind speed, 2.3 m s-‘; sampling Row rate, 2 1 min-‘J (a) Fine dust. (b) Coarse dust.
where all other relevant parameters are taken to be effectively constant. In arriving at this stage, it was implicitly assumed that no interactions take place between particles which might be present together at the surface of the disc. Furthermore, environmental factors such as relative humidity, known to play a role in such surface processes, were neglected. El~tr~~ti~
effects were also ignored. The theory was well sup- ported by the experimental observations of Vincent and Humphries, and the simplifying assumptions therefore vindicated.
The next step is to consider how these ideas can be extended to a blunt dust sampler. A simple configur- ation is chosen for this exercise, consisting of a flat disc of diameter D placed normal to a uniform stream of air moving at velocity Uo. The disc contains a central, circular sampling orifice of diameter 6, through which air is drawn at a mean sampling velocity V. The overall flow situation is morecomplicated than in the previous example, and it is unlikely that such a theoretical
approach is accessible. However, the conditions are su~cien~y similar to support our earlier deduction
that particle blow-off is indeed the main mechanism of external wall loss in a blunt sampler. It is hoped now to create a plausible physical picture of external wall loss
in blunt samplers by linking up the theory for the simple case of the disc with new experimental observ- ations for the disc-shaped sampler.
3,2. ~xperi~e~ta~ apparatus and tec~~~iques
Experiments were carried out using three such discs,
made of brass and having D = 100,75 and 50 mm and 6 = 4,3 and 2 mm respectively. They were mounted in
turn in a small wind tunnel having a rectangular working cross-section measuring 0.3 m x 0.3 m. Samples of the same narrowly-graded aloxite dust described earlier were uniformly mixed in this tunnel. Air was drawn through the disc sampling orifices at rates up to 20 1 min- ‘.
After exposure to the airborne dust, each disc- shaped blunt sampler was examined visually. Figure 6 illustrates schematically a typical dust distribution observed on the front face, showing an annular-shaped

ring I >f deposited material of outer diameter D’ and The outer and inner boundaries of this ring 7 Here
inner diameter D”, the rest of the surface being sufficiently sharply defined in practice to allow the
relati’ vely dust free. measurement of D’ and D” to within about _I 10 “/, and
Sampling errors in blunt dust samplers
DISC
/ \ Layer of Smpi~ng cfke
deposited dust
ia)
709
(b)
Fig. 6 (a) Sketch of the typical deposit on a disc-shaped blunt sampler after exposure to narrowly graded alexite dust; (b) typical observed deposit.
A,E 15:5 - E
710 J. H. VINCENT and H. GIBSON
f 5 % respectively, the inner boundary being more sharply defined than the outer.
3.3. Results and discussion
Measurements were made of D’ and D” using the discs described above for free stream air velocities in the range from 2 to 6 m s-’ and sampling flow rates from 5 to 20 1 min-‘. Theoretically, the problem of particle drag in the boundary layer close to the plane of the disc-shaped sampler is much more complicated than in the case examined by Vincent and Humphries (1978). While it is possible in principle to calculate the boundary layer flow near such a body with suction through an orifice, numerical solution of the equations of motion of the air is arduous. Therefore a simpler, more intuitive, physical approach is appropriate, and (probably) just as useful in helping to understand the phenomenon in question and in relating it to practical situations.
The outer diameter of the ring of collected dust (D’) should be controlled by the same considerations as outlined in the theory leading to Equation (1). But now we have the additional problem that air flow stag- nation is no longer at a point at the centre of the disc, but is displaced outwards to lie on a ring, as described earlier. The diameter of this stagnation ring will increase with the ratio of air sampled to that geometri- cally incident on the disc, given by
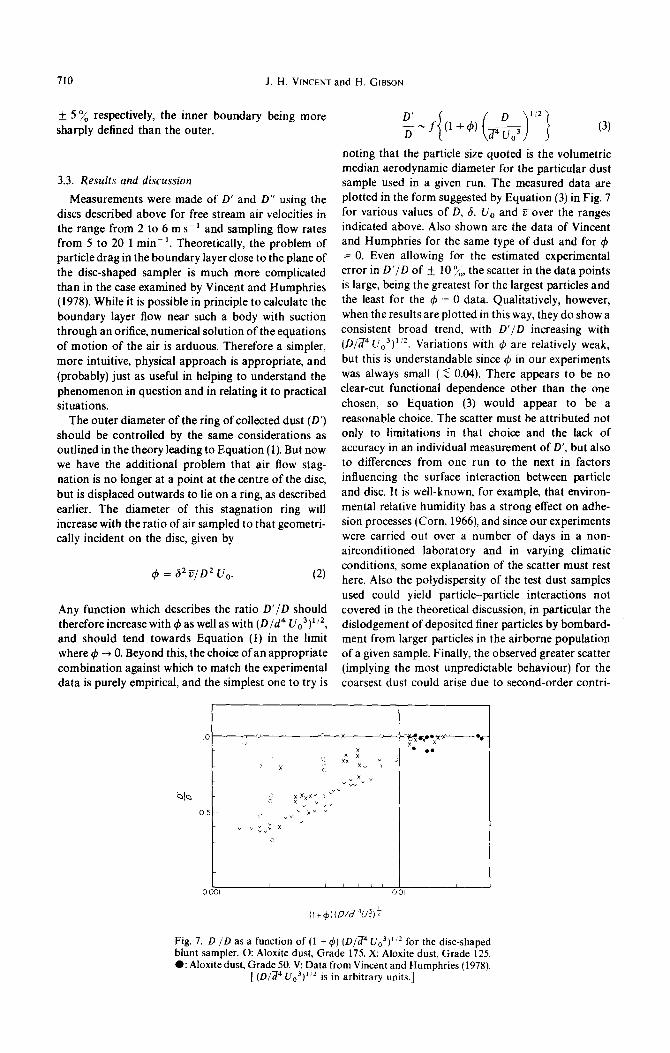
Any function which describes the ratio D’JD should therefore increase with 4 as well as with (D/d4 UO3)1’2, and should tend towards Equation (1) in the limit where 4 -+ 0. Beyond this, the choice ofan appropriate combination against which to match the experimental data is purely empirical, and the simplest one to try is
;4((L+9) (gJ2} (3)
noting that the particle size quoted is the volumetric median aerodynamic diameter for the particular dust sample used in a given run. The measured data are plotted in the form suggested by Equation (3) in Fig. 7 for various values of D, S, UO and B over the ranges indicated above. Also shown are the data of Vincent and Humphries for the same type of dust and for 4 = 0. Even allowing for the estimated experimental error in D’/D of _+ 10 %, the scatter in the data points is large, being the greatest for the largest particles and the least for the $J = 0 data. Qualitatively, however, when the results are plotted in this way, they do show a consistent broad trend, with D’/D increasing with (D/~4U03)1.‘2. Variations with 4 are relatively weak, but this is understandable since 4 in our experiments was always small ( 5 0.04). There appears to be no clear-cut functional dependence other than the one chosen, so Equation (3) would appear to be a reasonable choice. The scatter must be attributed not only to limitations in that choice and the lack of accuracy in an individual measurement of D’, but also to differences from one run to the next in factors influencing the surface interaction between particle and disc. It is well-known, for example, that environ- mental relative humidity has a strong effect on adhe- sion processes (Corn, 1966), and since our experiments were carried out over a number of days in a non- airconditioned laboratory and in varying climatic conditions, some explanation of the scatter must rest here. Also the polydispersity of the test dust samples used could yield particle-particle interactions not covered in the theoretical discussion, in particular the dislodgement of deposited finer particles by bombard- ment from larger particles in the airborne population of a given sample. Finally, the observed greater scatter (implying the most unpredictable behaviour) for the coarsest dust could arise due to second-order contri-
Fig. 7. D /D as a function of (1 + C#J) (D/a4 U,‘)“z for the disc-shaped blunt sampler. 0: Aloxite dust. Grade 175. X: Aloxite dust. Grade 125. 0: Aloxitddust, Grade 50. V: Data from Vincent and Humphries (1978).
[(D/p Uo3)“* is in arbitrary units.]

Sampling errors in blunt dust samplers 711
butions from the previously-discarded particle bounce orifice is of the same order as that in the undisturbed
mechanism. free stream (co). Thus The inner diameter of the ring of collected dust (D”)
will be influenced by similar general considerations, the drag experienced by a particle sitting on the surface of the disc increasing steadily along a radial line drawn inwards towards the edge of the sampling orifice. In fact, because our sampling velocities were nearly always higher than the free stream air velocities, the
gradient of this drag force should be greater than along the radial line directed outwards from the stagnation ring, and so we would expect the cut-off to be sharper; as was observed. Qualitatively, D”/D must increase
with 4. It will also increase somehow with particle
diameter. Bearing in mind that D” cannot take values
smaller than S, it was decided to try plotting (D” -6)/D as a function of C#J (see Fig. 8). The collapse of the data when displayed in this way is better than might have been expected on the basis of such qualitative argu- ments. Once again there is considerable scatter, but the
behaviour of (D” -6)/D for each dust batch can be approximated acceptably by a straight line through the
origin, as indicated by the eye-drawn curves on the
graph.
mass of dust sampled per unit time i&
in the absence of wall losses = EIc, -
( > 4 i?
(4)
where E, is the ideal collection efficiency (as for liquid
droplet aerosols), and
mass of dust impinging onto the region
of the disc surrounding the sampling orifice, and entering the hole per unit time
- c,,U,(D”*-~~)~. (5)
The total amount of dust actually sampled is the sum of these two, and so the actual sampling efficiency is
E,, - E,++ “811-l 1 I
This can be re-expressed as
From the point of view of blunt sampling, the external wall losses in the conoerging part of the boundary layer flow over the surface of the disc are the most important. The dust which would otherwise deposit over the central part of the disc must enter the sampling orifice and so contribute to the mass sam- pled. Not only does this lead to excess sampling but
also introduces considerable unpredictability arising from the variability of environmentally-controlled factors.
K,+++{{P(;)(;)+ljz-l}. (7)
where jl is the slope of the experimental curve relating (D” -6)/D and 4 for a given grade of dust. It is noted that the error due to excess sampling increases with d, 6/D and i?/I_J,. For the cylindrical blunt sampler described earlier in this paper under the conditions
represented in Fig. 2, we have
P(Grade 175) - 6 6=2mm
4. ASSESSMENT OF SAMPLING ERRORS ARISING FROM EXTERNAL WALL LOSSES
so that
D = 125 mm
uo /C = 0.23 E, - 0.80
We can now proceed to estimate the sampling error due to wall losses in a given blunt sampler, making the assumption that the concentration of the dust arriving at the disc surface in the region near the sampling
EA - 1.03.
Bearing in mind that the dust for which /I is quoted contains a fair proportion of larger particles (see Table
Fig. 8. (D” - 6)/D as a function of I$ for the disc-shaped blunt sampler. (Legend as for Fig. 7.)

712 J. H. VINCENT and H. GIBSON
l), as well as the fact that P is quoted for the carborundum dust on a flat disc rather than the cylindrical sampler, this estimate for EA relates quite well to the observed pattern of behaviour. It would seem therefore that simple laboratory experiments using narrowly-graded dusts (along the lines of those just described) could allow estimates to be made of the corrections which need to be applied to practical sampler performance in order to account for external wall losses by particle blow-off.
In the light of what has been learned, one final comment is appropriate in connection with the ap- parently very sharp onset of external wall loss effects in Figs 2 and 3 as particle aerodynamic diameter increases from about 25 to 32 pm. It is reasonable to expect this onset to be more gradual. However, as has already been indicated, the situation in the experiments in question was complicated by the fact that the dust batches used to construct the experimental sampling characteristic curves were actually ~lydisperse. Thus for a given dust batch, fine particles which normally would adhere permenently on contact with a solid wall may be removed as the result of impacts from larger particles in the batch. The effect is to make excess sampling due to external wall losses artificially high for the smaller particles. If it were possible to perform the same experiments with monodisperse dusts of the type in question, a more gradual onset of excess sampling would surely occur. But as yet we know of no way to create such a dust in the laboratory.
5. CONCLUDING REMARKS
The evidence indicates clearly that, with some forms of blunt dust sampler under conditions corresponding to normal practice in ~cupational hygiene and en- vironmental monitoring, particles which impact onto the outer surface of the sampler body may in some cases not adhere permanently and may eventually end up entering the sampling orifice(s). The effect of such external wall loss of particles is to bring about excess sampling, and we have seen how errors as great as 100 “;;; could arise for particles which may be considered to be of inhalabfe size. While it is reasonable to assume that the effect will be absent for liquid droplets, it becomes much more important in the sampling of dry airborne particulates of the type commonly found in practical situations. For a given sampler configuration, the effect becomes more marked as particle size increases or as the ratio of sampling velocity to wind speed increases, We would abo expect it to be greater for gritty, crystalline material than for smoother, amorphous material.
We have considered possible mechanisms which might govern external wall losses in blunt samplers, and conclude that particle blow-off, rather than bounce, is the most plausible. On the basis of simple experiments, it appears that it might be possible to make corrections for the excess sampling of a given blunt sampler in a given situation. But caution is
advised in applying such corrections in view of the unpredictable contributions arising from variations in environmental factors such as temperature and relative humidity.
It can be shown theoretically, and supported by experiment (Vincent et a/., 1979), that the sampling efficiency of a blunt sampler should be least sensitive to variations in ambient wind speed at high sampling flow rates. From the present work, it appears that this recommended mode of operation could be in conflict with the criterion for keeping external wall loss effects to a minimum. We should therefore consider other possibilities for minimising such sampling errors. As has already been shown, the greasing of the outer surfaces of blunt samplers can reduce or even eliminate the effect. But it has been our observation that grease layers rapidly become covered with dust during ex- posure and can soon start to lose their adhesive properties. In fact, with regard to the ORB sampler results (Fig. 3), it is felt that this is the reason that the application of grease failed to bring the Carborundum dust data more into line with those for the liquid droplets. A more satisfactory approach to the problem would be to consider the possibility of wall loss effects at the design stage of a blunt sampler, and to in- corporate features which prevent sliding particles from entering the sampling orifice(s).
Acknowledgements-This research has been carried out with the support of the British National Coal Board and with a financial grant from the European Coal and Steel Community. The authors wish to thank colleagues at the Institute of Occupational Medicine for their helpful com- ments, Mr. G. Lynch and his workshop staff for their. technical assistance, and Mr. W. Witherspoon for his help in carrying out the experiments.
REFERENCES
Cheng Y. S. and Yeh H. C. (1978) Particle bounce in cascade impactors. Inhalation Toxicology Research Institute Annual Report for 1977-78, pp. 266-270.
Corn M. (1966) Adhesion of Particles. In Aerosol Science (Edited by C. N. Davies). Academic Press, New York.
Dahneke B. (1973) Measurements of bouncing of small latex spheres. J. Colloid. interface Sci. 45, 584-590.
Mark D. (1978) Instruments for sampling respirable airborne dust in coal mines: an investigation of their performance. M. Phil. Thesis, University of Nottingham,
Ogden T. L., Birkett J. L. and Gibson H. (1977) Improve- ments to dust measurement techniques. Final Report on CEC Contract 62.53-22/8/016 (Institute of Occupational Medicine (Edinburgh), Report No. TM/7711 1).
Ogden T. L., Birkett J. L. and Gibson H. (1978) Large particle entry efficiencies of the MRE 113A eravimetric hust sample;. Ann. Oct. Hyg. 21, 251-263. ”
Ogden T. L. and Birkett J. L. (1978) An inhalable dust sampler for measuring the hazard from total airborne particutate. Ann. Oct. Hyg. 21,41-50.
Vincent J. H. and Humphries W. (1978) The collection of airborne dust by bluff bodies. Chem. Engng. Sci. 33, 1147-l 155.
Vincent J. H., Wood J. D., Birkett J. L. and Gibson H. (1979) A study of external flow effects on personal sampling. Institute of Occupational Medicine (Edinburgh), Tech- nical Memorandum No. TM/79/18.