Embed Size (px)
Citation preview
Marshall UniversityMarshall Digital Scholar
Theses, Dissertations and Capstones
2015
Sampling Considerations for Amphibian Surveys:Evaluating Risks of Committing Type I and Type IIErrorsKelli Marie [email protected]
Follow this and additional works at: http://mds.marshall.edu/etd
Part of the Animal Sciences Commons, and the Biodiversity Commons
This Thesis is brought to you for free and open access by Marshall Digital Scholar. It has been accepted for inclusion in Theses, Dissertations andCapstones by an authorized administrator of Marshall Digital Scholar. For more information, please contact [email protected].
Recommended CitationHerrick, Kelli Marie, "Sampling Considerations for Amphibian Surveys: Evaluating Risks of Committing Type I and Type II Errors"(2015). Theses, Dissertations and Capstones. Paper 929.

SAMPLING CONSIDERATIONS FOR AMPHIBIAN SURVEYS: EVALUATING RISKS OF COMMITTING TYPE I AND TYPE II ERRORS
A thesis submitted to the Graduate College of
Marshall University In partial fulfillment of
the requirements for the degree of Master of Science
in Biological Sciences
by Kelli Marie Herrick
Approved by: Dr. Jayme Waldron, Committee Chairperson
Dr. Thomas K. Pauley Dr. Shane M. Welch
Dr. Anne Axel
Marshall University May 2015

ii
© 2015 Kelli Marie Herrick
ALL RIGHTS RESERVED

iii
ACKNOWLEDGEMENTS First and Foremost, I would like to thank my advisor Dr. Jayme Waldron for all of
her guidance and support during my time at Marshall University. I am extremely grateful
that Dr. Waldron allowed me to work directly with her study organism in South Carolina,
in addition to my fieldwork in West Virginia, that I would not have been exposed to
otherwise. I would like to thank Dr. Thomas K. Pauley for all of his sage advice and
knowledge regarding West Virginia and the eastern hellbender. Dr. Shane Welch was
instrumental in providing a new prospective on experimental design and thesis
composition that made my study stronger and challenged my writing abilities. Lastly, Dr.
Anne Axel was always available to provide support and suggestions during periods of
frustration.
I cannot thank the members of the Marshall University Herpetology Lab enough
for all of their support, positive criticism and love during my time at Marshall especially:
Derek Breakfield, Elise Edwards, Marcie Cruz, Abby Sinclair, Tim Brust, Chris Bowers,
Amy Fielder, Brian Williamson, Brad O’Hanlon, Jonathan Cooley, Shelby Timm, Cory
Goff and honorary members, David Foltz, Thaddeaus Tuggle and Alex Brannick.
Looking for hellbenders is a time consuming, wet and often frustrating business. I could
not have done this project without my amazing field help: Elise Edwards, Jonathon
Cooley, Derek Krall, Derek Breakfield, Corey Goff, and David Lauge.
I give 100,000 thanks to my family and friends back home for their amazing
support: Holly Herrick, Scott Herrick, Heidi Stewart, Marge Herrick, Bob Barbu, Caron
Collister, Cristopher Herrick, Allen Anderson, Taryne Darden, Carolyn Collister, Mal

iv
SanMarco, Liz Gabella, John Krisop, Will Durst, Rick Stone and June Harloff. Last but
not least I give a large shout out to Joseph Hamden, Amy Parsons White, and Derek
Breakfield (aka Tied 4 Last) for their jokes, wit and love when we weren’t sure we’d ever
make it. Clearly we did!
v
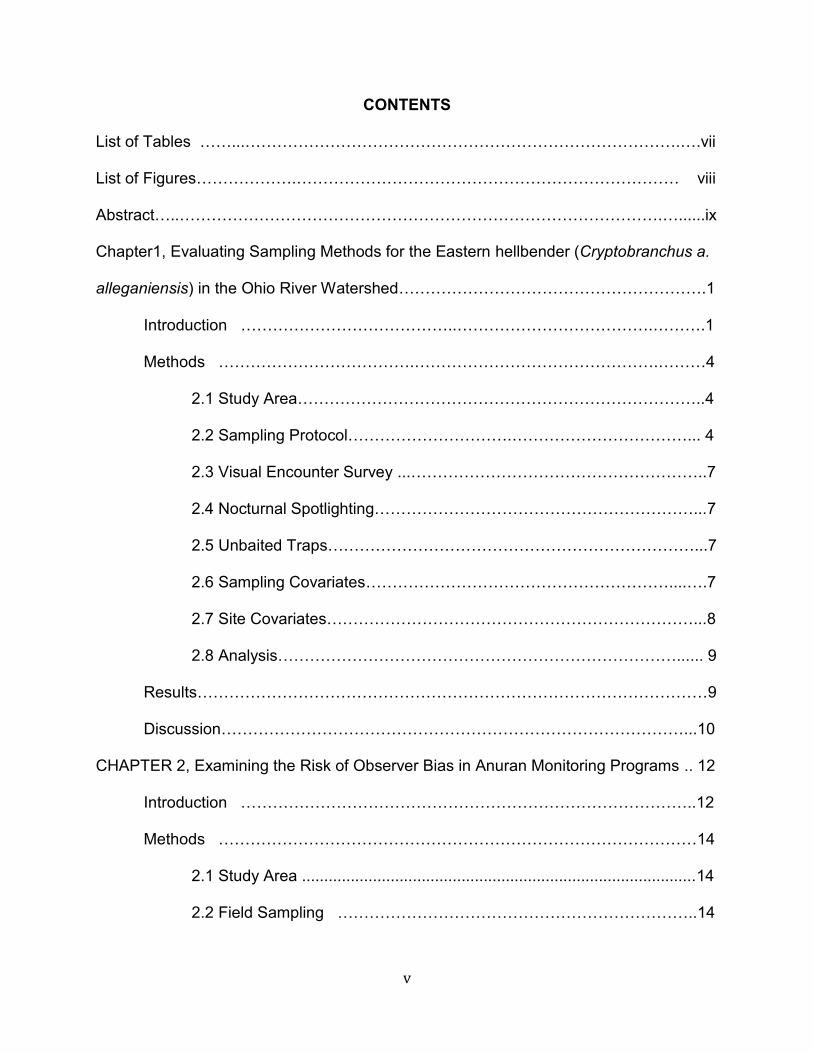
CONTENTS
List of Tables ……...……………………………………………………………………….….vii
List of Figures……………….……………………………………………………………… viii
Abstract…..……………………………………………………………………………….…......ix
Chapter1, Evaluating Sampling Methods for the Eastern hellbender (Cryptobranchus a.
alleganiensis) in the Ohio River Watershed………………………………………………….1
Introduction …………………………………..……………………………….……….1
Methods ……………………………….……………………………………….………4
2.1 Study Area…………………………………………………………………..4
2.2 Sampling Protocol………………………….……………………………... 4
2.3 Visual Encounter Survey ...………………………………………………..7
2.4 Nocturnal Spotlighting……………………………………………………...7
2.5 Unbaited Traps……………………………………………………………...7
2.6 Sampling Covariates…………………………………………………....….7
2.7 Site Covariates……………………………………………………………...8
2.8 Analysis…………………………………………………………………...... 9
Results……………………………………………………………………………………9
Discussion……………………………………………………………………………...10
CHAPTER 2, Examining the Risk of Observer Bias in Anuran Monitoring Programs .. 12
Introduction …………………………………………………………………………..12
Methods ………………………………………………………………………………14
2.1 Study Area .........................................................................................14
2.2 Field Sampling …………………………………………………………..14
vi
2.3 Data Analysis……………………………………………………………...16
Results………………………………………………………………………………….17
Discussion……………………………………………………………………………...21
Literature Cited………………………………………………………………………………...23
IRB Approval…………………………………………………………………………………...28
Vita………………………………………………………………………………………………29

vii
List of Tables
1.1 Sampling covariates of hellbender detection………………………………………….…8
1.2 Site covariates of hellbender detection………………………………………………......9
viii
List of Figures
1.1 Location of Hellbender Sampling Sites in the Monongahela National Forest, WV,
2013……………………………………………….……………………………..…..…..5
1.2 Site Arrangement and Sampling Pattern………………………………………….…6
2.1 Effect of Group Size on Type I Error with Standard Error.…………………….….18
2.2 Effect of Species Richness on Type II Error with Standard Error………….…….18
ix
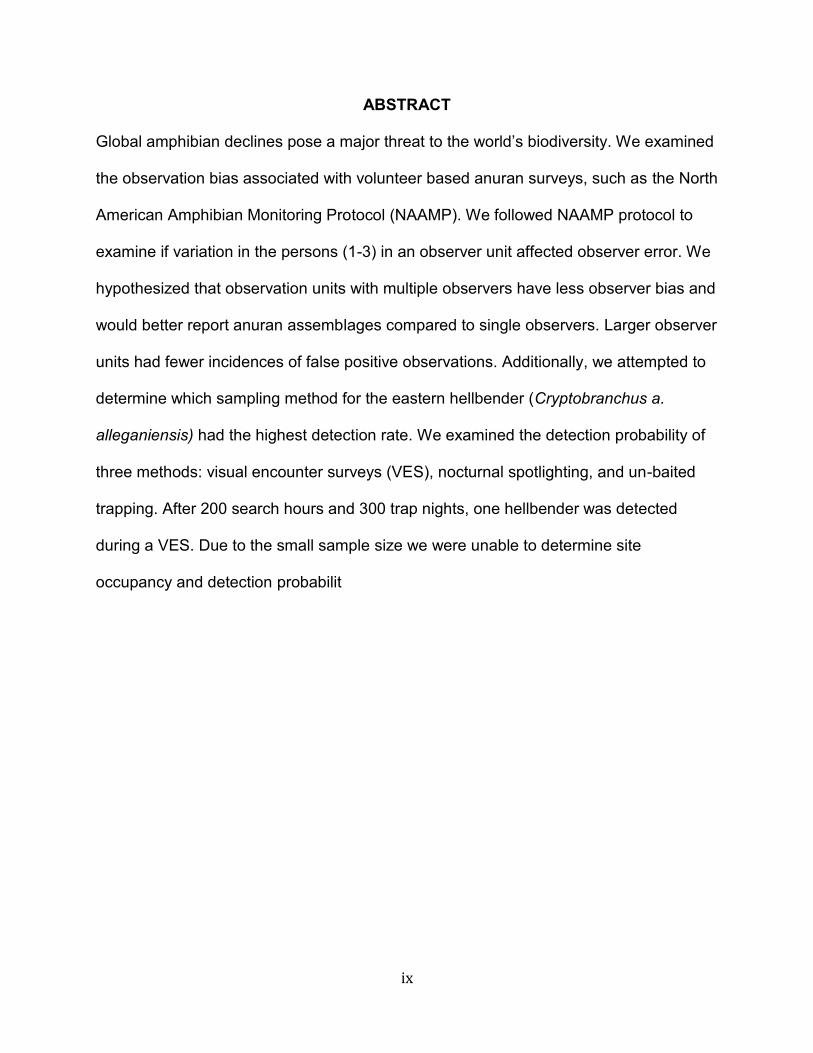
ABSTRACT
Global amphibian declines pose a major threat to the world’s biodiversity. We examined
the observation bias associated with volunteer based anuran surveys, such as the North
American Amphibian Monitoring Protocol (NAAMP). We followed NAAMP protocol to
examine if variation in the persons (1-3) in an observer unit affected observer error. We
hypothesized that observation units with multiple observers have less observer bias and
would better report anuran assemblages compared to single observers. Larger observer
units had fewer incidences of false positive observations. Additionally, we attempted to
determine which sampling method for the eastern hellbender (Cryptobranchus a.
alleganiensis) had the highest detection rate. We examined the detection probability of
three methods: visual encounter surveys (VES), nocturnal spotlighting, and un-baited
trapping. After 200 search hours and 300 trap nights, one hellbender was detected
during a VES. Due to the small sample size we were unable to determine site
occupancy and detection probabilit
1
CHAPTER 1
EVALUATING SAMPLING METHODS FOR THE EASTERN HELLBENDER
(CRYPTOBRANCHUS A. ALLEGANIENSIS) IN THE OHIO RIVER WATERSHED
Introduction
Imperfect detection, the inability to correctly determine the presence of a species,
is a logistical problem for many wildlife surveys (Bailey and Adams, 2005). When
dealing with rare or endangered species, imperfect detection often skews population
estimates (McKenzie et al., 2006). This is problematic because a species that is present
at a location but undetected by the surveyor is recorded as absent (i.e., false negative).
Thus, failing to detect a species can exaggerate rarity or suppress estimates of its
abundance (McKenzie et al., 2006). Further, low detection rates can hamper species
conservation when false negatives exclude a location from management efforts.
Conversely, when a species is falsely recorded as present or is misidentified (i.e., false
positive) population size and species’ range can be overestimated. These inflated
estimates can hamper proactive conservation strategies because they lead to false
assumptions about a species distribution and abundance. Numerous occupancy models
(e.g., single- and multiple-species models derived to fit a variety of data structures) have
been developed to account for detection probabilities (McKenzie et al., 2006). These
models provide an estimate of detection probability for a target species given a set of
variables associated with a specific sampling event, such as time of day, temperature,
and sampling method (McKenzie et al., 2006). Even the simplest applications of
2
occupancy modeling provide valuable insight into both spatial correlations of species
distributions and sampling covariates that influence the probability of detecting the
species. Detection probability is often considered a nuisance variable that is used to
increase the reliability of estimates for species occupancy, survival, and abundance
(Christy et al., 2010); however, statistical models that incorporate detection probability
can be used to develop survey protocols that maximize species detection. The Eastern
hellbender is a declining, cryptic species and efforts for its conservation have suffered
from its low detection probability, which makes populations difficult to survey.
Historically, the hellbender ranged from Southern New York to Mississippi with
isolated populations in Missouri and Arkansas (Nickerson and Mays, 1973; Petranka
1998). Declining populations throughout its range have resulted in a near threatened
classification by the ICUN red list of threatened species (IUCN, 2013). Despite the need
for effective monitoring protocols, a thorough assessment of hellbender sampling
techniques has not been conducted. Population declines have made the hellbender a
management priority in many states; however, the development of successful
management plans has been hindered by the hellbender’s cryptic nature, which makes
it difficult to detect.
Low detection rates have resulted in of a variety of sampling techniques with little
agreement on the success of each method. Rock flipping is one of the most successful
field sampling techniques (Santas et al., 2013). This method is disruptive to the stream
habitat (e.g., den sites and benthic microhabitat) and potentially harmful to the
hellbender (Burgmeier et al., 2011). Additionally lifting heavy rocks can cause observer
fatigue and possible injury (Nickerson et al., 2003). Thus, the risk of sampling bias is
3
high as the size of rocks sampled is dependent on the observers’ physical ability.
Electrofishing is a commonly used method with varied results. As it has the potential to
harm the hellbender and negatively impact fecundity, it was not a recommended
method by Browne et al. (2012). Additionally electroshocking requires use of costly
equipment e.g., backpack voltage generator, submersible electrodes (Browne et. al.,
2012) and increased observer training. In comparison, other less invasive, less
destructive sampling techniques include: un-baited traps, visual encounter surveys
(VES), and nocturnal spotlighting. The range of sampling methods has resulted in
discrepancies in the time required to sample, sampling costs, and overall detection
success. Not accounting for imperfect detection of hellbenders could potentially lead to
erroneous conclusions about its occupancy.
The goal of this study was to use hellbender detection rates to evaluate three
non-destructive sampling methods: visual encounter surveys, un-baited traps, and
nocturnal spotlighting. These methods are the least likely to suffer from sampling biases
because the search effort is not dependent on the observers’ physical strength. These
methods also are not dangerous to the hellbender, nor do they require a high degree of
sampling expertise. Therefore, they potentially provide less biased data and are more
likely to be acceptable in protected areas (e.g. national parks) or when concerning
protected populations.

4
Methods
2.1 Study Area. The Monongahela National Forest (MNF) is located in the
Allegheny Mountains of eastern West Virginia, USA. The forest encompasses 372,715
ha, with elevations ranging from approximately 305 - 1482 meters above sea level. The
headwaters of seven rivers (Monongahela, the Elk, the Tygart Valley, the Cheat, the
Greenbrier, the Potomac and the Gauley) are located within the forest boundary.
Logging and mining, as well as livestock grazing, are still common within the forest
boundary. The MNF is home to a variety of species, including nine federally listed
threatened and endangered species.
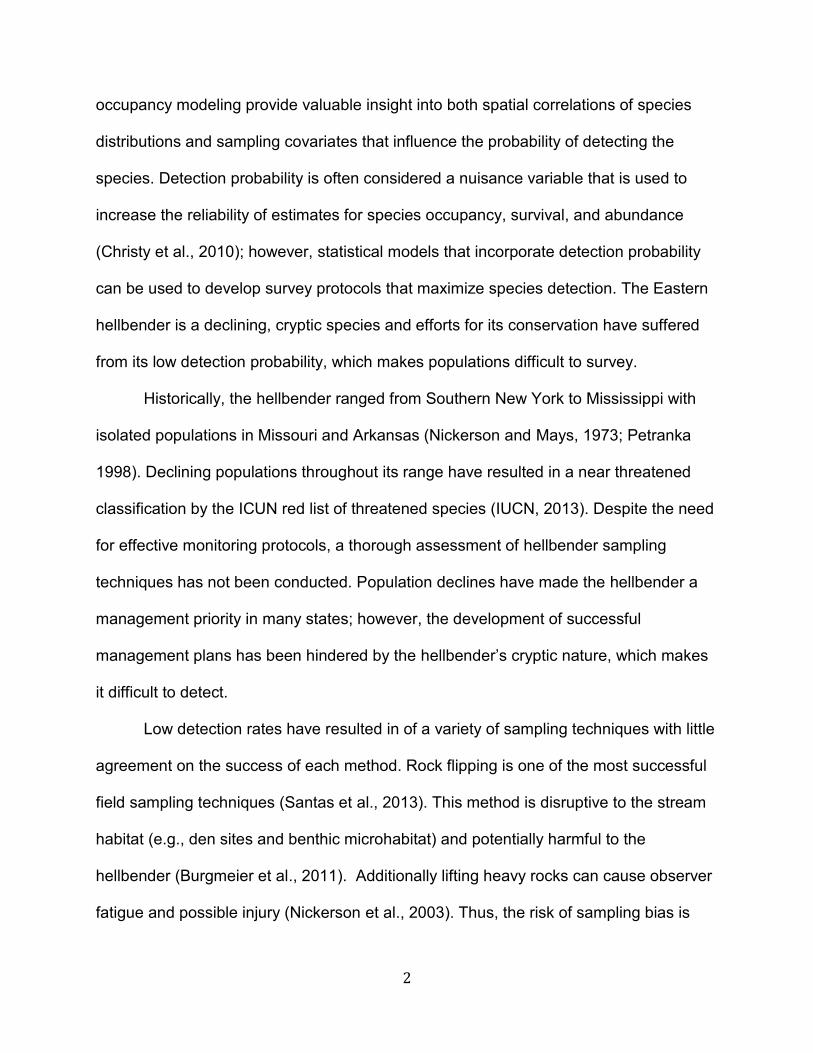
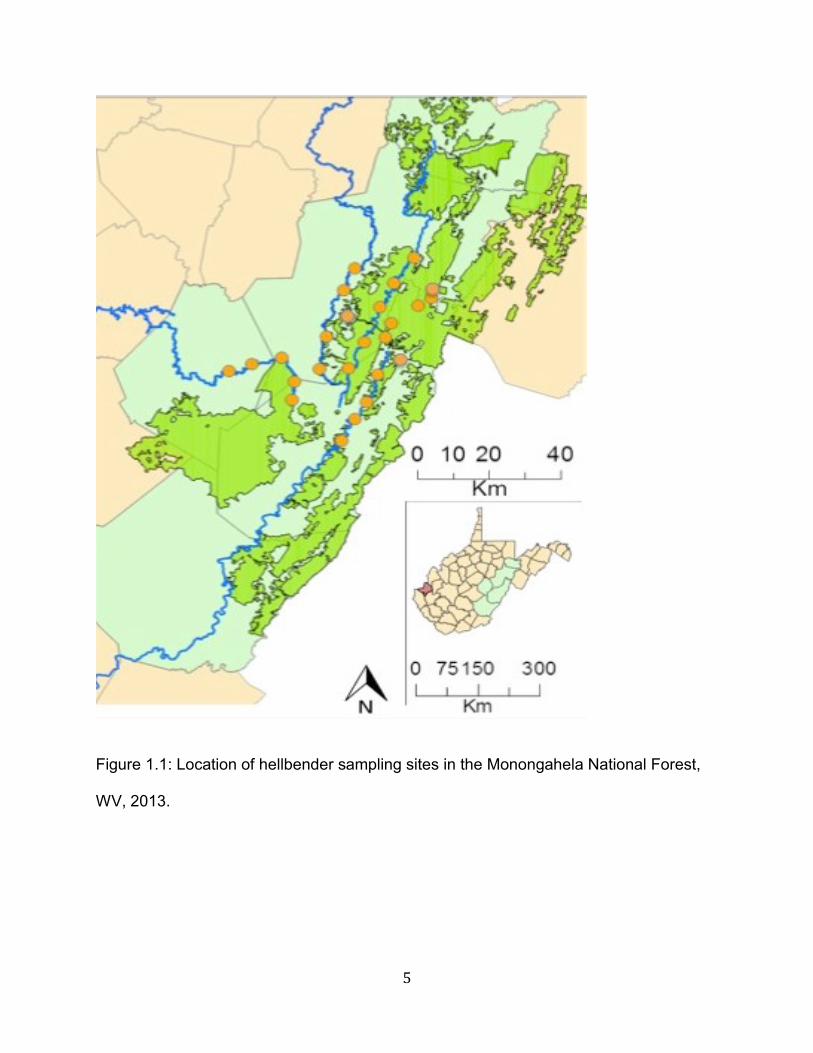
2.2 Sampling protocol. I sampled 25 sites in or near the Monongahela National
Forest from June to October 2013 (Figure 1.1). Five sites were selected in each of five
river systems: the Elk, Tygart Valley River, Shavers fork of the Cheat River and the East
and West fork of the Greenbrier River. I selected these rivers because records from the
West Virginia Biological Survey Museum (WVBM) indicated that hellbenders were
historically present. I used ArcGIS 10.1 (ESRI, Redlands, CA) to randomly select river
access points from road crossings. All sites were spaced at least 500m apart to ensure
independence and located at least 100m from a bridge.
5
Figure 1.1: Location of hellbender sampling sites in the Monongahela National Forest,
WV, 2013.
6
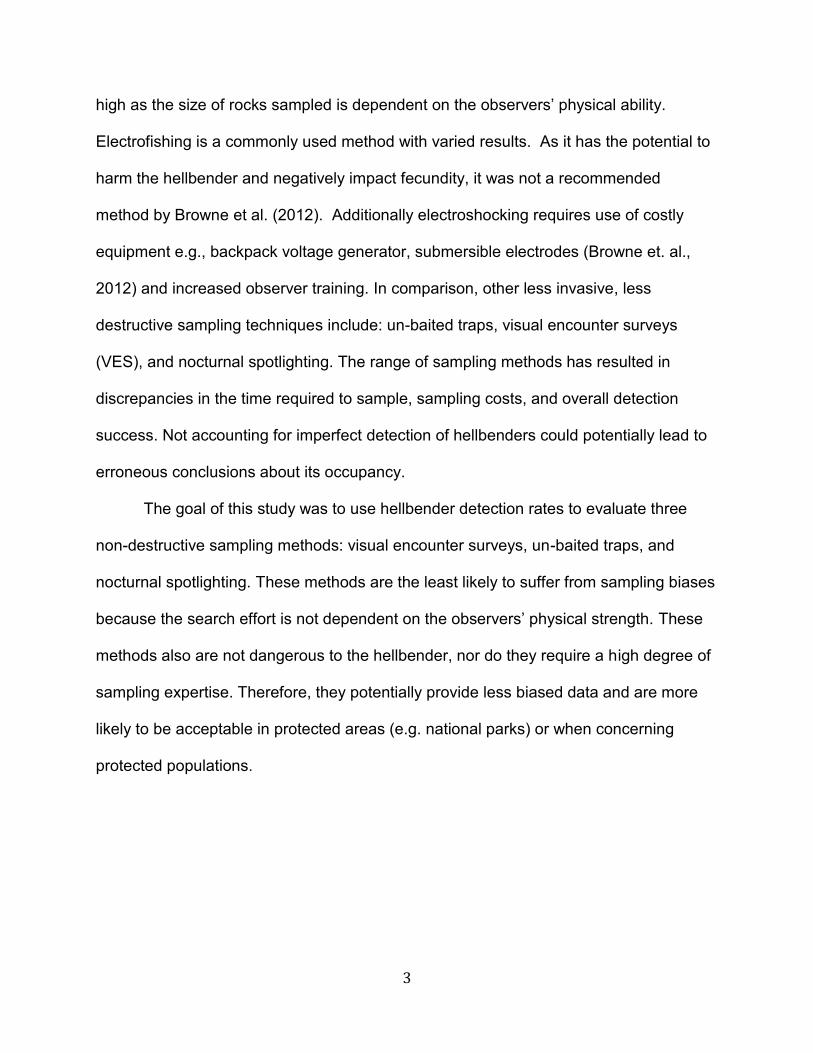
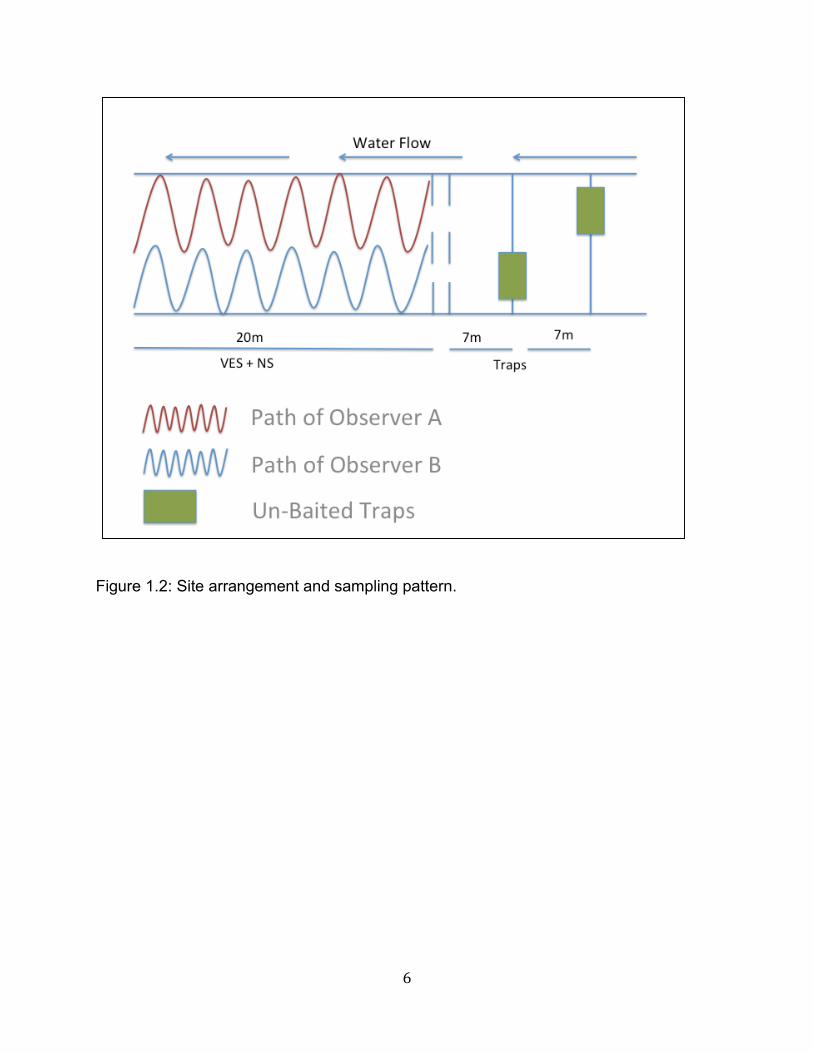
Figure 1.2: Site arrangement and sampling pattern.

7
2.3 Visual Encounter Surveys. I conducted diurnal visual encounter surveys
(VES) along each 20m stream transect. Two observers sampled the stream while
wearing polarized sunglasses (Spiderwire brand) and standing in shallow water to
minimize sun glare. We used a mask and snorkel in water deeper than 0.5 meters to
improve visibility. We sampled transects by moving upstream with each observer
searching a lateral half of the stream. We walked a zig-zag pattern (Figure 1.2) to
maximize the amount of stream searched without disturbing the habitat upstream.
2.4 Nocturnal Spotlighting. We conducted nocturnal spotlighting on the evening
following the VES. Both observers used a high-powered spotlight (Waypoint model
44910) with a sweeping motion and moved upstream while searching the stream
bottom.
2.5 Unbaited Traps. We set un-baited traps either 24 hours before or 12 hours
after the completion of the nocturnal survey. We based this decision solely on
scheduling logistics. We placed traps at 7 and 14 meters upstream from the end of the
20-m transect (Figure 1.2).
The traps were not in the stream during either the VES or nocturnal spotlighting
to maintain sampling method independence. Traps were deployed for approximately 24
hours (range 22 – 26 hrs.) with the trap entrance positioned upstream and randomly
located along transects.
2.6 Sampling Covariates. Sampling covariates were measured at the beginning
of each 20-m transect and prior to nocturnal spotlighting and VES sampling. We
recorded pH using the Oakton Double Junction model 10. Conductivity, temperature
and dissolved Oxygen were measured using a YSI (model 556). We measured water
8
depth at 2m, 6m, and 10m from the bank to monitor change in water level throughout
the sampling season. We measured surface flow by recording the time (seconds) it took
a Ping-Pong ball (Franklin brand) to travel 8m downstream in the swiftest portion of the
river. Due to an equipment malfunction we were unable to measure conductivity in the
field for the September sampling event, so we collected water samples in a 0.5 L plastic
bottle and tested the water for conductivity in the laboratory using a YSI conductivity
meter.
2.7 Site Covariates. Site covariates were recorded once. We measured canopy
cover in July using a GRS densitometer; we walked the center of the river taking a
reading at every meter within the 20m transects. We calculated percent canopy cover
by dividing the number of positive canopy cover measurements by total number of
readings. We performed a complete habitat assessment using the United States
Environmental Protection Agency’s (EPA) Wadeable Stream Rapid Assessment. We
evaluated the following habitat perimeters: Epifaunal Substrate Cover, Sediment
Disposition, Embeddedness and Velocity/Depth Regime, based on visual characteristics
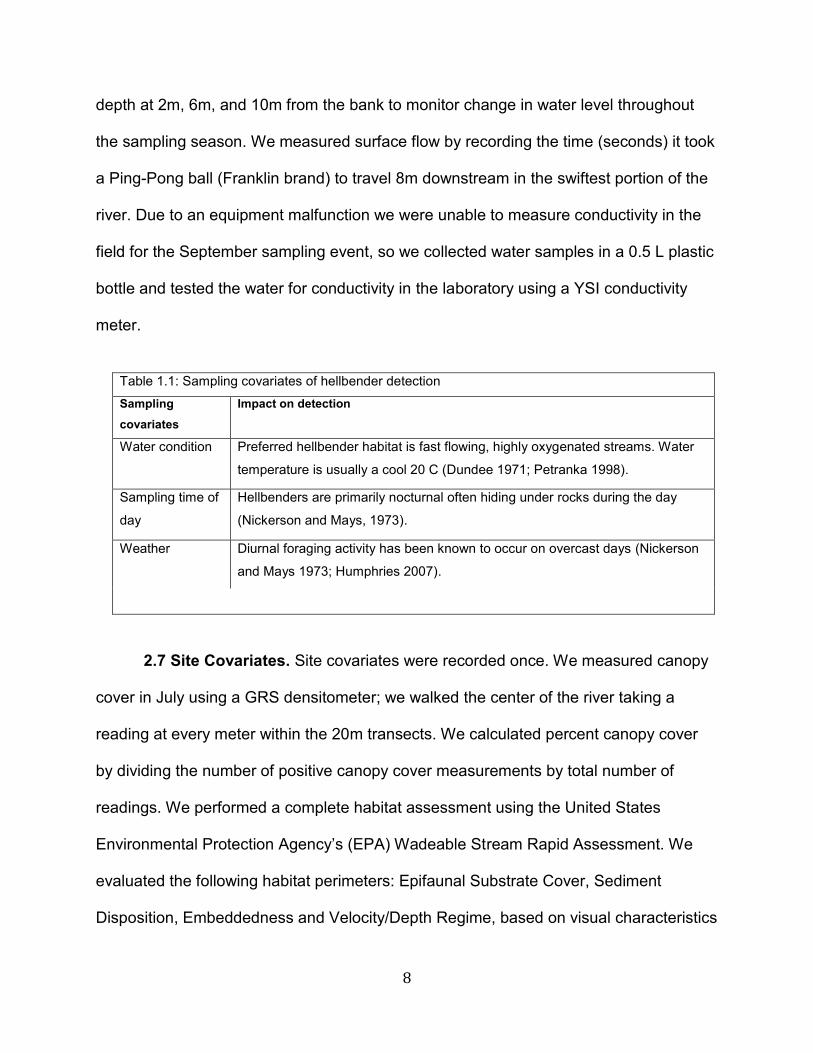
Table 1.1: Sampling covariates of hellbender detection
Sampling
covariates
Impact on detection
Water condition Preferred hellbender habitat is fast flowing, highly oxygenated streams. Water
temperature is usually a cool 20 C (Dundee 1971; Petranka 1998).
Sampling time of
day
Hellbenders are primarily nocturnal often hiding under rocks during the day
(Nickerson and Mays, 1973).
Weather Diurnal foraging activity has been known to occur on overcast days (Nickerson
and Mays 1973; Humphries 2007).
9
ranging from optimal to poor. We collected these measurements to rapidly evaluate the
physical habitat characteristics of our sites.
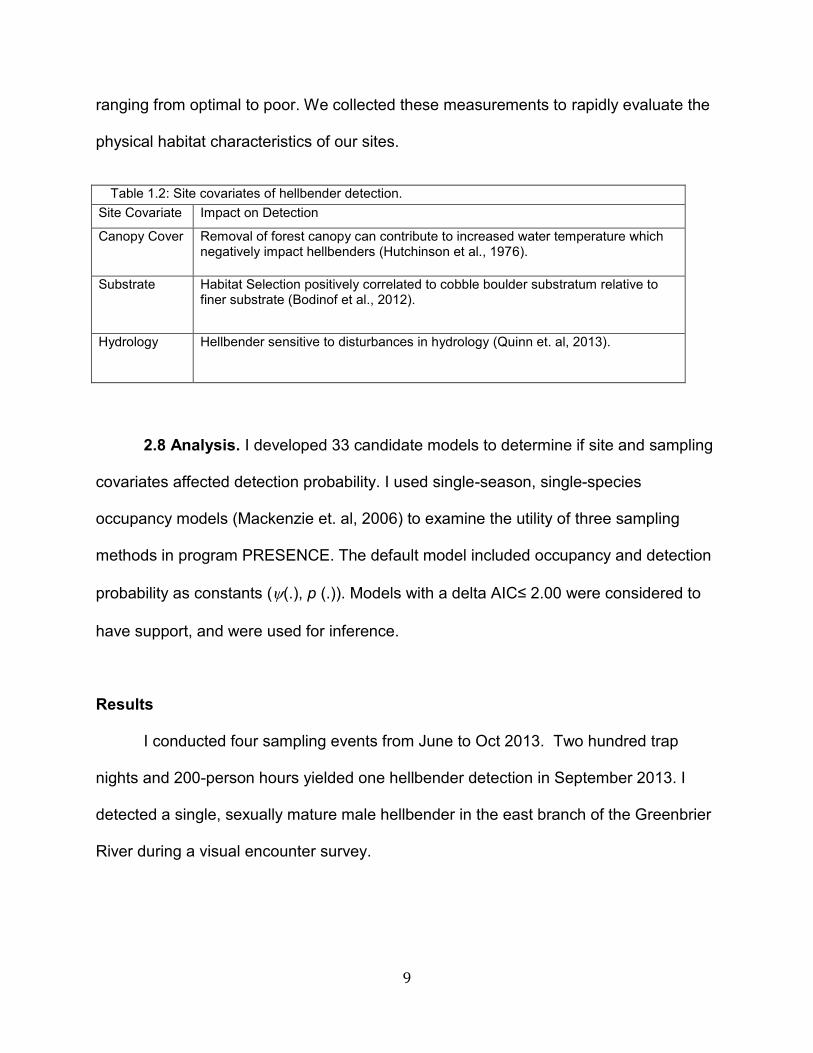
Table 1.2: Site covariates of hellbender detection.
Site Covariate Impact on Detection
Canopy Cover
Removal of forest canopy can contribute to increased water temperature which negatively impact hellbenders (Hutchinson et al., 1976).
Substrate
Habitat Selection positively correlated to cobble boulder substratum relative to finer substrate (Bodinof et al., 2012).
Hydrology
Hellbender sensitive to disturbances in hydrology (Quinn et. al, 2013).
2.8 Analysis. I developed 33 candidate models to determine if site and sampling
covariates affected detection probability. I used single-season, single-species
occupancy models (Mackenzie et. al, 2006) to examine the utility of three sampling
methods in program PRESENCE. The default model included occupancy and detection
probability as constants ((.), p (.)). Models with a delta AIC≤ 2.00 were considered to
have support, and were used for inference.
Results
I conducted four sampling events from June to Oct 2013. Two hundred trap
nights and 200-person hours yielded one hellbender detection in September 2013. I
detected a single, sexually mature male hellbender in the east branch of the Greenbrier
River during a visual encounter survey.
10
Discussion
I detected one hellbender, and thus I was unable to run the planned analysis.
Given the effort of my study—200 search hours and 200 trap nights—I expected higher
detection success. Our low detection rate could be explained by: a) poor performance of
chosen sampling methods or b) a decline in hellbender population potentially causing
extirpation in some streams. Poor stream conditions including high flow and turbidity
potentially impacted my detection success. Historically hellbenders have been well
sampled in West Virginia. Humphries and Pauley (2005) detected 44 hellbenders using
both diurnal flip and search and nocturnal surveys in a similar portion of the
Monongahela National Forest. Hellbender density within that region varied from 0.8 to
1.2 individuals per 100 m2 (Humphries and Pauley, 2005). Given the success of
Humphries and Pauley’s nocturnal surveys we conclude that nocturnal spotlighting is an
effective technique for this region.
Visual Encounter Surveys are beneficial because they have little impact on the
habitat or study animal. Additionally, minimal equipment or observer training is required.
Thus, VES surveys are cost effective and easily reproducible. However, this method is
heavily dependent upon ideal sampling conditions. I suspect that high flow and
increased turbidity negatively impacted my results limiting detection success. Therefore,
I recommend this method be used in combination with other methods.
Little is known about hellbender detection success of un-baited traps. However,
as hellbenders rely on chemoreception to detect prey (Townsend, 1882; Nickerson and
Mays, 1973; Nickerson et al., 2003) the success of trapping using various baits is well
studied. Trapping success widely depends on the type of bait used. Fresh Gizzard Shad

11
(Dorosoma cepedianum) has a high rate of detection; however, chicken liver, crayfish,
and carp have also been used (Browne et al, 2011). Baiting traps increases the risk of
introducing a foreign species or disease into the stream. I used baitless traps as
hellbenders have been detected in West Virginia using this method (Thomas K. Pauley,
personal communication). Secondly, if baitless trapping were a reliable method it would
reduce the risk of “bait-bucket “introductions. However, given lack of success I do not
recommend the use of unbaited traps as a reliable detection method.
As hellbenders can live up to 29 years, it is reasonable to assume continued site
occupancy 15 years following initial sampling. I concluded that hellbender populations
are in decline and extirpation has potentially occurred at one or more of my sites. I
suspect that although VES and unbaited traps are not the best methods of detection,
nocturnal spotlight is still an effective sampling technique. Therefore, I suspect that if
hellbenders occupied my sites in sizable numbers we would have detected them using
nocturnal spotlighting. The methodology of my study was sound; however, adjustments
need to be made for future attempts at hellbender occupancy studies. Additionally, I
suspected that above average precipitation resulting in high water levels, and increased
turbidity reduced visibility impacting my detection success.
12
CHAPTER 2
EXAMINING THE RISK OF OBSERVER BIAS IN ANURAN MONITORING
PROGRAMS
INTRODUCTION
The use of nonscientists in the collection of ecological data (citizen science) has
become increasingly important in species conservation (Tulloch et al., 2013). Citizen
science provides an opportunity to collect data previously considered logistically
impossible due to temporal and financial limitations (Dickinson et al., 2010). Therefore,
the use of volunteer-based surveys provides researchers with the ability to discern
large-scale biodiversity patterns (Bird et al., 2013), such as population trends and
abundance. Despite the benefits of citizen science, there is concern over the utility of
volunteer-based data in the scientific community (Bird et al., 2013). Critics of citizen
science note decreased precision in species identification and abundance due to
varying observer skill and commitment (Bird et al., 2013). Crall et al., (2011) warned of
biased data due to underrepresentation of species and nonrandom distribution of
observer effort. However, volunteer-based surveys are common monitoring strategies in
avian and anuran monitoring programs.
In response to global anuran declines, the North American Amphibian Monitoring
Program (NAAMP) was created to monitor the distributions and relative abundance of
amphibian populations in North America (Weir and Mossman, 2005). The NAAMP
protocol uses road-based observer surveys as a method to monitor trends in amphibian
populations (Scott and Woodward, 1994; Lotz and Allen, 2007). Standardized volunteer
13
listener surveys, such as NAAMP, are often cost effective, and repeatable. Additionally,
volunteer based programs foster public interest in amphibian conservation and they can
be applied across several geographic regions (Shearin et al., 2012).
Observer biases associated with citizen scientist-based call surveys have not
been well documented in anuran studies (Lotz and Allan, 2007). However, observer
bias in bird density surveys frequently occurs (Bart and Schoultz, 1984; Sauer et al.,
1994; McLaren and Cadman, 1999). Observer error can result in an inaccurate
assessment of anuran populations and trends as observers have the potential to: falsely
include a species not actually present (false positive), fail to detect a species that is
present (false negative), or incorrectly identify species (Lotz and Allen, 2007). While
many previous anuran call studies mention error in the form of a potential bias
(Kolozsvary and Swihart, 1999; Lehtinen et al., 1999; Pope et al., 2000; Zampella and
Bunnell, 2000; Crouch and Paton, 2002; Lotz and Allen, 2007), other studies fail to
mention the potential risk of observer bias and therefor fail to document it (Vandewalle
et al., 1996; Stevens et al, 2002; Lotz and Allen, 2007).
Inter-observer variability is a major problem with citizen science frog call survey
data (Hemesath, 1998). Inter-observer differences in detecting and identifying species is
a primary source of variation, and therefore bias, in call surveys (Droege and Eagel,
2005). Recent studies have concluded that there are little differences among observer
agreement during presence/absences anuran call surveys (Bishop et al., 1997; Shirose
et al., 1997; Hemesath, 1998; Genet and Sargent, 2003). However, inter-observer
agreement varies based on the frog species calling (Bishop et al., 1997; Shirose et al.,
1997; Genet and Sargent, 2003; Pierce and Gutzwiller, 2007), potentially reflecting
14
differences in chorus size and call volume (Pierce and Gutzwiller, 2007). The goal of
this study was to examine how observer group size (1-3 persons) affected the accuracy
of anuran auditory surveys using a group consensus approach. Furthermore, our goal
was to examine how species richness affected data accuracy. We hypothesized that
larger observer groups would have less observation error and would provide more
accurate results. Additionally, we hypothesized that observer error would be positively
associated with species richness. The results of our study will help researchers account
for citizen scientist participation and better design auditory survey sampling protocols.
Methods
2.1 Study Area. The James W. Webb Wildlife Center and Management Area is a
2374 ha property managed by the South Carolina Department of Natural Resources for
wildlife management. The area is located in Hampton County, SC, in the Coastal Plain,
a region that has one of the highest diversity of anurans in the United States (Reid and
Kilpatrick, 2013). The area is characterized by a range of upland and lowland
communities that include longleaf pine (Pinus palustris) flatwoods, bottomland
hardwood forests, and mixed pine hardwood forests. Land management practices
include high-frequency prescribed fire (spring and summer fires) to maintain pine
savannas and woodlands (Waldron et al., 2006). Upland isolated wetlands are
abundant in the upland pine communities, ranging in size from 0.25-0.75 ha.
2.2 Field Sampling. In March 2013, we conducted field surveys to examine
observer biases associated with volunteer-based anuran call surveys. We used the
NAAMP frog call quiz (Weir, 2009) to ensure that all observers were proficient at
identifying anuran species indigenous to the region.
15
We sampled ten isolated, upland wetlands that were randomly selected in the
study area and separated by at least 300m. Each night prior to sampling, we randomly
assigned observers (n=7) into one of two travel groups. One travel group included four
individuals and the other group included three individuals. Each travel group was then
divided into a single observer-sampling unit and a multiple-observer consensus-
sampling unit. Specifically, the three-member travel group included a single observer
and a two-observer consensus-sampling unit, and the four-member travel group
included a single observer and a three-observer consensus-sampling unit. At each
wetland, a different individual occupied the single-observer unit, and we randomized the
order in which individuals rotated through the single-observer unit. Therefore, on each
night, each individual occupied the single observer unit on at least two sampling
occasions in the four-member travel group and at least three sampling occasions in the
three-member travel group.
Prior to sampling, we placed acoustic data loggers (Wildlife Acoustics Song
Meter SM2+) in each wetland to record anuran vocalizations during the study. Data
loggers were synchronized to digital watches before the start of the study. Each night,
both travel groups sampled the same sampling route, but were separated by
approximately 45 minutes. We followed NAAMP guidelines for sampling (Weir and
Mossman, 2005). We started the survey at least 30 minutes after dark and the route
was completed no later than 1:00 am. After arriving at a site, the groups waited in
silence for 90 seconds before the start of a five-minute listening period, allowing
anurans to recover from potential disturbances associated with surveyor arrival. The
single-observer unit was separated from the consensus-sampling unit by at least five
16
meters and prohibited from communicating with the other observer-unit. The multiple-
observer sampling unit used a consensus (i.e., majority agreement) approach to
recording the anuran species heard at the wetland. We recorded all anurans detected in
the target wetland. After the completion of the 5-minute listening period, we recorded air
temperature using a hand held thermometer and wind speed was recorded using the
Beaufort Wind Code (World Meteorological Organization, 1970).
2.3 Data Analysis. Two individuals independently reviewed data collected from
acoustic data loggers using Raven Pro 1.4 bioacoustics software (Bioacoustics
Research Program, 2011). Both listeners had to agree on the species that called during
the five minute listening period before we compared it to the observations made in the
field by the observer units. Following agreement of results, acoustic logger data were
used as the reference for assessing observer error. We labeled field observations that
reported a species that was not observed on the data loggers as type I errors (false
positive), whereas species heard on the data loggers that were not recorded by the
observer units were labeled as type II errors (false negative). For statistical analysis, we
used multinomial logistic regression in the GLIMMIX procedure in SAS 9.3. Our data
were coded so that the response variable included three levels that quantified the type
of observer error (i.e., Type one error = 1, type 2 error = 2 and 0 = no errors were
committed). We examined four models that included size and richness as predictors,
error as the response, and travel group as the random effect. We used the Laplace
Approximation (Raudenbush et al., 2000) to evaluate model likelihoods, and we
identified top performing models using AICc model selection (Burnham and Anderson,
2002).
17
Results
We detected seven species throughout the course of the study: Pseduacris
nigrita, P. ornata, P. brimleyi, P. crucifer, P. ocularis, Lithobates sphenocephalus, and
Acris crepitans. Data logger observations from two wetlands were lost due to a technical
error and thus not included in the analysis. We analyzed 66 observer unit observations.
The top-performing model included species richness and observer group size as
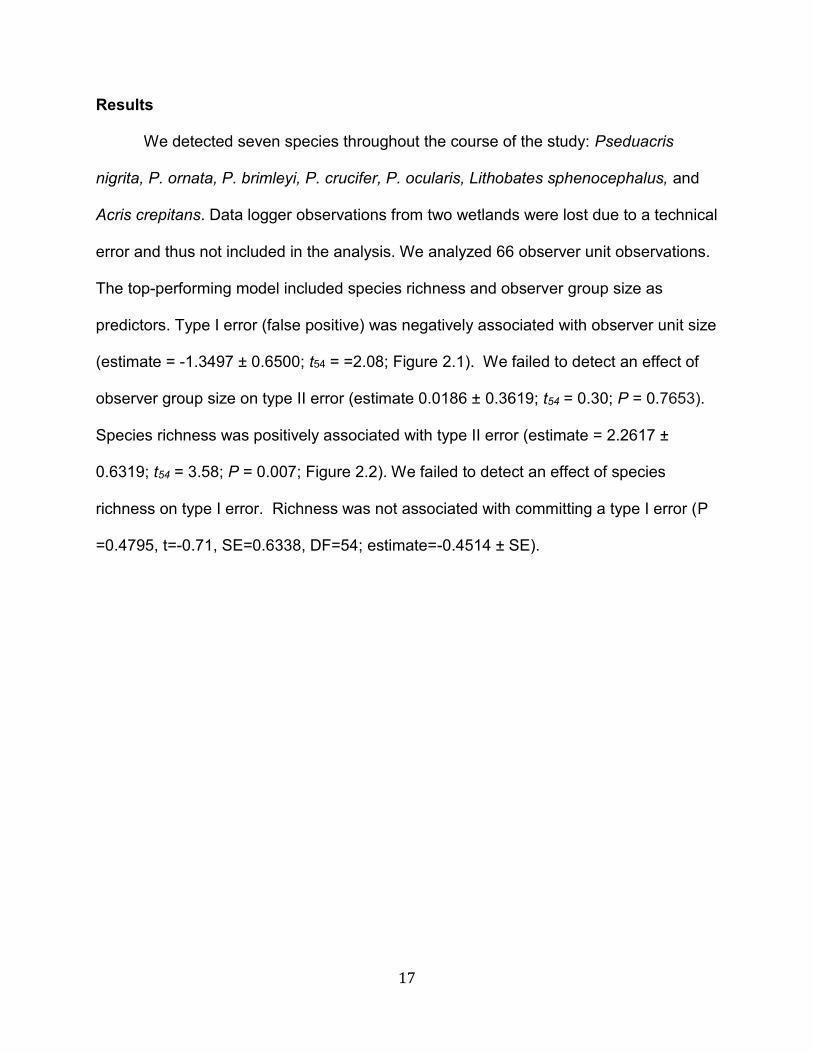
predictors. Type I error (false positive) was negatively associated with observer unit size
(estimate = -1.3497 ± 0.6500; t54 = =2.08; Figure 2.1). We failed to detect an effect of
observer group size on type II error (estimate 0.0186 ± 0.3619; t54 = 0.30; P = 0.7653).
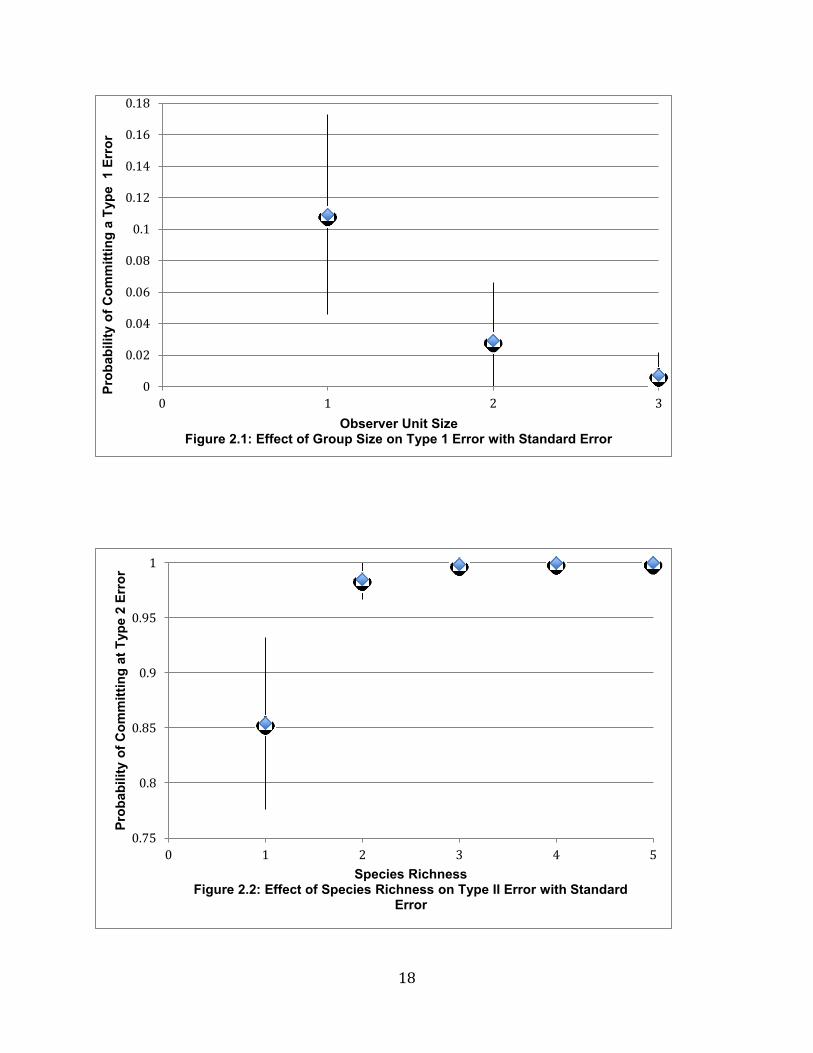
Species richness was positively associated with type II error (estimate = 2.2617 ±
0.6319; t54 = 3.58; P = 0.007; Figure 2.2). We failed to detect an effect of species
richness on type I error. Richness was not associated with committing a type I error (P
=0.4795, t=-0.71, SE=0.6338, DF=54; estimate=-0.4514 ± SE).
18
0
0.02
0.04
0.06
0.08
0.1
0.12
0.14
0.16
0.18
0 1 2 3
Pro
bab
ilit
y o
f C
om
mit
tin
g a
Typ
e
1 E
rro
r
Observer Unit SizeFigure 2.1: Effect of Group Size on Type 1 Error with Standard Error
0.75
0.8
0.85
0.9
0.95
1
0 1 2 3 4 5
Pro
bab
ilit
y o
f C
om
mit
tin
g a
t T
yp
e 2
Err
or
Species RichnessFigure 2.2: Effect of Species Richness on Type II Error with Standard
Error
19
Discussion
The results of our study support our hypothesis that consensus sampling
reduces the risk of observer error, improving the accuracy of citizen science based
monitoring programs. The risk of committing a type I error (false positive) decreased as
the number of observers increased (Figure 2.1). We suspect multiple-observer units
yielded more accurate results because they were able to discuss questionable
detections. Specifically, anurans that were not detected by every observer may have
been disregarded in favor of a more conservative result. The current NAAMP protocol
requires that observations are made independently of other observers (Weir and
Mossman, 2005). However, we suggest that the occurrence of type I error would
decrease if the protocol allowed for consensus sampling, which supports
recommendations by Nichols et al., 2000, Grant et al., 2005, Lotz and Allen, 2007, who
suggest that bias could be minimized by adopting two-person observation teams.
Inclusion of type I errors in a dataset can obscure anuran trends in long-term
management projects (Lotz and Allen, 2007; McClintock et al., 2010). Furthermore,
imperfect detection of anurans can result in biased estimates of abundance and species
richness, (Tanadini and Schmidt, 2011). In the case of false positives, overestimation of
species range and/or abundance can occur, leading to false conclusions about a
species population status and abundance. Consequently, our results did not support an
association between observer unit size and type II errors (false negative).
Our results indicated that consensus sampling did not reduce the occurrence of
type II errors, which were found to be positively associated with species richness. It is
possible that anuran calls are harder to detect in a multi-species chorus. Species with
20
distinct calls such as Spring Peepers (P. crucifer) and Southern Chorus Frogs (P.
feriarum) were often present in large numbers that made less conspicuous calls i.e.,
Brimleys Chorus Frogs (P.brimleyi) and Cricket Frogs (Acris Spp.), harder to detect.
Observer experience can impact anuran detection during call surveys (Weir et al.,
2005); however, we assume that observer experience had no effect on our study
because all observers completed the NAAMP frog quiz prior to our study. As our study
was conducted early in the breeding season we detected fewer species than past
anuran studies (Burton et al., 2006; Pierce and Gutzwiller, 2007; Weir et al., 2005) .Yet,
despite the limited diversity encountered, we conclude that call surveys at ponds with
greater species richness are more likely to suffer from type II error regardless of the
number of observers.
Citizen science based monitoring programs are beneficial as they a) allow for the
data collection that would otherwise be financially unattainable and b) encourage public
participation in ecological studies (Dickinson et al., 2010). However, our results indicate
that consensus sampling does not reduce type II errors in ponds with high species
richness. Therefore, we suggest that acoustic data loggers are the best option for sites
with high species diversity as call data can be reviewed multiple times. Additionally, we
recommend that citizen science based call surveys such as NAAMP are amended to
include consensus sampling, as multiple observers are effective at reducing type I error.
21
LITERATURE CITED
Bailey, L., and M.J Adams. 2005. Occupancy Models to Study Wildlife: U.S. Geological Survey Fact Sheet 2005-3096.6.
Bart, J., and J. D. Schoultz. 1984. Reliability of singing bird surveys: changes in observer efficiency with avian density. Auk 101: 307–318.
Bioacoustics Research Program. 2011. Raven Pro: Interactive Sound Analysis Software (Version 1.4) [Computer software]. Ithaca, NY: The Cornell Lab of Ornithology. http://www.birds.cornell.edu/raven/. Accessed 4 Mar 2014.
Bird, T.J., A.E. Bates, J.S. Lefcheck, N.A. Hill, G.J. Edgar, R.D. Stuart-Smith, et al.,
2014. Statistical solutions for error and bias in global citizen science datasets. Biol. Conservation. 173: 144–154.
Bodinof, C. M., J. T. Briggler, R. E. Junge, J. Berubger, M. D. Wanner, C. D. Schuette,
and J. J. Millspaugh. 2012. Habitat attributes associated with short‐term settlement of Ozark hellbender (Cryptobranchus alleganiensis bishopi) salamanders following translocation to the wild. Freshwater Biology 57(1): 178-192.
Browne, R. K., H. Li, D. Mcginnity, S. Okada, W. Zhenghuan, C.M. Bodinof, K. J. Irwin, A. McMillan, and J.T. Briggler. 2011. Survey techniques for giant salamanders and other aquatic Caudata. Amphibian& Reptile Conservation 5: 1–16.
Browne R. et al. 2012. The giant salamanders (Cryptobranchidae): Part A.
paleontology, phylogeny, genetics. Amphibian and Reptile Conservation. 5(4): 17-29.
Burgmeier, N. G., T. M. Sutton, and R. N. Williams. 2011. Spatial ecology of the Eastern Hellbender (Cryptobranchus alleganiensis alleganiensis) in Indiana. Herpetologica 67(2): 135–145.
22
Burnham, K P. and D. R Anderson. 2002. Model Selection and Multimodel Inference: A Practical Information-Theoretical Approach. 2d ed. New York: Springer-Verlag.
Burton, E. C., M. J. Gray, and A. C. Schmutzer. 2006. Comparison of anuran call survey durations in Tennessee wetlands. Proceedings of the Annual Conference of the Southeastern Association of Fish and Wildlife Agencies. 60: 15–18.
Crall, A.W., G. Newman, T. J. Stohlgren, K. A. Holfelder, J. Graham, and D.M. Waller. 2011. Assessing citizen science data quality: a case study. Conservation. Letters. 4: 433–442.
Christy, M. T., A. A Yackel Adams, G. H. Rodda, J. A. Savidge, and C. L. Tyrrell. 2010. Modelling detection probabilities to evaluate management and control tools for an invasive species. Journal of Applied Ecology 47: 106–113.
Crouch, W. B., III, and P. W. C. Paton. 2002. Assessing the use of call surveys to monitor breeding anurans in Rhode Island. Journal of Herpetology 36: 185–192.
Dickinson, J. L., B. Zuckerberg, and D. N. Bonter. 2010. Citizen science as an Ecological Research Tool: challenges and benefits. Annual Review of Ecology, Evolution and Systematics. 41:149–172.
Droege, S. and P. Eagle. 2005. Evaluating Calling Surveys. In Lannoo, M.J., editor. Amphibian Declines: The Conservation Status Of United States Species. Berkeley, California. University of California Press. p. 314 – 319.
Dundee, H.A. 1971. Cryptobranchus alleganiensis. Catalogue of American Amphibians
and Reptiles. 101: 1-4.
ESRI 2011. ArcGIS Desktop: Release 10.1. Redlands, CA: Environmental Systems Research Institute

23
Grant, E. H. C., R. E. Jung, J. D. Nichols, and J. E. Hines. 2005. Double- observer approach to estimating egg mass abundance of pool-breeding amphibians. Wetlands ecology and management. 13: 305–320.
Genet, K. S., and L. G. Sargent. 2003. Evaluation of methods and data quality from a volunteer-based amphibian call survey. Wildlife Society Bulletin. 31: 703–714.
Hemesath, L. M. 1998. Iowa’s frog and toad survey, 1991–1994. In Lannoo M. J., editor. Status and conservation of Midwestern amphibians. Iowa City, Iowa. University of Iowa Press. p. 206–216.
Humphries, W. J. 2007. Diurnal seasonal activity of Cryptobranchus alleganiensis (hellbender) in North Carolina. Southeastern Naturalist. 6: 135–140.
Humphries, W.J., and T.K, Pauley. 2005, Life history of the Hellbender, Cryptobranchus alleganiensis. in a West Virginia stream. American Midland Naturalist. 154(1): 135-142.
Hutchison, V. H., and L. G. Hill. 1976. Thermal selection in the hellbender, Cryptobranchus alleganiensis, and the mudpuppy, Necturus maculosus. Herpetologica. 32(3): 327-331.
International Union for the Conservation of Nature (IUCN). 2013. The IUCN Red List of Threatened Species. Version 2013.2. http://www.iucnredlist.org/. Accessed 21 November 2013.
Kolozsvary, M. B., and R. K. Swihart. 1999. Habitat fragmentation and the distribution of amphibians: patch and landscape correlates in farmland. Canadian Journal of Zoology. 77: 1288–1299.
Lehtinen, R. M., S. M. Galatowitsch, and J. R. Tester. 1999. Consequences of habitat loss and fragmentation for wetland amphibian assemblages. Wetlands. 19: 1–12.

24
Lotz, A. and C. R. Allen. 2007. Observer bias in anuran call surveys. Journal of Wildlife Management. 71: 675–679.
MacKenzie, D.I., J. D. Nichols, J. A. Royle, K. H. Pollock, L. L. Bailey, and J. E. Hines. 2006. Occupancy estimation and modeling; inferring patterns and dynamics of species occurrence. San Diego, CA. Elsevier.
McClintock, B.T., L.L. Bailey, K.H. Pollock, and T.R. Simons. 2010a. Experimental investigation of observation error in anuran call surveys. Journal of Wildlife Management. 74: 1882–1893.
McLaren, M. A., and M. D. Cadman. 1999. Can novice volunteers provide credible data for bird surveys requiring song identifications? Journal of Field Ornithology. 70: 481–490.
Nichols, J. D., J. E. Hines, J. R. Sauer, F. W. Fallon, J. E. Fallon, and P. J. Heglund. 2000. A double-observer approach for estimating detection probability and abundance from point counts. Auk. 117: 393–408.
Nickerson, M.A. and C.E. Mays. 1973. The hellbenders: North American giant salamanders. Milwaukee Public Museum Publications in Biology and Geology. 1: 106.
Nickerson, M. A., K. L. Krysko, and R. D. Owen. 2003. Ecological status of the hellbender (Cryptobranchus alleganiensis) and the mudpuppy (Necturus maculosus) salamanders in the Great Smoky Mountains National Park. J. North Carolina Acad. Sci. 118: 27- 34.
Petranka, J.W. 1998. Salamanders of the United States and Canada. Washington, D.C. Smithsonian Institution Press. p. 587.

25
Pierce, B.A., and K.J. Gutzwiller. 2007. Interobserver variation in frog call surveys. Journal of Herpetology. 41: 424-429.
Pope, S. E., L. Fahrig, and H. G. Merriam. 2000. Landscape complementation and metapopulation effects on leopard frog populations. Ecology. 81: 2498–2508.
Quinn, S. A., J.P Gibbs, M. H. Hall, and P.J. Petokas. 2013. Multiscale Factors Influencing Distribution of the Eastern Hellbender Salamander (Cryptobranchus alleganiensis alleganiensis) in the Northern Segment of Its Range. Journal of Herpetology. 47(1): 78-84.
Raudenbush S.W., M. L. Yang and M. Yosef. 2000. Maximum likelihood for generalized linear models with nested random effects via high order multivariate LaPlace approximation. J Comput. And Graph. Stat. 9: 141- 157.
Santas, A.J., T. Persaud, B.A Wolfe, and J.M. Bauman. 2013. Noninvasive Method for a Statewide Survey of Eastern Hellbenders Cryptobranchus alleganiensis Using Environmental DNA. International Journal of Zoology. 2013: 1-6.
Sauer, J. R., B. G. Peterjohn, and W. A. Link. 1994. Observer differences in the North American Breeding Bird Survey. Auk. 111: 50–62.
Scott, N. J., and B. D. Woodward. 1994. Surveys at breeding sites. In Measuring and monitoring biological diversity: standard methods for amphibians. In Heyer W. R., M. A. Donnelly, R. W. McDiarmid, L. C. Hayek, and M. S. Foster, editors. Washington, D.C. Smithsonian Press. p. 118-125.
Shearin, A. F., A. J. K. Calhoun, and C. S. Loftin. 2012. Evaluation of Listener-Based Anuran Surveys with Automated Audio Recording Devices. Wetlands 32(4): 737-751.
26
Shirose, L. J., C. A. Bishop, D. M. Green, C. J. MacDonald, R. J. Brooks, and N. J.
Heleferty. 1997. Validation tests of an amphibian call count survey technique in Ontario, Canada. Herpetologica. 53: 312–320.
Stevens, C. E., A. W. Diamond, and T. S. Gabor. 2002. Anuran call surveys on small wetlands in Prince Edward Island, Canada restored by dredging of sediments. Wetlands 22: 90–99.
Tanadini, L.G. and B.R. Schmidt. 2011. Population size influences amphibian detection probability: implications for biodiversity monitoring programs. PLoS One. 6 (12).
Townsend, C.H. 1882. Habits of the Menopoma. American Naturalist. 16:139-140.
Tulloch, A. I., H. P Possingham , L. N. Joseph, J. Szabo, and T. G. Martin. 2013. Realizing the full potential of citizen science monitoring programs. Biological Conservation, 165: 128-138
Vandewalle, T. J., K. K. Sutton, and J. L. Christiansen. 1996. Pseudacris crucifer: an Iowa case history study of an amphibian call survey. Herpetological Review 27: 183–185.
Waldron, J. L, S.H Bennett, S.M Welch., M.E Dorcas, J.D Lanham and W. Kalinowsky. 2006. Habitat specificity and home-range size as attributes of species vulnerability to extinction: a case study using sympatric rattlesnakes. Animal Conservation 9: 414-420.
Weir, L. A. 2009. USGS frog quizzes. http://www.pwrc.usgs.gov/frogquiz/. Accessed 16 Mar 2013.

27
Weir, L. A. and M. J. Mossman. 2005. North American Amphibian Monitoring Program (NAAMP). In Lannoo M., editor. Amphibian Declines: conservation status of United States amphibians. University of California Press. p. 307-313
Weir, L. A., J. A. Royle, P. Nanjappa, and R. E. Jung. 2005. Modeling anuran detection
and site occupancy on North American Amphibian Monitoring Program (NAAMP) routes in Maryland. Journal of Herpetology 39(4): 627-639.
World Meteorological Organization, 1970. Reports on Marine Science Affairs, Report
No. 3, The Beaufort Scale of Wind Force. Geneva, Switzerland. WMO.
Zampella, R. A., and J. F. Bunnell. 2000. The distribution of anurans in two river systems of a coastal plain watershed. Journal of Herpetology 34: 210–221.
28

29
Kelli M. Herrick 4815 Spring Road
Huntington, WV 25705 (440) 714-2200
Education: Master of Science- Biological Science Advisor: Dr. Jayme Waldron Marshall University Huntington WV, 25701 Bachelors of Science, cum laude-Biological Science Cleveland State University Cleveland OH, 44115
Professional and Academic Positions: 2013: Graduate Research Fellow: Department of Biological Sciences, Marshall University Duties Included: Design and implement research project, supervise fist year graduate students in field sites, sample for aquatic amphibians using multiple detection techniques, take stream measurements, analyze data, author manuscript 2012-2014: Graduate Teaching Assistant: Department of Biological Sciences, Marshall University. Duties Included: Lecturing to undergraduate students on information needed for laboratory experiment, supervising experiments, grading laboratory worksheets, and tutoring students on lab and lecture material. 2011: Aquatic Biology Technician Natural Resources Department, Cleveland Metroparks. Duties Included: Assist in the assessment of low order streams systems using Ohio FWEPA protocol, identify amphibians, fish, and invertebrates to species, aid in removal of nuisance fish species from inland lakes, stock game fish in park lakes
30
Research Experience: 2014: Evaluating the Risk of Observer Bias in Citizen Science Surveys Department of Biological Science, Marshall University. Attempted to assess the risk of observer bias and false positive detection when using the Current NAAMP (North American Amphibian Monitoring Program) frog call survey protocol. 2013-2014: Morphological differences of Diadophis spp. in West Virginia Department of Biological Science, Marshall University. Assisted Dr. Thomas Pauley in a corporative effort with the Pennsylvania DNA examining morphological and gonadal difference in Ringneck snakes (Diadophis punctatus) 2013-2014: Evaluating the Effectiveness of Sampling Methods for the Eastern Hellbender Department of Biological Science, Marshall University Identified which non-invasive sampling techniques have the highest incidence of detection for the E. hellbender (Cryptobranchus a. alleganiensis) in the Ohio River watershed. 2013: South Carolina Snake Occupancy Department of Biological Science, Marshall University. Assisted Dr. Jayme Waldron in her research on the Eastern Diamondback Rattlesnake (Crotalus adamanteus). 2009- 2010: The Effects the Invasive Earthworm Amynthas Spp. on Plethodon cinereus Department of Biological Science, Cleveland State University. Assisted Dr. B. Michael Walton in his research identifying a potential relationship between Plethodon cinereus and Amynthas Spp
References:
Jayme Waldron, PhD Assistant Professor Marshall University Phone: (304) 696-3361 Email: [email protected] Thomas K. Pauley, PhD Emeritus Professor Marshall University Phone: (304) 696-2376 Email: [email protected]
Michael Durkalec
Aquatic Biologist
Cleveland Metroparks
Phone: (216) 635-3200
Email: [email protected]
Shane M. Welch, PhD Adjunct Professor Marshall University [email protected]

31