Embed Size (px)
Citation preview
Sample Morningstar Equity Research Reports Table of Contents
2 Stock Report 10 Institutional Company Report 28 DCF Model 35 Pre-IPO Report 43 Post-IPO Report 50 Tear Sheet

?
Microsoft Corporation MSFT [Nasdaq] | QQQ
TM
Last Price Fair Value Consider Buy Consider Sell Uncertainty Economic Moat Stewardship Morningstar Credit Rating Industry28.66 USD 32.00 USD 22.40 USD 44.80 USD Medium Wide A Software - Infrastructure AAA
Currency amounts expressed with "$"are in U.S. dollars (USD) unlessotherwise denoted.
Strong Start to 2011 for Microsoft
by Toan TranAssociate DirectorAnalysts covering this company do notown its stock.
Pricing data through January 18, 2011.Rating updated as ofJanuary 18, 2011.
07 08 09 10 11
16.0
25.0
35.0Stock Price
Analyst Note Oct. 28, 2010
Microsoft reported 13% year-over-year growth to $16.2billion of revenue for the first quarter of fiscal 2011 as thecompany’s three main businesses performed very well.The Windows division continued to do well as the wave ofcorporate PC refreshes rolls through. The introduction ofOffice 2010 helped propel the business division to sales of$5.1 billion, up 13.5% from $4.5 billion in the first quarterof 2010. Another bright spot was the server & tooldivision, which recorded the second straight quarter ofdouble-digit growth after being flat for the preceding sixquarters. There have been some significant executive departures inrecent months that raise uncertainty about Microsoft’sstrategic direction. Stephen Elop, head of Microsoft’sbusiness division, left to take the CEO position at Nokia.Ray Ozzie, who was Bill Gates’ anointed successor aschief software architect, will be leaving the company. Thechief software architect role will not be filled by areplacement. At its core, Microsoft is an extremelycapable enterprise software company, an ability that rivalssuch as Google and Apple cannot match. We expect thatMicrosoft will be entrenched in enterprise for a very longtime. However, the company has missed on very largeopportunities such as search and mobile. Without a cleartechnical leader that is respected by the engineers atMicrosoft, we believe the company will likely continue tostruggle outside of its three core businesses. Thesis May 07, 2010
The disruptive change brought about by cloud computingwill challenge Microsoft’s core Windows and Officefranchises, but it will also present the firm with anopportunity to capture a larger share of enterprise ITspending. Cloud computing is a singular threat to Microsoft because
it allows users to access their information andapplications from a multitude of hardware and softwareplatforms. This strikes directly at the Windows platform,which is the foundation of Microsoft’s moat. We havealready seen early evidence of the cloud’s effects in theconsumer market, such as the resurgence of Apple’sMacintosh and the growing popularity of new devices likethe iPad. While we expect Microsoft to earn substantialprofits from Windows and Office for many years to come,the arrival of alternatives will begin to erode thecompany’s desktop-based moat. A cloud computing world does challenge Microsoft, but italso presents new opportunities. Microsoft is one of thefew firms with the financial and technical resources tobuild the massive datacenters that form the fabric of thecloud. In addition, Microsoft’s existing ecosystem ofthird-party software developers is a valuable asset thathelps get its Azure cloud computing platform off to arunning start. If Microsoft can build Azure into a dominantcloud platform, a new avenue of growth will be opened, as the company moves from a being a mere softwarevendor to a provider of the entire enterprise ITinfrastructure. Cloud datacenters can reap massive scaleeconomies in hardware and personnel costs, and this isvalue that Microsoft can extract for shareholders. On the other hand, Microsoft has thus far been reluctantto fully embrace the software-as-a-service model that isenabled by cloud computing. Understandably, the firmwants to protect the cash cows of Windows and Office,but this may prove to be a handicap against competitorsunconstrained by the need to protect legacy assets. Forexample, Google Apps is currently priced at roughly half ofMicrosoft’s hosted Exchange e-mail service. Although Microsoft is positioning itself for the cloud,during the next few years, its financial performance willbe driven by a strong product cycle. Windows 7 hasperformed well, and the end of mainstream technicalsupport for Windows XP should help drive greatercorporate adoption of Windows 7. Windows Server 2008R2, which adds important virtualization technologies, was
SAMPLE
Microsoft Corporation MSFT [Nasdaq] | QQQ
TM
Last Price Fair Value Consider Buy Consider Sell Uncertainty Economic Moat Stewardship Morningstar Credit Rating Industry28.66 USD 32.00 USD 22.40 USD 44.80 USD Medium Wide A Software - Infrastructure AAA
Close Competitors Currency(Mil) Market Cap TTM Sales Oper Income Net Income
Microsoft Corporation
Apple, Inc.
Google, Inc.
Oracle Corporation
USD
USD
USD
USD
245,201 65,759 26,732 20,596
312,481 65,225 18,385 14,013
204,538 27,555 9,880 7,936
159,303 31,993 9,831 6,776
Morningstar data as of January 18, 2011.
released in late 2009, and Office 2010, the next version ofthe popular productivity suite, is scheduled to follow laterin 2010. Valuation, Growth and Profitability Our fair value estimate for Microsoft is $32 per share. We have extended our explicit forecast for Microsoft out to2019 to incorporate the decline of Windows and Office, aswell as the growth of Windows Azure. We expectcompound annual revenue growth of 1.9% over the nextdecade. Given the cloud disruption, Windows and Officewill be empty shells by 2019 and contribute immaterial amounts to revenue by 2019. The vast majority ofMicrosoft’s revenue will come from Azure, which webelieve will be a very profitable business. The very hightechnical and financial barriers to entry to building acloud, along with the massive returns to scale, point to anindustry with a handful of very large players. While somecost savings will be shared with customers, we expect a significant portion of the economic profit to flow to thecloud providers. Risk The threat to Microsoft’s core businesses of Windows and Office posed by cloud computing is the dominant risk.Google is a capable competitor that is intent on disruptingMicrosoft’s cash cows to restrict Microsoft’s ability todisrupt Google’s cash cow in Internet search. Regulatoryand antitrust issues are also an issue.
Bulls Say
The release of Windows 7 should entice manyenterprises and customers who skipped Windows Vistato finally upgrade from Windows XP. With a warchest of cash and an AAA debt rating,Microsoft is one of the few firms with the technical andfinancial resources to invest heavily in cloudcomputing. Windows Azure enjoys many inherited advantages suchas Microsoft’s existing base of third-party Windowsdevelopers. The Bing search engine is Microsoft’s most viable effortin Internet search thus far, and its partnership withYahoo gives both companies their best chance to chipaway at Google’s dominance.
Bears Say
Cloud computing is a disruptive force, and Microsoftmay be handicapped from competing fully by the needto protect its legacy businesses. The growth of netbooks and emerging markets willpressure the selling prices of Windows. Piracy is also alarger problem in emerging markets. Although Microsoft has settled a majority of itsantitrust issues, the firm will continue to operate undera regulatory microscope. Such regulatory oversight maymake it difficult for Microsoft to raise prices or furtherits market share dominance.
Financial Overview Financial Health: Even after buying back $60 billion ofstock during the last five years, Microsoft’s fortresslikebalance sheet still boasts $40 billion of cash andlong-term investments against only $39 billion in totalliabilities.
© 2011 Morningstar. All Rights Reserved. Unless otherwise provided in a separate agreement, you may use this report only in the country in which its original distributor is based. Data as originally reported.The information contained herein is not represented or warranted to be accurate, correct, complete, or timely. This report is for information purposes only, and should not be considered a solicitation to buy or sell any security.Redistribution is prohibited without written permission. To order reprints, call +1 312-696-6100. To license the research, call +1 312-696-6869.
ß ®
SAMPLE

Microsoft Corporation MSFT [Nasdaq] | QQQ
TM
Last Price Fair Value Consider Buy Consider Sell Uncertainty Economic Moat Stewardship Morningstar Credit Rating Industry28.66 USD 32.00 USD 22.40 USD 44.80 USD Medium Wide A Software - Infrastructure AAA
Company Overview Profile: Microsoft develops the Windows operating systemand the Office suite of productivity software. Windowsand Office account for roughly 56% of Microsoft’srevenue, with another 24% coming from software forenterprise servers. The firm’s other businesses include theXbox 360 video game console, Bing Internet search, business software, and software for mobile devices. Management: CEO Steve Ballmer has done a capable jobof managing Microsoft’s growth over the last decade.However, it is clear Microsoft has lost many intangiblesever since Bill Gates started disengaging from thecompany in the late 90’s. Nonetheless, as evidenced bythe firm’s continuing record of excellent returns on invested capital, management has done a superb job oftransitioning Microsoft from a hypergrowth company to amature technology giant. Although returns have declinedin recent years as the firm has entered new marketsoutside Windows and Office, Microsoft still earned a veryrespectable 53% ROIC in fiscal 2009. Management also takes corporate governance seriously. Gates and Ballmerown about 10% and 4% of Microsoft, respectively, andneither has taken any stock options in the past decade.We think this level of ownership clearly alignsmanagement’s interests with those of outside shareholders. Executive compensation is below that ofother large technology firms. In addition, the replacementof employee stock options with restricted-stock grantsearns Microsoft an excellent Stewardship Grade.
© 2011 Morningstar. All Rights Reserved. Unless otherwise provided in a separate agreement, you may use this report only in the country in which its original distributor is based. Data as originally reported.The information contained herein is not represented or warranted to be accurate, correct, complete, or timely. This report is for information purposes only, and should not be considered a solicitation to buy or sell any security.Redistribution is prohibited without written permission. To order reprints, call +1 312-696-6100. To license the research, call +1 312-696-6869.
ß ®
SAMPLE

Microsoft Corporation MSFT [Nasdaq] | QQQ
TM
Last Price Fair Value Consider Buy Consider Sell Uncertainty Economic Moat Stewardship Morningstar Credit Rating Industry28.66 USD 32.00 USD 22.40 USD 44.80 USD Medium Wide A Software - Infrastructure AAA
Analyst Notes
Oct. 28, 2010 Strong Start to 2011 for Microsoft
Microsoft reported 13% year-over-year growth to $16.2billion of revenue for the first quarter of fiscal 2011 as thecompany’s three main businesses performed very well. TheWindows division continued to do well as the wave ofcorporate PC refreshes rolls through. The introduction ofOffice 2010 helped propel the business division to sales of$5.1 billion, up 13.5% from $4.5 billion in the first quarterof 2010. Another bright spot was the server & tool division,which recorded the second straight quarter of double-digitgrowth after being flat for the preceding six quarters. There have been some significant executive departures inrecent months that raise uncertainty about Microsoft’sstrategic direction. Stephen Elop, head of Microsoft’sbusiness division, left to take the CEO position at Nokia.Ray Ozzie, who was Bill Gates’ anointed successor as chief
software architect, will be leaving the company. The chiefsoftware architect role will not be filled by a replacement.At its core, Microsoft is an extremely capable enterprisesoftware company, an ability that rivals such as Google andApple cannot match. We expect that Microsoft will beentrenched in enterprise for a very long time. However, thecompany has missed on very large opportunities such assearch and mobile. Without a clear technical leader that isrespected by the engineers at Microsoft, we believe thecompany will likely continue to struggle outside of its threecore businesses.
Oct. 11, 2010 Windows Phone 7 Puts Microsoft in the Smartphone Race
Microsoft finally unveiled the first wave of Windows Phone7 (WP7) phones from hardware partners HTC, Dell,Samsung, and LG. The phones will be available in Europeon Oct. 21 and in the U.S. to AT&T and T-Mobile customerson Nov. 8. While the new WP7 phones appear to be capablecompetitors to the existing iPhone-Android-Blackberrytroika, Microsoft has a long climb ahead to effectivelymarket and sell the devices to consumers. If Microsoft canspur significant user adoption of WP7, then it can leverageits greatest advantage in the smartphone race: an army of
third-party developers that is already accustomed tobuilding applications in the Microsoft developmentenvironment. Microsoft wisely broke compatibility withprevious Windows Mobile releases to center WP7development on the company’s Silverlight and XNAframeworks. The advantage is that developers are alreadyfamiliar with these frameworks and Microsoft is providingadditional tools to speed up WP7 app development. Webelieve the iPhone juggernaut is unstoppable at this point,but if Microsoft can ignite the virtuous cycle of developerand user adoption, then it has a chance to either beat backthe onslaught of Android devices or take share away fromResearch in Motion.
Jul. 22, 2010 PC Growth Drives Microsoft’s 4Q
A strong PC market helped propel Microsoft to a recordfiscal fourth quarter. Revenue increased by 22%
year-over-year to $16 billion, and operating incomeincreased by 49% to $5.9 billion. The high and low points ofMicrosoft’s quarter were as expected. The Windows 7 and
© 2011 Morningstar. All Rights Reserved. Unless otherwise provided in a separate agreement, you may use this report only in the country in which its original distributor is based. Data as originally reported.The information contained herein is not represented or warranted to be accurate, correct, complete, or timely. This report is for information purposes only, and should not be considered a solicitation to buy or sell any security.Redistribution is prohibited without written permission. To order reprints, call +1 312-696-6100. To license the research, call +1 312-696-6869.
ß ®
SAMPLE

Microsoft Corporation MSFT [Nasdaq] | QQQ
TM
Last Price Fair Value Consider Buy Consider Sell Uncertainty Economic Moat Stewardship Morningstar Credit Rating Industry28.66 USD 32.00 USD 22.40 USD 44.80 USD Medium Wide A Software - Infrastructure AAA
Analyst Notes (continued)
Office 2010 product cycle is now in full swing, withWindows and Office segment revenue increasing by 44%and 15%, respectively. We expect both segments willcontinue to perform well, as the PC refresh cycle continuesto roll through the enterprise market. The server and toolssegment, which had stalled out for the past two years,bounced back nicely with 14% growth. One theme that hasemerged this earnings season is the strength of datacenter-related spending. The server and tools results areanother collaborating data point. The low points of the quarter remain the same. The onlineservice division posted an operating loss of $696 million,
bringing its full-year loss to $2.4 billion. Bing continues togain incremental search share, but we expect it to remain adistant second to Google. The entertainment and devicesdivision also post a $172 million operating loss due tocharges resulting from the KIN debacle. Over the next 12 months, we expect Microsoft’s fortunes toclosely track those of the PC market, but we believe boththe Windows and Office franchises are in the early stagesof a long decline. We continue to believe that the future ofMicrosoft lies in its Windows Azure enterprise cloudplatform.
© 2011 Morningstar. All Rights Reserved. Unless otherwise provided in a separate agreement, you may use this report only in the country in which its original distributor is based. Data as originally reported.The information contained herein is not represented or warranted to be accurate, correct, complete, or timely. This report is for information purposes only, and should not be considered a solicitation to buy or sell any security.Redistribution is prohibited without written permission. To order reprints, call +1 312-696-6100. To license the research, call +1 312-696-6869.
ß ®
Disclaimers & DisclosuresNo Morningstar employees are officers or directors of this company. Morningstar Inc. does not own more than 1% of the shares of this company. Analystscovering this company do not own its stock. The information contained herein is not represented or warranted to be accurate, correct, complete, or timely.This report is for information purposes only, and should not be considered a solicitation to buy or sell any security.
SAMPLE

®Morningstar Stock Data Sheet Pricing data thru Jan. 18, 2011 Rating updated as of Jan. 18, 2011Pricing data thru Jan. 18, 2011 Rating updated as of Jan. 18, 2011 Fiscal year-end: June
Microsoft Corporation MSFT Sales USD Mil Mkt Cap USD Mil Industry Sector65,759 245,201 Software
- Infrastructure Software
TMMorningstar Rating Last Price Fair Value Uncertainty Economic Moat Stewardship GradeQQQ 28.66 32.00 Medium Wide A
per share prices in USD
2001 2002 2003 2004 2005 2006 2007 2008 2009 2010 YTD
2.0
5.0
9.0
19.0
29.0
69.0
38.0821.44
35.3120.70
30.0022.55
30.2024.01
28.2523.82
30.2621.46
37.5026.60
35.9617.50
31.5014.87
31.5822.73
28.8527.77
Annual Price HighLowRecent Splits
Price VolatilityMonthly High/LowRel Strength to S&P 500
52 week High/Low31.58 - 22.73
10 Year High/Low38.08 - 14.87
Bear-Market Rank4 (10=worst)
Trading Volume Million
Stock Performance
2:1
Microsoft develops the Windows operating system and the
Office suite of productivity software. Windows and Office
account for roughly 56% of Microsoft’s revenue, with
another 24% coming from software for enterprise servers.
The firm’s other businesses include the Xbox 360 video game
console, Bing Internet search, business software, and
software for mobile devices.
One Microsoft Way Redmond, WA 98052Phone: 1 425 882-8080Website: http://www.microsoft.com
Growth Rates Compound AnnualGrade: B 1 Yr 3 Yr 5 Yr 10 Yr
Revenue % 6.9 6.9 9.4 10.5Operating Income % 18.3 9.2 10.6 8.1Earnings/Share % 29.6 13.9 13.4 9.5Dividends % 4.0 10.1 10.2 .
Book Value/Share % 20.0 17.1 3.6 3.1Stock Total Return % -5.3 -2.9 2.9 4.6+/- Industry -15.3 -6.0 -5.1 1.2+/- Market -19.3 -2.1 2.6 5.1
Profitability AnalysisGrade: A Current 5 Yr Avg Ind Mkt
Return on Equity % 46.7 40.5 11.3 21.9Return on Assets % 23.8 21.5 5.8 8.5Fixed Asset Turns 8.6 11.7 9.2 7.2Inventory Turns 10.6 11.7 17.6 14.0Revenue/Employee USD K 738.9 664.8 . 886.1
Gross Margin % 80.7 80.4 77.2 39.4Operating Margin % 40.7 36.8 33.2 14.3Net Margin % 31.3 28.0 9.3 9.5Free Cash Flow/Rev % 36.6 30.5 29.0 0.1R&D/Rev % 13.4 0.1 . 9.9
*
*3Yr Avg data is displayed in place of 5Yr Avg
Financial PositionGrade: A 06-10 USD Mil 09-10 USD Mil
Cash 5505 8161Inventories 740 1242Receivables 13014 9646
Current Assets 55676 59581
Fixed Assets 7630 7771Intangibles 13552 13548
Total Assets 86113 91540
Payables 5281 6699Short-Term Debt 1000 1000
Current Liabilities 26147 25857Long-Term Debt 4939 9665
Total Liabilities 39938 44598
Total Equity 46175 46942
2001 2002 2003 2004 2005 2006 2007 2008 2009 2010 TTM FinancialsRevenue USD Mil25296 28365 32187 36835 39788 44282 51122 60420 58437 62484 65759Gross Margin %86.3 81.7 82.3 81.8 84.4 82.7 79.1 80.8 79.2 80.2 80.7Oper Income USD Mil11720 11910 13217 9034 14561 16472 18524 22492 20363 24098 26732Operating Margin %46.3 42.0 41.1 24.5 36.6 37.2 36.2 37.2 34.8 38.6 40.7
Net Income USD Mil7346 7829 9993 8168 12254 12599 14065 17681 14569 18760 20596
Earnings Per Share USD0.66 0.71 0.92 0.75 1.12 1.20 1.42 1.87 1.62 2.10 2.33Dividends USD. . 0.08 0.16 0.32 0.34 0.39 0.43 0.50 0.52 0.52Shares Mil11148 11106 10882 10894 10906 10531 9886 9470 8996 8927 8855Book Value Per Share USD4.79 5.22 6.41 4.34 4.15 3.73 3.68 3.88 5.03 5.49 5.49
Oper Cash Flow USD Mil13422 14509 15797 14626 16605 14404 17796 21612 19037 24073 26160Cap Spending USD Mil-1103 -770 -891 -1109 -812 -1578 -2264 -3182 -3119 -1977 -2106Free Cash Flow USD Mil12319 13739 14906 13517 15793 12826 15532 18430 15918 22096 24054
Valuation AnalysisCurrent 5 Yr Avg Ind Mkt
Price/Earnings 12.3 17.0 18.6 16.3Forward P/E 10.6 . . 15.3Price/Cash Flow 9.7 13.8 14.5 8.5Price/Free Cash Flow 10.6 15.8 15.7 17.0Dividend Yield % 1.9 . 1.1 1.7Price/Book 5.2 6.8 5.0 2.3Price/Sales 3.9 4.8 4.5 1.4PEG Ratio 1.0 . . 1.7
Total Return %52.8 -22.0 6.8 9.2 -0.9 15.6 20.6 -44.1 59.5 -6.6 2.7+/- Market65.8 1.4 -19.6 0.2 -3.9 2.0 17.1 -5.6 36.1 -19.4 -0.3+/- Industry44.3 2.1 -6.6 1.4 1.9 -0.7 -5.8 -4.3 7.2 -16.3 0.3
Dividend Yield %. . 0.6 0.6 1.2 1.2 1.1 2.4 1.7 2.0 1.9
Market Cap USD Mil356914 276631 295937 290720 278358 293538 333054 172930 268559 238785 245201
2001 2002 2003 2004 2005 2006 2007 2008 2009 2010 TTM ProfitabilityReturn on Assets %13.2 12.3 13.6 9.5 15.0 17.9 21.2 26.0 19.3 22.9 23.8Return on Equity %16.6 15.7 17.7 12.0 19.9 28.6 39.5 52.5 38.4 43.8 46.7
Net Margin %29.0 27.6 31.0 22.2 30.8 28.5 27.5 29.3 24.9 30.0 31.3Asset Turnover0.45 0.45 0.44 0.43 0.49 0.63 0.77 0.89 0.78 0.76 0.76Financial Leverage1.3 1.3 1.3 1.2 1.5 1.7 2.0 2.0 2.0 1.9 2.0
2001 2002 2003 2004 2005 2006 2007 2008 2009 2010 09-10 Financial HealthWorking Capital USD Mil28505 35832 44999 55597 31860 26568 16414 13356 22246 29529 33724Long-Term Debt USD Mil. . . . . . . . 3746 4939 9665Total Equity USD Mil47289 52180 61020 74825 48115 40104 31097 36286 39558 46175 46942Debt/Equity. . . . . . . . 0.09 0.11 0.21
2001 2002 2003 2004 2005 2006 2007 2008 2009 2010 TTM ValuationPrice/Earnings60.6 29.8 29.1 29.1 21.6 25.5 20.2 10.4 16.8 12.0 12.3P/E vs. Market. . . . . . . . . 0.7 0.8Price/Sales13.7 9.2 8.7 7.6 6.9 6.7 5.9 2.9 4.7 3.8 3.9Price/Book6.9 5.0 4.3 6.2 6.3 8.0 9.7 5.0 6.1 5.1 5.2Price/Cash Flow25.4 17.2 20.0 20.4 18.3 22.1 15.5 8.8 13.0 9.4 9.7
Quarterly ResultsRevenue
Rev Growth
Earnings Per Share
USD Mil Dec 09 Mar 10 Jun 10 Sep 10
% Dec 09 Mar 10 Jun 10 Sep 10
USD Dec 09 Mar 10 Jun 10 Sep 10
Most Recent Period 19022.0 14503.0 16039.0 16195.0Prior Year Period 16629.0 13648.0 13099.0 12920.0
Most Recent Period 14.4 6.3 22.4 25.4Prior Year Period 1.6 -5.6 -17.3 -14.2
Most Recent Period 0.74 0.45 0.51 0.62Prior Year Period 0.47 0.33 0.34 0.40
Industry Peers by Market Cap
Major Fund Holders
Mkt Cap USD Mil Rev USD Mil P/E ROE%
% of shares
Microsoft Corporatio 245201 65759 12.3 46.7Apple, Inc. 312481 65225 22.5 35.3
Google, Inc. 204538 27555 31.6 20.6
American Funds Growth Fund of Amer A 1.78American Funds Invmt Co of Amer A 1.01American Funds Capital World G/I A 1.01
TTM data based on rolling quarterly data if available; otherwise most recent annual data shown.
© 2011 Morningstar. All Rights Reserved. Unless otherwise provided in a separate agreement, you may use this report only in the country in which its original distributor is based. Data as originally reported. The information contained herein is not represented or warranted to be accurate, correct, complete, or timely. This report is for information purposes only, and should not be considered a solicitation to buy or sell any security. Redistribution is prohibited without written permission. To order reprints, call +1 312-696-6100. To license the research, call +1 312-696-6869.
ß ®
SAMPLE

Morningstar’s Approach to Rating Stocks
Our Key Investing ConceptsEconomic Moat RatingDiscounted Cash FlowDiscount RateFair ValueUncertaintyMargin of SafetyConsider Buying/Consider SellingStewardship Grades
TMAt Morningstar, we evaluate stocks as pieces of abusiness, not as pieces of paper. We think that purchasingshares of superior businesses at discounts to theirintrinsic value and allowing them to compound their valueover long periods of time is the surest way to createwealth in the stock market. We rate stocks 1 through 5 stars, with 5 the best and 1the worst. Our star rating is based on our analyst’sestimate of how much a company’s business is worth pershare. Our analysts arrive at this "fair value estimate" byforecasting how much excess cash--or "free cashflow"--the firm will generate in the future, and thenadjusting the total for timing and risk. Cash generatednext year is worth more than cash generated several yearsdown the road, and cash from a stable and consistentlyprofitable business is worth more than cash from acyclical or unsteady business. Stocks trading at meaningful discounts to our fair valueestimates will receive high star ratings. For high-qualitybusinesses, we require a smaller discount than formediocre ones, for a simple reason: We have moreconfidence in our cash-flow forecasts for strongcompanies, and thus in our value estimates. If a stock’smarket price is significantly above our fair value estimate,it will receive a low star rating, no matter how wonderfulwe think the business is. Even the best company is a baddeal if an investor overpays for its shares. Our fair value estimates don’t change very often, butmarket prices do. So, a stock may gain or lose stars based
just on movement in the share price. If we think a stock’sfair value is $50, and the shares decline to $40 withoutmuch change in the value of the business, the star ratingwill go up. Our estimate of what the business is worthhasn’t changed, but the shares are more attractive as aninvestment at $40 than they were at $50. Because we focus on the long-term value of businesses,rather than short-term movements in stock prices, at timeswe may appear out of step with the overall stock market.When stocks are high, relatively few will receive ourhighest rating of 5 stars. But when the market tumbles,many more will likely garner 5 stars. Although you mightexpect to see more 5-star stocks as the market rises, wefind assets more attractive when they’re cheap. We calculate our star ratings nightly after the marketsclose, and issue them the following business day, which iswhy the rating date on our reports will always be theprevious business day. We update the text of our reportsas new information becomes available, usually about onceor twice per quarter. That is why you’ll see two dates onevery Morningstar stock report. Of course, we monitormarket events and all of our stocks every business day, soour ratings always reflect our analyst’s current opinion. Economic Moat Rating The Economic Moat Rating is our assessment of a firm’sability to earn returns consistently above its cost of capitalin the future, usually by virtue of some competitiveadvantage. Competition tends to drive down such
TM
TM
Morningstar ResearchMethodology for ValuingCompanies QQQQQ
Competitive Economic Company Fair Value UncertaintyAnalysis Moat Rating Valuation Estimate Assessment
TM
Analyst conducts The depth of the Analyst considers DCF model leads to An uncertaintycompany and industry firm’s competitive company financial the firm’s Fair Value assessmentresearch: advantage is rated: statements and Estimate, which establishes the competitive position anchors the rating margin ofManagement None to forecast future framework. safety required forinterviews Narrow cash flows. the stock rating.Conference calls Wide Trade-show visits Assumptions areCompetitor, supplier, input into a dis-distributor, and counted cash-flowcustomer interviews model.
The current stockprice relative to fairvalue, adjustedfor uncertainty,determines therating.
Q
QQQ
QQQQ
QQQQQ
© 2011 Morningstar. All Rights Reserved. Unless otherwise provided in a separate agreement, you may use this report only in the country in which its original distributor is based. Data as originally reported.The information contained herein is not represented or warranted to be accurate, correct, complete, or timely. This report is for information purposes only, and should not be considered a solicitation to buy or sell any security.Redistribution is prohibited without written permission. To order reprints, call +1 312-696-6100. To license the research, call +1 312-696-6869.
ß ®
SAMPLE

Morningstar’s Approach to Rating Stocks (continued)
economic profits, but companies that can earn them for anextended time by creating a competitive advantagepossess an Economic Moat. We see these companies assuperior investments. Discounted Cash Flow This is a method for valuing companies that involvesprojecting the amount of cash a business will generate inthe future, subtracting the amount of cash that thecompany will need to reinvest in its business, and usingthe result to calculate the worth of the firm. We use thistechnique to value nearly all of the companies we cover. Discount Rate We use this number to adjust the value of our forecastedcash flows for the risk that they may not materialize. For aprofitable company in a steady line of business, we’ll usea lower discount rate, also known as "cost of capital,"than for a firm in a cyclical business with fiercecompetition, since there’s less risk clouding the firm’sfuture. Fair Value This is the output of our discounted cash-flow valuationmodels, and is our per-share estimate of a company’sintrinsic worth. We adjust our fair values for off-balancesheet liabilities or assets that a firm might have--forexample, we deduct from a company’s fair value if it hasissued a lot of stock options or has an under-fundedpension plan. Our fair value estimate differs from a "targetprice" in two ways. First, it’s an estimate of what thebusiness is worth, whereas a price target typically reflectswhat other investors may pay for the stock. Second, it’s along-term estimate, whereas price targets generally focuson the next two to 12 months. Uncertainty To generate the Morningstar Uncertainty Rating, analystsconsider factors such as sales predictability, operatingleverage, and financial leverage. Analysts then classifytheir ability to bound the fair value estimate for the stockinto one of several uncertainty levels: Low, Medium, High,
Very High, or Extreme. The greater the level of uncertainty,the greater the discount to fair value required before astock can earn 5 stars, and the greater the premium to fairvalue before a stock earns a 1-star rating. Margin of Safety This is the discount to fair value we would require beforerecommending a stock. We think it’s always prudent tobuy stocks for less than they’re worth.The margin of safetyis like an insurance policy that protects investors from badnews or overly optimistic fair value estimates. We requirelarger margins of safety for less predictable stocks, andsmaller margins of safety for more predictable stocks. Consider Buying/Consider Selling The consider buying price is the price at which a stockwould be rated 5 stars, and thus the point at which wewould consider the stock an extremely attractivepurchase. Conversely, consider selling is the price atwhich a stock would have a 1 star rating, at which pointwe’d consider the stock overvalued, with low expectedreturns relative to its risk. Stewardship Grades We evaluate the commitment to shareholdersdemonstrated by each firm’s board and management teamby assessing transparency, shareholder friendliness,incentives, and ownership. We aim to identify firms thatprovide investors with insufficient or potentiallymisleading financial information, seek to limit the powerof minority shareholders, allow management to abuse itsposition, or which have management incentives that arenot aligned with the interests of long-term shareholders.The grades are assigned on an absolute scale--not relativeto peers--and can be interpreted as follows: A means"Excellent," B means "Good," C means "Fair," D means"Poor," and F means "Very Poor."
© 2011 Morningstar. All Rights Reserved. Unless otherwise provided in a separate agreement, you may use this report only in the country in which its original distributor is based. Data as originally reported.The information contained herein is not represented or warranted to be accurate, correct, complete, or timely. This report is for information purposes only, and should not be considered a solicitation to buy or sell any security.Redistribution is prohibited without written permission. To order reprints, call +1 312-696-6100. To license the research, call +1 312-696-6869.
ß ®
SAMPLE

Morningstar Equity Research
© Morningstar. All Rights Reserved. Unless otherwise provided in a separate agreement, you may use this report only in the country in which its original distributor is based. Data as originally reported. The information contained herein is not represented orwarranted to be accurate, correct, complete, or timely. This report is for information purposes only, and should not be considered a solicitation to buy or sell any security. Redistribution is prohibited without written permission. To order reprints, call +1312-696-6100. To license the research, call +1 312-696-6869.
Last Price Fair Value Consider Buy Consider Sell Uncertainty Economic Moat™ Moat Trend™ Stewardship Morningstar Credit Rating Industry Group
28.66 USD 32.00 USD 22.40 USD 44.80 USD Medium Wide Negative A AAA Application Software
Microsoft Corporation MSFT (NAS) | QQQ
Market Cap (USD Mil) 245,201
52-Week High (USD) 31.58
52-Week Low (USD) 22.73
52-Week Total Return % -5.4
YTD Total Return % 2.7
Last Fiscal Year End 30 Jun 2010
5-Yr Forward Revenue CAGR % 1.6
5-Yr Forward EPS CAGR % 3.3
Price/Fair Value 0.90
2009 2010 2011(E) 2012(E)
Price/Earnings 14.4 10.9 11.9 11.2EV/EBITDA 8.0 6.3 6.9 6.6EV/EBIT 9.0 7.0 7.7 7.3Free Cash Flow Yield % 7.5 11.1 8.1 8.7Dividend Yield % 2.1 2.3 1.9 1.9
2009 2010 2011(E) 2012(E)
Revenue 58,437 62,484 69,982 71,948
Revenue YoY % -3.3 6.9 12.0 2.8
EBIT 20,693 24,157 27,056 28,420
EBIT YoY % -8.0 16.7 12.0 5.0
Net Income, Adjusted 14,812 18,804 20,869 21,896
Net Income YoY % -16.2 27.0 11.0 4.9
Diluted EPS 1.65 2.11 2.40 2.55
Diluted EPS YoY % -11.8 27.9 13.9 6.1
Free Cash Flow 15,918 22,096 19,914 21,435
Free Cash Flow YoY % -13.6 38.8 -9.9 7.6
Strong Start to 2011 for MicrosoftSee Page 2 for the full Analyst Note from 28 Oct 2010
Toan TranAssociate [email protected]+1 (312) 696-6419
Research as of 28 Oct 2010Estimates as of 28 Oct 2010Pricing data through 18 Jan 2011Rating updated as of 18 Jan 2011
Analyst's Perspective 07 May 2010
Microsoft can be thought of as two different businesses.On one side are the core Windows, Office, and serversoftware segments, which constitute 81% of Microsoft'srevenue and all of its operating income. We thinkMicrosoft's competitive position is defensible due to thepowerful network effects associated with a widely adoptedoperating system and productivity suite, but it is notunassailable. The advent of cloud computing and Web appsstrike directly at the Windows platform because they allowusers to gain access to their applications from a multitudeof software platforms. It is the disruption by the cloud thatMicrosoft's collection of noncore businesses, such assearch and Windows Azure, seeks to hedge against.Although we remain skeptical of Microsoft's ability to makesignificant inroads against Google in search, WindowsAzure has the potential to become a dominant enterprisecloud platform.
Key Investment Considerations
Microsoft develops the Windows operating system and the Office suite ofproductivity software. Windows and Office account for roughly 56% ofMicrosoft's revenue, with another 24% coming from software for enterpriseservers. The firm's other businesses include the Xbox 360 video gameconsole, Bing Internet search, business software, and software for mobiledevices.
Profile
Vital Statistics
Valuation Summary and Forecasts
Financial Summary and Forecasts
The primary analyst covering this companydoes not own its stock.
Currency amounts expressed with "$" are inU.S. dollars (USD) unless otherwise denoted.
Source for forecasts in the data tables above: Morningstar EstimatesAnalyst Note:
(USD Mil)
Contents
Analyst's Perspective
Key Investment Considerations
Morningstar Analysis
Analyst Note
Thesis
Valuation, Growth and Profitability
Scenario Analysis
Economic Moat
Moat Trend
Bulls Say/Bears Say
Credit Analysis
Financial Health
Capital Structure
Enterprise Risk
Management & Ownership
Analyst Note Archive
Morningstar Analyst Forecasts
Comparable Company Analysis
Methodology for Valuing Companies
Fiscal Year:
Fiscal Year:
3 Cloud computing is a threat to Windows and Office. Weexpect both businesses to decline during the next decadeas users migrate to Web-based applications.
3 The cloud is also an opportunity for Microsoft. TheWindows Azure cloud platform, has the potential to bea large and profitable business. A decade from now,Azure may be Microsoft's primary business line.
3 Apple's iPad and its progeny may become the defaultcomputing paradigm for many consumers, thus takingaway large amounts of share from Windows in theconsumer market.
1
1
2
2
3
3
3
4
5
6
6
6
7
8
9
13
15
Page 1 of 18
SAMPLE

Morningstar Equity Research
© Morningstar. All Rights Reserved. Unless otherwise provided in a separate agreement, you may use this report only in the country in which its original distributor is based. Data as originally reported. The information contained herein is not represented orwarranted to be accurate, correct, complete, or timely. This report is for information purposes only, and should not be considered a solicitation to buy or sell any security. Redistribution is prohibited without written permission. To order reprints, call +1312-696-6100. To license the research, call +1 312-696-6869.
Last Price Fair Value Consider Buy Consider Sell Uncertainty Economic Moat™ Moat Trend™ Stewardship Morningstar Credit Rating Industry Group
28.66 USD 32.00 USD 22.40 USD 44.80 USD Medium Wide Negative A AAA Application Software
Microsoft Corporation MSFT (NAS) | QQQ
We thinkMicrosoft'scompetitiveposition is verydefensible, due topowerful networkeffects, but it is notunassailable.
Morningstar Analysis
Strong Start to 2011 for Microsoft 28 Oct 2010
Microsoft MSFT reported 13% year-over-year growth to$16.2 billion of revenue for the first quarter of fiscal 2011as the company's three main businesses performed verywell. The Windows division continued to do well as thewave of corporate PC refreshes rolls through. Theintroduction of Office 2010 helped propel the businessdivision to sales of $5.1 billion, up 13.5% from $4.5 billionin the first quarter of 2010. Another bright spot was theserver & tool division, which recorded the second straightquarter of double-digit growth after being flat for thepreceding six quarters.
There have been some significant executive departures inrecent months that raise uncertainty about Microsoft'sstrategic direction. Stephen Elop, head of Microsoft'sbusiness division, left to take the CEO position at NokiaNOK . Ray Ozzie, who was Bill Gates' anointed successoras chief software architect, will be leaving the company.The chief software architect role will not be filled by areplacement. At its core, Microsoft is an extremely capableenterprise software company, an ability that rivals such asGoogle GOOG and Apple AAPL cannot match. We expectthat Microsoft will be entrenched in enterprise for a verylong time. However, the company has missed on very largeopportunities such as search and mobile. Without a cleartechnical leader that is respected by the engineers atMicrosoft, we believe the company will likely continue tostruggle outside of its three core businesses.
Thesis 07 May 2010
The disruptive change brought about by cloud computingwill challenge Microsoft's core Windows and Officefranchises, but it will also present the firm with anopportunity to capture a larger share of enterprise ITspending.
Cloud computing is a singular threat to Microsoft becauseit allows users to access their information and applications
from a multitude of hardware and software platforms. Thisstrikes directly at the Windows platform, which is thefoundation of Microsoft's moat. We have already seen earlyevidence of the cloud's effects in the consumer market, suchas the resurgence of Apple's Macintosh and the growingpopularity of new devices like the iPad. While we expectMicrosoft to earn substantial profits from Windows andOffice for many years to come, the arrival of alternativeswill begin to erode the company's desktop-based moat.
A cloud computing world does challenge Microsoft, but italso presents new opportunities. Microsoft is one of thefew firms with the financial and technical resources to buildthe massive datacenters that form the fabric of the cloud.In addition, Microsoft's existing ecosystem of third-partysoftware developers is a valuable asset that helps get itsAzure cloud computing platform off to a running start. IfMicrosoft can build Azure into a dominant cloud platform,a new avenue of growth will be opened, as the companymoves from a being a mere software vendor to a providerof the entire enterprise IT infrastructure. Cloud datacenterscan reap massive scale economies in hardware andpersonnel costs, and this is value that Microsoft can extractfor shareholders.
On the other hand, Microsoft has thus far been reluctant tofully embrace the software-as-a-service model that isenabled by cloud computing. Understandably, the firmwants to protect the cash cows of Windows and Office, butthis may prove to be a handicap against competitorsunconstrained by the need to protect legacy assets. Forexample, Google Apps is currently priced at roughly half ofMicrosoft's hosted Exchange e-mail service.
Although Microsoft is positioning itself for the cloud, duringthe next few years, its financial performance will be drivenby a strong product cycle. Windows 7 has performed well,and the end of mainstream technical support for WindowsXP should help drive greater corporate adoption of Windows
Page 2 of 18
SAMPLE

Morningstar Equity Research
© Morningstar. All Rights Reserved. Unless otherwise provided in a separate agreement, you may use this report only in the country in which its original distributor is based. Data as originally reported. The information contained herein is not represented orwarranted to be accurate, correct, complete, or timely. This report is for information purposes only, and should not be considered a solicitation to buy or sell any security. Redistribution is prohibited without written permission. To order reprints, call +1312-696-6100. To license the research, call +1 312-696-6869.
Last Price Fair Value Consider Buy Consider Sell Uncertainty Economic Moat™ Moat Trend™ Stewardship Morningstar Credit Rating Industry Group
28.66 USD 32.00 USD 22.40 USD 44.80 USD Medium Wide Negative A AAA Application Software
Microsoft Corporation MSFT (NAS) | QQQ
Price/Fair ValueMorningstar data as of 18 Jan 2011Price (USD)Fair Value (USD)
Morningstar RatingQQQQQQQQQQQQQQQ
7. Windows Server 2008 R2, which adds importantvirtualization technologies, was released in late 2009, andOffice 2010, the next version of the popular productivitysuite, is scheduled to follow later in 2010.
Valuation, Growth and Profitability 07 May 2010
Our fair value estimate for Microsoft is $32 per share. Wehave extended our explicit forecast for Microsoft out to 2019to incorporate the decline of Windows and Office, as wellas the growth of Windows Azure. We expect compoundannual revenue growth of 1.9% over the next decade. Giventhe cloud disruption, Windows and Office will be emptyshells by 2019 and contribute immaterial amounts torevenue by 2019. The vast majority of Microsoft's revenuewill come from Azure, which we believe will be a veryprofitable business. The very high technical and financialbarriers to entry to building a cloud, along with the massivereturns to scale, point to an industry with a handful of verylarge players. While some cost savings will be shared withcustomers, we expect a significant portion of the economicprofit to flow to the cloud providers.
Scenario Analysis
The primary risk, both to the downside and upside, to ourvaluation revolves around our assumptions for WindowsAzure. Our base case assumes that Azure grows to be a $52billion business by 2019, while the Windows, Office, andserver software businesses will have all but vanished. Ourmargin assumptions are highly sensitive to the number ofCPU cores available per server inside an Azure datacenter.Given the large proportion of fixed costs, this is the key pointof operating leverage. For example, the shift from four coresper server to eight cores per server results in a nearly4,000-basis-point increase in Azure's gross margin. Our bearcase assumes that not only do Windows, Office, and serversoftware go into slow decline, but that Azure fails to becomea dominant platform. In this case, our fair value estimate is$25. In our bull case, we continue to assume that Windows,Office, and server software fade away, but that Azuredominates cloud computing to the extent that Windowsdominated the desktop. In this case, our fair value estimateis $38.
Economic Moat
The moat around Microsoft's Windows and Officefranchises remains wide. Windows became the dominantdesktop operating system when the mutual attraction ofusers and developers toward a common platform reachedcritical mass. With an established developer ecosystem andmassive installed base of applications, Windows is unlikelyto be displaced by another desktop operating system.However, a new class of devices such as Apple's AAPL iPadthat offer a simpler and arguably better user experience forconsumers may transcend the need for Windows in theconsumer market. The core of the moat around Office is thenumerous business processes that have been built on itsapplications. The cost to switch would be significant formany enterprises. On the server software side, Microsofthas recruited a legion of IT staffers to train on itstechnologies. With a substantial amount of human capitalinvested in learning how to operate Microsoft serversoftware, many IT staffers would be reluctant to consider
Page 3 of 18
SAMPLE
Morningstar Equity Research
© Morningstar. All Rights Reserved. Unless otherwise provided in a separate agreement, you may use this report only in the country in which its original distributor is based. Data as originally reported. The information contained herein is not represented orwarranted to be accurate, correct, complete, or timely. This report is for information purposes only, and should not be considered a solicitation to buy or sell any security. Redistribution is prohibited without written permission. To order reprints, call +1312-696-6100. To license the research, call +1 312-696-6869.
Last Price Fair Value Consider Buy Consider Sell Uncertainty Economic Moat™ Moat Trend™ Stewardship Morningstar Credit Rating Industry Group
28.66 USD 32.00 USD 22.40 USD 44.80 USD Medium Wide Negative A AAA Application Software
Microsoft Corporation MSFT (NAS) | QQQ
software from other vendors.
Moat Trend
Microsoft's moat trend is negative. Both Windows andOffice are very unlikely to be displaced in the currentdesktop-centric computing model, but the world is shiftingtoward the cloud. By severing the tie between applicationsand the software platform, cloud computing minimizes theimportance of Windows. Cloud-based productivitycompetitors such as Google Docs may capture new users,but the large installed base of business processes built onOffice will be difficult to overcome. On the server softwareside, Web-based offerings like Google Apps are viablecompetitors. Enterprises are unlikely to replace Office withGoogle Docs or Exchange with Google Apps in the nearfuture, but the existence of alternatives could begin to eatinto Microsoft's fat profit margins.
Although Microsoft's traditional moat may be in slowdecline, the company has an opportunity to build anotherwide moat with the Windows Azure cloud platform. Weexpect cloud computing will be adopted by enterprisesduring the next decade, as the economic and technicaladvantages of the cloud over an internal datacenter areexceptionally compelling. Given this, Azure has the potentialto be the best business Microsoft ever builds. The massivedatacenters that form the fabric of the cloud will constitutethe lowest-cost provider of computing infrastructure, andeven though some of these cost savings will be shared withcustomers, we expect a substantial portion of the economicvalue created by Azure will be retained by Microsoft.
We believe the cloud computing industry will come to bedominated by one or two platforms that generate veryattractive economics. The industry is characterized by highfinancial and technical barriers to entry, as well very largereturns to scale. The early movers in the cloud platform raceare Microsoft and Google, and it would be difficult for a
subscale entrant to succeed given the cost advantageenjoyed by Microsoft and Google in provisioning computinginfrastructure. We expect this industry structure to lead tolimited price competition between the potential dominantplatforms. Given Azure's inherited advantage of an existingbase of Windows .NET developers, we believe Azure maybe one of the dominant cloud platforms.
We would revise our moat trend rating to stable if WindowsAzure begins to score important victories in the nascentcloud platform race.
Page 4 of 18
SAMPLE

Morningstar Equity Research
© Morningstar. All Rights Reserved. Unless otherwise provided in a separate agreement, you may use this report only in the country in which its original distributor is based. Data as originally reported. The information contained herein is not represented orwarranted to be accurate, correct, complete, or timely. This report is for information purposes only, and should not be considered a solicitation to buy or sell any security. Redistribution is prohibited without written permission. To order reprints, call +1312-696-6100. To license the research, call +1 312-696-6869.
Last Price Fair Value Consider Buy Consider Sell Uncertainty Economic Moat™ Moat Trend™ Stewardship Morningstar Credit Rating Industry Group
28.66 USD 32.00 USD 22.40 USD 44.80 USD Medium Wide Negative A AAA Application Software
Microsoft Corporation MSFT (NAS) | QQQ
Bulls Say/Bears Say
Bulls Say Bears Say
3 The release of Windows 7 should entice manyenterprises and customers who skipped WindowsVista to finally upgrade from Windows XP.
3 With a warchest of cash and an AAA debt rating,Microsoft is one of the few firms with the technicaland financial resources to invest heavily in cloudcomputing.
3 Windows Azure enjoys many inherited advantagessuch as Microsoft's existing base of third-partyWindows developers.
3 The Bing search engine is Microsoft's most viableeffort in Internet search thus far, and its partnershipwith Yahoo gives both companies their best chanceto chip away at Google's dominance.
3 Cloud computing is a disruptive force, and Microsoftmay be handicapped from competing fully by the needto protect its legacy businesses.
3 The growth of netbooks and emerging markets willpressure the selling prices of Windows. Piracy is alsoa larger problem in emerging markets.
3 Although Microsoft has settled a majority of itsantitrust issues, the firm will continue to operateunder a regulatory microscope. Such regulatoryoversight may make it difficult for Microsoft to raiseprices or further its market share dominance.
Page 5 of 18
SAMPLE
Morningstar Equity Research
© Morningstar. All Rights Reserved. Unless otherwise provided in a separate agreement, you may use this report only in the country in which its original distributor is based. Data as originally reported. The information contained herein is not represented orwarranted to be accurate, correct, complete, or timely. This report is for information purposes only, and should not be considered a solicitation to buy or sell any security. Redistribution is prohibited without written permission. To order reprints, call +1312-696-6100. To license the research, call +1 312-696-6869.
Last Price Fair Value Consider Buy Consider Sell Uncertainty Economic Moat™ Moat Trend™ Stewardship Morningstar Credit Rating Industry Group
28.66 USD 32.00 USD 22.40 USD 44.80 USD Medium Wide Negative A AAA Application Software
Microsoft Corporation MSFT (NAS) | QQQ
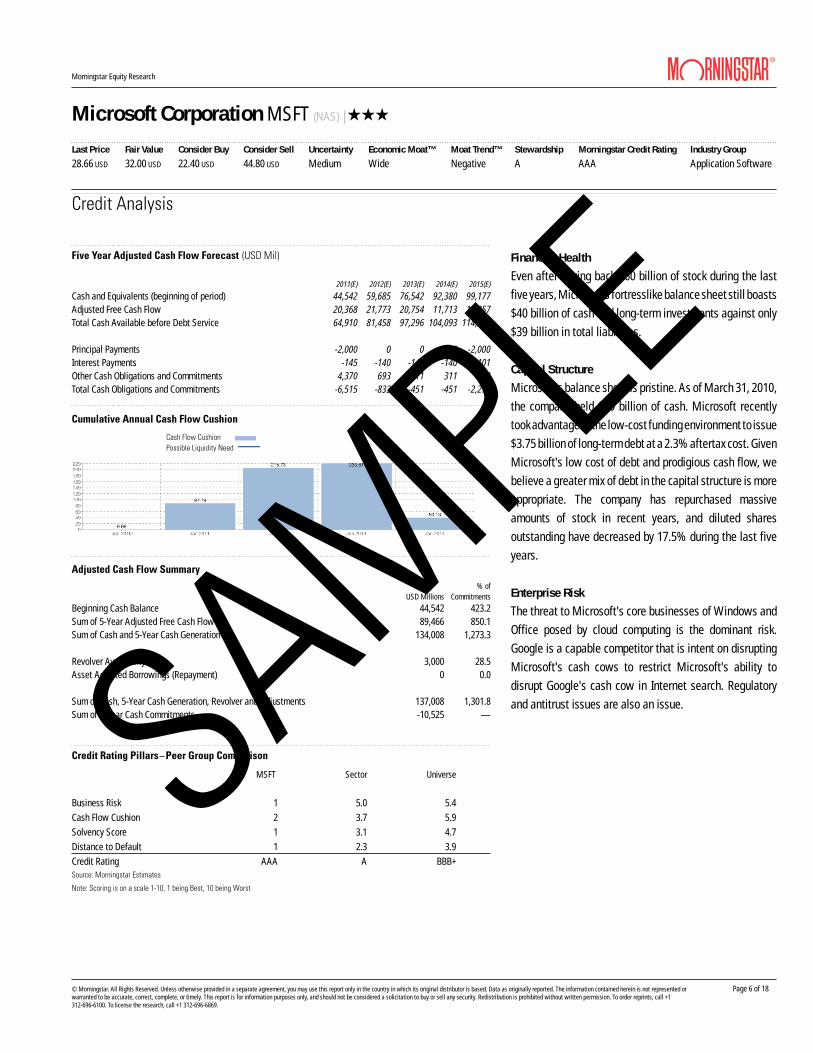
2011(E) 2012(E) 2013(E) 2014(E) 2015(E)
Cash and Equivalents (beginning of period) 44,542 59,685 76,542 92,380 99,177Adjusted Free Cash Flow 20,368 21,773 20,754 11,713 14,857Total Cash Available before Debt Service 64,910 81,458 97,296 104,093 114,034
Principal Payments -2,000 0 0 0 -2,000Interest Payments -145 -140 -140 -140 -101Other Cash Obligations and Commitments 4,370 693 311 311 174Total Cash Obligations and Commitments -6,515 -833 -451 -451 -2,275
USD Millions% of
Commitments
Beginning Cash Balance 44,542 423.2Sum of 5-Year Adjusted Free Cash Flow 89,466 850.1Sum of Cash and 5-Year Cash Generation 134,008 1,273.3
Revolver Availability 3,000 28.5Asset Adjusted Borrowings (Repayment) 0 0.0
Sum of Cash, 5-Year Cash Generation, Revolver and Adjustments 137,008 1,301.8Sum of 5-Year Cash Commitments -10,525 —
MSFT Sector Universe
Business Risk 1 5.0 5.4Cash Flow Cushion 2 3.7 5.9Solvency Score 1 3.1 4.7Distance to Default 1 2.3 3.9Credit Rating AAA A BBB+
Five Year Adjusted Cash Flow Forecast (USD Mil)
Credit Analysis
Cumulative Annual Cash Flow Cushion
Cash Flow CushionPossible Liquidity Need
Adjusted Cash Flow Summary
Credit Rating Pillars Peer Group Comparison
Source: Morningstar Estimates
Note: Scoring is on a scale 1-10, 1 being Best, 10 being Worst
Financial Health
Even after buying back $60 billion of stock during the lastfive years, Microsoft's fortresslike balance sheet still boasts$40 billion of cash and long-term investments against only$39 billion in total liabilities.
Capital Structure
Microsoft's balance sheet is pristine. As of March 31, 2010,the company held $40 billion of cash. Microsoft recentlytook advantage of the low-cost funding environment to issue$3.75 billion of long-term debt at a 2.3% aftertax cost. GivenMicrosoft's low cost of debt and prodigious cash flow, webelieve a greater mix of debt in the capital structure is moreappropriate. The company has repurchased massiveamounts of stock in recent years, and diluted sharesoutstanding have decreased by 17.5% during the last fiveyears.
Enterprise Risk
The threat to Microsoft's core businesses of Windows andOffice posed by cloud computing is the dominant risk.Google is a capable competitor that is intent on disruptingMicrosoft's cash cows to restrict Microsoft's ability todisrupt Google's cash cow in Internet search. Regulatoryand antitrust issues are also an issue.
Page 6 of 18
SAMPLE

Morningstar Equity Research
© Morningstar. All Rights Reserved. Unless otherwise provided in a separate agreement, you may use this report only in the country in which its original distributor is based. Data as originally reported. The information contained herein is not represented orwarranted to be accurate, correct, complete, or timely. This report is for information purposes only, and should not be considered a solicitation to buy or sell any security. Redistribution is prohibited without written permission. To order reprints, call +1312-696-6100. To license the research, call +1 312-696-6869.
Last Price Fair Value Consider Buy Consider Sell Uncertainty Economic Moat™ Moat Trend™ Stewardship Morningstar Credit Rating Industry Group
28.66 USD 32.00 USD 22.40 USD 44.80 USD Medium Wide Negative A AAA Application Software
Microsoft Corporation MSFT (NAS) | QQQ
Name Position Shares Held Report Date* InsiderActivity
WILLIAM H. GATES,III Founder/Chairman of the Board/Director,Director
600,974,696 18 Nov 2010 20,000,000
STEVEN A. BALLMER CEO/Director,Director 333,252,990 22 Nov 2010 75,000,000DAVID F. MARQUARDT Director 1,178,852 30 Dec 2010 —STEVEN SINOFSKY President, Divisional 693,507 11 Jan 2011 688,891CRAIG J. MUNDIE Other Executive Officer 343,998 17 Dec 2010 248,037MR. KURT DELBENE Senior VP, Divisional 115,513 13 Jan 2011 137,302HELMUT PANKE Director 31,716 15 Nov 2010 —RAYMOND V. GILMARTIN Director 30,804 15 Nov 2010 —DR. MARIA KLAWE,PHD Director 7,867 15 Nov 2010 —
Top OwnersMorningstarRating
% of SharesHeld
% of FundAssets
Change(k) Portfolio Date
VA CollegeAmerica Grth Fund of Amer 529F QQQQ 1.56 2.33 -16,680 30 Sep 2010VA CollegeAmerica Invmt Co of Amer 529E QQQQ 1.02 3.86 1,675 30 Sep 2010Vanguard US Total Market Shares (AU) ETF 0.98 1.51 1,773 30 Sep 2010SPDR S&P 500 QQQ 0.73 1.80 -538 14 Jan 2011VA CollegeAmerica Cap World G/I 529E QQQQ 0.81 2.33 -15,665 30 Sep 2010
Concentrated Holders
DWS Disciplined Market Neutral A QQQ 0.00 29.99 186 30 Nov 2010Highbridge Statistical Mkt Neutral A QQQ 0.01 20.32 287 30 Sep 2010Software HOLDRs 0.00 17.57 0 31 Dec 2010UBS Sect Port US Info Technol Telecom B QQQQ 0.02 15.77 309 28 Feb 2010
Top 5 BuyersMorningstarRating
% of SharesHeld
% of FundAssets
SharesBought/Sold (k) Portfolio Date
Amundi Actions Internationales Inc QQQ 0.00 0.86 20,133 31 Dec 2009Oakmark Equity & Income I QQQQQ 0.21 2.47 8,000 30 Sep 2010Allianz NFJ Dividend Value Instl QQQQ 0.06 2.07 4,029 31 Dec 2010IVA Worldwide A 0.07 2.43 3,661 30 Sep 2010GMO Quality III QQQQ 0.37 5.58 3,327 31 Aug 2010
Top 5 Sellers
Orbis SICAV Global Equity Inv QQQQQ 0.03 2.42 -17,483 31 Dec 2009VA CollegeAmerica Grth Fund of Amer 529F QQQQ 1.56 2.33 -16,680 30 Sep 2010VA CollegeAmerica Cap World G/I 529E QQQQ 0.81 2.33 -15,665 30 Sep 2010VA CollegeAmerica Cap Inc Bldr 529E QQQ 0.02 0.05 -11,695 30 Sep 2010
Stewardship: A 07 May 2010
Management & Ownership
Management Activity
Fund Ownership
Institutional Transactions
*Report date represents the date on which the owner's common shares held was audited.
CEO Steve Ballmer has done a capable job of managingMicrosoft's growth over the last decade. However, it is clearMicrosoft has lost many intangibles ever since Bill Gatesstarted disengaging from the company in the late 90's.Nonetheless, as evidenced by the firm's continuing recordof excellent returns on invested capital, management hasdone a superb job of transitioning Microsoft from ahypergrowth company to a mature technology giant.Although returns have declined in recent years as the firmhas entered new markets outside Windows and Office,Microsoft still earned a very respectable 53% ROIC in fiscal2009. Management also takes corporate governanceseriously. Gates and Ballmer own about 10% and 4% ofMicrosoft, respectively, and neither has taken any stockoptions in the past decade. We think this level of ownershipclearly aligns management's interests with those of outsideshareholders. Executive compensation is below that of otherlarge technology firms. In addition, the replacement ofemployee stock options with restricted-stock grants earnsMicrosoft an excellent Stewardship Grade.
Page 7 of 18
SAMPLE

Morningstar Equity Research
© Morningstar. All Rights Reserved. Unless otherwise provided in a separate agreement, you may use this report only in the country in which its original distributor is based. Data as originally reported. The information contained herein is not represented orwarranted to be accurate, correct, complete, or timely. This report is for information purposes only, and should not be considered a solicitation to buy or sell any security. Redistribution is prohibited without written permission. To order reprints, call +1312-696-6100. To license the research, call +1 312-696-6869.
Last Price Fair Value Consider Buy Consider Sell Uncertainty Economic Moat™ Moat Trend™ Stewardship Morningstar Credit Rating Industry Group
28.66 USD 32.00 USD 22.40 USD 44.80 USD Medium Wide Negative A AAA Application Software
Microsoft Corporation MSFT (NAS) | QQQ
Analyst Notes
Windows Phone 7 Puts Microsoft in the Smartphone
Race 11 Oct 2010
Microsoft MSFT finally unveiled the first wave of WindowsPhone 7 (WP7) phones from hardware partners HTC, DellDELL , Samsung, and LG. The phones will be available inEurope on Oct. 21 and in the U.S. to AT&T and T-Mobilecustomers on Nov. 8.
While the new WP7 phones appear to be capablecompetitors to the existing iPhone-Android-Blackberrytroika, Microsoft has a long climb ahead to effectivelymarket and sell the devices to consumers. If Microsoft canspur significant user adoption of WP7, then it can leverageits greatest advantage in the smartphone race: an army ofthird-party developers that is already accustomed tobuilding applications in the Microsoft developmentenvironment. Microsoft wisely broke compatibility withprevious Windows Mobile releases to center WP7development on the company's Silverlight and XNAframeworks. The advantage is that developers are alreadyfamiliar with these frameworks and Microsoft is providingadditional tools to speed up WP7 app development. Webelieve the iPhone juggernaut is unstoppable at this point,but if Microsoft can ignite the virtuous cycle of developerand user adoption, then it has a chance to either beat backthe onslaught of Android devices or take share away fromResearch in Motion RIMM .
Page 8 of 18
SAMPLE

Morningstar Equity Research
© Morningstar. All Rights Reserved. Unless otherwise provided in a separate agreement, you may use this report only in the country in which its original distributor is based. Data as originally reported. The information contained herein is not represented orwarranted to be accurate, correct, complete, or timely. This report is for information purposes only, and should not be considered a solicitation to buy or sell any security. Redistribution is prohibited without written permission. To order reprints, call +1312-696-6100. To license the research, call +1 312-696-6869.
Last Price Fair Value Consider Buy Consider Sell Uncertainty Economic Moat™ Moat Trend™ Stewardship Morningstar Credit Rating Industry Group
28.66 USD 32.00 USD 22.40 USD 44.80 USD Medium Wide Negative A AAA Application Software
Microsoft Corporation MSFT (NAS) | QQQ
Growth (% YoY)3-Year
Hist. CAGR Jun 2008 Jun 2009 Jun 2010 Jun 2011 Jun 20125-Year
Proj. CAGR
Revenue 6.9 18.2 -3.3 6.9 12.0 2.8 1.6EBIT 9.3 21.4 -8.0 16.7 12.0 5.0 3.5EBITDA 10.4 23.0 -5.3 15.4 12.3 4.8 3.3Net Income 10.2 25.7 -16.2 27.0 11.0 4.9 3.3Diluted EPS 14.0 31.2 -11.8 27.9 13.9 6.1 3.3Earnings Before Interest, after Tax 9.9 22.6 -9.0 18.8 -0.2 5.0 1.1Free Cash Flow to the Firm 13.3 -30.5 32.1 58.1 -11.4 7.8 -8.5
Profitability3-Year
Hist. Avg Jun 2008 Jun 2009 Jun 2010 Jun 2011 Jun 20125-Year
Proj. Avg
Operating margin % 37.1 37.2 35.4 38.7 38.7 39.5 39.0EBITDA margin % 41.1 40.6 39.8 42.9 43.1 43.9 43.4Net margin % 28.2 29.3 25.4 30.1 29.8 30.4 30.1Free Cash Flow to the Firm margin % 25.3 17.3 23.6 34.9 27.6 29.0 24.3ROIC with Goodwill % 58.7 67.9 52.6 55.4 52.7 50.3 45.1ROIC w/out Goodwill % 82.9 94.0 76.4 78.5 72.1 66.8 59.1Return on Assets, pretax % 29.8 33.1 27.0 29.4 28.7 25.5 22.4Return on Equity % 44.9 52.5 38.4 43.8 38.4 30.8 25.9
Leverage3-Year
Hist. Avg Jun 2008 Jun 2009 Jun 2010 Jun 2011 Jun 20125-Year
Proj. Avg
Debt/Capital 0.08 0.00 0.13 0.11 0.08 0.07 0.06Total Debt/EBITDA 0.16 0.00 0.25 0.22 0.19 0.18 0.19EBITDA/Interest Expense — — 42.91 — 207.83 225.61 230.90
2009 2010 2011(E) 2012(E)
Price/Fair Value 0.95 0.87 — —Price/Earnings 14.4 10.9 11.9 11.2EV/EBITDA 8.0 6.3 6.9 6.6EV/EBIT 9.0 7.0 7.7 7.3Free Cash Flow Yield % 7.5 11.1 8.1 8.7Dividend Yield % 2.1 2.3 1.9 1.9
Cost of Equity % 10.0Credit Spread for Debt % 1.0Weighted Average Cost of Capital % 9.9Long-Run Tax Rate % 25.0Stage II EBI Growth Rate % 3.0Stage II Investment Rate % 15.8Perpetuity Year 16
USD MilFirm Value
(%)Per Share
Value
Present Value Stage I 111,233 44.9 12.46Present Value Stage II 44,014 17.8 4.93Present Value of the Perpetuity 92,580 37.4 10.37Total Firm Value 247,827 100.0 27.76
Cash and Equivalents 44,542 — 4.99Debt 5,746 — -0.67Net balance sheet impact 38,603 — 4.32Other Adjustments 0 — 0.00Equity Value 286,430 — 32.97
Projected Diluted Shares 8,927
Fair Value per Share 32.00
Morningstar Analyst Forecasts
Forecast
Financial Summary and Forecasts
Valuation Summary and Forecasts
Key Valuation Drivers
Discounted Cash Flow Valuation
Additional estimates and scenarios available for download at http://select.morningstar.com. The data in the table above represent base-case forecasts. When probability-weightedscenario analysis is performed, the sum of per share values may differ from the Fair ValueEstimate.
(USD)
Page 9 of 18
SAMPLE

Morningstar Equity Research
© Morningstar. All Rights Reserved. Unless otherwise provided in a separate agreement, you may use this report only in the country in which its original distributor is based. Data as originally reported. The information contained herein is not represented orwarranted to be accurate, correct, complete, or timely. This report is for information purposes only, and should not be considered a solicitation to buy or sell any security. Redistribution is prohibited without written permission. To order reprints, call +1312-696-6100. To license the research, call +1 312-696-6869.
Last Price Fair Value Consider Buy Consider Sell Uncertainty Economic Moat™ Moat Trend™ Stewardship Morningstar Credit Rating Industry Group
28.66 USD 32.00 USD 22.40 USD 44.80 USD Medium Wide Negative A AAA Application Software
Microsoft Corporation MSFT (NAS) | QQQ
Jun 2008 Jun 2009 Jun 2010 Jun 2011 Jun 2012Organic Revenue 60,420 58,437 62,484 69,982 71,948Acquired (Divested) Revenue 0 0 0 0 0Total Revenue 60,420 58,437 62,484 69,982 71,948
Cost of Goods Sold 11,598 12,155 12,395 13,882 13,814Gross Profit 48,822 46,282 50,089 56,100 58,134
Selling, General & Administrative Expenses 5,127 3,700 4,004 4,484 4,533Research & Development Expenses 8,164 9,010 8,714 9,760 10,073Other Operating Expenses (Income) 13,039 12,879 13,214 14,800 15,109Restructuring & Other Charges (Gains) 0 330 59 0 0Depreciation Expense (if reported separately) 0 0 0 0 0Amortization of Other Intangibles (if reported seperately) 0 0 0 0 0Amortization/Impairment of Goodwill 0 0 0 0 0Total Expenses 37,928 38,074 38,386 42,926 43,529
Operating Income (EBIT) 22,492 20,363 24,098 27,056 28,420
Interest Expense 0 542 0 145 140Interest & Other Income (Expense) 1,322 0 915 915 915Pre-Tax Income 23,814 19,821 25,013 27,826 29,195
Income Tax Expense (Benefit) 6,133 5,252 6,253 6,956 7,299Income After Taxes 17,681 14,569 18,760 20,869 21,896
Minority Interest & Other After-Tax Operating Additions to (Subtractions from) Earnings Before Interest
0 0 0 0 0
(Preferred Dividends) 0 0 0 0 0After-Tax Non-Operating Income, Extraordinary Items (Losses), Discontinued Operations, Accounting Changes
0 0 0 0 0
Net Income (Loss) 17,681 14,569 18,760 20,869 21,896 Net Income (Loss) Excluding Charges 17,681 14,812 18,804 20,869 21,896
Diluted Shares Outstanding (Mil) 9,470 8,996 8,927 8,927 8,927 Diluted EPS Including Charges (USD) 1.87 1.62 2.10 2.40 2.55 Diluted EPS Excluding Charges (USD) 1.87 1.65 2.11 2.40 2.55
Dividends Per Common Share (USD) 0.00 0.50 0.51 0.51 0.51
EBITDA 24,548 22,925 26,771 30,135 31,585EBITDA without restructuring 24,548 23,255 26,830 30,135 31,585
Morningstar Analyst Forecasts
Pro Forma Income Statement (USD Mil)Forecast
Page 10 of 18
SAMPLE
Morningstar Equity Research
© Morningstar. All Rights Reserved. Unless otherwise provided in a separate agreement, you may use this report only in the country in which its original distributor is based. Data as originally reported. The information contained herein is not represented orwarranted to be accurate, correct, complete, or timely. This report is for information purposes only, and should not be considered a solicitation to buy or sell any security. Redistribution is prohibited without written permission. To order reprints, call +1312-696-6100. To license the research, call +1 312-696-6869.
Last Price Fair Value Consider Buy Consider Sell Uncertainty Economic Moat™ Moat Trend™ Stewardship Morningstar Credit Rating Industry Group
28.66 USD 32.00 USD 22.40 USD 44.80 USD Medium Wide Negative A AAA Application Software
Microsoft Corporation MSFT (NAS) | QQQ
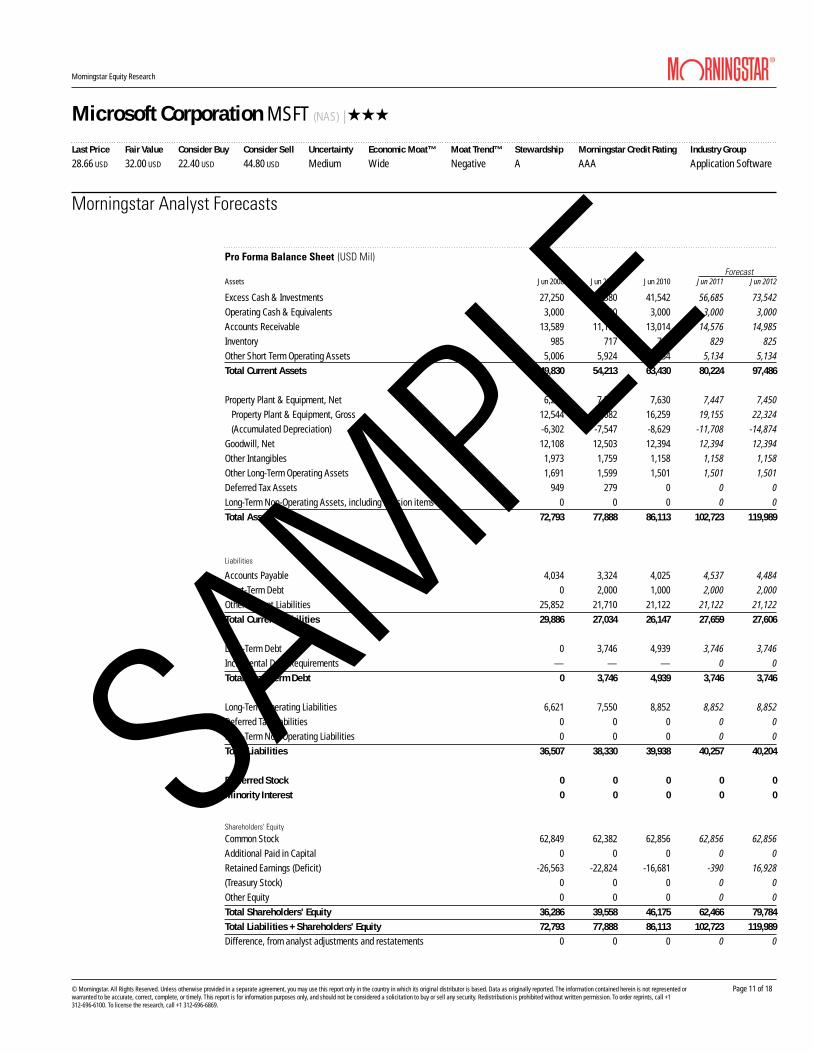
Assets Jun 2008 Jun 2009 Jun 2010 Jun 2011 Jun 2012
Excess Cash & Investments 27,250 33,380 41,542 56,685 73,542Operating Cash & Equivalents 3,000 3,000 3,000 3,000 3,000Accounts Receivable 13,589 11,192 13,014 14,576 14,985Inventory 985 717 740 829 825Other Short Term Operating Assets 5,006 5,924 5,134 5,134 5,134Total Current Assets 49,830 54,213 63,430 80,224 97,486
Property Plant & Equipment, Net 6,242 7,535 7,630 7,447 7,450 Property Plant & Equipment, Gross 12,544 15,082 16,259 19,155 22,324 (Accumulated Depreciation) -6,302 -7,547 -8,629 -11,708 -14,874Goodwill, Net 12,108 12,503 12,394 12,394 12,394Other Intangibles 1,973 1,759 1,158 1,158 1,158Other Long-Term Operating Assets 1,691 1,599 1,501 1,501 1,501Deferred Tax Assets 949 279 0 0 0Long-Term Non-Operating Assets, including Pension items 0 0 0 0 0Total Assets 72,793 77,888 86,113 102,723 119,989
Accounts Payable 4,034 3,324 4,025 4,537 4,484Short-Term Debt 0 2,000 1,000 2,000 2,000Other Current Liabilities 25,852 21,710 21,122 21,122 21,122Total Current Liabilities 29,886 27,034 26,147 27,659 27,606
Long-Term Debt 0 3,746 4,939 3,746 3,746Incremental Debt Requirements — — — 0 0Total Long-Term Debt 0 3,746 4,939 3,746 3,746
Long-Term Operating Liabilities 6,621 7,550 8,852 8,852 8,852Deferred Tax Liabilities 0 0 0 0 0Long-Term Non-Operating Liabilities 0 0 0 0 0Total Liabilities 36,507 38,330 39,938 40,257 40,204
Preferred Stock 0 0 0 0 0Minority Interest 0 0 0 0 0
Common Stock 62,849 62,382 62,856 62,856 62,856Additional Paid in Capital 0 0 0 0 0Retained Earnings (Deficit) -26,563 -22,824 -16,681 -390 16,928(Treasury Stock) 0 0 0 0 0Other Equity 0 0 0 0 0Total Shareholders' Equity 36,286 39,558 46,175 62,466 79,784Total Liabilities + Shareholders' Equity 72,793 77,888 86,113 102,723 119,989Difference, from analyst adjustments and restatements 0 0 0 0 0
Morningstar Analyst Forecasts
Pro Forma Balance Sheet (USD Mil)Forecast
Liabilities
Shareholders' Equity
Page 11 of 18
SAMPLE
Morningstar Equity Research
© Morningstar. All Rights Reserved. Unless otherwise provided in a separate agreement, you may use this report only in the country in which its original distributor is based. Data as originally reported. The information contained herein is not represented orwarranted to be accurate, correct, complete, or timely. This report is for information purposes only, and should not be considered a solicitation to buy or sell any security. Redistribution is prohibited without written permission. To order reprints, call +1312-696-6100. To license the research, call +1 312-696-6869.
Last Price Fair Value Consider Buy Consider Sell Uncertainty Economic Moat™ Moat Trend™ Stewardship Morningstar Credit Rating Industry Group
28.66 USD 32.00 USD 22.40 USD 44.80 USD Medium Wide Negative A AAA Application Software
Microsoft Corporation MSFT (NAS) | QQQ
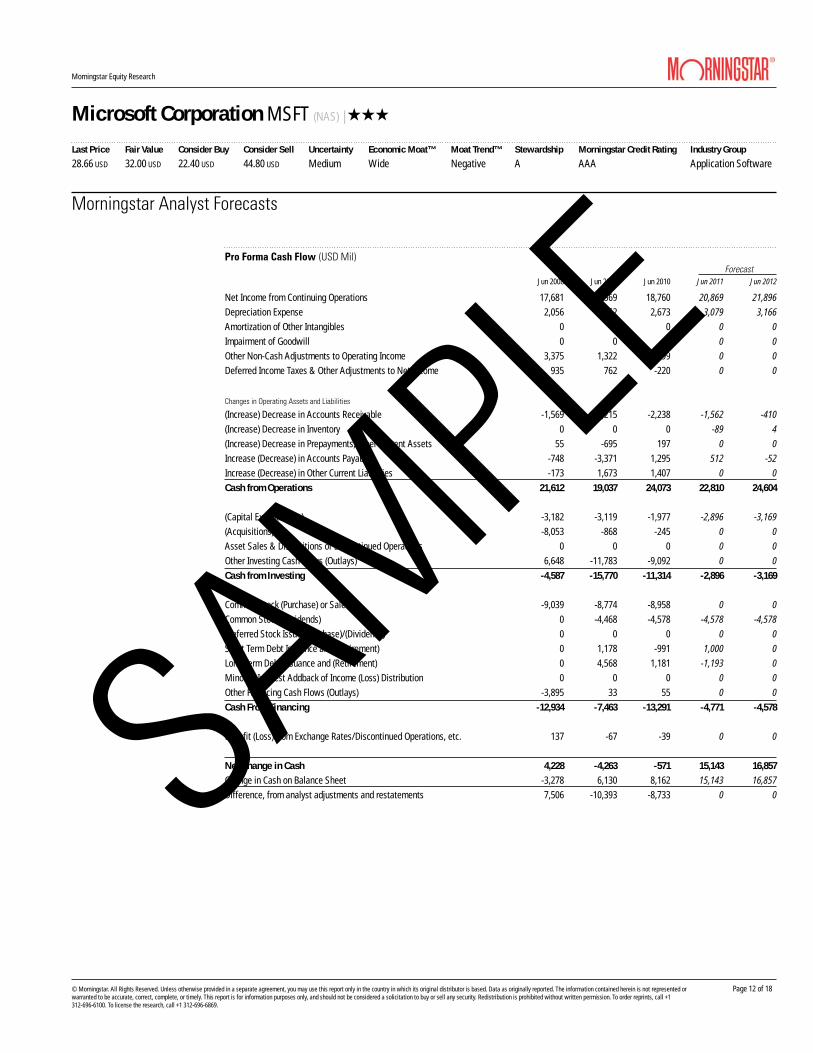
Jun 2008 Jun 2009 Jun 2010 Jun 2011 Jun 2012
Net Income from Continuing Operations 17,681 14,569 18,760 20,869 21,896Depreciation Expense 2,056 2,562 2,673 3,079 3,166Amortization of Other Intangibles 0 0 0 0 0Impairment of Goodwill 0 0 0 0 0Other Non-Cash Adjustments to Operating Income 3,375 1,322 2,199 0 0Deferred Income Taxes & Other Adjustments to Net Income 935 762 -220 0 0
(Increase) Decrease in Accounts Receivable -1,569 2,215 -2,238 -1,562 -410(Increase) Decrease in Inventory 0 0 0 -89 4(Increase) Decrease in Prepayments, other Current Assets 55 -695 197 0 0Increase (Decrease) in Accounts Payable -748 -3,371 1,295 512 -52Increase (Decrease) in Other Current Liabilities -173 1,673 1,407 0 0Cash from Operations 21,612 19,037 24,073 22,810 24,604
(Capital Expenditures) -3,182 -3,119 -1,977 -2,896 -3,169(Acquisitions) -8,053 -868 -245 0 0Asset Sales & Dispositions of Discontinued Operations 0 0 0 0 0Other Investing Cash Flows (Outlays) 6,648 -11,783 -9,092 0 0Cash from Investing -4,587 -15,770 -11,314 -2,896 -3,169
Common Stock (Purchase) or Sale -9,039 -8,774 -8,958 0 0Common Stock (Dividends) 0 -4,468 -4,578 -4,578 -4,578Preferred Stock Issue/(Purchase)/(Dividends) 0 0 0 0 0Short Term Debt Issuance and (Retirement) 0 1,178 -991 1,000 0Long Term Debt Issuance and (Retirement) 0 4,568 1,181 -1,193 0Minority Interest Addback of Income (Loss) Distribution 0 0 0 0 0Other Financing Cash Flows (Outlays) -3,895 33 55 0 0Cash From Financing -12,934 -7,463 -13,291 -4,771 -4,578
Benefit (Loss) from Exchange Rates/Discontinued Operations, etc. 137 -67 -39 0 0
Net Change in Cash 4,228 -4,263 -571 15,143 16,857Change in Cash on Balance Sheet -3,278 6,130 8,162 15,143 16,857Difference, from analyst adjustments and restatements 7,506 -10,393 -8,733 0 0
Morningstar Analyst Forecasts
Pro Forma Cash Flow (USD Mil)Forecast
Changes in Operating Assets and Liabilities
Page 12 of 18
SAMPLE

Morningstar Equity Research
© Morningstar. All Rights Reserved. Unless otherwise provided in a separate agreement, you may use this report only in the country in which its original distributor is based. Data as originally reported. The information contained herein is not represented orwarranted to be accurate, correct, complete, or timely. This report is for information purposes only, and should not be considered a solicitation to buy or sell any security. Redistribution is prohibited without written permission. To order reprints, call +1312-696-6100. To license the research, call +1 312-696-6869.
Last Price Fair Value Consider Buy Consider Sell Uncertainty Economic Moat™ Moat Trend™ Stewardship Morningstar Credit Rating Industry Group
28.66 USD 32.00 USD 22.40 USD 44.80 USD Medium Wide Negative A AAA Application Software
Microsoft Corporation MSFT (NAS) | QQQ
Company/TickerPrice/Fair
Value 2010 2011(E) 2012(E) 2010 2011(E) 2012(E) 2010 2011(E) 2012(E) 2010 2011(E) 2012(E) 2010 2011(E) 2012(E)
Apple, Inc. AAPL US NA 20.4 28.2 24.6 18.8 17.5 15.2 28.8 35.9 25.8 8.2 7.3 5.7 6.1 5.0 4.4
Google, Inc. GOOG US 1.04 23.4 25.1 21.4 17.5 13.9 11.9 23.2 25.6 21.6 5.5 4.6 3.8 8.3 7.2 6.1
Oracle Corporation ORCL US 0.90 NA 15.3 13.5 9.5 10.0 9.3 13.4 14.5 15.1 3.6 4.2 3.4 4.2 4.5 4.2
Sap AG SAP US 1.07 20.5 22.0 19.3 11.1 12.3 10.9 13.9 19.5 17.7 4.6 4.9 4.1 3.6 4.0 3.5
Sony Corporation SNE US 1.24 NM 25.7 18.1 13.0 7.9 6.6 15.5 NM NM 1.3 1.1 1.0 0.6 0.4 0.4
Average 21.4 23.3 19.4 14.0 12.3 10.8 19.0 23.9 20.1 4.6 4.4 3.6 4.6 4.2 3.7
Microsoft Corporation MSFT US 0.90 10.9 11.9 11.2 6.3 6.9 6.6 9.0 12.3 11.4 4.3 3.9 3.1 3.2 3.5 3.4
Company/TickerTotal Assets
(Mil) 2010 2011(E) 2012(E) 2010 2011(E) 2012(E) 2010 2011(E) 2012(E) 2010 2011(E) 2012(E) 2010 2011(E) 2012(E)Apple, Inc. AAPL US 47,501 USD 139.6 121.4 116.6 144.0 124.1 118.7 30.5 29.5 25.7 28.1 29.6 27.2 NA NA NA
Google, Inc. GOOG US 40,497 USD 42.3 39.0 39.2 54.0 48.7 47.5 20.3 18.2 17.5 23.0 22.2 21.3 NA NA NA
Oracle Corporation ORCL US 61,578 USD 28.5 28.9 28.8 59.6 56.8 56.2 21.8 22.0 20.8 16.6 17.5 17.9 0.9 0.6 0.6
Sap AG SAP US 13,374 EUR 20.2 19.7 20.4 30.9 33.1 37.1 22.4 23.0 22.8 19.0 18.4 17.5 1.5 1.2 1.2
Sony Corporation SNE US 6,522,837 JPY 6.2 5.6 7.4 6.2 5.6 7.4 -3.4 3.2 5.5 -1.8 2.2 3.4 0.7 0.9 0.9
Average 47.4 42.9 42.5 58.9 53.7 53.4 18.3 19.2 18.5 17.0 18.0 17.5 1.0 0.9 0.9
Microsoft Corporation MSFT US 86,113 USD 55.4 52.7 50.3 78.5 72.1 66.8 43.8 38.4 30.8 29.4 28.7 25.5 2.3 1.9 1.9
Company/TickerRevenue
(Mil) 2010 2011(E) 2012(E) 2010 2011(E) 2012(E) 2010 2011(E) 2012(E) 2010 2011(E) 2012(E) 2010 2011(E) 2012(E)Apple, Inc. AAPL US 42,905 USD 14.4 45.3 14.9 41.0 33.9 14.9 33.9 32.9 14.6 6.0 -3.4 39.2 NA NA NA
Google, Inc. GOOG US 23,651 USD 8.5 20.8 17.5 25.3 20.5 16.7 37.1 -3.9 17.6 54.8 -6.2 18.6 NA NA NA
Oracle Corporation ORCL US 26,820 USD 15.3 31.9 7.3 15.0 23.6 7.8 16.2 23.3 13.5 9.4 30.2 -4.0 306.1 0.1 2.0
Sap AG SAP US 10,672 EUR -7.8 13.3 13.5 0.9 10.4 15.0 0.3 15.5 14.2 53.4 -11.2 9.7 0.2 0.0 0.0
Sony Corporation SNE US 6,362,602 JPY -11.5 5.0 4.5 -51.6 -421.3 33.5 -54.4 -403.2 41.8 -160.6 -150.9 -69.6 -41.1 0.0 0.0
Average 3.8 23.3 11.5 6.1 -66.6 17.6 6.6 -67.1 20.3 -7.4 -28.3 -1.2 88.4 0.0 0.7
Microsoft Corporation MSFT US 62,484 USD 6.9 12.0 2.8 16.7 12.0 5.0 27.9 13.9 6.1 38.8 -9.9 7.6 3.3 0.0 0.0
Comparable Company AnalysisThese companies are chosen by the analyst and the data are shown by nearest calendar year in descending market capitalization order.
Valuation Analysis
Returns Analysis
Growth Analysis
Price/Earnings EV/EBITDA Price/Free Cash Flow Price/Book Price/Sales
ROIC with Goodwill % ROIC without Goodwill % Return on Equity % Return on Assets, Pretax % Dividend Yield %
Revenue Growth % EBIT Growth % EPS Growth % Free Cash Flow Growth % Dividend/Share Growth %
Last Historical Year
Last Historical Year
Page 13 of 18
SAMPLE

Morningstar Equity Research
© Morningstar. All Rights Reserved. Unless otherwise provided in a separate agreement, you may use this report only in the country in which its original distributor is based. Data as originally reported. The information contained herein is not represented orwarranted to be accurate, correct, complete, or timely. This report is for information purposes only, and should not be considered a solicitation to buy or sell any security. Redistribution is prohibited without written permission. To order reprints, call +1312-696-6100. To license the research, call +1 312-696-6869.
Last Price Fair Value Consider Buy Consider Sell Uncertainty Economic Moat™ Moat Trend™ Stewardship Morningstar Credit Rating Industry Group
28.66 USD 32.00 USD 22.40 USD 44.80 USD Medium Wide Negative A AAA Application Software
Microsoft Corporation MSFT (NAS) | QQQ
Company/TickerNet Income
(Mil) 2010 2011(E) 2012(E) 2010 2011(E) 2012(E) 2010 2011(E) 2012(E) 2010 2011(E) 2012(E) 2010 2011(E) 2012(E)Apple, Inc. AAPL US 8,235 USD 40.1 38.0 38.0 29.1 26.9 26.9 27.4 25.2 25.2 19.2 17.6 17.5 21.0 14.0 16.9
Google, Inc. GOOG US 8,536 USD 62.6 63.7 63.9 41.6 41.8 41.5 35.2 35.1 34.8 27.6 25.6 25.6 36.0 27.9 28.2
Oracle Corporation ORCL US 8,495 USD 78.5 74.6 75.2 45.2 42.4 42.5 36.7 34.4 34.5 25.0 23.4 23.9 31.5 31.1 27.9
Sap AG SAP US 1,894 EUR 66.6 66.9 68.3 30.8 29.8 29.8 26.1 25.5 25.8 17.8 18.1 18.2 26.1 20.5 19.8
Sony Corporation SNE US -37,596 JPY 29.9 32.5 33.0 4.7 6.6 7.6 -1.2 3.6 4.6 -0.6 1.7 2.3 3.7 -1.8 -0.5
Average 55.5 55.1 55.7 30.3 29.5 29.7 24.8 24.8 25.0 17.8 17.3 17.5 23.7 18.3 18.5
Microsoft Corporation MSFT US 18,804 USD 80.2 80.2 80.8 42.9 43.1 43.9 38.7 38.7 39.5 30.1 29.8 30.4 35.4 28.5 29.8
Company/TickerTotal Debt
(Mil) 2010 2011(E) 2012(E) 2010 2011(E) 2012(E) 2010 2011(E) 2012(E) 2010 2011(E) 2012(E) 2010 2011(E) 2012(E)Apple, Inc. AAPL US 0 USD 0.0 0.0 0.0 0.0 0.0 0.0 NA NA NA 0.0 0.0 0.0 1.5 1.4 1.3
Google, Inc. GOOG US 0 USD 0.0 0.0 0.0 0.0 0.0 0.0 NA NM NM 0.0 0.0 0.0 1.1 1.1 1.1
Oracle Corporation ORCL US 14,655 USD 47.0 30.0 24.6 32.0 23.1 19.7 16.1 21.7 27.9 1.2 0.8 0.7 2.0 1.7 1.6
Sap AG SAP US 703 EUR 8.3 44.8 35.9 7.7 30.9 26.4 32.5 40.6 26.9 0.2 1.2 1.0 1.6 1.9 1.8
Sony Corporation SNE US 1,124,049 JPY 42.2 90.0 86.5 29.7 47.4 46.4 13.2 19.6 23.6 3.8 5.5 4.6 2.4 2.9 2.9
Average 19.5 33.0 29.4 13.9 20.3 18.5 20.6 27.3 26.1 1.0 1.5 1.3 1.7 1.8 1.7
Microsoft Corporation MSFT US 5,939 USD 12.9 9.2 7.2 11.4 8.4 6.7 NA 207.8 225.6 0.2 0.2 0.2 1.9 1.6 1.5
Company/TickerMarket Cap
(Mil) 2010 2011(E) 2012(E) 2010 2011(E) 2012(E) 2010 2011(E) 2012(E) 2010 2011(E) 2012(E) 2010 2011(E) 2012(E)
Apple, Inc. AAPL US 312,481 USD 37.48 47.08 61.98 37.48 47.08 61.98 11.20 11.70 15.62 9.94 9.60 13.36 0.0 0.0 0.0
Google, Inc. GOOG US 204,538 USD 76.00 100.74 130.08 76.00 100.74 130.07 28.92 32.23 37.20 26.40 24.78 29.37 0.0 0.0 0.0
Oracle Corporation ORCL US 159,303 USD 3.64 4.11 5.29 0.75 1.84 3.02 1.71 2.27 2.19 1.67 2.17 2.08 16.4 13.2 11.6
Sap AG SAP US 64,621 USD 2.18 3.02 4.70 1.59 -0.72 1.12 2.54 2.31 2.54 2.35 2.09 2.29 33.9 28.0 23.9
Sony Corporation SNE US 36,034 USD 983.18 2,126.06 2,041.62 -135.12 -303.05 -387.49 567.31 236.05 333.87 230.99 -117.65 -35.76 -37.3 37.6 19.0
Average 220.5 456.2 448.7 -3.9 -30.8 -38.3 122.3 56.9 78.3 54.3 -15.8 2.3 2.6 15.8 10.9
Microsoft Corporation MSFT US 245,201 USD 4.99 6.69 8.57 4.32 6.04 7.93 2.70 2.56 2.76 2.48 2.23 2.40 24.4 21.9 20.9
Comparable Company AnalysisThese companies are chosen by the analyst and the data are shown by nearest calendar year in descending market capitalization order.
Profitability Analysis
Leverage Analysis
Liquidity Analysis
Gross Margin % EBITDA Margin % Operating Margin % Net Margin % Free Cash Flow Margin %
Debt/Equity % Debt/Total Cap % EBITDA/Interest Exp. Total Debt/EBITDA Assets/Equity
Cash per Share Net Cash per Share CFO per Share Free Cash Flow per Share Payout Ratio %
Last Historical Year
Last Historical Year
Page 14 of 18
SAMPLE

Analyst conducts company and industry research:
Financial statementanalysis
Channel checks
Trade-show visits
Industry and company reports and journals
Conference calls
Management andsite visits
3
3
3
3
3
3
Strength of competitive advantage is rated: None, Narrow, or Wide
Advantages that confer an economic moat:
High Switching Costs (Microsoft)
Cost advantage (Wal-Mart)
Intangible assets(Johnson & Johnson)
Network Effect(Mastercard)
Analyst considers past financial resultsand focuses on competitive position and future prospects to forecast future cash flows.
Assumptions areentered into Morningstar’s proprietary discounted cash-flow model.
The analyst then eval-uates the range of potential intrinsic values for the company and assigns an uncertainty rating: Low, Medium, High, Very High, or Extreme.
The uncertainty rating determines the margin of safety required before we would rec-ommend the stock.The higher the uncer-tainty, the wider the margin of safety.
Analyst uses adiscounted cash-flowmodel to develop a Fair Value Estimate, which serves as the foundation for the Morningstar Star Rating.
The current stock price relative to Morningstar’s Fair Value Estimate, adjusted for uncertainty, determines the Morningstar Rating for stocks.
The Morningstar Rating for stocks is updated each evening after the market closes.
QQQQQQQQQQQQQQQ
FundamentalAnalysis
EconomicMoat™ Rating
CompanyValuation
Fair ValueEstimate
UncertaintyAssessment
Investment Research
Plan Design
Plan Monitoring
I
Investment Consulting
Morningstar Direct
Sponsor Provider
©2009 Morningstar. All Rights Reserved. Unless otherwise provided in a separate agreement, you may use this report only in the country in which its original distributor is based. Data as originally reported. The information contained herein is not represented or warranted to be accurate, correct, complete, or timely. This report is for information purposes only, and should not be considered a solicitation to buy or sell any security. To order reprints or get permission to use this information, call 312-696-6100.
Morningstar Equity Research
Research Methodology for Valuing Companies
Morningstar Research Methodology for Valuing Companies
Components of Our Methodology
3 Economic Moat™ Rating
3 Moat Trend™ Rating
3 Moat Valuation
3 Three-Stage Discounted Cash Flow
3 Weighted Average Cost of Capital
3 Fair Value Estimate
3 Scenario Analysis
3 Uncertainty Ratings
3 Margin of Safety
3 Consider Buying/Selling
3 Stewardship Grades
3 Financial Health Grades
the latter stages of our valuation model. We also quantify the value of each firm’s moat, which represents the differ-ence between a firm’s enterprise value and the value of the firm if no future net investment were to occur. Said differ-ently, moat value identifies the value generated by the firm as a result of any future net new investment. Our Moat Trend Rating reflects our assessment of whether each firm’s competitive advantage is either getting stronger or weaker, since we think of moats as dynamic, rather than static.
At the heart of our valuation system is a detailed projec-tion of a company’s future cash flows. The first stage of our three-stage discounted cash flow model can last from 5 to 10 years and contains numerous detailed assumptions about various financial and operating items. The second stage of our model—where a firm’s return on new invested capital (RONIC) and earnings growth rate implicitly fade until the perpetuity year—can last anywhere from 0 years (for no-moat firms) to 20 years (for wide-moat companies). In our third stage, we assume the firm’s RONIC equals its weighted average cost of capital, and we calculate a con-
The Morningstar Rating for stocks identifies companies trading at a discount or premium to our analysts’ assess-ment of their fair value. A number of components drive this rating: (1) our assessment of the firm’s economic moat, (2) our estimate of the stock’s intrinsic value based on a dis-counted cash-flow model, (3) the margin of safety bands we apply to our Fair Value Estimate, and (4) the current stock price relative to our fair value estimate.
The concept of the Morningstar Economic Moat™ Rating plays a vital role not only in our qualitative assessment of a firm’s investment potential, but also in our valuation process. We assign three moat ratings—none, narrow, or wide—as well as the Morningstar Moat Trend™ Rating—positive, stable, or negative—to each company we cover. There are two major requirements for firms to earn either a narrow or wide moat rating: (1) the prospect of earning above-average returns on capital; and (2) some competitive edge that prevents these returns from quickly eroding. The assumptions we make about a firm’s moat determine the length of “economic outperformance” that we assume in
© Morningstar. All Rights Reserved. Unless otherwise provided in a separate agreement, you may use this report only in the country in which its original distributor is based. Data as originally reported. The information contained herein is notrepresented or warranted to be accurate, correct, complete, or timely. This report is for information purposes only, and should not be considered a solicitation to buy or sell any security. Redistribution is prohibited without written permission. Toorder reprints, call +1 312-696-6100. To license the research, call +1 312-696-6869.
Page 15 of 18
SAMPLE

©2009 Morningstar. All Rights Reserved. Unless otherwise provided in a separate agreement, you may use this report only in the country in which its original distributor is based. Data as originally reported. The information contained herein is not represented or warranted to be accurate, correct, complete, or timely. This report is for information purposes only, and should not be considered a solicitation to buy or sell any security. To order reprints or get permission to use this information, call 312-696-6100.
Morningstar Equity Research
Research Methodology for Valuing Companies
an appropriate margin of safety—or the discount/premium to a fair value we apply in setting our consider buying/con-sider selling prices. Firms trading below our consider-buy-ing prices receive our highest rating of five stars, whereas firms trading above our consider-selling prices receive our lowest rating of one star.
Our Stewardship Grades show our assessment of a man-agement’s commitment to shareholders, and include an analysis of a firm’s transparency, incentives and owner-ship. We also provide Financial Health Grades, which are quantitative measures based on firms’ distance to default scores. Distance to default measures the distance between the market value of a company’s assets and the book value of its liabilities (expressed in standard deviations of asset value). For our grades, A is equivalent to “Excellent,” while F is “Very Poor.”
tinuing value using a standard perpetuity formula. In decid-ing on the rate at which to discount future cash flows, we ignore stock-price volatility. Instead, we rely on a system that measures the estimated volatility of a firm’s underly-ing future free cash flows, taking into account fundamental factors such as the diversity of revenue sources and the firm’s fixed cost structure.
We also employ a number of other tools to augment our valuation process, including scenario analysis, where we assess the likelihood and performance of a business un-der different economic and firm-specific conditions. Our analysts typically model three to five scenarios for each company we cover, stress-testing the model and examining the distribution of resulting fair values.
The Morningstar Uncertainty Rating captures the range ofthese potential fair values, based on an assessment of acompany’s future sales range, the firm’s operating and fin-ancial leverage, and any other contingent events that mayimpact the business. Our analysts use this range to assign
-
Price/Fair Value
Morningstar Margin of Safety and Star Rating Bands as of October 10, 2008.
2.75
2.50
2.25
2.00
1.75
1.50
1.25
1.00
0.75
0.50
0.25
Low Medium High Very High*
* Occasionally a stock’s uncertainty will be too high for us to estimate, in which case we label it ‘Extreme’.
• 5 Star
• 4 Star
• 3 Star
• 2 Star
• 1 Star
Uncertainty Rating
— 125%110% —
80% —— 90%
— 140%
115% —
70% —— 85%
— 200%
135% —
50% —
— 75%
— 250%
150% —
40% —
— 65%
Detailed Methodology Documents and Materials*
3 Comprehensive Equity Research Methodology
3 Uncertainty Methodology
3 Cost of Equity Methodology
3 Morningstar DCF Valuation Model
3 Stewardship Grade Methodology
3 Stock Grade Methodology for Financial Health
* Please contact a sales representative for more information.
Morningstar Margin of Safety and Star Rating Bands
© Morningstar. All Rights Reserved. Unless otherwise provided in a separate agreement, you may use this report only in the country in which its original distributor is based. Data as originally reported. The information contained herein is notrepresented or warranted to be accurate, correct, complete, or timely. This report is for information purposes only, and should not be considered a solicitation to buy or sell any security. Redistribution is prohibited without written permission. Toorder reprints, call +1 312-696-6100. To license the research, call +1 312-696-6869.
Page 16 of 18
SAMPLE

©2010 Morningstar. All Rights Reserved. The information contained herein is not represented or warranted to be accurate, correct, complete, or timely. This report is for information purposes only, and should not be considered a solicitation to buy or sell any security. Redistribution is prohibited without written permission. For licensing or permission to use this information, call +1 312-696-6869.
Morningstar Corporate Credit Rating
3 Offers a new measure of the credit quality of compa-nies on our coverage list.
3 Encapsulates our in-depth modeling and quantitative work in one letter grade.
3 Allows investors to rank companies by each of the four underlying com- ponents of our credit ratings, including both analyst-driven and quantitative measures.
3 Provides access to all the underlying forecasts that go into the rating, available through our insti-tutional service.
MethodologyWe feel it’s important to perform credit analysis through different lenses—qualitative and quantitative, as well as fundamental and market-driven. We therefore evaluate each company in four broad categories.
Business RiskBusiness Risk captures the fundamental uncertainty around a firm’s business operations and the cash flow generated by those operations. Key components of the Business Risk rating include the Morningstar Economic Moat™ Rating and the Morningstar Uncertainty Rating.
Cash Flow Cushion™
Morningstar’s proprietary Cash Flow Cushion™ ratio is a fundamental indicator of a firm’s future financial health The measure reveals how many times a company’s internal cash generation plus total excess liquid cash will cover its debt-like contractual commitments over the next five years. The Cash Flow Cushion acts as a predictor of financial distress, bringing to light potential refinancing, operational, and liquidity risks inherent to the firm.
3
3
3
3
3
3
PurposeThe Morningstar Corporate Credit Rating measures the ability of a firm to satisfy its debt and debt-like obligations. The higher the rating, the less likely we think the company is to default on these obligations.
The Morningstar Corporate Credit Rating builds on the modeling expertise of our securities research team. For each company, we publish:
Five years of detailed pro-forma financial statements
Annual estimates of free cash flow
Annual forecasts of return on invested capital
Scenario analyses, including upside and downside cases
Forecasts of leverage, coverage, and liquidity ratios for five years
Estimates of off balance sheet liabilities
These forecasts are key inputs into the Morningstar Corporate Credit Rating and are available to subscribers at select.morningstar.com.
Morningstar’s Approach to Rating Corporate Credit
Morningstar Research Methodology for Determining Corporate Credit Ratings
Competitive Analysis
Cash-Flow Forecasts
ScenarioAnalysis
Quantitative Checks
RatingCommittee
AAA
BBBC
D
BB
BCC
CCC
Analyst conducts company and industry research:
• Management interviews• Conference calls• Trade show visits• Competitor, supplier, distributor, and customer interviews• Assign Economic Moat™ Rating
Analyst considers company financial statements and competitive dynamics to forecast future free cash flows to the firm.
Analyst derives estimate of Cash- Flow Cushion™.
Analysts run bull and bear cases through the model to derive alternate estimates of enterprise value.
Based on compet- itive analysis, cash-flow fore- casts, and scenario analysis, the analyst assigns Business Risk.
We gauge a firm’s health using quantitative tools supported by our own backtesting and academic research.
• Morningstar Solvency Score™
• Distance to Default
Senior personnel review each company to determine the appropriate final credit rating.
• Review modeling assumptions• Approve company-specific adjustments
AAA Extremely Low Default Risk AA Very Low Default Risk A Low Default Risk BBB Moderate Default Risk
BB Above Average Default Risk B High Default Risk CCC Currently Very High Default Risk CC Currently Extreme Default Risk
C Imminent Payment Default D Payment Default
AAA
© Morningstar. All Rights Reserved. Unless otherwise provided in a separate agreement, you may use this report only in the country in which its original distributor is based. Data as originally reported. The information contained herein is notrepresented or warranted to be accurate, correct, complete, or timely. This report is for information purposes only, and should not be considered a solicitation to buy or sell any security. Redistribution is prohibited without written permission. Toorder reprints, call +1 312-696-6100. To license the research, call +1 312-696-6869.
Page 17 of 18
SAMPLE

©2010 Morningstar. All Rights Reserved. The information contained herein is not represented or warranted to be accurate, correct, complete, or timely. This report is for information purposes only, and should not be considered a solicitation to buy or sell any security. Redistribution is prohibited without written permission. For licensing or permission to use this information, call +1 312-696-6869.
Overall Credit RatingThe four component ratings roll up into a single prelim-inary credit rating. To determine the final credit rating, a credit committee of at least five senior research per-sonnel reviews each preliminary rating.
We review credit ratings on a regular basis and as events warrant. Any change in rating must be approved by the Credit Rating Committee.
Investor AccessMorningstar Corporate Credit Ratings are available on Morningstar.com, as are the four underlying ratings. Our credit research, including detailed cash-flow models that contain all of the components of the Morningstar Corporate Credit Rating, is available to subscribers at select.morningstar.com.
The advantage of the Cash Flow Cushion ratio relative to other fundamental indicators of credit health is that the measure focuses on the future cash-generating performance of the firm derived from Morningstar’s proprietary discounted cash flow model. By making standardized adjustments for certain expenses to reflect their debt-like characteristics, we can compare future projected free cash flows with debt-like cash commitments coming due in any particular year. The forward-looking nature of this metric allows us to anticipate changes in a firm’s financial health and pinpoint periods where cash shortfalls are likely to occur.
Morningstar Solvency Score™
The Morningstar Solvency Score™ is a quantitative score derived from both historical and forecasted financial ratios.It includes ratios that focus on liquidity (a com-pany’s ability to meet short term cash outflows), profita-bility (a company’s ability to generate profit per unit of input), capital structure (how does the company finance its operations), and interest coverage (how much of profit is used up by interest payments).
Distance to DefaultThe Distance to Default rating is a quantitative, market-based measure of a company’s current financial health. (Distance to Default serves as the basis for Morningstar’s Financial Health Grade.) The underlying model treats the equity of a firm as a call option on that firm’s assets. Based on estimates of asset volatility and the Black-Scholes option-pricing model, we can estimate the likelihood that the value of the company’s assets falls below the value of its liabilities, implying likely default.
For each of these four categories, we assign a score, which we then translate into a descriptive rating along the scale of Very Good / Good / Fair / Poor / Very Poor.
Morningstar Corporate Credit Rating
Morningstar’s Approach to Rating Corporate Credit
© Morningstar. All Rights Reserved. Unless otherwise provided in a separate agreement, you may use this report only in the country in which its original distributor is based. Data as originally reported. The information contained herein is notrepresented or warranted to be accurate, correct, complete, or timely. This report is for information purposes only, and should not be considered a solicitation to buy or sell any security. Redistribution is prohibited without written permission. Toorder reprints, call +1 312-696-6100. To license the research, call +1 312-696-6869.
Page 18 of 18
SAMPLE

Microsoft Corp. Valuation Model
Morningstar Company Valuation Model SummaryMicrosoft Corp. MSFT
INCOME STATEMENT BALANCE SHEET CASH FLOW STATEMENT ROIC RATIOS COST OF CAPITAL CREDIT RATING OTHER MACROSAnalyst: Last Modified: OPERATING ASSUMPTIONS STAGE I FCF MOAT & STAGE II-III STAGE II-III FCF FX/ADR COMMON SIZE PRINT OPTIONSToan Tran 10/28/2010312-696-6419 Valuation Summary % of Firm Per Share Implied Valuation [email protected] Millions Value Value Jun-10 Jun-11 Jun-15 5yr. Avg. Hist. Range
Present Value of Stage I 111,233 44.9% 12.46Fair Value Estimate Present Value of Stage II 44,014 17.8% 4.93 Fair Value to Earnings 11.2 9.8 9.5
Present Value of the Perpetuity 92,580 37.4% 10.37 FV EV/EBITDA, ex rest 6.4 5.7 5.4Consider Buying 23.51 Total Firm Value 247,827 100.0% 27.76 Fair Value to FCFF 9.6 10.9 14.9Fair Value 33.59 FV to FCF (OCF - maint) 9.1 9.8 11.5Consider Selling 47.02 Cash and Equivalents 44,542 4.99
Short and Long-term Debt (5,939) (0.67) Fair Value to Earnings 15.9 14.0 13.6Moat Rating Wide Net Balance Sheet Impact 38,603 4.32 FV EV/EBITDA, ex rest 9.7 8.7 8.3Uncertainty Rating Medium Fair Value to FCFF 13.7 15.5 21.4
Other Adjustments 0 0.00 FV to FCF (OCF - maint) 13.0 14.0 16.5Estimated Mkt. Value of Preferred 0 0.00
Key Analytics Fair Value to Earnings 22.3 19.6 19.0Total Equity Value 286,430 FV EV/EBITDA, ex rest 14.2 12.6 12.1
Cost of Equity 10.0% Fair Value to FCFF 19.2 21.7 29.9Credit Spread for Debt 1.0% Projected Diluted Shares Outstanding 8,927 FV to FCF (OCF - maint) 18.2 19.6 23.1Long-run Average Effective Tax Rate 25.0% Stage 1 Exit Multiple, FV EV/EBITDA, ex rest 8.8Weighted Average Cost of Capital 9.9%Internal Rate of Return (IRR), 3-yr 19.8% Scenario Analysis Prob. FV
Insert Current Stock Price -----> 26.00 Bull Case 20% 25.00 COE FVBase Case 70% 32.00 11.5% 28.77
Forward Revenue CAGR, 5-yr 1.6% Bear Case 10% 38.00 11.0% 30.19 FV SensitivityForward EPS CAGR, 5-yr 3.3% 10.5% 31.78 7.9% 8.9% 9.9% 10.9% 11.9%Avg. Forward ROIC w/out goodwill, 5-yr. 59.1% 10.0% 33.59 6.0% 43.71 36.98 32.08 28.37 25.50
9.5% 35.64 5.0% 43.39 36.87 32.09 28.47 25.64Stage II Return on New Invested Capital 7.9% 9.0% 37.99 4.0% 43.07 36.75 32.10 28.55 25.77 Stage II IROIC, v3.1 7.9% 8.5% 40.71 3.0% 42.74 36.62 33.59 28.61 25.87Stage II EBI, FCFF Growth Rate 3.0% Interval 0.5% 2.0% 42.40 36.47 32.06 28.66 25.96 Implied Beginning Stage II EBI growth, v3.1 3.0% 1.0% 42.07 36.32 32.02 28.69 26.04Stage II Investment Rate, actual 15.8% 0.0% 41.73 36.16 31.97 28.71 26.11 Stage II Investment Rate, normalized 13.3% Fair Value Estimate (alternate valuation) WACC Interval 1.0% EBI growth Interval 1.0% Stage II Investment Rate, v3.1 15.8% Dividend Discount Model, 5yr. short form 8.88Perpetuity Year 16 Residual Income Model, 5 yr. short form 14.11
PEG Ratio (5-year expected) 4.27 Disclaimer:
Financial SummaryMillions Year 1 Year 2 Year 3 Year 4 Year 5 Year 6 Year 7 Year 8 Year 9 Year 10
Jun-06 Jun-07 Jun-08 Jun-09 Jun-10 Jun-11 Jun-12 Jun-13 Jun-14 Jun-15 Jun-16 Jun-17 Jun-18 Jun-19 Jun-20Revenue 44,282 51,122 60,420 58,437 62,484 69,982 71,948 71,298 65,750 67,723 62,962 59,525 66,695 60,753 60,753 %growth 11.3% 15.4% 18.2% (3.3%) 6.9% 12.0% 2.8% (0.9%) (7.8%) 3.0% (7.0%) (5.5%) 12.0% (8.9%) 0%EBIT 16,472 18,524 22,492 20,363 24,098 27,056 28,420 26,737 24,196 28,647 25,500 24,346 39,550 37,059 37,059 % margin 37.2% 36.2% 37.2% 34.8% 38.6% 38.7% 39.5% 37.5% 36.8% 42.3% 40.5% 40.9% 59.3% 61.0% 61.0%EBITDA 17,375 19,964 24,548 22,925 26,771 30,135 31,585 29,874 27,089 31,627 28,270 26,965 42,485 39,732 39,732 % margin 39.2% 39.1% 40.6% 39.2% 42.8% 43.1% 43.9% 41.9% 41.2% 46.7% 44.9% 45.3% 63.7% 65.4% 65.4%Net Income 12,599 14,065 17,681 14,569 18,760 20,869 21,896 20,634 18,728 22,096 19,736 18,870 30,281 28,413 28,428% growth 2.8% 11.6% 25.7% (17.6%) 28.8% 11.2% 4.9% (5.8%) (9.2%) 18.0% (10.7%) (4.4%) 60.5% (6.2%) 0.1%Dil. EPS, excluding charges 1.20 1.42 1.87 1.65 2.11 2.40 2.55 2.31 2.10 2.48 2.21 2.11 3.39 3.18 3.18% growth 6.5% 18.9% 31.2% (11.8%) 27.9% 13.9% 6.1% (9.2%) (9.2%) 18.0% (10.7%) (4.4%) 60.5% (6.2%) 0.1%
EBI 13,889 15,319 18,785 17,103 20,323 20,292 21,315 20,052 18,147 21,485 19,125 18,259 29,663 27,794 27,794 %growth 1.5% 10.3% 22.6% (9.0%) 18.8% (0.2%) 5.0% (5.9%) (9.5%) 18.4% (11.0%) (4.5%) 62.5% (6.3%) 0%FCFF 16,509 15,026 10,450 13,808 21,833 19,337 20,854 19,835 10,794 14,040 14,013 13,459 23,143 23,947 23,260 % of sales 37.3% 29.4% 17.3% 23.6% 34.9% 27.6% 29.0% 27.8% 16.4% 20.7% 22.3% 22.6% 34.7% 39.4% 38.3%
ROIC with Goodwill 61.2% 67.1% 67.9% 52.6% 55.4% 52.7% 50.3% 46.4% 37.7% 38.3% 32.4% 30.0% 42.1% 38.3% 37.9%ROA, pretax 23.5% 27.9% 33.1% 27.0% 29.4% 28.7% 25.5% 20.9% 17.4% 19.3% 16.1% 14.5% 21.4% 17.9% 16.2%ROE 28.6% 39.5% 52.5% 38.4% 43.8% 38.4% 30.8% 23.5% 18.2% 18.6% 14.6% 12.6% 17.8% 14.6% 13.0%
Debt to Capital 0.00 0.00 0.00 0.13 0.11 0.08 0.07 0.06 0.05 0.04 0.03 0.02 0.02 0.02 0.01Total Debt / EBITDA 0.00 0.00 0.00 0.25 0.22 0.19 0.18 0.19 0.21 0.18 0.13 0.14 0.09 0.12 0.07EBITDA / Interest Expense #DIV/0! #DIV/0! #DIV/0! 42.30 #DIV/0! 207.83 225.61 213.38 193.49 314.17 280.83 267.86 472.05 441.47 567.60
EBIT (Ex. Charges) 16,472 18,524 22,492 20,693 24,157 27,056 28,420 26,737 24,196 28,647 25,500 24,346 39,550 37,059 37,059 % margin 37.2% 36.2% 37.2% 35.4% 38.7% 38.7% 39.5% 37.5% 36.8% 42.3% 40.5% 40.9% 59.3% 61.0% 61.0% %growth 12.5% 21.4% (8.0%) 16.7% 12.0% 5.0% (5.9%) (9.5%) 18.4% (11.0%) (4.5%) 62.5% (6.3%) 0%EBITDA without restructuring 17,375 19,964 24,548 23,255 26,830 30,135 31,585 29,874 27,089 31,627 28,270 26,965 42,485 39,732 39,732 % margin 39.2% 39.1% 40.6% 39.8% 42.9% 43.1% 43.9% 41.9% 41.2% 46.7% 44.9% 45.3% 63.7% 65.4% 65.4% %growth 12.7% 14.9% 23.0% (5.3%) 15.4% 12.3% 4.8% (5.4%) (9.3%) 16.8% (10.6%) (4.6%) 57.6% (6.5%) 0%Net Income (True Forecast) 12,599 14,065 17,681 14,812 18,804 20,869 21,896 20,634 18,728 22,096 19,736 18,870 30,281 28,413 28,428 %growth 2.8% 11.6% 25.7% (16.2%) 27.0% 11.0% 4.9% (5.8%) (9.2%) 18.0% (10.7%) (4.4%) 60.5% (6.2%) 0.1%Dil. EPS (True Forecast) 1.20 1.42 1.87 1.65 2.11 2.40 2.55 2.31 2.10 2.48 2.21 2.11 3.39 3.18 3.18 %growth 6.5% 18.9% 31.2% (11.8%) 27.9% 13.9% 6.1% (9.2%) (9.2%) 18.0% (10.7%) (4.4%) 60.5% (6.2%) 0.1%
FCF (OCF - CapEx) 12,826 15,532 18,430 15,918 22,096 19,914 21,435 20,416 13,588 16,311 15,869 15,003 24,462 25,091 24,287 %growth 21.1% 18.7% (13.6%) 38.8% (9.9%) 7.6% (4.8%) (33.4%) 20.0% (2.7%) (5.5%) 63.0% 2.6% (3.2%)
Fair Value Yield % 0% 0% 0% 1.5% 1.5% 1.5% 1.5% 1.5% 1.5% 1.5% 1.5% 1.5% 1.5% 1.5% 1.5%FCFF to Fair Value Yield % 7.3% 6.4% 7.0% 6.6% 3.6% 4.7% 4.7% 4.5% 7.7% 8.0% 7.8%Fair Value/Free Cash Flow 27.58 21.38 17.26 18.98 13.57 15.06 13.99 14.69 22.06 18.38 18.89 19.98 12.26 11.95 12.34
Company Specific Summary Metrics
COE Sensitivity
Stage II EBI Growth and WACC Sensitivity Table
Consider Buy
Fair Value Estimate
Consider Sell
WACC Assumption
© 2008 Morningstar, Inc. All Rights Reserved. The base-line data and algorithms embedded in these spreadsheets: (1) are proprietary to Morningstar, Inc.; (2) may not be copied or redistributed; (3) do not constitute investment advice offered by Morningstaand (4) are not warranted to be accurate, complete or timely. Please note, however, that all of these data, including, but not limited to, those labeled as pro forma or set out in any shaded row/column, can be changed or manipulated by the user. Morningstar is not responsible for any damages or losses arising from any use of these spreadsheets or the data/information contained therein.
Historical
Avg.
Annu
al St
age I
I EB
I & F
CFF
Grow
th
© 2011 Morningstar, Inc. All Rights Reserved. Page 1/7 01/19/2011
SAMPLE
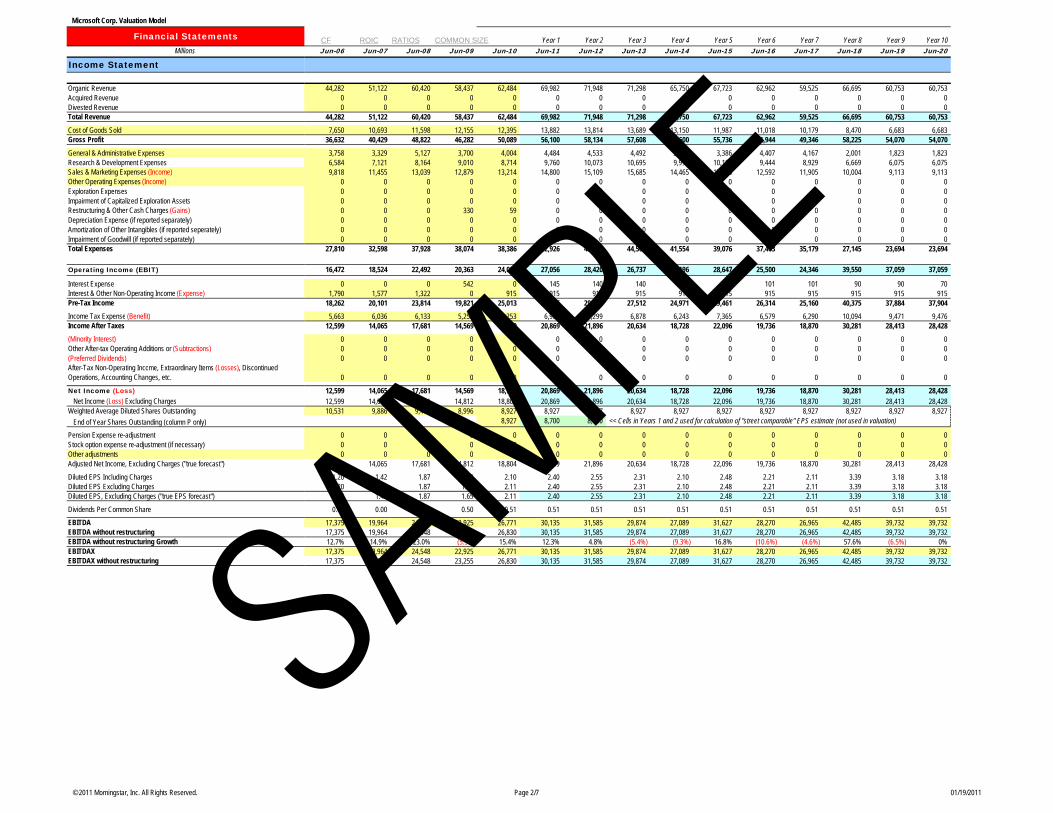
Microsoft Corp. Valuation Model
Financial StatementsMillions
Income Statement
Organic RevenueAcquired RevenueDivested RevenueTotal Revenue
Cost of Goods SoldGross Profit
General & Administrative ExpensesResearch & Development ExpensesSales & Marketing Expenses (Income)Other Operating Expenses (Income)Exploration ExpensesImpairment of Capitalized Exploration AssetsRestructuring & Other Cash Charges (Gains)Depreciation Expense (if reported separately)Amortization of Other Intangibles (if reported seperately)Impairment of Goodwill (if reported separately)Total Expenses
Operating Income (EBIT)
Interest ExpenseInterest & Other Non-Operating Income (Expense)Pre-Tax IncomeIncome Tax Expense (Benefit)Income After Taxes(Minority Interest)Other After-tax Operating Additions or (Subtractions)(Preferred Dividends)After-Tax Non-Operating Income, Extraordinary Items (Losses), Discontinued Operations, Accounting Changes, etc.
Net Income (Loss)Net Income (Loss) Excluding Charges
Weighted Average Diluted Shares OutstandingEnd of Year Shares Outstanding (column P only)
Pension Expense re-adjustmentStock option expense re-adjustment (if necessary)Other adjustmentsAdjusted Net Income, Excluding Charges ("true forecast")
Diluted EPS Including ChargesDiluted EPS Excluding ChargesDiluted EPS, Excluding Charges ("true EPS forecast")
Dividends Per Common Share
EBITDA EBITDA without restructuringEBITDA without restructuring GrowthEBITDAXEBITDAX without restructuring
CF ROIC RATIOS COMMON SIZE Year 1 Year 2 Year 3 Year 4 Year 5 Year 6 Year 7 Year 8 Year 9 Year 10Jun-06 Jun-07 Jun-08 Jun-09 Jun-10 Jun-11 Jun-12 Jun-13 Jun-14 Jun-15 Jun-16 Jun-17 Jun-18 Jun-19 Jun-20
44,282 51,122 60,420 58,437 62,484 69,982 71,948 71,298 65,750 67,723 62,962 59,525 66,695 60,753 60,7530 0 0 0 0 0 0 0 0 0 0 0 0 0 00 0 0 0 0 0 0 0 0 0 0 0 0 0 0
44,282 51,122 60,420 58,437 62,484 69,982 71,948 71,298 65,750 67,723 62,962 59,525 66,695 60,753 60,7537,650 10,693 11,598 12,155 12,395 13,882 13,814 13,689 13,150 11,987 11,018 10,179 8,470 6,683 6,683
36,632 40,429 48,822 46,282 50,089 56,100 58,134 57,608 52,600 55,736 51,944 49,346 58,225 54,070 54,0703,758 3,329 5,127 3,700 4,004 4,484 4,533 4,492 3,945 3,386 4,407 4,167 2,001 1,823 1,8236,584 7,121 8,164 9,010 8,714 9,760 10,073 10,695 9,994 10,158 9,444 8,929 6,669 6,075 6,0759,818 11,455 13,039 12,879 13,214 14,800 15,109 15,685 14,465 13,545 12,592 11,905 10,004 9,113 9,113
0 0 0 0 0 0 0 0 0 0 0 0 0 0 00 0 0 0 0 0 0 0 0 0 0 0 0 0 00 0 0 0 0 0 0 0 0 0 0 0 0 0 00 0 0 330 59 0 0 0 0 0 0 0 0 0 00 0 0 0 0 0 0 0 0 0 0 0 0 0 00 0 0 0 0 0 0 0 0 0 0 0 0 0 00 0 0 0 0 0 0 0 0 0 0 0 0 0 0
27,810 32,598 37,928 38,074 38,386 42,926 43,529 44,561 41,554 39,076 37,463 35,179 27,145 23,694 23,694
16,472 18,524 22,492 20,363 24,098 27,056 28,420 26,737 24,196 28,647 25,500 24,346 39,550 37,059 37,059
0 0 0 542 0 145 140 140 140 101 101 101 90 90 701,790 1,577 1,322 0 915 915 915 915 915 915 915 915 915 915 915
18,262 20,101 23,814 19,821 25,013 27,826 29,195 27,512 24,971 29,461 26,314 25,160 40,375 37,884 37,9045,663 6,036 6,133 5,252 6,253 6,956 7,299 6,878 6,243 7,365 6,579 6,290 10,094 9,471 9,476
12,599 14,065 17,681 14,569 18,760 20,869 21,896 20,634 18,728 22,096 19,736 18,870 30,281 28,413 28,4280 0 0 0 0 0 0 0 0 0 0 0 0 0 00 0 0 0 0 0 0 0 0 0 0 0 0 0 00 0 0 0 0 0 0 0 0 0 0 0 0 0 0
0 0 0 0 0 0 0 0 0 0 0 0 0 0 0
12,599 14,065 17,681 14,569 18,760 20,869 21,896 20,634 18,728 22,096 19,736 18,870 30,281 28,413 28,42812,599 14,065 17,681 14,812 18,804 20,869 21,896 20,634 18,728 22,096 19,736 18,870 30,281 28,413 28,42810,531 9,886 9,470 8,996 8,927 8,927 8,927 8,927 8,927 8,927 8,927 8,927 8,927 8,927 8,927
8,927 8,700 8,600 << Cells in Years 1 and 2 used for calculation of "street comparable" EPS estimate (not used in valuation)
0 0 0 0 0 0 0 0 0 0 0 0 0 0 00 0 0 0 0 0 0 0 0 0 0 0 0 0 00 0 0 0 0 0 0 0 0 0 0 0 0 0 0
12,599 14,065 17,681 14,812 18,804 20,869 21,896 20,634 18,728 22,096 19,736 18,870 30,281 28,413 28,428
1.20 1.42 1.87 1.62 2.10 2.40 2.55 2.31 2.10 2.48 2.21 2.11 3.39 3.18 3.181.20 1.42 1.87 1.65 2.11 2.40 2.55 2.31 2.10 2.48 2.21 2.11 3.39 3.18 3.181.20 1.42 1.87 1.65 2.11 2.40 2.55 2.31 2.10 2.48 2.21 2.11 3.39 3.18 3.18
0.00 0.00 0.00 0.50 0.51 0.51 0.51 0.51 0.51 0.51 0.51 0.51 0.51 0.51 0.51
17,375 19,964 24,548 22,925 26,771 30,135 31,585 29,874 27,089 31,627 28,270 26,965 42,485 39,732 39,73217,375 19,964 24,548 23,255 26,830 30,135 31,585 29,874 27,089 31,627 28,270 26,965 42,485 39,732 39,73212.7% 14.9% 23.0% (5.3%) 15.4% 12.3% 4.8% (5.4%) (9.3%) 16.8% (10.6%) (4.6%) 57.6% (6.5%) 0%17,375 19,964 24,548 22,925 26,771 30,135 31,585 29,874 27,089 31,627 28,270 26,965 42,485 39,732 39,73217,375 19,964 24,548 23,255 26,830 30,135 31,585 29,874 27,089 31,627 28,270 26,965 42,485 39,732 39,732
© 2011 Morningstar, Inc. All Rights Reserved. Page 2/7 01/19/2011
SAMPLE

Microsoft Corp. Valuation Model
Financial StatementsMillions
Balance Sheet
ASSETSTotal Cash & Equivalents
Non-operating, Excess Cash & InvestmentsOperating Cash & Equivalents
Accounts ReceivableInventoryOther Short-Term Operating AssetsTotal Current Assets
Property Plant & Equipment, Gross(Accumulated Depreciation)
Property Plant & Equipment, NetGoodwill, NetOther IntangiblesOther Long-Term Operating AssetsDeferred Tax AssetsLong-Term Non-Operating Assets, including Pension BS itemsTotal Assets
LIABILITIESAccounts PayableShort-Term DebtOther Short-Term Operating LiabilitiesTotal Current Liabilities
Long-Term DebtIncremental Debt RequirementsTotal Long-Term Debt
Long-Term Operating LiabilitiesDeferred Tax LiabilitiesLong-Term Non-Operating Liabilities, including Pension BS itemsTotal Liabilities
Preferred StockMinority Interest
STOCKHOLDER'S EQUITYCommon StockAdditional Paid in CapitalRetained Earnings (Deficit)(Treasury Stock)Other Equity, e.g. Accum. Comprehensive Income (Loss)Total Shareholders' Equity
Total Liabilities + Shareholders' EquityDifference
CF ROIC RATIOS COMMON SIZE Year 1 Year 2 Year 3 Year 4 Year 5 Year 6 Year 7 Year 8 Year 9 Year 10Jun-06 Jun-07 Jun-08 Jun-09 Jun-10 Jun-11 Jun-12 Jun-13 Jun-14 Jun-15 Jun-16 Jun-17 Jun-18 Jun-19 Jun-20
43,393 33,528 30,250 36,380 44,542 59,685 76,542 92,380 99,177 109,250 117,296 126,787 145,971 166,958 184,27440,393 30,528 27,250 33,380 41,542 56,685 73,542 89,380 96,177 106,250 114,296 123,787 142,971 163,958 181,2743,000 3,000 3,000 3,000 3,000 3,000 3,000 3,000 3,000 3,000 3,000 3,000 3,000 3,000 3,0009,316 11,338 13,589 11,192 13,014 14,576 14,985 14,850 13,694 14,105 13,114 12,398 13,891 12,653 12,6531,478 1,127 985 717 740 829 825 817 785 716 658 608 506 399 3994,055 4,292 5,006 5,924 5,134 5,134 5,134 5,134 5,134 5,134 5,134 5,134 5,134 5,134 5,134
58,242 50,285 49,830 54,213 63,430 80,224 97,486 113,181 118,791 129,205 136,201 144,927 165,501 185,144 202,460
7,223 9,487 12,544 15,082 16,259 19,155 22,324 25,780 29,537 33,610 38,016 42,770 47,891 53,396 59,305(4,179) (5,137) (6,302) (7,547) (8,629) (11,708) (14,874) (18,011) (20,904) (23,884) (26,654) (29,273) (32,208) (34,881) (37,554)3,044 4,350 6,242 7,535 7,630 7,447 7,450 7,769 8,633 9,727 11,362 13,497 15,683 18,515 21,7514,405 5,638 12,108 12,503 12,394 12,394 12,394 12,394 12,394 12,394 12,394 12,394 12,394 12,394 12,394
0 0 1,973 1,759 1,158 1,158 1,158 1,158 1,158 1,158 1,158 1,158 1,158 1,158 1,1583,906 2,898 1,691 1,599 1,501 1,501 1,501 1,501 1,501 1,501 1,501 1,501 1,501 1,501 1,501
0 0 949 279 0 0 0 0 0 0 0 0 0 0 00 0 0 0 0 0 0 0 0 0 0 0 0 0 0
69,597 63,171 72,793 77,888 86,113 102,723 119,989 136,003 142,476 153,984 162,616 173,477 196,237 218,712 239,263
2,909 3,247 4,034 3,324 4,025 4,537 4,484 4,443 4,260 3,870 3,559 3,289 2,717 2,135 2,1700 0 0 2,000 1,000 2,000 2,000 2,000 2,000 4,000 2,000 2,000 2,000 3,000 2,000
19,533 20,507 25,852 21,710 21,122 21,122 21,122 21,122 15,842 11,881 8,911 6,683 5,012 3,759 2,81922,442 23,754 29,886 27,034 26,147 27,659 27,606 27,565 22,101 19,751 14,470 11,972 9,730 8,895 6,990
0 0 0 3,746 4,939 3,746 3,746 3,746 3,746 1,746 1,746 1,746 1,746 1,746 7460 0 0 0 0 0 0 0 0 0
0 0 0 3,746 4,939 3,746 3,746 3,746 3,746 1,746 1,746 1,746 1,746 1,746 746
7,051 8,320 6,621 7,550 8,852 8,852 8,852 8,852 6,639 4,979 3,734 2,801 2,101 1,575 1,1820 0 0 0 0 0 0 0 0 0 0 0 0 0 00 0 0 0 0 0 0 0 0 0 0 0 0 0 0
29,493 32,074 36,507 38,330 39,938 40,257 40,204 40,163 32,486 26,476 19,950 16,519 13,576 12,216 8,917
0 0 0 0 0 0 0 0 0 0 0 0 0 0 00 0 0 0 0 0 0 0 0 0 0 0 0 0 0
59,005 60,557 62,849 62,382 62,856 62,856 62,856 62,856 62,856 62,856 62,856 62,856 62,856 62,856 62,8560 0 0 0 0 0 0 0 0 0 0 0 0 0 0
(18,901) (29,460) (26,563) (22,824) (16,681) (390) 16,928 32,984 47,134 64,652 79,810 94,102 119,805 143,640 167,4900 0 0 0 0 0 0 0 0 0 0 0 0 0 00 0 0 0 0 0 0 0 0 0 0 0 0 0 0
40,104 31,097 36,286 39,558 46,175 62,466 79,784 95,840 109,990 127,508 142,666 156,958 182,661 206,496 230,346
69,597 63,171 72,793 77,888 86,113 102,723 119,989 136,003 142,476 153,984 162,616 173,477 196,237 218,712 239,2630 0 0 0 0 0 0 0 0 0 0 0 0 0 0
© 2011 Morningstar, Inc. All Rights Reserved. Page 3/7 01/19/2011
SAMPLE

Microsoft Corp. Valuation Model
Financial StatementsMillions
Cash Flow Statement
Net Income from Continuing OpsDepreciation ExpenseAmortization of Other IntangiblesImpairment of GoodwillOther Non-Cash Adjustments to Operating IncomeDeferred Income Taxes & Other Adjustments to Net IncomeChanges in Operating Assets and Liabilities
(Increase) Decrease in Accounts Receivable(Increase) Decrease in Inventory(Increase) Other Short-Term Operating AssetsIncrease (Decrease) in Accounts PayableIncrease (Decrease) in Other Current Liabilities
Cash from Operations
(Capital Expenditures)(Maintenance Capital Expenditures)(Growth Capital Expenditures)
(Acquisitions)Asset Sales & Disposals of Discontinued OperationsOther Investing Cash Flows (Outlays)Cash from Investing
Common Stock (Purchase) or SaleCommon Stock (Dividends)Preferred Stock Issue / (Purchase) / (Dividends) Short Term Debt Issuance and (Retirement)Long Term Debt Issuance and (Retirement)Minority Interest Addback of Income (Loss) DistributionOther Financing Cash Flows (Outlays)Cash from Financing
Benefit (Loss) from Exchange Rates / Discontinued Ops., etc.
Net Change in CashChange in Cash on Balance Sheet
Difference
Cash Taxes PaidCash Interest Paid
CF ROIC RATIOS COMMON SIZE Year 1 Year 2 Year 3 Year 4 Year 5 Year 6 Year 7 Year 8 Year 9 Year 10Jun-06 Jun-07 Jun-08 Jun-09 Jun-10 Jun-11 Jun-12 Jun-13 Jun-14 Jun-15 Jun-16 Jun-17 Jun-18 Jun-19 Jun-20
12,599 14,065 17,681 14,569 18,760 20,869 21,896 20,634 18,728 22,096 19,736 18,870 30,281 28,413 28,428903 1,440 2,056 2,562 2,673 3,079 3,166 3,137 2,893 2,980 2,770 2,619 2,935 2,673 2,673
0 0 0 0 0 0 0 0 0 0 0 0 0 0 00 0 0 0 0 0 0 0 0 0 0 0 0 0 0
3,080 2,831 3,375 1,322 2,199 0 0 0 0 0 0 0 0 0 0219 421 935 762 (220) 0 0 0 0 0 0 0 0 0 0
(2,071) (1,764) (1,569) 2,215 (2,238) (1,562) (410) 136 1,155 (411) 992 716 (1,493) 1,238 0(1,405) 0 0 0 0 (89) 4 7 32 69 58 50 102 107 0
(49) (203) 55 (695) 197 0 0 0 0 0 0 0 0 0 0(145) (552) (748) (3,371) 1,295 512 (52) (42) (183) (390) (311) (270) (572) (582) 35
1,273 1,558 (173) 1,673 1,407 0 0 0 (5,281) (3,960) (2,970) (2,228) (1,671) (1,253) (940)14,404 17,796 21,612 19,037 24,073 22,810 24,604 23,872 17,345 20,384 20,274 19,757 29,582 30,596 30,196
(1,578) (2,264) (3,182) (3,119) (1,977) (2,896) (3,169) (3,456) (3,757) (4,073) (4,406) (4,754) (5,121) (5,505) (5,909)0 0 0 (2,119) (977) (1,343) (1,539) (1,744) (1,960) (2,186) (2,424) (2,674) (2,936) (3,211) (3,500)
(1,578) (2,264) (3,182) (1,000) (1,000) (1,553) (1,630) (1,712) (1,797) (1,887) (1,981) (2,080) (2,185) (2,294) (2,408)(649) (1,150) (8,053) (868) (245) 0 0 0 0 0 0 0 0 0 0
0 0 0 0 0 0 0 0 0 0 0 0 0 0 010,230 9,503 6,648 (11,783) (9,092) 0 0 0 (2,213) (1,660) (1,245) (934) (700) (525) (394)8,003 6,089 (4,587) (15,770) (11,314) (2,896) (3,169) (3,456) (5,970) (5,733) (5,650) (5,688) (5,821) (6,030) (6,303)
(17,106) (20,793) (9,039) (8,774) (8,958) 0 0 0 0 0 0 0 0 0 00 0 0 (4,468) (4,578) (4,578) (4,578) (4,578) (4,578) (4,578) (4,578) (4,578) (4,578) (4,578) (4,578)0 0 0 0 0 0 0 0 0 0 0 0 0 0 00 0 0 1,178 (991) 1,000 0 0 0 2,000 (2,000) 0 0 1,000 (1,000)0 0 0 4,568 1,181 (1,193) 0 0 0 (2,000) 0 0 0 0 (1,000)0 0 0 0 0 0 0 0 0 0 0 0 0 0 0
(3,456) (3,751) (3,895) 33 55 0 0 0 0 0 0 0 0 0 0(20,562) (24,544) (12,934) (7,463) (13,291) (4,771) (4,578) (4,578) (4,578) (4,578) (6,578) (4,578) (4,578) (3,578) (6,578)
0 0 137 (67) (39) 0 0 0 0 0 0 0 0 0 0
1,845 (659) 4,228 (4,263) (571) 15,143 16,857 15,838 6,797 10,073 8,046 9,491 19,183 20,987 17,316(5,362) (9,865) (3,278) 6,130 8,162 15,143 16,857 15,838 6,797 10,073 8,046 9,491 19,183 20,987 17,3167,207 9,206 7,506 (10,393) (8,733) 0 0 0 0 0 0 0 0 0 0
5,663 6,036 7,082 4,582 5,974 6,764 7,105 6,684 6,049 7,162 6,375 6,086 9,888 9,265 9,2650 0 0 542 0 145 140 140 140 101 101 101 90 90 70
© 2011 Morningstar, Inc. All Rights Reserved. Page 4/7 01/19/2011
SAMPLE

Microsoft Corp. Valuation Model
Financial StatementsMillions
Return on Invested Capital
Operating Cash & Equivalents included in Working CapitalAccounts ReceivableInventoryPrepayments & Advances
Property Plant & Equipment, NetGoodwill, NetOther IntangiblesOther Long-Term Operating Assets
Capitalized Lease Obligations, netCapitalized Research and Development Expenses, netOther Expenses to be Capitalized, netOther Expenses to be Capitalized, netOther Expenses to be Capitalized, netLESS:
Accounts PayableOther Short-Term Operating LiabilitiesLong Term Operating Liabilities
Invested CapitalInvested Capital excluding GoodwillEarnings Before Interest, after taxes (before adjustments)Rent Expense (operating leases)
Incremental DepreciationResearch and Development Expenses
Incremental AmortizationOther Expenses to be Capitalized
Incremental AmortizationOther Expenses to be Capitalized
Incremental AmortizationOther Expenses to be Capitalized
Incremental Amortization
Return on Average Invested Capital (ROIC):ROIC with GoodwillROIC without Goodwill
ROIC w/ Goodwill (3-yr avg.)ROIC w/o Goodwill (3-yr avg.)
ROIC w/ Goodwill (5-yr avg.)ROIC w/o Goodwill (5-yr avg.)
WACC
CF ROIC RATIOS COMMON SIZE Year 1 Year 2 Year 3 Year 4 Year 5 Year 6 Year 7 Year 8 Year 9 Year 10Jun-06 Jun-07 Jun-08 Jun-09 Jun-10 Jun-11 Jun-12 Jun-13 Jun-14 Jun-15 Jun-16 Jun-17 Jun-18 Jun-19 Jun-20
3,000 3,000 3,000 3,000 3,000 3,000 3,000 3,000 3,000 3,000 3,000 3,000 3,000 3,000 3,0009,316 11,338 13,589 11,192 13,014 14,576 14,985 14,850 13,694 14,105 13,114 12,398 13,891 12,653 12,6531,478 1,127 985 717 740 829 825 817 785 716 658 608 506 399 3994,055 4,292 5,006 5,924 5,134 5,134 5,134 5,134 5,134 5,134 5,134 5,134 5,134 5,134 5,134
3,044 4,350 6,242 7,535 7,630 7,447 7,450 7,769 8,633 9,727 11,362 13,497 15,683 18,515 21,7514,405 5,638 12,108 12,503 12,394 12,394 12,394 12,394 12,394 12,394 12,394 12,394 12,394 12,394 12,394
0 0 1,973 1,759 1,158 1,158 1,158 1,158 1,158 1,158 1,158 1,158 1,158 1,158 1,1583,906 2,898 1,691 1,599 1,501 1,501 1,501 1,501 1,501 1,501 1,501 1,501 1,501 1,501 1,501
0 0 0 0 0 3,680 2,488 2,488 2,488 1,392 1,392 1,392 1,272 1,272 1,27225,625 26,816 28,573 30,634 32,012 34,134 36,285 38,490 39,408 40,079 39,752 38,846 35,651 32,303 29,526
0 0 0 0 0 0 0 0 0 0 0 0 0 0 00 0 0 0 0 0 0 0 0 0 0 0 0 0 00 0 0 0 0 0 0 0 0 0 0 0 0 0 0
2,909 3,247 4,034 3,324 4,025 4,537 4,484 4,443 4,260 3,870 3,559 3,289 2,717 2,135 2,17019,533 20,507 25,852 21,710 21,122 21,122 21,122 21,122 15,842 11,881 8,911 6,683 5,012 3,759 2,8197,051 8,320 6,621 7,550 8,852 8,852 8,852 8,852 6,639 4,979 3,734 2,801 2,101 1,575 1,182
25,336 27,385 36,660 42,279 42,584 49,341 50,761 53,184 61,455 68,475 67,581 71,605 75,267 76,245 78,39920,931 21,747 24,552 29,776 30,190 36,947 38,367 40,790 49,061 56,081 55,187 59,211 62,873 63,851 66,005
13,889 15,319 18,785 17,103 20,323 20,292 21,315 20,052 18,147 21,485 19,125 18,259 29,663 27,794 27,7940 0 0 0 0 460 311 311 311 174 174 174 159 159 1590 0 0 0 0 (123) (83) (83) (83) (46) (46) (46) (42) (42) (42)
6,584 7,121 8,164 9,010 8,714 9,760 10,073 10,695 9,994 10,158 9,444 8,929 6,669 6,075 6,075(3,661) (3,831) (4,082) (4,376) (4,573) (4,876) (5,184) (5,499) (5,630) (5,726) (5,679) (5,549) (5,093) (4,615) (4,218)
0 0 0 0 0 0 0 0 0 0 0 0 0 0 00 0 0 0 0 0 0 0 0 0 0 0 0 0 00 0 0 0 0 0 0 0 0 0 0 0 0 0 00 0 0 0 0 0 0 0 0 0 0 0 0 0 00 0 0 0 0 0 0 0 0 0 0 0 0 0 00 0 0 0 0 0 0 0 0 0 0 0 0 0 0
61.2% 67.1% 67.9% 52.6% 55.4% 52.7% 50.3% 46.4% 37.7% 38.3% 32.4% 30.0% 42.1% 38.3% 37.9%72.7% 82.8% 94.0% 76.4% 78.5% 72.1% 66.8% 60.9% 48.1% 47.4% 39.6% 36.5% 50.7% 45.7% 45.1%
55.6% 61.7% 65.4% 62.5% 58.6% 53.6% 52.8% 49.8% 44.8% 40.8% 36.1% 33.6% 34.8% 36.8% 39.4%65.0% 73.8% 83.2% 84.4% 82.9% 75.7% 72.5% 66.6% 58.6% 52.1% 45.0% 41.2% 42.3% 44.3% 47.2%
69.4% 61.3% 60.4% 61.1% 60.8% 59.1% 55.8% 51.5% 48.5% 45.1% 41.0% 37.0% 36.1% 36.2% 36.1%79.3% 72.0% 74.4% 78.3% 80.9% 80.8% 77.5% 70.9% 65.3% 59.1% 52.6% 46.5% 44.5% 44.0% 43.5%9.9% 9.9% 9.9% 9.9% 9.9% 9.9% 9.9% 9.9% 9.9% 9.9% 9.9% 9.9% 9.9% 9.9% 9.9%
© 2011 Morningstar, Inc. All Rights Reserved. Page 5/7 01/19/2011
SAMPLE

Microsoft Corp. Valuation Model
Financial StatementsMillions
Ratios
EfficiencyInventory Turnover, avg. balances
Average Days in InventoryReceivables Turnover, avg. balances
Average Days in ReceivablesPayable Turnover, avg. balances
Average Days Payables Outstanding
Operating Cycle, in daysCash Operating Cycle, in days
Working Capital TurnoverFixed Asset TurnoverTotal Asset Turnover
Other Efficiency RatioOther Efficiency Ratio
LiquidityCurrent RatioQuick RatioCash Ratio
Free Cash Flow (OCF - CapEx) as % of RevenueFree Cash Flow (OCF - CapEx) as % of Operating Income
Other Liquidity RatioOther Liquidity Ratio
LeverageDebt to CapitalDebt to Capital, including operating leasesDebt to Equity at Book Value
Net Debt (including excess cash) to CapitalNet Debt (operating cash only) to Capital
Total Debt / EBITDATotal Debt / EBITDA without restructuringTotal Assets/Total Equity
Other Leverage RatioOther Leverage Ratio
CoverageEBIT / Interest ExpenseEBITDA / Interest ExpenseEBITDA without restructuring / Interest ExpenseEBITDAR without restructuring / Interest Expense + Rent Expense
Free Cash Flow (OCF - CapEx) / DebtFree Cash Flow (OCF - CapEx) / Cash Interest
CF ROIC RATIOS COMMON SIZE Year 1 Year 2 Year 3 Year 4 Year 5 Year 6 Year 7 Year 8 Year 9 Year 10Jun-06 Jun-07 Jun-08 Jun-09 Jun-10 Jun-11 Jun-12 Jun-13 Jun-14 Jun-15 Jun-16 Jun-17 Jun-18 Jun-19 Jun-20
7.8 8.2 11.0 14.3 17.0 17.7 16.7 16.7 16.4 16.0 16.0 16.1 15.2 14.8 16.847 44 33 26 21 21 22 22 22 23 23 23 24 25 22
5.4 5.0 4.8 4.7 5.2 5.1 4.9 4.8 4.6 4.9 4.6 4.7 5.1 4.6 4.868 74 75 77 71 72 75 76 79 75 79 78 72 80 76
3.1 3.5 3.2 3.3 3.4 3.2 3.1 3.1 3.0 2.9 3.0 3.0 2.8 2.8 3.1119 105 115 110 108 113 119 119 121 124 123 123 129 133 118
115 118 109 103 92 93 97 98 101 98 102 101 96 104 98(4) 13 (6) (8) (16) (20) (22) (21) (19) (26) (21) (22) (33) (28) (20)
(11.8) (11.9) (10.7) (10.2) (16.8) (26.0) (38.0) (41.6) 175.8 13.9 7.6 5.8 5.1 4.0 3.916.4 13.8 11.4 8.5 8.2 9.3 9.7 9.4 8.0 7.4 6.0 4.8 4.6 3.6 3.00.6 0.8 0.9 0.8 0.8 0.7 0.6 0.6 0.5 0.5 0.4 0.4 0.4 0.3 0.3
2.6 2.1 1.7 2.0 2.4 2.9 3.5 4.1 5.4 6.5 9.4 12.1 17.0 20.8 29.02.3 1.9 1.5 1.8 2.2 2.7 3.3 3.9 5.1 6.2 9.0 11.6 16.4 20.2 28.21.9 1.4 1.0 1.3 1.7 2.2 2.8 3.4 4.5 5.5 8.1 10.6 15.0 18.8 26.4
29.0% 30.4% 30.5% 27.2% 35.4% 28.5% 29.8% 28.6% 20.7% 24.1% 25.2% 25.2% 36.7% 41.3% 40.0%77.9% 83.8% 81.9% 78.2% 91.7% 73.6% 75.4% 76.4% 56.2% 56.9% 62.2% 61.6% 61.8% 67.7% 65.5%
0.00 0.00 0.00 0.13 0.11 0.08 0.07 0.06 0.05 0.04 0.03 0.02 0.02 0.02 0.010.00 0.00 0.00 0.13 0.11 0.13 0.09 0.08 0.07 0.05 0.03 0.03 0.03 0.03 0.020.00 0.00 0.00 0.15 0.13 0.09 0.07 0.06 0.05 0.05 0.03 0.02 0.02 0.02 0.01
(1.08) (1.08) (0.83) (0.68) (0.74) (0.79) (0.83) (0.85) (0.81) (0.78) (0.78) (0.77) (0.76) (0.77) (0.78)(0.07) (0.10) (0.08) 0.06 0.06 0.04 0.03 0.03 0.02 0.02 0.01 0.00 0.00 0.01 (0.00)
0.00 0.00 0.00 0.25 0.22 0.19 0.18 0.19 0.21 0.18 0.13 0.14 0.09 0.12 0.070.00 0.00 0.00 0.25 0.22 0.19 0.18 0.19 0.21 0.18 0.13 0.14 0.09 0.12 0.071.74 2.03 2.01 1.97 1.86 1.64 1.50 1.42 1.30 1.21 1.14 1.11 1.07 1.06 1.04
#DIV/0! #DIV/0! #DIV/0! 37.6 #DIV/0! 186.6 203.0 191.0 172.8 284.6 253.3 241.8 439.4 411.8 529.4#DIV/0! #DIV/0! #DIV/0! 42.3 #DIV/0! 207.8 225.6 213.4 193.5 314.2 280.8 267.9 472.1 441.5 567.6#DIV/0! #DIV/0! #DIV/0! 42.9 #DIV/0! 207.8 225.6 213.4 193.5 314.2 280.8 267.9 472.1 441.5 567.6#DIV/0! #DIV/0! #DIV/0! 42.9 #DIV/0! 50.6 70.7 66.9 60.8 115.8 103.6 98.8 171.3 160.2 174.2
#DIV/0! #DIV/0! #DIV/0! 2.8 3.7 3.5 3.7 3.6 2.4 2.8 4.2 4.0 6.5 5.3 8.8#DIV/0! #DIV/0! #DIV/0! 29.4 #DIV/0! 137.3 153.1 145.8 97.1 162.0 157.6 149.0 271.8 278.8 347.0
© 2011 Morningstar, Inc. All Rights Reserved. Page 6/7 01/19/2011
SAMPLE

Microsoft Corp. Valuation Model
Financial StatementsMillions
Profitability, Returns & DuPont AnalysisEBIT GrowthRevenue GrowthEBIT Change % / Revenue Change %Net Income Growth, ex charges
Earnings / Revenue (Net Margin)Revenue / Average AssetsAverage Assets / Average Equity at Book ValueROEEBIT, ex charges / Revenue (Operating Margin)EBIT / Revenue (Operating Margin)Incremental/(Decremental) Operating Margin
3-year Normalized Incremental/(Decremental) Operating Margin5-year Normalized Incremental/(Decremental) Operating Margin
ROA
EBITDA Margin, without restructuringEBITDAR Margin, without restructuringEBITDAX Margin, without restructuringNet Margin, ex chargesFCFF Margin
ROIC (calculated with average balances) with GoodwillROIC without GoodwillNormalized ROIC with Goodwill, 3 yr.Normalized ROIC without Goodwill, 3yr.
Dividend Payout RatioDividend per Share Growth
Other RatiosOther Ratios
Per-Share AmountsRevenue per ShareEBITDA per ShareOperating Income (EBIT) per ShareEBI per ShareOperating Cash Flow per ShareFree Cash Flow (OCF - CapEx) per ShareFCFF per Share
Cash per Share (including excess cash)Cash per Share (operating cash only)Net Cash per Share
Other RatiosOther Ratios
AltmanWorking Capital/Total AssetsRetained Earnings/Total AssetsEBIT/Total AssetsMarket Value Equity/Total LiabilitiesBook Value of Equity/Total LiabilitiesSales/Total Assets
ValuationFV/EarningsFV EV/EBITDAFV/FCFFFV/BookFV/Sales
Other MetricsEBI Growth RateEBITDA Growth RateFree Cash Flow (FCFF) Growth RateFree Cash Flow (CFO-capex) Growth RateReturn on New Invested Capital (RONIC)Investment Rate, includes acquisitions3-Year Average Investment Rate, includes acquisitions5-Year Average Investment Rate, includes acquisitions
CF ROIC RATIOS COMMON SIZE Year 1 Year 2 Year 3 Year 4 Year 5 Year 6 Year 7 Year 8 Year 9 Year 10Jun-06 Jun-07 Jun-08 Jun-09 Jun-10 Jun-11 Jun-12 Jun-13 Jun-14 Jun-15 Jun-16 Jun-17 Jun-18 Jun-19 Jun-20
13.1% 12.5% 21.4% (9.5%) 18.3% 12.3% 5.0% (5.9%) (9.5%) 18.4% (11.0%) (4.5%) 62.5% (6.3%) 0%11.3% 15.4% 18.2% (3.3%) 6.9% 12.0% 2.8% (0.9%) (7.8%) 3.0% (7.0%) (5.5%) 12.0% (8.9%) 0%116.2% 80.6% 117.8% 288.4% 264.9% 102.3% 179.4% 654.7% 122.1% 612.9% 156.3% 82.9% 518.5% 70.7% #DIV/0!
2.8% 11.6% 25.7% -16.2% 27.0% 11.0% 4.9% -5.8% -9.2% 18.0% -10.7% -4.4% 60.5% -6.2% 0.1%
28.5% 27.5% 29.3% 24.9% 30.0% 29.8% 30.4% 28.9% 28.5% 32.6% 31.3% 31.7% 45.4% 46.8% 46.8%0.63 0.77 0.89 0.78 0.76 0.74 0.65 0.56 0.47 0.46 0.40 0.35 0.36 0.29 0.271.59 1.86 2.02 1.99 1.91 1.74 1.57 1.46 1.35 1.25 1.17 1.12 1.09 1.07 1.05
28.6% 39.5% 52.5% 38.4% 43.8% 38.4% 30.8% 23.5% 18.2% 18.6% 14.6% 12.6% 17.8% 14.6% 13.0%37.2% 36.2% 37.2% 35.4% 38.7% 38.7% 39.5% 37.5% 36.8% 42.3% 40.5% 40.9% 59.3% 61.0% 61.0%37.2% 36.2% 37.2% 34.8% 38.6% 38.7% 39.5% 37.5% 36.8% 42.3% 40.5% 40.9% 59.3% 61.0% 61.0%42.5% 30.0% 42.7% 107.4% 92.3% 39.4% 69.4% 258.6% 45.8% 225.6% 66.1% 33.6% 212.1% 41.9% #DIV/0!72.9% 86.6% 38.4% 60.0% 80.8% 79.7% 67.0% 122.5% 124.6% 176.7% 112.5% 108.4% 103.9% 95.8% #DIV/0!27.9% 56.4% 58.3% 81.9% 63.0% 62.4% 70.2% 113.4% 101.1% 127.8% 133.1% 125.9% 116.6% 115.8% #DIV/0!17.9% 21.2% 26.0% 19.3% 22.9% 22.1% 19.7% 16.1% 13.5% 14.9% 12.5% 11.2% 16.4% 13.7% 12.4%
39.2% 39.1% 40.6% 39.8% 42.9% 43.1% 43.9% 41.9% 41.2% 46.7% 44.9% 45.3% 63.7% 65.4% 65.4%39.2% 39.1% 40.6% 39.8% 42.9% 43.7% 44.3% 42.3% 41.7% 47.0% 45.2% 45.6% 63.9% 65.7% 65.7%39.2% 39.1% 40.6% 39.8% 42.9% 43.1% 43.9% 41.9% 41.2% 46.7% 44.9% 45.3% 63.7% 65.4% 65.4%28.5% 27.5% 29.3% 25.3% 30.1% 29.8% 30.4% 28.9% 28.5% 32.6% 31.3% 31.7% 45.4% 46.8% 46.8%37.3% 29.4% 17.3% 23.6% 34.9% 27.6% 29.0% 27.8% 16.4% 20.7% 22.3% 22.6% 34.7% 39.4% 38.3%
61.2% 67.1% 67.9% 52.6% 55.4% 52.7% 50.3% 46.4% 37.7% 38.3% 32.4% 30.0% 42.1% 38.3% 37.9%72.7% 82.8% 94.0% 76.4% 78.5% 72.1% 66.8% 60.9% 48.1% 47.4% 39.6% 36.5% 50.7% 45.7% 45.1%55.6% 61.7% 65.4% 62.5% 58.6% 53.6% 52.8% 49.8% 44.8% 40.8% 36.1% 33.6% 34.8% 36.8% 39.4%65.0% 73.8% 83.2% 84.4% 82.9% 75.7% 72.5% 66.6% 58.6% 52.1% 45.0% 41.2% 42.3% 44.3% 47.2%
0% 0% 0% 30.7% 24.4% 21.9% 20.9% 22.2% 24.4% 20.7% 23.2% 24.3% 15.1% 16.1% 16.1%#DIV/0! #DIV/0! #DIV/0! #DIV/0! 3.3% 0% 0% 0% 0% 0% 0% 0% 0% 0% 0%
4.20 5.17 6.38 6.50 7.00 7.84 8.06 7.99 7.37 7.59 7.05 6.67 7.47 6.81 6.811.65 2.02 2.59 2.55 3.00 3.38 3.54 3.35 3.03 3.54 3.17 3.02 4.76 4.45 4.451.56 1.87 2.38 2.26 2.70 3.03 3.18 3.00 2.71 3.21 2.86 2.73 4.43 4.15 4.151.32 1.55 1.98 1.90 2.28 2.27 2.39 2.25 2.03 2.41 2.14 2.05 3.32 3.11 3.111.37 1.80 2.28 2.12 2.70 2.56 2.76 2.67 1.94 2.28 2.27 2.21 3.31 3.43 3.381.22 1.57 1.95 1.77 2.48 2.23 2.40 2.29 1.52 1.83 1.78 1.68 2.74 2.81 2.721.57 1.52 1.10 1.53 2.45 2.17 2.34 2.22 1.21 1.57 1.57 1.51 2.59 2.68 2.61
4.12 3.39 3.19 4.04 4.99 6.69 8.57 10.35 11.11 12.24 13.14 14.20 16.35 18.70 20.640.28 0.30 0.32 0.33 0.34 0.34 0.34 0.34 0.34 0.34 0.34 0.34 0.34 0.34 0.344.12 3.39 3.19 3.41 4.32 6.04 7.93 9.70 10.47 11.59 12.72 13.78 15.93 18.17 20.33
-0.11 -0.15 -0.17 -0.13 -0.12 -0.09 -0.08 -0.07 -0.02 0.02 0.04 0.06 0.07 0.07 0.07-0.27 -0.47 -0.36 -0.29 -0.19 0.00 0.14 0.24 0.33 0.42 0.49 0.54 0.61 0.66 0.700.24 0.29 0.31 0.26 0.28 0.26 0.24 0.20 0.17 0.19 0.16 0.14 0.20 0.17 0.15
7.12 7.12 9.08 12.17 16.19 23.30 30.50 40.23 48.46 71.971.36 0.97 0.99 1.03 1.16 1.55 1.98 2.39 3.39 4.82 7.15 9.50 13.45 16.90 25.830.64 0.81 0.83 0.75 0.73 0.68 0.60 0.52 0.46 0.44 0.39 0.34 0.34 0.28 0.25
15.9 14.0 13.2 14.5 16.0 13.6 15.2 15.9 9.9 10.6 10.59.7 8.7 8.3 8.7 9.6 8.3 9.2 9.7 6.1 6.6 6.6
13.7 15.5 14.4 15.1 27.8 21.4 21.4 22.3 13.0 12.5 12.96.5 4.8 3.8 3.1 2.7 2.4 2.1 1.9 1.6 1.5 1.34.8 4.3 4.2 4.2 4.6 4.4 4.8 5.0 4.5 4.9 4.9
1.5% 10.3% 22.6% (9.0%) 18.8% (0.2%) 5.0% (5.9%) (9.5%) 18.4% (11.0%) (4.5%) 62.5% (6.3%) 0%12.7% 14.9% 23.0% (6.6%) 16.8% 12.6% 4.8% (5.4%) (9.3%) 16.8% (10.6%) (4.6%) 57.6% (6.5%) 0%1.1% (9.0%) (30.5%) 32.1% 58.1% (11.4%) 7.8% (4.9%) (45.6%) 30.1% (0.2%) (4.0%) 72.0% 3.5% (2.9%)
(18.8%) 21.1% 18.7% (13.6%) 38.8% (9.9%) 7.6% (4.8%) (33.4%) 20.0% (2.7%) (5.5%) 63.0% 2.6% (3.2%)1.5% 446.6% 47.0% (55.6%) (229.8%) (40.5%) 151.9% (707.6%) (27.8%) 48.0% (47.7%) (23.9%) 276.1% (58.2%) (10.8%)
(18.9%) 1.9% 44.4% 19.3% (7.4%) 4.7% 2.2% 1.1% 40.5% 34.7% 26.7% 26.3% 22.0% 13.8% 16.3%(14.4%) (12.1%) 9.1% 21.8% 18.7% 5.5% (0.2%) 2.7% 14.6% 25.4% 34.0% 29.2% 25.0% 20.7% 17.4%(8.8%) (5.8%) 0.6% 5.5% 7.9% 12.6% 12.6% 4.0% 8.2% 16.6% 21.0% 25.9% 30.0% 24.7% 21.0%
© 2011 Morningstar, Inc. All Rights Reserved. Page 7/7 01/19/2011
SAMPLE

?
General Motors CoTM
S-1 Date Most Recent S-1/A Fair Value Uncertainty Economic Moat Industry Sector08-18-2010 10-25-2010 44 USD High None Auto Manufacturers Industrials
Currency amounts expressed with "$"are in U.S. dollars (USD) unlessotherwise denoted.
We think GM shares are cheap.
by David Whiston, CFA, CPA, CFEStock AnalystAnalysts covering this company do notown its stock.
Report updated on November 04, 2010.
Revenue (Mil)
06 07 08 09
3037
6075
9113
1215112151
8599
6479
Offer DateOffer PricePrice Range - Shares OfferedShares Outstanding 1500000000
Selling ShareholdersUnited States TreasuryDepartment
912,394,068
Canada GEN InvestmentCorporation
175,105,932
UAW Retiree MedicalBenefits Trust
262,500,000
Motors LiquidationCompany
150,000,000
UnderwritersMorgan Stanley & Co.Incorporated J.P. Morgan SecuritiesLLC BofA Merrill Lynch Citigroup Global MarketsInc. Barclays Capital Inc. Credit Suisse Securities(USA) LLC Deutsche Bank SecuritiesInc. Goldman, Sachs & Co. RBC Capital MarketsCorporation
Post-IPO Shareholders
Shares Subject to Lock-upDate of Lock-up Release
Thesis Nov. 04, 2010
Although the "Government Motors" stigma is likely tohang over General Motors Company for years, we thinkGM’s car models have their best quality and design indecades. The company is already a leader in truck models,so a fully competitive lineup, combined with a muchsmaller cost base, leads us to think that GM will beprinting money as vehicle demand recovers. We think GM’s earnings potential is excellent because thefirm finally has a healthy North American unit, and canfocus its U.S. marketing efforts on four brands instead ofeight. The most critical cost-saving measure was settingup a voluntary employees’ beneficiary association for theretiree health-care costs of the United Auto Workers. Thismove saves GM about $3 billion a year, and other wageand benefit concessions have drastically lowered GM’sNorth American break-even point to about 10.5 million to11 million vehicles. The actual point varies based on mixand incentive levels. We think normative demand for U.S.light vehicles is about 16 million to 17 million units, so weexpect GM to report excellent earnings growth as vehicledemand comes back over the next few years. Dramatically better pricing has helped GM be profitable atvolume levels that would have meant billions in losses afew years ago. The new Buick LaCrosse, for example, sellsfor about $7,800 more per unit compared with 2009.Simply put, GM makes products that consumers arewilling to pay more for than they once did. GM no longerhas to overproduce to attempt to cover high labor costs,and then dump cars into rental fleets (which hurts residualvalues). It now operates in a demand-pull model, where itcan produce only to meet demand, and is structured tobreak even at the bottom of an economic cycle. We thinkthe largest threat to profitability is Europe, which hasbeen losing money for a long time. The S-1 gives plannedGM Europe capacity reduction and annual labor costreduction targets of 20% and $323 million, respectively.
GM stockholders have to consider politics as long as theU.S. Treasury, Canadian and Ontario governments, and anaffiliate of the UAW own large amounts of GM stock. Wethink this ownership will be an overhang on the stock forsome time, since the U.S. government is likely to sell offits stake gradually in order to get the highest possibleshare price to get its money back. We also expect theVEBA to reduce its stake over time, since it needs tomonetize its holdings to pay retiree health-care claims.Although these concerns are valid, we see them asshort-term issues. We think the company is about to seethe upside to having a high degree of operating leverage. GM repaid all of its government loan obligations in April,so long-term debt, excluding preferred stock at June 30,was just $2.6 billion, mostly from balances on credit linesfor international operations. In October, GM announced anew $5 billion secured credit line, but expects it willremain generally undrawn. It also said it paid off the $2.8billion VEBA note obligation, which was in short-termdebt. We like this move since it is a gesture of good faithwith the UAW, and the new credit facility probably has amuch lower interest rate than the implied 9% rate on theVEBA notes. Including short-term debt, we calculateannualized debt/EBITDA for the first half of 2010 to be0.56 times, versus our calculation of 2.38 times for Ford’sautomotive segment. Preferred stock is now part of thecapital structure, and including the nearly $7 billion ofSeries A preferred stock at June 30, gives a debt/equityratio of 0.63. In October, GM announced that, after theIPO, it will redeem all of the $2.1 billion of the U.S.Treasury’s Series A preferred shares. GM also has largeunderfunded pension and other postemployment benefitsbalances at June 30 of $26.4 billion and $9.3 billion,respectively. GM said that, after the IPO, it will fund thepension with $4 billion in cash and $2 billion in GMcommon stock. We have assumed this stock will be issuedat $27.50 per share in our valuation model, which is about72.7 million shares. The share structure of GM is common stock and twoseries of preferred stock. The current ownership of the 1.5billion shares of outstanding common stock is 60.8% to
SAMPLE

General Motors CoTM
S-1 Date Most Recent S-1/A Fair Value Uncertainty Economic Moat Industry Sector08-18-2010 10-25-2010 44 USD High None Auto Manufacturers Industrials
Close Competitors Morningstar Rating P/E Ratio Market Cap
General Motors Co
Ford
Toyota
Honda
.
QQQ
QQQQ
QQQ
.
8.41
18.84
9.98
.
48.6 B
110.4 B
65.2 B
Morningstar data as of November 04, 2010.
the U.S. Treasury, 17.5% to the VEBA, 11.7% to an entitycontrolled by the governments of Canada and Ontario, and10% to Motors Liquidation Company. Approximatelyanother 318.2 million common shares can be issued viawarrants to Motors Liquidation and the VEBA. Per GM’sS-1, the warrant exercise breaks out as follows: MotorsLiquidation can acquire about 136.36 million shares of GMcommon stock at a $10 per share strike price any timebefore July 10, 2016, and it can acquire anotherapproximately 136.36 million shares at a $18.33 per sharestrike price any time before July 10, 2019. The VEBA canacquire about 45.45 million shares of GM common stockany time before Dec. 31, 2015, at a strike price of $42.31per share. Motors Liquidation also may receive up to 30million more common shares (the adjustment shares)depending on the amount of general unsecured claimsagainst it exceeding $35 billion, as estimated by abankruptcy judge. GM has already determined that atleast 8.6 million more shares will probably be issued toMotors Liquidation under this arrangement, which is apurchase price adjustment for the 363 sale to allow GM toemerge from old GM’s Chapter 11. We calculate that asmany as 23 million shares may be issued to managementto settle restricted stock units already awarded. Ourcalculations put the maximum number of common sharesat about 1.944 billion. Before old GM became distressed,its diluted share count was 1.698 billion after adjusting fornew GM’s 3 for 1 common stock split announced inNovember 2010. The 9.0% Series A preferred stock is recorded at justunder $7 billion as of June 30, but is redeemable at $9
billion (360 million shares times $25 per share liquidationvalue). The value will be less shortly after the IPO, sinceGM plans to redeem all of the U.S. Treasury’s Series A for$2.1 billion. Per the S-1, 260 million of the Series A sharesare held by the VEBA, about 83.9 million by the U.S.Treasury, and about 16.1 million by an entity controlled bythe Canadian and Ontario governments. The dividends arecumulative, and the preferred shares also prohibit acommon share cash dividend unless all accrued andunpaid preferred dividends have been paid. The IPO introduces a new class of mandatory convertiblejunior preferred shares (Series B). The Series B preferredshares are not redeemable, but will be convertible intoGM common stock. The exact conversion rate anddividend has not been determined, and the S-1 indicates amandatory conversion sometime in 2013. Neither class ofpreferred stock has voting rights except for issues relatingto changes in the terms of the preferred share class. IPO Motivation GM is going public in order for the stakeholders whosupported the bankruptcy to start monetizing theirinvestment. The largest stakeholder is the U.S. Treasury,which owns 60.8% of the common equity. Depending onthe overallotment, the Treasury will own between 43.26%and 40.62% of the common stock after the IPO. Valuation Our preliminary fair value estimate for General MotorsCompany is $44 per share after factoring in the 3 for 1common stock split. The Series A preferred were not split.We are modeling $3 billion of Series B preferred stock tobe issued. Total industry North American light-vehicle production is acritical input to our valuation. We have long believed that
© 2010 Morningstar. All Rights Reserved. Unless otherwise provided in a separate agreement, you may use this report only in the country in which its original distributor is based. Data as originally reported.The information contained herein is not represented or warranted to be accurate, correct, complete, or timely. This report is for information purposes only, and should not be considered a solicitation to buy or sell any security.Redistribution is prohibited without written permission. To order reprints, call +1 312-696-6100. To license the research, call +1 312-696-6869.
ß ®
SAMPLE

General Motors CoTM
S-1 Date Most Recent S-1/A Fair Value Uncertainty Economic Moat Industry Sector08-18-2010 10-25-2010 44 USD High None Auto Manufacturers Industrials
2009 volume was well below normative levels of demand.We model 2011 North American production of 13 millionunits, and then 18.5 million in 2012. We model operatingmargins peaking at 11% in 2012, with the critical midcycleoperating margin in the last year of our explicit forecastperiod at 9.5%. We model capital expenditures at 5.5% ofrevenue, on average. We model GM Financial atAmeriCredit’s June 30 book value, but have made no otheradjustments for possible future captive finance expansion.Our weighted average cost of capital is 10%, and we arededucting $9.9 billion in preferred stock from our commonstock valuation. Our diluted share count is about 1.944billion to reflect additional shares from warrants,restricted stock units, and equity issuances to fund thepension. Our base and upside scenarios model 2011 volume higherthan 2010, as well as a dramatic increase in 2012, as theindustry absorbs pent-up demand. The base case forecastspeak North American light-vehicle production of 18.5million, while the upside ($69 fair value) models 20million, and a midcycle margin of 11.5% compared with9.5% in the base case. The base-case U.S. market share isforecast to gradually decline to 17.5% by year five of ourforecast period. The downside fair value of $13 models amuch slower rate of recovery in volume, market sharefalling below 17% by year five, and a midcycle operatingmargin of 7%. Our fair value estimate could change dramatically becauseof the extreme sensitivity of our discounted cash-flowmodel to key inputs such as North American light-vehicleproduction, midcycle margin, and the WACC. Our fairvalue estimate declines 27.2% to $32 if we raise theWACC to 10.5%, lower the midcycle margin 100 basispoints, and lower our year-five North American productionfigure by 1 million units. Our fair value uncertainty is high,to account for the wide possibilities in GM’s fair value,given its high degree of operating leverage.
Risk The biggest risk to GM would be a scenario where toomany Americans refuse to buy its vehicles because ofanimosity over the taxpayer-financed bailout, and thegovernment’s continued ownership of the company. Ifsales were to decline for many years, GM would probablygo bankrupt. We consider the likelihood of this scenariooccurring to be nearly zero. GM can break even atnear-depression-like sales volume, and it is selling moreunits in the U.S. with four brands than old GM did witheight brands in 2009. Another risk comes from GMdisclosing it has a material weakness in its internalcontrols over financial reporting. This issue has been aproblem for several years now. Although we think that GMis close to correcting the deficiency, poor internal controlsraise the inherent risk for problems, such as a materialrestatement of results due to error or fraud. Anotherimportant risk is GM’s underfunded pension. The plan wasunderfunded by $26.4 billion as of June 30. Managementdoes not expect to be forced to make a materialcontribution until 2014, but that assertion is only anestimate. On Oct. 28, GM announced that, after the IPO, itwill contribute $4 billion in cash to the pension, andanother $2 billion in GM stock. Bulls Say
GM’s break-even point is drastically lower than it wasunder old GM. The company’s earnings should growrapidly as vehicle sales rebound from 2009 levels. The VEBA saves GM billions of dollars in cash everyyear. New models such as the Buick LaCrosse have been verysuccessful. GM can charge thousands of dollars moreper vehicle than it used to in certain vehicle segments.Higher prices allow GM to achieve greater margin pervehicle, which helps mitigate the severe decline inlight-vehicle sales. Models such as the Chevrolet Malibu and Chevrolet
© 2010 Morningstar. All Rights Reserved. Unless otherwise provided in a separate agreement, you may use this report only in the country in which its original distributor is based. Data as originally reported.The information contained herein is not represented or warranted to be accurate, correct, complete, or timely. This report is for information purposes only, and should not be considered a solicitation to buy or sell any security.Redistribution is prohibited without written permission. To order reprints, call +1 312-696-6100. To license the research, call +1 312-696-6869.
ß ®
SAMPLE

General Motors CoTM
S-1 Date Most Recent S-1/A Fair Value Uncertainty Economic Moat Industry Sector08-18-2010 10-25-2010 44 USD High None Auto Manufacturers Industrials
Cruze show that GM can make a vehicle to competedirectly with the car models produced by Japanese andEuropean automakers. GM already is a top player in critical emerging marketssuch as Brazil and China. It sells about 70% of itsvehicles outside North America.
Bears Say
The cadence of a recovery in global vehicle demand isvery uncertain. The collective bargaining agreement with the UAWexpires in September 2011. Although the UAW hasagreed not to strike, it is still looking to get back someof what it gave up during the bankruptcy. The U.S. auto market is becoming more crowded eachyear. Hyundai and Volkswagen are likely to capturemore share over time from existing players such asGM. Some American consumers will never buy another GMvehicle because of their anger over GM receivingtaxpayer loans.
Financial Overview Growth: We are very optimistic about GM’s growthprospects. As U.S. light-vehicle demand keeps improvingfrom what we believe was the bottom in 2009, we see thefirm posting over a 9% revenue compound annual growthrate over our five-year explicit forecast period. Profitability: As global light-vehicle demand recovers, weexpect GM’s earnings to grow considerably, thanks to adramatically lower cost base than old GM. We modelreturn on invested capital to peak at nearly 21% beforecoming down to about 13% at the end of our forecastperiod. Financial Health: GM’s balance sheet and liquidity remains
very strong at June 30, apart from $35.7 billion inunderfunded pension and OPEB obligations. Cash andinvestments was $31.5 billion, and available credit lines(including a new $5 billion secured facility announced inOctober) provide another $6.1 billion in funds if needed.Pro forma liquidity at June 30 was about $24 billion. GM’sS-1 stated that the company does not expect a materialmandatory pension contribution until 2014, and we thinkthe planned $6 billion pension funding after the IPO helpsmitigate that risk. Company Overview Profile: General Motors Company emerged from thebankruptcy of General Motors Corporation (old GM) in July2009. GM has 12 brands and operates under threesegments: General Motors North America, General MotorsEurope, and General Motors International Operations. TheUnited States now has four brands (Chevrolet, GMC,Buick, and Cadillac) instead of eight under old GM. Thecompany remains the market leader in the U.S. with about19% share. Strategy: GM seeks to have the best vehicles in everysegment it competes in. The company’s traditionalstrength is in pickups and sport-utility vehicles, but it nowalso makes car models such as the Chevrolet Cruze thatcan go head to head with the volume import brands.Taking back lost car segment market share is critical toGM’s success, especially if gas prices return to 2008levels. Management: GM’s leadership has undergone tremendouschange during the restructuring. CEO and soon-to-bechairman Dan Akerson is already the third CEO since thecompany emerged from old GM’s bankruptcy. Akerson is atelecommunications veteran, and was at the Carlyle Groupbefore becoming CEO. CFO Chris Liddell joined GM inJanuary following his tenure as CFO of Microsoft. Liddell
© 2010 Morningstar. All Rights Reserved. Unless otherwise provided in a separate agreement, you may use this report only in the country in which its original distributor is based. Data as originally reported.The information contained herein is not represented or warranted to be accurate, correct, complete, or timely. This report is for information purposes only, and should not be considered a solicitation to buy or sell any security.Redistribution is prohibited without written permission. To order reprints, call +1 312-696-6100. To license the research, call +1 312-696-6869.
ß ®
SAMPLE

General Motors CoTM
S-1 Date Most Recent S-1/A Fair Value Uncertainty Economic Moat Industry Sector08-18-2010 10-25-2010 44 USD High None Auto Manufacturers Industrials
was also CFO of International Paper. The board has alsochanged dramatically from old GM, with two thirds of itsmembers new to the company, and we see only vicechairman Steve Girsky having significant prior automotiveexperience. Girsky was appointed to the board by theVEBA. Although one can question this lack of automotiveexperience, we think the industry outsiders are qualifiedto do their jobs. All of these individuals have extensiveexperience in other industries, and are not novices when itcomes to making hard decisions. We like having newleadership, since it removes any element of the arroganceand resistance to change that hindered the old regime, inour opinion. Furthermore, we think critics do notunderstand that the capable junior executives at GM areall auto industry veterans. We see GM now having aleadership composition similar to Ford. Ford is run by anauto outsider, Alan Mulally, who is supported by severalauto veterans such as CFO Lewis Booth, marketing chiefJim Farley, who earned his stripes at Toyota, andpresident of the Americas Mark Fields. This structure hasworked very well at Ford. We think it can work well at GMtoo, provided that Akerson has the right vision. Still, wehave to give GM a low grade because of the significantinfluence exerted by the VEBA and U.S. Treasury, and fornot separating the CEO and chairman roles.
© 2010 Morningstar. All Rights Reserved. Unless otherwise provided in a separate agreement, you may use this report only in the country in which its original distributor is based. Data as originally reported.The information contained herein is not represented or warranted to be accurate, correct, complete, or timely. This report is for information purposes only, and should not be considered a solicitation to buy or sell any security.Redistribution is prohibited without written permission. To order reprints, call +1 312-696-6100. To license the research, call +1 312-696-6869.
ß ®
Disclaimers & DisclosuresNo Morningstar employees are officers or directors of this company. Morningstar Inc. does not own more than 1% of the shares of this company. Analystscovering this company do not own its stock. The information contained herein is not represented or warranted to be accurate, correct, complete, or timely.This report is for information purposes only, and should not be considered a solicitation to buy or sell any security.
SAMPLE

Morningstar’s Approach to Rating Stocks
Our Key Investing ConceptsEconomic Moat RatingDiscounted Cash FlowDiscount RateFair ValueUncertaintyMargin of SafetyConsider Buying/Consider SellingStewardship Grades
TMAt Morningstar, we evaluate stocks as pieces of abusiness, not as pieces of paper. We think that purchasingshares of superior businesses at discounts to theirintrinsic value and allowing them to compound their valueover long periods of time is the surest way to createwealth in the stock market. We rate stocks 1 through 5 stars, with 5 the best and 1the worst. Our star rating is based on our analyst’sestimate of how much a company’s business is worth pershare. Our analysts arrive at this "fair value estimate" byforecasting how much excess cash--or "free cashflow"--the firm will generate in the future, and thenadjusting the total for timing and risk. Cash generatednext year is worth more than cash generated several yearsdown the road, and cash from a stable and consistentlyprofitable business is worth more than cash from acyclical or unsteady business. Stocks trading at meaningful discounts to our fair valueestimates will receive high star ratings. For high-qualitybusinesses, we require a smaller discount than formediocre ones, for a simple reason: We have moreconfidence in our cash-flow forecasts for strongcompanies, and thus in our value estimates. If a stock’smarket price is significantly above our fair value estimate,it will receive a low star rating, no matter how wonderfulwe think the business is. Even the best company is a baddeal if an investor overpays for its shares. Our fair value estimates don’t change very often, butmarket prices do. So, a stock may gain or lose stars based
just on movement in the share price. If we think a stock’sfair value is $50, and the shares decline to $40 withoutmuch change in the value of the business, the star ratingwill go up. Our estimate of what the business is worthhasn’t changed, but the shares are more attractive as aninvestment at $40 than they were at $50. Because we focus on the long-term value of businesses,rather than short-term movements in stock prices, at timeswe may appear out of step with the overall stock market.When stocks are high, relatively few will receive ourhighest rating of 5 stars. But when the market tumbles,many more will likely garner 5 stars. Although you mightexpect to see more 5-star stocks as the market rises, wefind assets more attractive when they’re cheap. We calculate our star ratings nightly after the marketsclose, and issue them the following business day, which iswhy the rating date on our reports will always be theprevious business day. We update the text of our reportsas new information becomes available, usually about onceor twice per quarter. That is why you’ll see two dates onevery Morningstar stock report. Of course, we monitormarket events and all of our stocks every business day, soour ratings always reflect our analyst’s current opinion. Economic Moat Rating The Economic Moat Rating is our assessment of a firm’sability to earn returns consistently above its cost of capitalin the future, usually by virtue of some competitiveadvantage. Competition tends to drive down such
TM
TM
Morningstar ResearchMethodology for ValuingCompanies QQQQQ
Competitive Economic Company Fair Value UncertaintyAnalysis Moat Rating Valuation Estimate Assessment
TM
Analyst conducts The depth of the Analyst considers DCF model leads to An uncertaintycompany and industry firm’s competitive company financial the firm’s Fair Value assessmentresearch: advantage is rated: statements and Estimate, which establishes the competitive position anchors the rating margin ofManagement None to forecast future framework. safety required forinterviews Narrow cash flows. the stock rating.Conference calls Wide Trade-show visits Assumptions areCompetitor, supplier, input into a dis-distributor, and counted cash-flowcustomer interviews model.
The current stockprice relative to fairvalue, adjustedfor uncertainty,determines therating.
Q
QQQ
QQQQ
QQQQQ
© 2010 Morningstar. All Rights Reserved. Unless otherwise provided in a separate agreement, you may use this report only in the country in which its original distributor is based. Data as originally reported.The information contained herein is not represented or warranted to be accurate, correct, complete, or timely. This report is for information purposes only, and should not be considered a solicitation to buy or sell any security.Redistribution is prohibited without written permission. To order reprints, call +1 312-696-6100. To license the research, call +1 312-696-6869.
ß ®
SAMPLE

Morningstar’s Approach to Rating Stocks (continued)
economic profits, but companies that can earn them for anextended time by creating a competitive advantagepossess an Economic Moat. We see these companies assuperior investments. Discounted Cash Flow This is a method for valuing companies that involvesprojecting the amount of cash a business will generate inthe future, subtracting the amount of cash that thecompany will need to reinvest in its business, and usingthe result to calculate the worth of the firm. We use thistechnique to value nearly all of the companies we cover. Discount Rate We use this number to adjust the value of our forecastedcash flows for the risk that they may not materialize. For aprofitable company in a steady line of business, we’ll usea lower discount rate, also known as "cost of capital,"than for a firm in a cyclical business with fiercecompetition, since there’s less risk clouding the firm’sfuture. Fair Value This is the output of our discounted cash-flow valuationmodels, and is our per-share estimate of a company’sintrinsic worth. We adjust our fair values for off-balancesheet liabilities or assets that a firm might have--forexample, we deduct from a company’s fair value if it hasissued a lot of stock options or has an under-fundedpension plan. Our fair value estimate differs from a "targetprice" in two ways. First, it’s an estimate of what thebusiness is worth, whereas a price target typically reflectswhat other investors may pay for the stock. Second, it’s along-term estimate, whereas price targets generally focuson the next two to 12 months. Uncertainty To generate the Morningstar Uncertainty Rating, analystsconsider factors such as sales predictability, operatingleverage, and financial leverage. Analysts then classifytheir ability to bound the fair value estimate for the stockinto one of several uncertainty levels: Low, Medium, High,
Very High, or Extreme. The greater the level of uncertainty,the greater the discount to fair value required before astock can earn 5 stars, and the greater the premium to fairvalue before a stock earns a 1-star rating. Margin of Safety This is the discount to fair value we would require beforerecommending a stock. We think it’s always prudent tobuy stocks for less than they’re worth.The margin of safetyis like an insurance policy that protects investors from badnews or overly optimistic fair value estimates. We requirelarger margins of safety for less predictable stocks, andsmaller margins of safety for more predictable stocks. Consider Buying/Consider Selling The consider buying price is the price at which a stockwould be rated 5 stars, and thus the point at which wewould consider the stock an extremely attractivepurchase. Conversely, consider selling is the price atwhich a stock would have a 1 star rating, at which pointwe’d consider the stock overvalued, with low expectedreturns relative to its risk. Stewardship Grades We evaluate the commitment to shareholdersdemonstrated by each firm’s board and management teamby assessing transparency, shareholder friendliness,incentives, and ownership. We aim to identify firms thatprovide investors with insufficient or potentiallymisleading financial information, seek to limit the powerof minority shareholders, allow management to abuse itsposition, or which have management incentives that arenot aligned with the interests of long-term shareholders.The grades are assigned on an absolute scale--not relativeto peers--and can be interpreted as follows: A means"Excellent," B means "Good," C means "Fair," D means"Poor," and F means "Very Poor."
© 2010 Morningstar. All Rights Reserved. Unless otherwise provided in a separate agreement, you may use this report only in the country in which its original distributor is based. Data as originally reported.The information contained herein is not represented or warranted to be accurate, correct, complete, or timely. This report is for information purposes only, and should not be considered a solicitation to buy or sell any security.Redistribution is prohibited without written permission. To order reprints, call +1 312-696-6100. To license the research, call +1 312-696-6869.
ß ®
SAMPLE

Morningstar’s Approach to Analyzing Initial Public Offerings (IPOs)
At Morningstar, we evaluate IPOs in much the same wayas the stocks of established companies we cover. Weemploy the same rigorous industry analysis, fundamentalresearch, and discounted cash-flow valuation to determinewhat the business is worth. With stocks new to themarket, we consider several additional factors. IPO Motivation First, we ask why the company is selling shares to thepublic. Is it growing quickly and needs capital to expand?Has it been around for decades in an industry that iscurrently hot, and seeks to sell shares while they fetch ahigh price? Are the company’s founders selling theirinterest to cash in on their life’s work? Answers to thesequestions can have a large impact on the market for anIPO and may influence elements of our investment thesis. Supply and Demand The quality and profitability of the underlying business,the prospects of the company’s industry, and marketparticipants’ appetite for IPO shares all can influencedemand. Demand in the IPO market waxes and waneswith investors’ sentiment and appetite for risk. We viewthis fluctuation as a source of opportunity. For example,companies that need capital but don’t happen to be in atrendy sector can make for attractive investmentopportunities. Additionally, stocks that arrive with greatfanfare (often at a steep offering price) occasionallyreward the patient investor who waits for the initialexcitement to pass and the share price to dip. IPO Specific Terms and Data points S-1 Date: This is the day the firm first filed documents with
the SEC usually under form S-1, but sometimes F-1, S-11,or SB-2 to start the process of issuing shares to the public.This document is then amended over time (S-1/A) as newinformation becomes available leading up to the offering. Offer Date: This is the day the company expects the IPO to
occur, and it is subject to change. If the IPO has alreadyoccurred, this was the first day the shares were traded bythe public. Offer Price: The price at which the company initially sells its
shares to the public. Traditionally, the company’sunderwriters accompany management on a road show
across the country to talk about the firm and determinelarge investors’ interest in buying its stock. The level ofinterest expressed by these investors determines at whatprice and in what amount the shares are offered. Price Range: Prior to the offering, the company and its
underwriters estimate a price range within which theyanticipate the shares may initially trade. After the IPO,comparing the anticipated price range with the final offerprice and the number of shares floated can shed light onhow warmly investors received the shares. Shares Outstanding: The total number of shares of the
company. Existing shareholders may want to maintainmajority ownership and to only sell a portion of the firm. Shares Offered: The number of shares sold to the public.
Selling Shareholders: In most offerings, the firm itself will be
issuing new shares to the public. Sometimes insiders sellexisting shares at the IPO as well. This list includes allselling shareholders and the shares each is offering. Underwriters: Usually, Wall Street brokerage firms shepherd
the company through the IPO process. They perform suchtasks as evaluating the company’s prospects andmarketability, writing IPO documents, hiring lawyers,conducting the road show, and distributing the stock toinvestors. They also perform important functions after theIPO such as trading the company’s stock. Post-IPO Shareholders: We list all major shareholders and
executives here with the number of shares they continueto hold after the offering. Comparing these figures withthe total number of shares outstanding and the number ofshares each party sold at the offering often provides cluesregarding the incentives and motivation of the people whowill have the biggest influence over the firm’s success. Lockup Period: During the lock-up period, certain existing
shareholders agree not to sell their shares. The amount ofshares subject to lockup and the date the lockup expires isimportant because the stock price can fall dramatically ifinsiders sell a large portion of their shares simultaneously.
© 2010 Morningstar. All Rights Reserved. Unless otherwise provided in a separate agreement, you may use this report only in the country in which its original distributor is based. Data as originally reported.The information contained herein is not represented or warranted to be accurate, correct, complete, or timely. This report is for information purposes only, and should not be considered a solicitation to buy or sell any security.Redistribution is prohibited without written permission. To order reprints, call +1 312-696-6100. To license the research, call +1 312-696-6869.
ß ®
SAMPLE
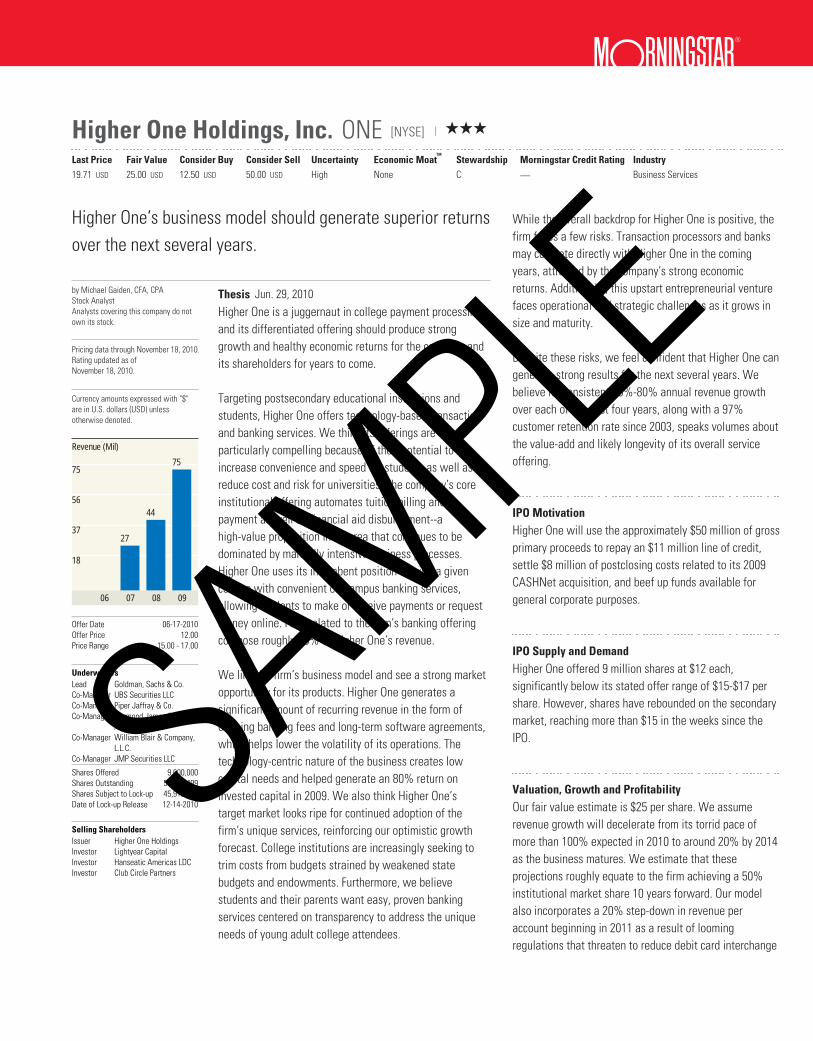
?
Higher One Holdings, Inc. ONE [NYSE] | QQQ
TM
Last Price Fair Value Consider Buy Consider Sell Uncertainty Economic Moat Stewardship Morningstar Credit Rating Industry19.71 USD 25.00 USD 12.50 USD 50.00 USD High None C Business Services .
Currency amounts expressed with "$"are in U.S. dollars (USD) unlessotherwise denoted.
Higher One’s business model should generate superior returns
over the next several years.
by Michael Gaiden, CFA, CPAStock AnalystAnalysts covering this company do notown its stock.
Pricing data through November 18, 2010.Rating updated as ofNovember 18, 2010.
Revenue (Mil)
06 07 08 09
18
37
56
75
27
44
75
Offer Date 06-17-2010Offer Price 12.00Price Range 15.00 - 17.00
UnderwritersLead Goldman, Sachs & Co. Co-Manager UBS Securities LLC Co-Manager Piper Jaffray & Co. Co-Manager Raymond James &
Associates, Inc. Co-Manager William Blair & Company,
L.L.C. Co-Manager JMP Securities LLC
Shares Offered 9,000,000Shares Outstanding 55,071,499Shares Subject to Lock-up 45,916,499Date of Lock-up Release 12-14-2010
Selling ShareholdersIssuer Higher One Holdings Investor Lightyear Capital Investor Hanseatic Americas LDC Investor Club Circle Partners
Thesis Jun. 29, 2010
Higher One is a juggernaut in college payment processing,and its differentiated offering should produce stronggrowth and healthy economic returns for the company andits shareholders for years to come. Targeting postsecondary educational institutions andstudents, Higher One offers technology-based transactionand banking services. We think its offerings areparticularly compelling because of their potential toincrease convenience and speed for students as well asreduce cost and risk for universities. The company’s coreinstitutional offering automates tuition billing andpayment as well as financial aid disbursement--ahigh-value proposition in an area that continues to bedominated by manually intensive business processes.Higher One uses its incumbent position serving a givencollege with convenient on-campus banking services,allowing students to make or receive payments or requestmoney online. Fees related to the firm’s banking offeringcompose roughly 80% of Higher One’s revenue. We like the firm’s business model and see a strong marketopportunity for its products. Higher One generates asignificant amount of recurring revenue in the form ofongoing banking fees and long-term software agreements,which helps lower the volatility of its operations. Thetechnology-centric nature of the business creates lowcapital needs and helped generate an 80% return oninvested capital in 2009. We also think Higher One’starget market looks ripe for continued adoption of thefirm’s unique services, reinforcing our optimistic growthforecast. College institutions are increasingly seeking totrim costs from budgets strained by weakened statebudgets and endowments. Furthermore, we believestudents and their parents want easy, proven bankingservices centered on transparency to address the uniqueneeds of young adult college attendees.
While the overall backdrop for Higher One is positive, thefirm faces a few risks. Transaction processors and banksmay compete directly with Higher One in the comingyears, attracted by the company’s strong economicreturns. Additionally, this upstart entrepreneurial venturefaces operational and strategic challenges as it grows insize and maturity. Despite these risks, we feel confident that Higher One cangenerate strong results for the next several years. Webelieve its consistent 60%-80% annual revenue growthover each of the past four years, along with a 97%customer retention rate since 2003, speaks volumes aboutthe value-add and likely longevity of its overall serviceoffering. IPO Motivation Higher One will use the approximately $50 million of grossprimary proceeds to repay an $11 million line of credit,settle $8 million of postclosing costs related to its 2009CASHNet acquisition, and beef up funds available forgeneral corporate purposes. IPO Supply and Demand Higher One offered 9 million shares at $12 each,significantly below its stated offer range of $15-$17 pershare. However, shares have rebounded on the secondarymarket, reaching more than $15 in the weeks since theIPO. Valuation, Growth and Profitability Our fair value estimate is $25 per share. We assumerevenue growth will decelerate from its torrid pace ofmore than 100% expected in 2010 to around 20% by 2014as the business matures. We estimate that theseprojections roughly equate to the firm achieving a 50%institutional market share 10 years forward. Our modelalso incorporates a 20% step-down in revenue peraccount beginning in 2011 as a result of loomingregulations that threaten to reduce debit card interchange
SAMPLE

Higher One Holdings, Inc. ONE [NYSE] | QQQ
TM
Last Price Fair Value Consider Buy Consider Sell Uncertainty Economic Moat Stewardship Morningstar Credit Rating Industry19.71 USD 25.00 USD 12.50 USD 50.00 USD High None C Business Services .
Close Competitors Currency(Mil) Market Cap TTM Sales Oper Income Net Income
Higher One Holdings, Inc.
Wells Fargo Company
U.S. Bancorp
Nelnet, Inc.
USD
USD
USD
USD
1,101 127 36 21
144,393 86,412 . 8,794
47,977 17,597 . 2,961
1,056 774 . 163
Morningstar data as of November 18, 2010.
and bounced check fees. We estimate Higher One’soperating margin will expand from 30% currently toroughly 35% by the fifth year of our forecast on the basisof economies of scale that should drive 70% incrementalgross margins. We have assigned Higher One a highuncertainty rating, and we estimate a cost of equity of10.5% for the firm. Risk Higher One will probably face increasing competitivepressure over the long term from banks and paymentprocessors anxious to gain the attractive economic returnscurrently enjoyed by the company. The firm also facessecondary risks related to the potential breach ofconfidential client information, system failures, andintegration issues related to the 2009 purchase ofCASHNet. Bulls Say
Higher One’s business model results in regularlyrecurring revenue in the form of banking and softwarefees from the rather noncyclical higher educationmarket. Higher One generates attractive economic profits with50%-plus returns on invested capital expected for yearsto come. Higher One has increased sales 60%-80% in each ofthe past three years and is on pace for similarexpansion through the first quarter of 2010.
Bears Say
Intense competition looms from banks and technologyfirms, which could temper returns and growthprospects. Higher One has a limited record as a large nationalservice provider. Like all upstart entrepreneurial ventures, Higher Onewill face new operational and strategic challenges asits business grows.
Financial Overview Financial Health: Higher One has sound financial healthanchored by its zero net debt position, roughly 30%operating margins, and strong free cash flow representing90%-100% of operating profit in each of the past threeyears. Company Overview Profile: Higher One provides technology-based paymentservices to the higher education industry and relatedbanking services to college students. Founded in 2000, thefirm has experienced rapid growth since inception andnow serves more than 400 campuses and 1.2 million bankaccount holders. Management: We think Higher One has a fair corporatestewardship profile. It has a veteran team of seniormanagers with solid financial services and technologyindustry experience, led by president and CEO DeanHatton and chairman and CFO Mark Volcheck. Higher Onealso boasts a notable private equity backer, LightyearCapital, founded by Donald Marron, a key architect behindbuilding PaineWebber and its eventual sale to UBS in2000. Lightyear’s other notable portfolio firms includeCollegiate Funding Services, a firm providing student loansthat was sold to J.P. Morgan Chase for about $660 millionin 2006. From a stewardship perspective, we have a slight
© 2010 Morningstar. All Rights Reserved. Unless otherwise provided in a separate agreement, you may use this report only in the country in which its original distributor is based. Data as originally reported.The information contained herein is not represented or warranted to be accurate, correct, complete, or timely. This report is for information purposes only, and should not be considered a solicitation to buy or sell any security.Redistribution is prohibited without written permission. To order reprints, call +1 312-696-6100. To license the research, call +1 312-696-6869.
ß ®
SAMPLE

Higher One Holdings, Inc. ONE [NYSE] | QQQ
TM
Last Price Fair Value Consider Buy Consider Sell Uncertainty Economic Moat Stewardship Morningstar Credit Rating Industry19.71 USD 25.00 USD 12.50 USD 50.00 USD High None C Business Services .
issue with Volcheck serving as both chairman and CFO, asthat could limit board independence. Overall executivecash compensation looks reasonable, with no seniorofficer making a salary above $300,000 and a 2009executive bonus pool of $1.4 million. Management has anincentive to sell the firm down the road, with severalexecutives likely to receive a $2 million payout upon atakeover.
© 2010 Morningstar. All Rights Reserved. Unless otherwise provided in a separate agreement, you may use this report only in the country in which its original distributor is based. Data as originally reported.The information contained herein is not represented or warranted to be accurate, correct, complete, or timely. This report is for information purposes only, and should not be considered a solicitation to buy or sell any security.Redistribution is prohibited without written permission. To order reprints, call +1 312-696-6100. To license the research, call +1 312-696-6869.
ß ®
Disclaimers & DisclosuresNo Morningstar employees are officers or directors of this company. Morningstar Inc. does not own more than 1% of the shares of this company. Analystscovering this company do not own its stock. The information contained herein is not represented or warranted to be accurate, correct, complete, or timely.This report is for information purposes only, and should not be considered a solicitation to buy or sell any security.
SAMPLE
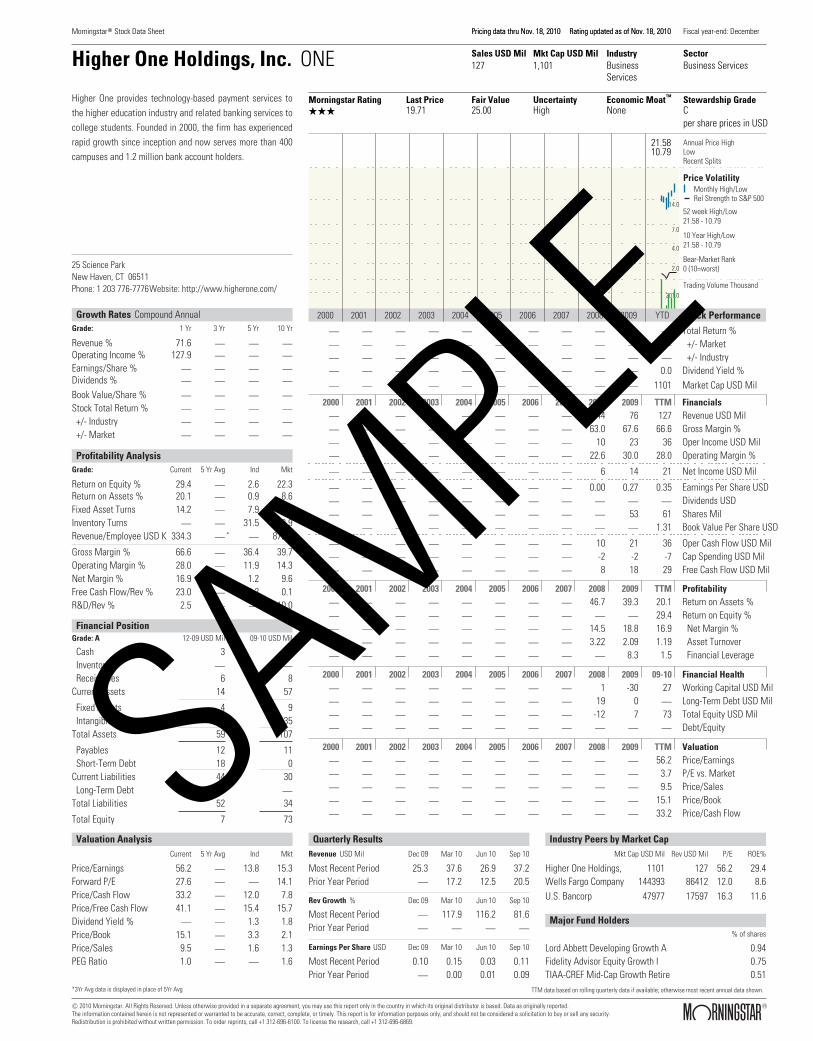
®Morningstar Stock Data Sheet Pricing data thru Nov. 18, 2010 Rating updated as of Nov. 18, 2010Pricing data thru Nov. 18, 2010 Rating updated as of Nov. 18, 2010 Fiscal year-end: December
Higher One Holdings, Inc. ONE Sales USD Mil Mkt Cap USD Mil Industry Sector127 1,101 Business
Services Business Services
TMMorningstar Rating Last Price Fair Value Uncertainty Economic Moat Stewardship GradeQQQ 19.71 25.00 High None C
per share prices in USD
2000 2001 2002 2003 2004 2005 2006 2007 2008 2009 YTD
2.0
4.0
7.0
14.0
201.0
21.5810.79
Annual Price HighLowRecent Splits
Price VolatilityMonthly High/LowRel Strength to S&P 500
52 week High/Low21.58 - 10.79
10 Year High/Low21.58 - 10.79
Bear-Market Rank0 (10=worst)
Trading Volume Thousand
Stock Performance
Higher One provides technology-based payment services to
the higher education industry and related banking services to
college students. Founded in 2000, the firm has experienced
rapid growth since inception and now serves more than 400
campuses and 1.2 million bank account holders.
25 Science Park New Haven, CT 06511Phone: 1 203 776-7776Website: http://www.higherone.com/
Growth Rates Compound AnnualGrade: 1 Yr 3 Yr 5 Yr 10 Yr
Revenue % 71.6 . . .Operating Income % 127.9 . . .
Earnings/Share % . . . .Dividends % . . . .
Book Value/Share % . . . .
Stock Total Return % . . . .
+/- Industry . . . .
+/- Market . . . .
Profitability AnalysisGrade: Current 5 Yr Avg Ind Mkt
Return on Equity % 29.4 . 2.6 22.3Return on Assets % 20.1 . 0.9 8.6Fixed Asset Turns 14.2 . 7.9 7.1Inventory Turns . . 31.5 13.9Revenue/Employee USD K 334.3 . . 872.1
Gross Margin % 66.6 . 36.4 39.7Operating Margin % 28.0 . 11.9 14.3Net Margin % 16.9 . 1.2 9.6Free Cash Flow/Rev % 23.0 . 10.2 0.1R&D/Rev % 2.5 . . 10.0
*
*3Yr Avg data is displayed in place of 5Yr Avg
Financial PositionGrade: A 12-09 USD Mil 09-10 USD Mil
Cash 3 22Inventories . .
Receivables 6 8Current Assets 14 57
Fixed Assets 4 9Intangibles 37 35
Total Assets 59 107
Payables 12 11Short-Term Debt 18 0
Current Liabilities 44 30Long-Term Debt 0 .
Total Liabilities 52 34
Total Equity 7 73
2000 2001 2002 2003 2004 2005 2006 2007 2008 2009 TTM FinancialsRevenue USD Mil. . . . . . . . 44 76 127Gross Margin %. . . . . . . . 63.0 67.6 66.6Oper Income USD Mil. . . . . . . . 10 23 36Operating Margin %. . . . . . . . 22.6 30.0 28.0
Net Income USD Mil. . . . . . . . 6 14 21
Earnings Per Share USD. . . . . . . . 0.00 0.27 0.35Dividends USD. . . . . . . . . . .
Shares Mil. . . . . . . . . 53 61Book Value Per Share USD. . . . . . . . . . 1.31
Oper Cash Flow USD Mil. . . . . . . . 10 21 36Cap Spending USD Mil. . . . . . . . -2 -2 -7Free Cash Flow USD Mil. . . . . . . . 8 18 29
Valuation AnalysisCurrent 5 Yr Avg Ind Mkt
Price/Earnings 56.2 . 13.8 15.3Forward P/E 27.6 . . 14.1Price/Cash Flow 33.2 . 12.0 7.8Price/Free Cash Flow 41.1 . 15.4 15.7Dividend Yield % . . 1.3 1.8Price/Book 15.1 . 3.3 2.1Price/Sales 9.5 . 1.6 1.3PEG Ratio 1.0 . . 1.6
Total Return %. . . . . . . . . . .
+/- Market. . . . . . . . . . .
+/- Industry. . . . . . . . . . .
Dividend Yield %. . . . . . . . . . 0.0
Market Cap USD Mil. . . . . . . . . . 1101
2000 2001 2002 2003 2004 2005 2006 2007 2008 2009 TTM ProfitabilityReturn on Assets %. . . . . . . . 46.7 39.3 20.1Return on Equity %. . . . . . . . . . 29.4
Net Margin %. . . . . . . . 14.5 18.8 16.9Asset Turnover. . . . . . . . 3.22 2.09 1.19Financial Leverage. . . . . . . . . 8.3 1.5
2000 2001 2002 2003 2004 2005 2006 2007 2008 2009 09-10 Financial HealthWorking Capital USD Mil. . . . . . . . 1 -30 27Long-Term Debt USD Mil. . . . . . . . 19 0 .
Total Equity USD Mil. . . . . . . . -12 7 73Debt/Equity. . . . . . . . . . .
2000 2001 2002 2003 2004 2005 2006 2007 2008 2009 TTM ValuationPrice/Earnings. . . . . . . . . . 56.2P/E vs. Market. . . . . . . . . . 3.7Price/Sales. . . . . . . . . . 9.5Price/Book. . . . . . . . . . 15.1Price/Cash Flow. . . . . . . . . . 33.2
Quarterly ResultsRevenue
Rev Growth
Earnings Per Share
USD Mil Dec 09 Mar 10 Jun 10 Sep 10
% Dec 09 Mar 10 Jun 10 Sep 10
USD Dec 09 Mar 10 Jun 10 Sep 10
Most Recent Period 25.3 37.6 26.9 37.2Prior Year Period . 17.2 12.5 20.5
Most Recent Period . 117.9 116.2 81.6Prior Year Period . . . .
Most Recent Period 0.10 0.15 0.03 0.11Prior Year Period . 0.00 0.01 0.09
Industry Peers by Market Cap
Major Fund Holders
Mkt Cap USD Mil Rev USD Mil P/E ROE%
% of shares
Higher One Holdings, 1101 127 56.2 29.4Wells Fargo Company 144393 86412 12.0 8.6
U.S. Bancorp 47977 17597 16.3 11.6
Lord Abbett Developing Growth A 0.94Fidelity Advisor Equity Growth I 0.75TIAA-CREF Mid-Cap Growth Retire 0.51
TTM data based on rolling quarterly data if available; otherwise most recent annual data shown.
© 2010 Morningstar. All Rights Reserved. Unless otherwise provided in a separate agreement, you may use this report only in the country in which its original distributor is based. Data as originally reported. The information contained herein is not represented or warranted to be accurate, correct, complete, or timely. This report is for information purposes only, and should not be considered a solicitation to buy or sell any security. Redistribution is prohibited without written permission. To order reprints, call +1 312-696-6100. To license the research, call +1 312-696-6869.
ß ®
SAMPLE

Morningstar’s Approach to Rating Stocks
Our Key Investing ConceptsEconomic Moat RatingDiscounted Cash FlowDiscount RateFair ValueUncertaintyMargin of SafetyConsider Buying/Consider SellingStewardship Grades
TMAt Morningstar, we evaluate stocks as pieces of abusiness, not as pieces of paper. We think that purchasingshares of superior businesses at discounts to theirintrinsic value and allowing them to compound their valueover long periods of time is the surest way to createwealth in the stock market. We rate stocks 1 through 5 stars, with 5 the best and 1the worst. Our star rating is based on our analyst’sestimate of how much a company’s business is worth pershare. Our analysts arrive at this "fair value estimate" byforecasting how much excess cash--or "free cashflow"--the firm will generate in the future, and thenadjusting the total for timing and risk. Cash generatednext year is worth more than cash generated several yearsdown the road, and cash from a stable and consistentlyprofitable business is worth more than cash from acyclical or unsteady business. Stocks trading at meaningful discounts to our fair valueestimates will receive high star ratings. For high-qualitybusinesses, we require a smaller discount than formediocre ones, for a simple reason: We have moreconfidence in our cash-flow forecasts for strongcompanies, and thus in our value estimates. If a stock’smarket price is significantly above our fair value estimate,it will receive a low star rating, no matter how wonderfulwe think the business is. Even the best company is a baddeal if an investor overpays for its shares. Our fair value estimates don’t change very often, butmarket prices do. So, a stock may gain or lose stars based
just on movement in the share price. If we think a stock’sfair value is $50, and the shares decline to $40 withoutmuch change in the value of the business, the star ratingwill go up. Our estimate of what the business is worthhasn’t changed, but the shares are more attractive as aninvestment at $40 than they were at $50. Because we focus on the long-term value of businesses,rather than short-term movements in stock prices, at timeswe may appear out of step with the overall stock market.When stocks are high, relatively few will receive ourhighest rating of 5 stars. But when the market tumbles,many more will likely garner 5 stars. Although you mightexpect to see more 5-star stocks as the market rises, wefind assets more attractive when they’re cheap. We calculate our star ratings nightly after the marketsclose, and issue them the following business day, which iswhy the rating date on our reports will always be theprevious business day. We update the text of our reportsas new information becomes available, usually about onceor twice per quarter. That is why you’ll see two dates onevery Morningstar stock report. Of course, we monitormarket events and all of our stocks every business day, soour ratings always reflect our analyst’s current opinion. Economic Moat Rating The Economic Moat Rating is our assessment of a firm’sability to earn returns consistently above its cost of capitalin the future, usually by virtue of some competitiveadvantage. Competition tends to drive down such
TM
TM
Morningstar ResearchMethodology for ValuingCompanies QQQQQ
Competitive Economic Company Fair Value UncertaintyAnalysis Moat Rating Valuation Estimate Assessment
TM
Analyst conducts The depth of the Analyst considers DCF model leads to An uncertaintycompany and industry firm’s competitive company financial the firm’s Fair Value assessmentresearch: advantage is rated: statements and Estimate, which establishes the competitive position anchors the rating margin ofManagement None to forecast future framework. safety required forinterviews Narrow cash flows. the stock rating.Conference calls Wide Trade-show visits Assumptions areCompetitor, supplier, input into a dis-distributor, and counted cash-flowcustomer interviews model.
The current stockprice relative to fairvalue, adjustedfor uncertainty,determines therating.
Q
QQQ
QQQQ
QQQQQ
© 2010 Morningstar. All Rights Reserved. Unless otherwise provided in a separate agreement, you may use this report only in the country in which its original distributor is based. Data as originally reported.The information contained herein is not represented or warranted to be accurate, correct, complete, or timely. This report is for information purposes only, and should not be considered a solicitation to buy or sell any security.Redistribution is prohibited without written permission. To order reprints, call +1 312-696-6100. To license the research, call +1 312-696-6869.
ß ®
SAMPLE
Morningstar’s Approach to Rating Stocks (continued)
economic profits, but companies that can earn them for anextended time by creating a competitive advantagepossess an Economic Moat. We see these companies assuperior investments. Discounted Cash Flow This is a method for valuing companies that involvesprojecting the amount of cash a business will generate inthe future, subtracting the amount of cash that thecompany will need to reinvest in its business, and usingthe result to calculate the worth of the firm. We use thistechnique to value nearly all of the companies we cover. Discount Rate We use this number to adjust the value of our forecastedcash flows for the risk that they may not materialize. For aprofitable company in a steady line of business, we’ll usea lower discount rate, also known as "cost of capital,"than for a firm in a cyclical business with fiercecompetition, since there’s less risk clouding the firm’sfuture. Fair Value This is the output of our discounted cash-flow valuationmodels, and is our per-share estimate of a company’sintrinsic worth. We adjust our fair values for off-balancesheet liabilities or assets that a firm might have--forexample, we deduct from a company’s fair value if it hasissued a lot of stock options or has an under-fundedpension plan. Our fair value estimate differs from a "targetprice" in two ways. First, it’s an estimate of what thebusiness is worth, whereas a price target typically reflectswhat other investors may pay for the stock. Second, it’s along-term estimate, whereas price targets generally focuson the next two to 12 months. Uncertainty To generate the Morningstar Uncertainty Rating, analystsconsider factors such as sales predictability, operatingleverage, and financial leverage. Analysts then classifytheir ability to bound the fair value estimate for the stockinto one of several uncertainty levels: Low, Medium, High,
Very High, or Extreme. The greater the level of uncertainty,the greater the discount to fair value required before astock can earn 5 stars, and the greater the premium to fairvalue before a stock earns a 1-star rating. Margin of Safety This is the discount to fair value we would require beforerecommending a stock. We think it’s always prudent tobuy stocks for less than they’re worth.The margin of safetyis like an insurance policy that protects investors from badnews or overly optimistic fair value estimates. We requirelarger margins of safety for less predictable stocks, andsmaller margins of safety for more predictable stocks. Consider Buying/Consider Selling The consider buying price is the price at which a stockwould be rated 5 stars, and thus the point at which wewould consider the stock an extremely attractivepurchase. Conversely, consider selling is the price atwhich a stock would have a 1 star rating, at which pointwe’d consider the stock overvalued, with low expectedreturns relative to its risk. Stewardship Grades We evaluate the commitment to shareholdersdemonstrated by each firm’s board and management teamby assessing transparency, shareholder friendliness,incentives, and ownership. We aim to identify firms thatprovide investors with insufficient or potentiallymisleading financial information, seek to limit the powerof minority shareholders, allow management to abuse itsposition, or which have management incentives that arenot aligned with the interests of long-term shareholders.The grades are assigned on an absolute scale--not relativeto peers--and can be interpreted as follows: A means"Excellent," B means "Good," C means "Fair," D means"Poor," and F means "Very Poor."
© 2010 Morningstar. All Rights Reserved. Unless otherwise provided in a separate agreement, you may use this report only in the country in which its original distributor is based. Data as originally reported.The information contained herein is not represented or warranted to be accurate, correct, complete, or timely. This report is for information purposes only, and should not be considered a solicitation to buy or sell any security.Redistribution is prohibited without written permission. To order reprints, call +1 312-696-6100. To license the research, call +1 312-696-6869.
ß ®
SAMPLE

Morningstar’s Approach to Analyzing Initial Public Offerings (IPOs)
At Morningstar, we evaluate IPOs in much the same wayas the stocks of established companies we cover. Weemploy the same rigorous industry analysis, fundamentalresearch, and discounted cash-flow valuation to determinewhat the business is worth. With stocks new to themarket, however, we take several additionalconsiderations into account. IPO Motivation First, we ask why the company is selling shares to thepublic. Is it growing quickly and needs capital to expand?Has it been around for decades in an industry that iscurrently hot, and looking to sell shares while they fetch ahigh price? Are the company’s founders selling theirinterest to cash in on their life’s work? Answers to thesequestions can have a large impact on the market for anIPO and may influence elements of our investment thesis. Supply and Demand We also investigate likely demand. The quality andprofitability of the underlying business, the prospects ofthe company’s industry, and market participants’ appetitefor IPO shares all can influence demand. Demand in the IPO market waxes and wanes withinvestors’ sentiment and appetite for risk. We view thisfluctuation as a source of opportunity. For example,companies that need capital but don’t happen to be in atrendy sector can make for attractive investmentopportunities. Additionally, stocks that arrive with greatfanfare (often at a steep offering price) occasionallyreward the patient investor who waits for the initialexcitement to pass and the share price to dip. Caution is always warranted when assessing IPOs. AsWarren Buffett once pointed out, "It’s almost amathematical impossibility that, out of the thousands ofthings for sale on a given day, the most attractively pricedis the one being sold by a knowledgeable seller." That’swhy we employ our traditional analysis, including anassessment of economic moat, business risk, and requiredmargin of safety, as well as IPO-specific research to digthrough the chatter and establish a reasonable fair valueestimate.
IPO Specific Terms and Data points Offer Date: This is the day the company expects the IPO to
occur, and it is subject to change. If the IPO has alreadyoccurred, this was the first day the shares were traded bythe public. Offer Price: The price at which the company initially sells its
shares to investors. Traditionally, the company’sunderwriters (see below) accompany management on aroad show across the country--and sometimesoverseas--to talk about the company and determine largeinvestors’ interest in buying the stock. The level of interestexpressed by these investors determines at what priceand in what amount the shares are offered. Price Range: Prior to the offering, the company and its
underwriters estimate a price range within which theyanticipate the shares may initially trade. After the IPO,comparing the anticipated price range (and the quantity ofshares offered) with the final offer price and the numberof shares floated can shed light on how warmly investorsreceived the shares. Underwriters: Usually, Wall Street brokerage firms shepherd
the company through the IPO process. They perform suchtasks as evaluating the company’s prospects andmarketability, writing IPO documents, hiring lawyers,conducting the road show, and distributing the stock toinvestors. They also perform important functions after theIPO such as trading the company’s stock and publishingresearch. Shares Offered: The number of shares sold by the company
to the public. Shares Outstanding: The total number of shares of the
company. Existing shareholders may want to maintainmajority ownership and to only sell a portion of the firm. Lockup Period: During the lock-up period, certain existing
shareholders cannot sell their shares. The amount ofshares subject to lockup and the date the lockup expires isimportant because the stock price can fall dramatically ifinsiders sell a large portion of their shares simultaneously.
© 2010 Morningstar. All Rights Reserved. Unless otherwise provided in a separate agreement, you may use this report only in the country in which its original distributor is based. Data as originally reported.The information contained herein is not represented or warranted to be accurate, correct, complete, or timely. This report is for information purposes only, and should not be considered a solicitation to buy or sell any security.Redistribution is prohibited without written permission. To order reprints, call +1 312-696-6100. To license the research, call +1 312-696-6869.
ß ®
SAMPLE

®Morningstar Stock Data Sheet Pricing data thru Jan. 18, 2011 Rating updated as of Jan. 18, 2011Pricing data thru Jan. 18, 2011 Rating updated as of Jan. 18, 2011 Fiscal year-end: June
Microsoft Corporation MSFT Sales USD Mil Mkt Cap USD Mil Industry Sector65,759 245,201 Software
- Infrastructure Software
TMMorningstar Rating Last Price Fair Value Uncertainty Economic Moat Stewardship GradeQQQ 28.66 32.00 Medium Wide A
per share prices in USD
2001 2002 2003 2004 2005 2006 2007 2008 2009 2010 YTD
2.0
5.0
9.0
19.0
29.0
69.0
38.0821.44
35.3120.70
30.0022.55
30.2024.01
28.2523.82
30.2621.46
37.5026.60
35.9617.50
31.5014.87
31.5822.73
28.8527.77
Annual Price HighLowRecent Splits
Price VolatilityMonthly High/LowRel Strength to S&P 500
52 week High/Low31.58 - 22.73
10 Year High/Low38.08 - 14.87
Bear-Market Rank4 (10=worst)
Trading Volume Million
Stock Performance
2:1
Microsoft develops the Windows operating system and the
Office suite of productivity software. Windows and Office
account for roughly 56% of Microsoft’s revenue, with
another 24% coming from software for enterprise servers.
The firm’s other businesses include the Xbox 360 video game
console, Bing Internet search, business software, and
software for mobile devices.
One Microsoft Way Redmond, WA 98052Phone: 1 425 882-8080Website: http://www.microsoft.com
Growth Rates Compound AnnualGrade: B 1 Yr 3 Yr 5 Yr 10 Yr
Revenue % 6.9 6.9 9.4 10.5Operating Income % 18.3 9.2 10.6 8.1Earnings/Share % 29.6 13.9 13.4 9.5Dividends % 4.0 10.1 10.2 .
Book Value/Share % 20.0 17.1 3.6 3.1Stock Total Return % -5.3 -2.9 2.9 4.6+/- Industry -15.3 -6.0 -5.1 1.2+/- Market -19.3 -2.1 2.6 5.1
Profitability AnalysisGrade: A Current 5 Yr Avg Ind Mkt
Return on Equity % 46.7 40.5 11.3 21.9Return on Assets % 23.8 21.5 5.8 8.5Fixed Asset Turns 8.6 11.7 9.2 7.2Inventory Turns 10.6 11.7 17.6 14.0Revenue/Employee USD K 738.9 664.8 . 886.1
Gross Margin % 80.7 80.4 77.2 39.4Operating Margin % 40.7 36.8 33.2 14.3Net Margin % 31.3 28.0 9.3 9.5Free Cash Flow/Rev % 36.6 30.5 29.0 0.1R&D/Rev % 13.4 0.1 . 9.9
*
*3Yr Avg data is displayed in place of 5Yr Avg
Financial PositionGrade: A 06-10 USD Mil 09-10 USD Mil
Cash 5505 8161Inventories 740 1242Receivables 13014 9646
Current Assets 55676 59581
Fixed Assets 7630 7771Intangibles 13552 13548
Total Assets 86113 91540
Payables 5281 6699Short-Term Debt 1000 1000
Current Liabilities 26147 25857Long-Term Debt 4939 9665
Total Liabilities 39938 44598
Total Equity 46175 46942
2001 2002 2003 2004 2005 2006 2007 2008 2009 2010 TTM FinancialsRevenue USD Mil25296 28365 32187 36835 39788 44282 51122 60420 58437 62484 65759Gross Margin %86.3 81.7 82.3 81.8 84.4 82.7 79.1 80.8 79.2 80.2 80.7Oper Income USD Mil11720 11910 13217 9034 14561 16472 18524 22492 20363 24098 26732Operating Margin %46.3 42.0 41.1 24.5 36.6 37.2 36.2 37.2 34.8 38.6 40.7
Net Income USD Mil7346 7829 9993 8168 12254 12599 14065 17681 14569 18760 20596
Earnings Per Share USD0.66 0.71 0.92 0.75 1.12 1.20 1.42 1.87 1.62 2.10 2.33Dividends USD. . 0.08 0.16 0.32 0.34 0.39 0.43 0.50 0.52 0.52Shares Mil11148 11106 10882 10894 10906 10531 9886 9470 8996 8927 8855Book Value Per Share USD4.79 5.22 6.41 4.34 4.15 3.73 3.68 3.88 5.03 5.49 5.49
Oper Cash Flow USD Mil13422 14509 15797 14626 16605 14404 17796 21612 19037 24073 26160Cap Spending USD Mil-1103 -770 -891 -1109 -812 -1578 -2264 -3182 -3119 -1977 -2106Free Cash Flow USD Mil12319 13739 14906 13517 15793 12826 15532 18430 15918 22096 24054
Valuation AnalysisCurrent 5 Yr Avg Ind Mkt
Price/Earnings 12.3 17.0 18.6 16.3Forward P/E 10.6 . . 15.3Price/Cash Flow 9.7 13.8 14.5 8.5Price/Free Cash Flow 10.6 15.8 15.7 17.0Dividend Yield % 1.9 . 1.1 1.7Price/Book 5.2 6.8 5.0 2.3Price/Sales 3.9 4.8 4.5 1.4PEG Ratio 1.0 . . 1.7
Total Return %52.8 -22.0 6.8 9.2 -0.9 15.6 20.6 -44.1 59.5 -6.6 2.7+/- Market65.8 1.4 -19.6 0.2 -3.9 2.0 17.1 -5.6 36.1 -19.4 -0.3+/- Industry44.3 2.1 -6.6 1.4 1.9 -0.7 -5.8 -4.3 7.2 -16.3 0.3
Dividend Yield %. . 0.6 0.6 1.2 1.2 1.1 2.4 1.7 2.0 1.9
Market Cap USD Mil356914 276631 295937 290720 278358 293538 333054 172930 268559 238785 245201
2001 2002 2003 2004 2005 2006 2007 2008 2009 2010 TTM ProfitabilityReturn on Assets %13.2 12.3 13.6 9.5 15.0 17.9 21.2 26.0 19.3 22.9 23.8Return on Equity %16.6 15.7 17.7 12.0 19.9 28.6 39.5 52.5 38.4 43.8 46.7
Net Margin %29.0 27.6 31.0 22.2 30.8 28.5 27.5 29.3 24.9 30.0 31.3Asset Turnover0.45 0.45 0.44 0.43 0.49 0.63 0.77 0.89 0.78 0.76 0.76Financial Leverage1.3 1.3 1.3 1.2 1.5 1.7 2.0 2.0 2.0 1.9 2.0
2001 2002 2003 2004 2005 2006 2007 2008 2009 2010 09-10 Financial HealthWorking Capital USD Mil28505 35832 44999 55597 31860 26568 16414 13356 22246 29529 33724Long-Term Debt USD Mil. . . . . . . . 3746 4939 9665Total Equity USD Mil47289 52180 61020 74825 48115 40104 31097 36286 39558 46175 46942Debt/Equity. . . . . . . . 0.09 0.11 0.21
2001 2002 2003 2004 2005 2006 2007 2008 2009 2010 TTM ValuationPrice/Earnings60.6 29.8 29.1 29.1 21.6 25.5 20.2 10.4 16.8 12.0 12.3P/E vs. Market. . . . . . . . . 0.7 0.8Price/Sales13.7 9.2 8.7 7.6 6.9 6.7 5.9 2.9 4.7 3.8 3.9Price/Book6.9 5.0 4.3 6.2 6.3 8.0 9.7 5.0 6.1 5.1 5.2Price/Cash Flow25.4 17.2 20.0 20.4 18.3 22.1 15.5 8.8 13.0 9.4 9.7
Quarterly ResultsRevenue
Rev Growth
Earnings Per Share
USD Mil Dec 09 Mar 10 Jun 10 Sep 10
% Dec 09 Mar 10 Jun 10 Sep 10
USD Dec 09 Mar 10 Jun 10 Sep 10
Most Recent Period 19022.0 14503.0 16039.0 16195.0Prior Year Period 16629.0 13648.0 13099.0 12920.0
Most Recent Period 14.4 6.3 22.4 25.4Prior Year Period 1.6 -5.6 -17.3 -14.2
Most Recent Period 0.74 0.45 0.51 0.62Prior Year Period 0.47 0.33 0.34 0.40
Industry Peers by Market Cap
Major Fund Holders
Mkt Cap USD Mil Rev USD Mil P/E ROE%
% of shares
Microsoft Corporatio 245201 65759 12.3 46.7Apple, Inc. 312481 65225 22.5 35.3
Google, Inc. 204538 27555 31.6 20.6
American Funds Growth Fund of Amer A 1.78American Funds Invmt Co of Amer A 1.01American Funds Capital World G/I A 1.01
TTM data based on rolling quarterly data if available; otherwise most recent annual data shown.
© 2011 Morningstar. All Rights Reserved. Unless otherwise provided in a separate agreement, you may use this report only in the country in which its original distributor is based. Data as originally reported. The information contained herein is not represented or warranted to be accurate, correct, complete, or timely. This report is for information purposes only, and should not be considered a solicitation to buy or sell any security. Redistribution is prohibited without written permission. To order reprints, call +1 312-696-6100. To license the research, call +1 312-696-6869.
ß ®
SAMPLE