Embed Size (px)
Citation preview

AF-SJ-08-2
UNIVERSITY OF CALIFORNIA COOPERATIVE EXTENSION
2008
SAMPLE COSTS TO ESTABLISH AND PRODUCE
ALFALFA
SAN JOAQUIN VALLEY
300 Acre Planting
Shannon C. Mueller UC Cooperative Extension Farm Advisor, Fresno County Carol A. Frate UC Cooperative Extension Farm Advisor, Tulare County Mick Canevari UC Cooperative Extension Farm Advisor, San Joaquin County Marsha Campbell-Mathews UC Cooperative Extension Farm Advisor, Stanislaus County Karen M. Klonsky UC Cooperative Extension Specialist, Department of Agricultural and Resource
Economics, UC Davis Richard L. De Moura Staff Research Associate, Department of Agricultural and Resource Economics,
UC Davis

2008 Alfalfa Costs and Returns Study (300 acres) San Joaquin Valley UC Cooperative Extension 2
UNIVERSITY OF CALIFORNIA COOPERATIVE EXTENSION
SAMPLE COSTS TO ESTABLISH AND PRODUCE ALFALFA
300 acres San Joaquin Valley 2008
STUDY CONTENTS
INTRODUCTION…...........................................................................................……………………................... 2 ASSUMPTIONS. …............................................................................................................................................. 3 Stand Establishment Operating Costs................................................................................................................... 3 Production Operating Costs......…….................................................................................................................... 4 Labor, Equipment & Interest............................................................................................................................ 5 Cash Overhead ………......................................................................................................................................... 6 Non-Cash Overhead …........................................................................................................................ ................ 7 REFERENCES ………....................................................................................................................... ................... 9 Table 1. COSTS PER ACRE to ESTABLISH ALFALFA….............................................................................. 10 Table 2. MATERIAL and INPUT COSTS to ESTABLISH ALFALFA............................................................. 11 Table 3. WHOLE FARM ANNUAL EQUIPMENT COST FOR ESTABLISHMENT YEAR ......................... 11 Table 4. COSTS PER ACRE to PRODUCE ALFALFA..................................................................................... 12 Table 5. COSTS AND RETURNS PER ACRE to PRODUCE ALFALFA ....................................................... 13 Table 6. MONTHLY CASH COSTS PER ACRE to PRODUCE ALFALFA ................................. .................. 14 Table 7. RANGING ANALYSIS..................................................................................................................... 15 Table 8. WHOLE FARM ANNUAL EQUIPMENT, INVESTMENT and OVERHEAD COSTS. ................... 17 Table 9. HOURLY EQUIPMENT COSTS …………………………………………………............................. 17 Table 10. GROWER COSTS PER ACRE TO HARVEST ALFALFA HAY ................................................... 18 Table 11. OPERATIONS WITH EQUIPMENT .............................................................................................. 19
INTRODUCTION Sample costs to establish an alfalfa stand and produce alfalfa in the San Joaquin Valley are shown in this study. The study is intended as a guide only, and can be used to make production decisions, determine potential returns, prepare budgets and evaluate production loans. Practices described are based on the production practices considered typical for this crop and region, but will not apply to every farm situation. Sample costs for labor, materials, equipment and custom services are based on current figures. “Your Costs” columns in Tables 1, 2, 4 and 5 are provided for entering your farm costs. The hypothetical farm operations, production practices, overhead, and calculations are described under the assumptions. For additional information or an explanation of the calculations used in the study call the Department of Agricultural and Resource Economics, University of California, Davis, California, (530) 752-3589 or the local UC Cooperative Extension office. Sample Cost of Production Studies for many commodities are available and can be requested through the Department of Agricultural and Resource Economics, UC Davis, (530) 752-3589. Current studies can be downloaded from the department website http://coststudies.ucdavis.edu or obtained from the local county UC Cooperative Extension offices. Some archived studies are also available on the website.
The University of California does not discriminate in any of its policies, procedures or practices. The university is an affirmative action/equal opportunity employer.
2008 Alfalfa Costs and Returns Study (300 acres) San Joaquin Valley UC Cooperative Extension 3
ASSUMPTIONS
The assumptions refer to Tables 1 through 11 and pertain to sample costs to establish an alfalfa stand, and produce alfalfa hay and haylage in the San Joaquin Valley. Practices described represent production practices and materials considered typical of a well-managed alfalfa stand in the San Joaquin Valley. Costs, materials, and practices in this study will not be applicable to all situations. Establishment and cultural practices vary among growers within the region. The use of trade names and cultural practices in this report does not constitute an endorsement or recommendation by the University of California nor is any criticism implied by omission of other similar products or cultural practices. Farm. The hypothetical farm consists of 1,200 non-contiguous acres of field and row crops of which 300 acres are alfalfa and the remaining 900 acres are planted to other crops such as cotton, corn, grains, processing tomatoes, and dry beans. It is assumed that a portion of the alfalfa is planted in a quarter section (160 acres). The farm is owned and operated by the grower.
Stand Establishment Operating Costs
(Tables 1-3)
Tables 1 through 3 show the costs associated with ground preparation, planting and establishing an alfalfa stand. Land preparation and planting are done in the fall. The establishment year ends after the herbicide application in December. Land Preparation. Stand establishment begins by discing down (stubble disc) the residue from the previous crop. The ground is chiseled to a depth of 18 to 24 inches to fracture the soil, which improves root penetration and water infiltration. The fields are laser leveled by a custom operator. Borders (levees) for irrigation checks are made at periodic intervals (60 feet in this study) through the field. The fields are then disced and harrowed to prepare the seedbed. Planting. Alfalfa seed is planted with a Brillion seeder 1/4 inch to 1/2 inch deep at 25 to 30 pounds of seed per acre. The seed is planted in September and the stand life is expected to be three years. Fertilization. Nitrogen (N) and phosphorus (P) as 11-52-0 at 300 pounds per acre of material are applied by a custom operator in September prior to the final discing. The fertilizer application in this study is assumed to be sufficient for 2 years; therefore one-half of the cost is allocated to the establishment year and one-half to the first production year. Preplant soil testing for phosphorous (P) and potassium (K) is recommended. In this study, the PCA collects one soil sample per 20 acres and the cost shown in Table 1 is the analysis or lab fee. Irrigation. Water for seed germination is applied immediately after planting (8 acre-inches). If winter rains do not occur, a second irrigation in October or early November may be necessary. Water is supplied by an irrigation district, although some growers may use or supplement with well water. Water prices vary among irrigation districts. The authors agreed that $36 per acre-foot is a fair value for this study, based upon information from their respective counties. Pest Management. For pest identification, monitoring, management and pesticide information, visit the UC IPM website at www.ipm.ucdavis.edu. Written recommendations are required for many pesticides, and are available from licensed pest control advisers. For information on pesticide use permits, contact the local county Agricultural Commissioner’s office.

2008 Alfalfa Costs and Returns Study (300 acres) San Joaquin Valley UC Cooperative Extension 4
Weeds. Post-emergent herbicides (Raptor) and 2,4-DB herbicide (Butyrac) are applied in December for broadleaf weed and grass control. A custom applicator applies the herbicides.
Overhead Costs. One-half of the cash and non-cash overhead establishment year costs for the 300 acres are allocated to the previous crop.
Production Operating Costs
(Tables 4-11)
Irrigation. Irrigation includes the water cost and labor expense. From April to October, ten irrigations totaling 4.5 acre-feet of water are applied by flooding the checks. The actual water requirement will vary each year based on soil, climatic, and plant physiological factors. Water is pumped through alfalfa valves at the head of the field and flows down the alfalfa check between the borders. A semi-permanent drain ditch is made at the end of the field. All field operations turn inside the field and do not cross the drain. Water costs will vary considerably depending upon the irrigation district. A cost of $3 per acre inch ($36 per acre foot) is used in this study.
Fertilization. Once the stand is established, plant tissue tests should be taken to determine nutrient requirements. Tissue testing in this study is done each year to determine the levels of P and K. Costs shown are for the analysis based on one sample per 20 acres collected by the PCA. Tissue samples should be scheduled once during the growing season and your ag consultant (PCA) may recommend this be done either in the spring or fall. Being fertilizer is applied in the establishment year and/or every two to three years, in this study, an allocation of phosphorous as 11-52-0, at 75 pounds per acre in charged to the field each year. The fertilizer is applied in November. Pest Management. The pesticides, rates, and application practices mentioned in this cost study are listed in the UC IPM Pest Management Guidelines – Alfalfa. Pesticides mentioned in this study are not recommendations, but those commonly used in the region. For information and pesticide use permits, contact the local county Agricultural Commissioner’s office. For information on other pesticides available, pest identification, monitoring, and management, visit the UC IPM website at www.ipm.ucdavis.edu. Pest control costs can vary considerably each year depending upon local conditions and pest populations in any given year. Adjuvants are recommended for many pesticides for effective control and are an added cost.
Pest Control Adviser (PCA). Written recommendations are required for many pesticides and are
available from licensed pest control advisers. In addition the PCA or an independent consultant will monitor the field for agronomic problems including irrigation and nutrition. Growers may hire private PCAs or receive the service as part of a service agreement with an agricultural chemical and fertilizer company. It is assumed in this study that PCA services are provided by the chemical and fertilizer company.
Weeds. During the first two years, a preemergence herbicide (Treflan TR-10) is applied in February for
grass control or in February and April if dodder is expected. Residual herbicides (Velpar and Karmex) for control of winter weeds are applied in December at the end of the first year and a contact herbicide (Gramoxone) at the end of the second year. In May of the third year, a post emergence herbicide (SelectMax) is applied to control summer grasses. The stand is removed at the end of the third production year, hence no winter herbicide application. The herbicide costs will vary slightly during the production years due to the difference each year in weed control.
Insects. Several insect species attack alfalfa, but alfalfa weevil, aphids, alfalfa caterpillar, and
armyworms are the pests that cause the most economic damage. Weevils and aphids are assumed to reach

2008 Alfalfa Costs and Returns Study (300 acres) San Joaquin Valley UC Cooperative Extension 5
population levels requiring a single treatment for control for which an insecticide (Lorsban) is applied by air in March. Worms (alfalfa caterpillar and armyworms) are controlled in July with an aerial insecticide (Lannate) application.
Harvest. In this study, the alfalfa is custom harvested for hay seven times; April, May, June, July, August, September, and October, and for haylage two times, March and November. Alfalfa for hay is cut with a self-propelled swather and left to dry for several days before it is turned and windrowed using a rake. Once the hay has dried to the correct moisture content, it is baled into 1,500-pound bales (47” W x 35” H x 98” L). The bales are picked up with a balewagon that moves them from the field and roadsides them in a stack. A conversion kit is attached to the standard balewagon to handle 1,500 pound bales. For growers using their own equipment, see Table 10. For haylage, the alfalfa is cut and wilted in the field, then chopped into a truck or trailer and taken to the dairy where it is placed in a bag, pile, or bunker for ensiling. Normally, haylage is for a dairy enterprise and is harvested by the buyer.
Custom Harvest. Some harvesting companies swath, rake, bale, and roadside (pickup bales and stack)
the harvested alfalfa for a single fee based on a one ton per acre yield. In this study, the custom harvester charges are swathing $12 per acre, raking $7 per acre, baling $17 per ton, and roadsiding $5.00 per large bale ($6.65 per ton).
Yields. The crop is assumed to yield 9.00 tons of hay per acre at 90% dry matter (DM). In this study 8 tons is harvested as hay (90% DM) and 3.03 green tons (30% DM) or 1-ton hay equivalent, is harvested as haylage. Annual yields range from 5 to 11 tons of hay per acre in this region. Returns. A price of $185 per ton for premium hay is based on USDA California 2007 averages for the San Joaquin Valley market districts. Hay prices and hay quality will vary during the season and by district. USDA alfalfa hay standards are Supreme, Premium, Good, Fair, and Utility, with Supreme garnering the highest price. The hay price in this study is based on 90% dry matter and the haylage on 30% dry matter. The haylage buyer pays a price per green ton relative to the current hay market price less harvesting costs. In this study, the haylage return equals market price less harvest cost (buyer harvests haylage) times % haylage dry matter divided by % hay dry matter. ($185-$45) X (30%DM/90%DM) = $46.67. (The common “rule of thumb” is to subtract the harvest costs from the hay market price and divide by 3). Table 7 shows grower returns based on hay yields ranging from 8 to 11 tons per acre with 87.5% of the hay yield harvested as hay and 12.5% harvested as haylage.
Pickup/ATV. The pickup and the all terrain vehicle (ATV) are used for business purposes as needed. Costs are estimated and not based on any specific data.
Labor, Equipment and Interest Labor. Labor rates of $14.28 per hour for machine operators and $10.88 for general labor includes payroll overhead of 36%. The basic hourly wages are $10.50 for machine operators and $8.00 for general labor. The overhead includes the employers’ share of federal and California state payroll taxes, workers' compensation insurance for field crops (code 0171), and a percentage for other possible benefits. Workers’ compensation costs will vary among growers, but for this study the cost is based upon the average industry final rate as of January 1, 2008 (personal email from California Department of Insurance, March 2008, unreferenced). Labor costs for operations involving machinery are 20% higher than the operation time given in Tables 1 and 4 to account for the extra labor involved in equipment set up, moving, maintenance, work breaks, and field repair.

2008 Alfalfa Costs and Returns Study (300 acres) San Joaquin Valley UC Cooperative Extension 6
Equipment Operating Costs. Repair costs are based on purchase price, annual hours of use, total hours of life, and repair coefficients formulated by the American Society of Agricultural Engineers (ASAE). Fuel and lubrication costs are also determined by ASAE equations based on maximum power takeoff (PTO) horsepower, and fuel type. Prices for on-farm delivery of diesel and gasoline are $4.05 and $3.45 per gallon, respectively. The costs are based on 2007-2008 (November to April) American Automobile Association (AAA) and Department of Energy (DOE) monthly data. The cost includes a 2% local sales tax on diesel fuel and 8% sales tax on gasoline. Gasoline also includes federal and state excise tax, which are refundable for on-farm use when filing your income tax. The fuel, lube, and repair costs per acre for each operation in Tables 1 and 4 are determined by multiplying the total hourly operating cost in Table 9 for each piece of equipment used for the selected operation by the hours per acre. Tractor time is 10% higher than implement time for a given operation to account for setup, travel and down time.
Interest on Operating Capital. Interest on operating capital is based on cash operating costs and is calculated monthly until harvest at a nominal rate of 6.75% per year. A nominal interest rate is the typical market cost of borrowed funds. The interest cost of post harvest operations is discounted back to the last harvest month using a negative interest charge. The rate will vary depending upon various factors, but the rate in this study is considered a typical lending rate by a farm lending agency as of April 2008. Risk. Production risks should not be minimized. While this study makes every effort to model a production system based on typical, real world practices, it cannot fully represent financial, agronomic and market risks, which affect the profitability and economic viability of alfalfa production.
Cash Overhead
Cash overhead consists of various cash expenses paid out during the year that are assigned to the whole farm, not to a particular operation. Employee benefits, payroll taxes and workers’ compensation insurance are included in labor costs and not under cash overhead. A portion of the overhead costs in the establishment year is allocated to the previous crop. Property Taxes. Counties charge a base property tax rate of 1% on the assessed value of the property. In some counties special assessment districts exist and charge additional taxes on property including equipment, buildings, and improvements. For this study, county taxes are calculated as 1% of the average value of the property. Average value equals new cost plus salvage value divided by 2 on a per acre basis. Insurance. Insurance for farm investments varies depending on the assets included and the amount of coverage. Property insurance provides coverage for property loss and is charged at 0.740% of the average value of the assets over their useful life. Liability insurance covers accidents on the farm and costs $1,350 for the entire farm. Office. Costs are estimated at $30 per acre for the ranch and are not based on any specific information, except that there is a cost involved for bookkeeping, payroll, tax preparation, and telephone. Investment Repairs. Annual repairs on investments or capital recovery items that require maintenance are calculated as 2% of the purchase price. Repairs are not calculated for land and establishment costs.

2008 Alfalfa Costs and Returns Study (300 acres) San Joaquin Valley UC Cooperative Extension 7
Non-Cash Overhead
Non-cash overhead is calculated as the capital recovery cost for equipment and other farm investments. A portion of the overhead costs in the establishment year are allocated to the previous crop
Capital Recovery Costs. Capital recovery cost is the annual depreciation and interest costs for a capital investment and is the amount of money required each year to recover the difference between the purchase price and salvage value (unrecovered capital). The capital recovery costs are equivalent to the annual payment on a loan for the investment with the down payment equal to the discounted salvage value. This is a more complex method of calculating ownership costs than straight-line depreciation and opportunity costs, but more accurately represents the annual costs of ownership because it takes the time value of money into account (Boehlje and Eidman). The formula for the calculation of the annual capital recovery costs is ((Purchase Price – Salvage Value) x Capital Recovery Factor) + (Salvage Value x Interest Rate).
Salvage Value. Salvage value is the estimated value of an investment at the end of its useful life. For
farm machinery the value is a percentage of the new cost of the investment (Boehlje and Eidman). The value is calculated from equations developed by ASAE based on equipment type and years of life. The life in years is estimated by dividing the wear out life, as given by ASAE, by the annual hours of use in the operation. For other investments including irrigation systems, buildings, and miscellaneous equipment, the value at the end of its useful life is zero. The salvage value for land is the purchase price because land does not depreciate.
Capital Recovery Factor. Capital recovery factor is the amortization factor or annual payment whose present value at compound interest is 1. The amortization factor is a table value that corresponds to the interest rate and equipment life.
Interest Rate. An interest rate of 4.25% is used to calculate capital recovery. The rate will vary depending upon loan amount and other lending agency conditions, but is the basic rate suggested by a farm lending agency as of April 2008. Tools. Includes shop equipment/tools and other tools used on the farm and does not recognize any specific inventory. Irrigation System. The system consists of underground lines with alfalfa valves. The cost for the 300 acres is based on a quarter section (160 acres) with one-quarter mile runs. There are two 18-inch mainlines each approximately 2,625 feet with 10 or 12-inch alfalfa valves every 60 feet and a quarter mile intertie line (connects two mainlines) with 12-inch PVC. The permanent irrigation system consists of wells, pumps and motors, and buried mainline included in the land purchase price. Land. Cropland with district water suitable for alfalfa production typically ranges in value among counties from $2,500 to $20,000 per acre (2007 Trends & Leases). The land in this study is owned by the grower and cost $7,200 per acre. Land rents for cropland with district water range from $125 to $300 per acre and may vary according to value or type of crop planted. Hay Barn. The open barn with metal roof covers 5,000 square feet and is 20 feet high. The building’s ten support poles are on concrete piers with a natural floor (ground). Construction costs included in the price are based on prevailing wage.
2008 Alfalfa Costs and Returns Study (300 acres) San Joaquin Valley UC Cooperative Extension 8
Establishment Costs. Costs to establish the alfalfa stand are used to determine capital recovery expenses, depreciation, and interest on investment, during the production years. The establishment cost is the sum of cash costs for land preparation, planting, and cash overhead for establishing the alfalfa. The Total Cash Cost shown in Table 1 represents the establishment cost per acre. For this study, the cost is $478 per acre or $143,400 for the 300 acres. The alfalfa stand establishment cost is amortized over the 3-year stand life. Equipment. Although, farm equipment is purchased new or used, the study shows the current purchase price for new equipment. The new purchase price is adjusted to 60% to indicate a mix of new and used equipment. Equipment costs are composed of three parts: non-cash overhead, cash overhead, and operating costs. Both of the overhead factors have been discussed in previous sections. The operating costs consist of repairs, fuel, and lubrication and are discussed under operating costs.
Table Values. Due to rounding, the totals may be slightly different from the sum of the components.

2008 Alfalfa Costs and Returns Study (300 acres) San Joaquin Valley UC Cooperative Extension 9
REFERENCES
American Society of Agricultural Engineers. 1994. American Society of Agricultural Engineers Standards Yearbook. Russell H. Hahn and Evelyn E. Rosentreter (eds.) St. Joseph, Missouri. 41st edition.
Boehlje, Michael D., and Vernon R. Eidman. 1984. Farm Management. John Wiley and Sons. New York, New York.
Blank, Steve, Karen Klonsky, Kim Norris, and Steve Orloff. 1992. Acquiring Alfalfa Hay Equipment: A
Financial Analysis of Alternatives. University of California. Oakland, California. Giannini Information Series No. 92-1.
California Chapter of the American Society of Farm Managers and Rural Appraisers. 2007. Trends in
Agricultural Land and Lease Values. California Chapter of the American Society of Farm Managers and Rural Appraisers, Inc. Woodbridge, CA.
California State Automobile Association. 2008. Gas Price Averages 2007-08. AAA Press Room, San Francisco,
CA. Internet accessed April 2008. http://www.csaa.com/portal/site/CSAA California State Board of Equalization. Fuel Tax Division Tax Rates. Internet accessed January 2008.
http://www.boe.ca.gov/sptaxprog/spftdrates.htm Energy Information Administration. 2007- 08. Weekly Retail on Highway Diesel Prices. Internet accessed
April 2008. http://tonto.eix.doe.gov/oog/info/wohdp Mader, Terry, Todd Milton, Ivan Rush and Bruce Anderson. 1998. Feeding Value of Alfalfa Hay and Alfalfa
Silage. University of Nebraska – Lincoln Cooperative Extension, Lincoln, NE. Internet accessed April 7, 2003. http://www.ianr.unl.edu/pubs/range/g1342.htm
Mueller, Shannon. Determining the Value of Alfalfa Hay, Silage, or Greenchop. University of California
Cooperative Extension, Fresno County. Fresno, CA. Putnam, Dan. 2000. Calculations to Convert Tonnage of Moist Forage (greenchop, silage, haylage, or wet hay)
to Dry Hay Equivalents. Department of Agronomy & Range Science, University of California Davis, Davis, CA. Internet accessed April 14, 2003. http://alfalfa.ucdavis.edu/subpages/ForageQuality/DMConversion.htm
University of California Statewide Integrated Pest Management Program. UC Pest Management Guidelines,
Alfalfa. 2006. University of California, Davis, CA. http://www.ipm.ucdavis.edu USDA-AMS. 2002. Alfalfa Hay, California Market Summary. USDA-AMS, Livestock and Grain Market News.
Moses Lake, WA. Internet accessed November 5, 2007. http://www.ams.usda.gov/marketnews.htm Vargas, Ron N., Shannon C. Mueller, Carol A. Frate, Mick Canevari, Marsha Campbell-Mathews, Karen M.
Klonsky, and Richard L. De Moura. 2003. Sample Cost To Establish an Alfalfa Stand and Produce Alfalfa Hay, San Joaquin Valley, 300 acre planting. UC Cooperative Extension. Department of Agricultural and Resource Economics, UC Davis. Davis, CA.

2008 Alfalfa Costs and Returns Study (300 acres) San Joaquin Valley UC Cooperative Extension 10
UC COOPERATIVE EXTENSION Table 1. COSTS PER ACRE to ESTABLISH ALFALFA
SAN JOAQUIN VALLEY 2008 Operation Cash and Labor Cost per acre Time Labor Fuel, Lube Material Custom/ Total Your Operation (Hrs/A) Cost & Repairs Cost Rent Cost Cost CULTURAL: Fertilize: Soil Sample (P&K) 0.00 0 0 0 2 2 Land Prep: Disc Stubble 2X 0.27 5 14 0 0 19 Land Prep: Chisel Field 0.19 3 9 0 0 13 Land Prep: Laser Level Field 0.00 0 0 0 75 75 Land Prep: Border Preparation 3X 0.09 1 3 0 0 5 Fertilize 50% of cost. 1X per 2 yrs. (11-52-0) 0.00 0 0 60 5 65 Land Prep: Finish Disc and Harrow 0.15 3 8 0 0 11 Plant 0.33 6 13 90 0 109 Irrigate 0.18 2 0 24 0 26 Weed: winter weeds (Raptor, Butyrac) 0.00 0 0 39 9 48 Pickup Truck Use 0.12 2 2 0 0 4 ATV Use 0.12 2 0 0 0 2 TOTAL CULTURAL COSTS 1.45 23 50 213 91 377 Interest on operating capital @ 6.75% 8 TOTAL OPERATING COSTS/ACRE 23 50 213 91 385 CASH OVERHEAD: Liability Insurance 1 Office Expense 24 Property Taxes 60 Property Insurance 2 Investment Repairs 6 TOTAL CASH OVERHEAD COSTS 93 TOTAL CASH COSTS/ACRE 478 NON-CASH OVERHEAD (Capital Recovery): Per producing -- Annual Cost -- acre Capital Recovery Land 5,800 247 247 Irrigation System 250 19 19 Building 2400 sqft 53 4 4 Shop Tools 10 1 1 Fuel Overhead 2 0 0 Equipment 97 11 11 TOTAL NON-CASH OVERHEAD COSTS 6,213 282 282 TOTAL COSTS/ACRE 760

2008 Alfalfa Costs and Returns Study (300 acres) San Joaquin Valley UC Cooperative Extension 11
UC COOPERATIVE EXTENSION
Table 2. MATERIAL and INPUT COSTS to ESTABLISH ALFALFA SAN JOAQUIN VALLEY 2008
Quantity/ Price or Value or Your Acre Unit Cost/Unit Cost/Acre Cost OPERATING COSTS Custom:
Soil Analysis (P) 0.05 each 18.00 1 Soil Analysis (K) 0.05 each 18.00 1 Laser Level 1.00 acre 75.00 75 Broadcast Fertilizer 0.50 acre 9.50 5 Ground Application 1.00 acre 9.00 9
Fertilizer: 11-52-0 150.00 lb 0.40 60
Seed: Alfalfa Seed (coated) 30.00 lb 3.00 90
Irrigation: Water 8.00 acin 3.00 24
Herbicide: Raptor 4.00 floz 5.56 22 Butyrac (2,4-DB) 2.00 pint 4.94 10
Adjuvant: No Foam A 3.37 7 3.37 7
Labor (machine) 14.28 22 14.28 22 Labor (non-machine) 10.88 2 10.88 2 Fuel - Gas 3.45 1 3.45 1 Fuel - Diesel 4.05 36 4.05 36 Lube 6 6 Machinery repair 7 7 Interest on operating capital @ 6.75% 8 8 TOTAL OPERATING COSTS/ACRE 385 385
UC COOPERATIVE EXTENSION
Table 3. WHOLE FARM ANNUAL EQUIPMENT COSTS - ESTABLISHMENT YEAR SAN JOAQUIN VALLEY 2008
ANNUAL EQUIPMENT COSTS
Cash Overhead Yrs Salvage Capital Insur- Yr Description Price Life Value Recovery ance Taxes Total 08 115HP 7420 MFWD Tractor 75,874 10 22,412 7,626 364 491 8,481 08 150HP 78104 WD Tractor 114,342 10 33,775 11,493 548 741 12,781 08 ATV 7,800 5 3,496 1,122 42 56 1,220 08 Brillion Seeder 12’ 14,169 7 3,615 1,928 66 89 2,083 08 Chisel - Heavy 15' 14,166 12 1,962 1,403 60 81 1,543 08 Disc - Finish 18' 22,534 12 3,121 2,231 95 128 2,454 08 Disc - Stubble 18' 29,000 5 9,446 4,825 142 192 5,159 08 Disc - Border 2,800 12 388 277 12 16 305 08 Harrow - Spike 14' 772 12 107 76 3 4 84 08 Pickup 3/4 Ton 32,000 5 14,342 4,604 171 232 5,007 TOTAL 313,457 92,664 35,586 1,503 2,031 39,119 60% of New Cost * 188,074 55,598 21,351 902 1,218 23,471 *Used to reflect a mix of new and used equipment

2008 Alfalfa Costs and Returns Study (300 acres) San Joaquin Valley UC Cooperative Extension 12
UC COOPERATIVE EXTENSION
Table 4. COSTS PER ACRE to PRODUCE ALFALFA HAY SAN JOAQUIN VALLEY 2008
Operation Cash and Labor Cost per acre Time Labor Fuel, Lube Material Custom/ Total Your Operation (Hrs/A) Cost & Repairs Cost Rent Cost Cost CULTURAL: Weed: Grasses (TR-10) 0.00 0 0 22 9 31 Irrigate: Make Semi-permanent Drain 0.01 0 0 0 0 0 Insect: Aphid, Weevil (Lorsban) 0.00 0 0 11 11 22 Irrigate: 10X 1.80 20 0 162 0 182 Weed: Summer Grasses (SelectMax) 0.00 0 0 20 9 29 Insect; Worm (Lannate) 0.00 0 0 10 11 21 Fertilizer: Tissue Sampling (analysis) 0.00 0 0 0 1 1 Fertilize: (11-52-0) 0.00 0 0 30 10 40 Weed: Winter (Velpar, Karmex) 0.00 0 0 29 9 38 Pickup Truck Use 0.24 4 3 0 0 7 ATV Use 0.24 4 1 0 0 5 TOTAL CULTURAL COSTS 2.29 28 4 283 60 375 HARVEST: Haylage 2X (harvested by buyer) 0.02 0 0 0 0 0 Hay 7X (swath, rake, bale, roadside) 0.00 0 0 0 322 322 TOTAL HARVEST COSTS 0.00 0 0 0 322 322 Interest on operating capital @ 6.75% 11 TOTAL OPERATING COSTS/ACRE 28 4 283 382 708 CASH OVERHEAD: Liability Insurance 1 Office Expense 30 Property Taxes 76 Property Insurance 2 Investment Repairs 13 TOTAL CASH OVERHEAD COSTS 122 TOTAL CASH COSTS/ACRE 830 NON-CASH OVERHEAD: Per producing -- Annual Cost -- acre Capital Recovery Land 7,250 308 308 Building(s) 67 5 5 Hay Barn 63 5 5 Fuel Tanks 3 0 0 Shop Tools 13 1 1 Irrigation System 500 38 38 Alfalfa Establishment 478 173 173 Equipment 16 2 2 TOTAL NON-CASH OVERHEAD COSTS 8,389 532 532 TOTAL COSTS/ACRE 1,362 X = number of times as 2X = 2 passes or times

2008 Alfalfa Costs and Returns Study (300 acres) San Joaquin Valley UC Cooperative Extension 13
UC COOPERATIVE EXTENSION Table 5. COSTS AND RETURNS PER ACRE to PRODUCE ALFALFA HAY
SAN JOAQUIN VALLEY 2008 Quantity/ Price or Value or Your Acre Unit Cost/Unit Cost/Acre Cost GROSS RETURNS
Hay 8.00 ton 185.00 1,480 Silage 3.00 ton 46.67 140
TOTAL GROSS RETURNS 1,620 OPERATING COSTS Insecticide:
Lorsban 4 E 2.00 pint 5.63 11 Lannate 90 SP 0.50 lb 20.00 10
Custom: Air Application 2.00 acre 11.00 22 Buyer Harvests 3.00 ton 0.00 0 Ground Application 3.00 acre 9.00 27 Swath, Rake 7.00 acre 19.00 133 Bale (1,500 lb bale) 8.00 ton 17.00 136 Roadside Hay 8.00 ton 6.65 53 Tissue Analysis (P, K) 0.05 each 20.50 1 Broadcast Fertilizer 1.00 acre 9.50 10
Herbicide: Treflan TR-10 20.00 lb 1.10 22 SelectMax 16.00 floz 1.22 20 Velpar L 2.00 pint 10.18 20 Karmex 1.50 lb 5.44 8
Irrigation: Water 54.00 acin 3.00 162
Fertilizer: 11-52-0 75.00 lb 0.40 30
Labor (machine) 0.58 hrs 14.28 8 Labor (non-machine) 1.82 hrs 10.88 20 Fuel (Gas) 0.83 gal 3.45 3 Fuel (Diesel) 0.08 gal 4.05 0 Lube 0 Machinery repair 1 Interest on operating capital @ 6.75% 11 TOTAL OPERATING COSTS/ACRE 708 NET RETURNS ABOVE OPERATING COSTS 912 CASH OVERHEAD COSTS: Liability Insurance 1 Office Expense 30 Property Taxes 76 Property Insurance 2 Investment Repairs 13 TOTAL CASH OVERHEAD COSTS/ACRE 122 TOTAL CASH COSTS/ACRE 830 NON-CASH OVERHEAD COSTS (Capital Recovery): Land 308 Building(s) 5 Hay Barn 5 Fuel Tanks 0 Shop Tools 1 Irrigation System 38 Alfalfa Establishment 173 Equipment 2 TOTAL NON-CASH OVERHEAD COSTS/ACRE 532 TOTAL COSTS/ACRE 1,362 NET RETURNS ABOVE TOTAL COSTS 258
2008 Alfalfa Costs and Returns Study (300 acres) San Joaquin Valley UC Cooperative Extension 14
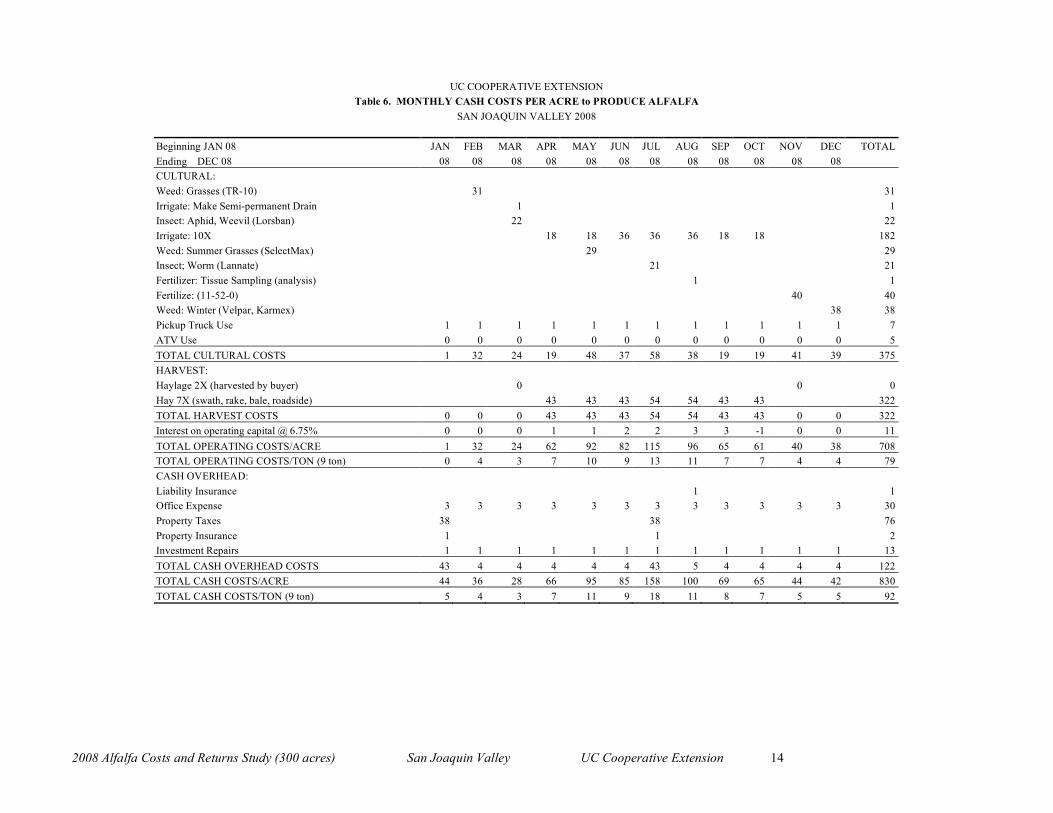
UC COOPERATIVE EXTENSION Table 6. MONTHLY CASH COSTS PER ACRE to PRODUCE ALFALFA
SAN JOAQUIN VALLEY 2008 Beginning JAN 08 JAN FEB MAR APR MAY JUN JUL AUG SEP OCT NOV DEC TOTAL Ending DEC 08 08 08 08 08 08 08 08 08 08 08 08 08 CULTURAL: Weed: Grasses (TR-10) 31 31 Irrigate: Make Semi-permanent Drain 1 1 Insect: Aphid, Weevil (Lorsban) 22 22 Irrigate: 10X 18 18 36 36 36 18 18 182 Weed: Summer Grasses (SelectMax) 29 29 Insect; Worm (Lannate) 21 21 Fertilizer: Tissue Sampling (analysis) 1 1 Fertilize: (11-52-0) 40 40 Weed: Winter (Velpar, Karmex) 38 38 Pickup Truck Use 1 1 1 1 1 1 1 1 1 1 1 1 7 ATV Use 0 0 0 0 0 0 0 0 0 0 0 0 5 TOTAL CULTURAL COSTS 1 32 24 19 48 37 58 38 19 19 41 39 375 HARVEST: Haylage 2X (harvested by buyer) 0 0 0 Hay 7X (swath, rake, bale, roadside) 43 43 43 54 54 43 43 322 TOTAL HARVEST COSTS 0 0 0 43 43 43 54 54 43 43 0 0 322 Interest on operating capital @ 6.75% 0 0 0 1 1 2 2 3 3 -1 0 0 11 TOTAL OPERATING COSTS/ACRE 1 32 24 62 92 82 115 96 65 61 40 38 708 TOTAL OPERATING COSTS/TON (9 ton) 0 4 3 7 10 9 13 11 7 7 4 4 79 CASH OVERHEAD: Liability Insurance 1 1 Office Expense 3 3 3 3 3 3 3 3 3 3 3 3 30 Property Taxes 38 38 76 Property Insurance 1 1 2 Investment Repairs 1 1 1 1 1 1 1 1 1 1 1 1 13 TOTAL CASH OVERHEAD COSTS 43 4 4 4 4 4 43 5 4 4 4 4 122 TOTAL CASH COSTS/ACRE 44 36 28 66 95 85 158 100 69 65 44 42 830 TOTAL CASH COSTS/TON (9 ton) 5 4 3 7 11 9 18 11 8 7 5 5 92

2008 Alfalfa Costs and Returns Study (300 acres) San Joaquin Valley UC Cooperative Extension 15
UC COOPERATIVE EXTENSION Table 7. RANGING ANALYSIS SAN JOAQUIN VALLEY 2008
COSTS PER ACRE TO PRODUCE ALFALFA AT VARYING YIELDS
YIELD (ton/acre)
Total Yield as Hay: 5.00 6.00 7.00 8.00 9.00 10.00 11.00 OPERATING COSTS: Cultural Cost 375 375 375 375 375 375 375 Harvest Cost – Hay (swath, rake, bale, roadside) 251 275 299 322 346 370 393 Interest on operating capital @ 6.75% 10 10 10 11 11 11 12 TOTAL OPERATING COSTS/ACRE 636 660 684 708 732 756 780 Operating Cost/ton 127 110 98 88 81 76 71 CASH OVERHEAD COSTS 122 122 122 122 122 122 122 TOTAL CASH COSTSACRE 758 782 806 830 854 878 902 Cash Costs/ton 152 130 115 104 95 88 82 NON-CASH OVERHEAD COSTS 532 532 532 532 532 532 532 TOTAL COSTS/ACRE 1,290 1,314 1,338 1,362 1,386 1,410 1,434 Total Costs/ton 258 219 191 170 154 141 130
NET RETURNS PER ACRE ABOVE OPERATING COSTS
$/ton YIELD (ton/acre) Hay 5.00 6.00 7.00 8.00 9.00 10.00 11.00
125.00 -11 90 191 292 393 494 595 135.00 39 150 261 372 483 594 705 145.00 89 210 331 452 573 694 815 155.00 139 270 401 532 663 794 925 165.00 189 330 471 612 753 894 1,035 175.00 239 390 541 692 843 994 1,145 185.00 289 450 611 772 933 1,094 1,255 195.00 339 510 681 852 1,023 1,194 1,365 205.00 389 570 751 932 1,113 1,294 1,475 215.00 439 630 821 1,012 1,203 1,394 1,585 225.00 489 690 891 1,092 1,293 1,494 1,695 235.00 539 750 961 1,172 1,383 1,594 1,805
NET RETURNS PER ACRE ABOVE CASH COSTS
$/ton YIELD (ton/acre) Hay 5.00 6.00 7.00 8.00 9.00 10.00 11.00
125.00 -133 -32 69 170 271 372 473 135.00 -83 28 139 250 361 472 583 145.00 -33 88 209 330 451 572 693 155.00 17 148 279 410 541 672 803 165.00 67 208 349 490 631 772 913 175.00 117 268 419 570 721 872 1,023 185.00 167 328 489 650 811 972 1,133 195.00 217 388 559 730 901 1,072 1,243 205.00 267 448 629 810 991 1,172 1,353 215.00 317 508 699 890 1,081 1,272 1,463 225.00 367 568 769 970 1,171 1,372 1,573 235.00 417 628 839 1,050 1,261 1,472 1,683

2008 Alfalfa Costs and Returns Study (300 acres) San Joaquin Valley UC Cooperative Extension 16
UC COOPERATIVE EXTENSION
Table 7. CONTINUED
NET RETURNS PER ACRE ABOVE TOTAL COSTS
$/ton YIELD (ton/acre) Hay 5.00 6.00 7.00 8.00 9.00 10.00 11.00
125.00 -665 -564 -463 -362 -261 -160 -59 135.00 -615 -504 -393 -282 -171 -60 51 145.00 -565 -444 -323 -202 -81 40 161 155.00 -515 -384 -253 -122 9 140 271 165.00 -465 -324 -183 -42 99 240 381 175.00 -415 -264 -113 38 189 340 491 185.00 -365 -204 -43 118 279 440 601 195.00 -315 -144 27 198 369 540 711 205.00 -265 -84 97 278 459 640 821 215.00 -215 -24 167 358 549 740 931 225.00 -165 36 237 438 639 840 1,041 235.00 -115 96 307 518 729 940 1,151

2008 Alfalfa Costs and Returns Study (300 acres) San Joaquin Valley UC Cooperative Extension 17
UC COOPERATIVE EXTENSION Table 8. WHOLE FARM ANNUAL EQUIPMENT, INVESTMENT,
and BUSINESS OVERHEAD COSTS SAN JOAQUIN VALLEY 2008
ANNUAL EQUIPMENT COSTS
Cash Overhead Yrs Salvage Capital Insur- Yr Description Price Life Value Recovery ance Taxes Total 08 150HP 7810 4WDTractor 114,342 10 33,775 11,493 548 741 12,781 08 ATV 7,800 5 3,496 1,122 42 56 1,220 08 Ditcher - V 8,500 12 1,177 842 36 48 926 08 Pickup 3/4 Ton 32,000 5 14,342 4,604 171 232 5,007 TOTAL 162,642 52,790 18,060 797 1,077 19,935 60% of New Cost* 97,585 31,674 10,836 478 646 11,961 *Used to reflect a mix of new and used equipment
ANNUAL INVESTMENT COSTS
Cash Overhead Yrs Salvage Capital Insur- Description Price Life Value Recovery ance Taxes Repairs Total Building 2,400 sqft 80,000 20 6,018 296 400 1,600 8,314 Alfalfa Establishment 143,400 3 51,919 0 0 0 51,919 Fuel Tanks 3,500 20 263 13 18 70 364 Hay Barn 75,000 20 5,641 278 375 1,500 7,794 Irrigation System 150,000 25 11,283 555 750 3,000 15,588 Land 8,700,000 20 8,700,000 369,750 0 87,000 0 456,750 Shop Tools 15,000 20 1,307 1,086 60 82 131 1,358 TOTAL INVESTMENT 9,166,900 8,701,307 445,960 1,202 88,624 6,301 542,087
ANNUAL BUSINESS OVERHEAD COSTS
Units/ Price/ Total Description Farm Unit Unit Cost Liability Insurance 1,200.00 acre 1.13 1,356 Office Expense 1,200.00 acre 30.00 36,000
UC COOPERATIVE EXTENSION Table 9. HOURLY EQUIPMENT COSTS
SAN JOAQUIN VALLEY 2008 COSTS PER HOUR Actual Cash Overhead Operating Hours Capital Insur- Fuel & Total Total Yr Description Used Recovery ance Taxes Repairs Lube Oper. Costs/Hr. 08 150HP 7810 4WDTractor 1,600 4.31 0.21 0.28 3.07 40.55 43.62 48.42 08 ATV 284 2.37 0.09 0.12 0.51 1.98 2.49 5.07 08 Ditcher - V 166 3.05 0.13 0.18 2.39 0 2.39 5.75 08 Pickup 3/4 Ton 400 6.90 0.26 0.35 2.39 11.9 14.29 21.80

2008 Alfalfa Costs and Returns Study (300 acres) San Joaquin Valley UC Cooperative Extension 18
UC COOPERATIVE EXTENSION Table 10. GROWER COSTS PER ACRE to HARVEST ALFALFA HAY
SAN JOAQUIN VALLEY 2008 Operation Cash and Labor Cost per acre Time Labor Fuel, Lube Material Custom/ Total Operation (Hrs/A) Cost & Repairs Cost Rent Cost Swathing 1.03 18 7 0 0 25 Raking 0.60 10 8 0 0 18 Baling 0.72 12 43 4 0 59 Roadsiding 0.20 3 16 0 0 20 TOTAL HARVEST COSTS 2.55 44 74 4 0 122 Interest on operating capital @ 6.75% 2 TOTAL OPERATING COSTS/ACRE 44 74 4 0 124 CASH OVERHEAD: Property Taxes 6 Property Insurance 4 TOTAL CASH OVERHEAD COSTS 10 TOTAL CASH COSTS/ACRE 133 NON-CASH OVERHEAD: Equipment 99 TOTAL NON-CASH OVERHEAD COSTS 99 TOTAL COSTS/ACRE 232
SUMMARY OF COSTS PER ACRE TO HARVEST ALFALFA
Quantity/ Price or Value or Operation Acre Unit Cost/Unit Cost/Acre Bale Twine (5 twine/bale) 1,043.00 ft 0.004 4 Labor (machine) 3.07 hrs 14.280 44 Fuel - Diesel 9.96 gal 4.050 40 Lube 6 Machinery repair 27 Interest on operating capital @ 6.75% 2 TOTAL OPERATING COST/ACRE 124
ANNUAL HARVEST EQUIPMENT COSTS
Cash Overhead Yrs Salvage Capital Insur- Yr Description Price Life Value Recovery ance Taxes Total 08 150HP 7810 4WD Tractor 114,342 10 33,775 11,493 548 741 12,781 08 37HP 4WD Tractor 22,000 10 6,498 2,211 105 142 2,459 08 Baler 3/4 Ton bale 81,000 10 13,369 9,011 349 472 9,832 08 Bale Wagon + 1500 bale attachment 148,625 10 24,531 16,533 641 866 18,040 08 Hay Rake 20' 19,500 10 3,448 2,150 85 115 2,350 08 Swather 14' Header 71,545 10 12,652 7,889 312 421 8,622 457,012 94,273 49,287 2,040 2,756 54,083 60% of New Cost* 274,207 56,564 29,572 1,224 1,654 32,450

2008 Alfalfa Costs and Returns Study (300 acres) San Joaquin Valley UC Cooperative Extension 19
UC COOPERATIVE EXTENSION
Table 11. OPERATIONS WITH EQUIPMENT SAN JOAQUIN VALLEY 2008
Operation Equipment Operation Month Tractor Implement Material Rate/acre Unit CULTURAL: Weed: Grasses (TR-10) February Ground-Custom Treflan TR-10 20.00 lb Make Semi-permanent Drain March 150 HP 4WD Ditcher-V Insect: Aphid/Weevil-Lorsban March Air-Custom Lorsban 4 2.00 pt Weed: SelectMax May Ground-Custom SelectMax 16.00 floz Irrigate: 10X April Water 5.40 acin May Water 5.40 acin June Water 10.80 acin July Water 10.80 acin August Water 10.80 acin September Water 5.40 acin October Water 5.40 acin Insect: Worm (Lannate) July Air-Custom Lannate SP 0.50 lb Fertilize: Tissue Sampling Aug Custom Analysis .05 each Fertilize: November Ground-Custom 11-52-0 75.00 lb Weed: Winter Velpar, Karmex December Ground-Custom Velpar L 2.00 pt Karmex DF 1.50 lb Pickup Truck Use Annual Pickup 3/4 Ton ATV Use Annual ATV Harvest: Haylage 2X March Buyer November Buyer Harvest: Hay 7X April Custom May Custom June Custom July Custom August Custom September Custom October Custom