Embed Size (px)
Citation preview

Sample Company Inc.
Valuation Report
Valuation Date as of: February 28, 2017
Prepared For: 123 Street Salt Lake City Utah, 84003
Prepared By: Economics Partners

Sample Company Inc. 4 0 9 A V a l u a t i o n
Page 1
March 28, 2017
Joe Example CEO & Co-Founder Sample Company Inc. 123 Street Salt Lake City, UT 84003
Dear Mr. Example,
Sample Company Inc. ("Sample Company Inc." or the "Company") has retained Economics Partners, LLC (doing business as "Economics Partners") as an independent and qualified financial consultant to estimate the fair market value (the "Opinion") of the Company's Common Stock (the ''Subject Security''), as of February 28, 2017 (the ''Valuation Date'') (the ''Engagement''). Sample Company’s Board of Directors and management (''Management'') may use the results of this Opinion for compliance with Internal Revenue Code Section 409A (''IRC 409A'') and as an input to Accounting Standards Codification (''ASC'') 718 (formerly SFAS 123(R)). Economics Partners does not assume any liability in furnishing this estimation and opinion.
Definition of Value
The definition of value in this report includes both fair market value (“FMV”) and fair value. Correspondingly, fair value and fair market value are, for the purpose of this report, synonymous. For financial reporting purposes, fair value is normally defined as the amount at which an asset can be sold or purchased in a current transaction between willing participants (excluding a forced or liquidation based sale). For tax planning purposes, fair market value is usually defined as the price at which an asset would change hands between a willing and informed seller and a willing and informed purchaser that are both operating under their own free will.
Conclusion
Based on the following and the attached exhibits, Economics Partners determined the fair market value of the Common Stock to be $0.41 per share as of the Valuation Date, on a non-marketable, minority-interest basis. For additional information, please refer to Exhibit A.
Sincerely,
Economics Partners
Sample Company Inc. 4 0 9 A V a l u a t i o n
Page 2
TABLE OF CONTENTS
PART I: EXHIBITS ................................................................................................................... 3
Exhibit A: Fair Market Value Summary ..............................................................................................................................4
Exhibit B: Backsolve Method ..........................................................................................................................................5
Exhibit C: Guideline Public Company Multiples Method ..........................................................................................................6
Exhibit D: Market Comparables - Guideline Public Company Financial Analysis .............................................................................7
Exhibit E: Option Pricing Method......................................................................................................................................8
Exhibit F: Discount for Lack of Marketability - Summary ..........................................................................................................9
Exhibit G: Discount for Lack of Marketability - Synthetic Put ................................................................................................... 10
Exhibit H: Discount for Lack of Marketability Chart - Synthetic Put ............................................................................................ 11
Exhibit I: Discount for Lack of Marketability - Differential Put .................................................................................................. 12
Exhibit J: Capitalization Table ....................................................................................................................................... 13
Exhibit K: Income Statement ........................................................................................................................................ 14
Exhibit L: Balance Sheet ............................................................................................................................................. 15
PART II: NARRATIVE REPORT .................................................................................................... 16
A. Company, Industry, & Economic Overview .................................................................................................................... 17
B. Valuation Methodologies and Assumptions .................................................................................................................... 22
C. Valuing the Subject Security ..................................................................................................................................... 26
D. Professional Qualifications ....................................................................................................................................... 33
E. Information Sources and Limiting Conditions .................................................................................................................. 34
F. Appraisal Certification ............................................................................................................................................. 37

Sample Company Inc. 4 0 9 A V a l u a t i o n
Page 3
PART I: EXHIBITS

Sample Company Inc. 4 0 9 A V a l u a t i o n
Page 4
Exhibit A: Fair Market Value Summary
Sample Company Inc. Exhibit A
Valuation of Sample Company Inc. Common Stock
Valuation Date: February 28, 2017
Fair Market Value Summary
Valuation Approach Valuation Method
Exhibit
Reference
Implied Equity
Value Weighting Weighted Value
Market Approach Backsolve Method - Series B¹ Exhibit B 77,111,605 50% 38,555,803
Market Approach Backsolve Method - Series A² 32,666,922 50% 16,333,461
Estimated Fair Market Value of Equity $54,889,264
Price per Share
Common Stock $0.65
Discount for Non-Marketability 37.00%
Common, Non-Marketable, Minority Basis $0.41
Notes:
¹ Backsolve method - Series B is based on the Series B Preferred round that closed on February 28, 2017.
² Backsolve method - Series A is based on the Series A Preferred Backsolve in the prior valuation performed by XYZ Valuation Company which concluded to a
fair market value of equity of $32.67 mill ion. Per discussions with company management, the recent Series B financing round consisted primarily of strategic
investors that were eager to invest in this promising industry. Given the strategic considerations of these investors, we chose to weight each method 50% in
order to more accurately assess the true fair market value of equity.

Sample Company Inc. 4 0 9 A V a l u a t i o n
Page 5
Exhibit B: Backsolve Method
Sample Company Inc. Exhibit B
Valuation of Sample Company Inc. Common Stock
Valuation Date: February 28, 2017
Backsolve Method
Backsolve Method - Option Pricing Method
Option Pricing Model Assumptions
Fair Market Value of Equity $77,111,605
Risk Free Rate (February 28, 2017) 1.47%
Volatil ity (February 28, 2017) 55.00%
Years to Liquidity 3.00
Liquiditiy Date 2/28/2020
Backsolve Date 2/28/2017
Series B Preferred
Stock
Series A Preferred
Stock
Series Seed
Preferred Stock
Common Options
FMV Strike
Common Options
$0.354 Strike
Common Options
$0.039 Strike Common Stock
Total Number
of Shares Number of Shares 14,424,951 13,444,472 6,169,802 3,378,278 3,056,379 1,115,449 17,650,000 59,239,331
Original Purchase Price/Exercise Price per share $1.7851 $1.1157 $0.4349 $0.4082 $0.3537 $0.0390
Preference Multiple 1.0x 1.0x 1.0x
Liquidation Preference $25,749,980 $14,999,997 $2,683,247
Number of As-Converted Shares (Common Stock Equivalents) 14,424,951 13,444,472 6,169,802 3,378,278 1,115,449 1,115,449 17,650,000 57,298,401
Liquidation Preference per share (As-Converted Basis) 1.7851 1.1157 0.4349 0.4082 0.3537 0.0390
Company Value
From To Delta Equity Tranche Value
$0 $43,433,224 $43,433,224 $33,677,156 59.29% 34.54% 6.18% 0.00% 0.00% 0.00% 0.00% 100.00%
$43,433,224 $44,121,574 $688,350 $372,403 0.00% 0.00% 0.00% 0.00% 0.00% 0.00% 100.00% 100.00%
$44,121,574 $50,027,061 $5,905,487 $3,025,819 0.00% 0.00% 0.00% 0.00% 0.00% 5.94% 94.06% 100.00%
$50,027,061 $51,110,081 $1,083,020 $523,624 0.00% 0.00% 0.00% 0.00% 5.61% 5.61% 88.78% 100.00%
$51,110,081 $51,731,673 $621,592 $296,362 0.00% 0.00% 0.00% 14.52% 4.80% 4.80% 75.88% 100.00%
$51,731,673 $71,766,921 $20,035,248 $8,133,646 0.00% 0.00% 20.97% 11.48% 3.79% 3.79% 59.97% 100.00%
$71,766,921 $100,466,409 $28,699,487 $8,107,472 0.00% 31.36% 14.39% 7.88% 2.60% 2.60% 41.17% 100.00%
$100,466,409 Inifinity Infinity $22,975,123 25.18% 23.46% 10.77% 5.90% 1.95% 1.95% 30.80% 100.00%
Total $77,111,605
Company Value
From To Description Equity Tranche Value
$0 $43,433,224 Series B, Series A, Series Seed Preference $33,677,156 $19,965,962 $11,630,664 $2,080,530 $0 $0 $0 $0 $33,677,156
$43,433,224 $44,121,574 Until $0.039 Options Excerice $372,403 $0 $0 $0 $0 $0 $0 $372,403 $372,403
$44,121,574 $50,027,061 Until $0.3537 Options Excerice $3,025,819 $0 $0 $0 $0 $0 $179,860 $2,845,960 $3,025,819
$50,027,061 $51,110,081 Until FMV Options Excerice $523,624 $0 $0 $0 $0 $29,379 $29,379 $464,866 $523,624
$51,110,081 $51,731,673 Until Series Seed Conversion $296,362 $0 $0 $0 $43,045 $14,213 $14,213 $224,892 $296,362
$51,731,673 $71,766,921 Until Series A Conversion $8,133,646 $0 $0 $1,705,223 $933,696 $308,290 $308,290 $4,878,146 $8,133,646
$71,766,921 $100,466,409 Until Series B Conversion $8,107,472 $0 $2,542,382 $1,166,724 $638,840 $210,934 $210,934 $3,337,657 $8,107,472
$100,466,409 Inifinity Pro-Rata Participation $22,975,123 $5,784,019 $5,390,873 $2,473,925 $1,354,599 $447,265 $447,265 $7,077,177 $22,975,123
Total $77,111,605 $25,749,980 $19,563,919 $7,426,403 $2,970,180 $1,010,081 $1,189,941 $19,201,101 $77,111,605
Per share value $1.7851 $1.4552 $1.2037 $0.8792 $0.3305 $1.0668 $1.0879
Notes
¹ Using the Backsolve Method, the implied price of the most recent round of preferred stock is set to its original issue price and the implied equity value of the Company is then calculated using the solver function in Excel. As such, the model solves for the per-share value of the
security placed in the transaction and consequently produces relative values for other securities in the company’s capital structure.

Sample Company Inc. 4 0 9 A V a l u a t i o n
Page 6
Exhibit C: Guideline Public Company Multiples Method
Sample Company Inc. Exhibit C
Valuation of Sample Company Inc. Common Stock (In USD)
Valuation Date: February 28, 2017
Guideline Public Company Multiples Method
Market Multiples
Public Company Symbol
Enterprise Value
(USD in millions)
5 Yr Historical
Volatility¹
3 Yr Historical
Volatility²Raytheon Co RTN $47,528.5 17.98% 18.38%
Harris Corp HRS 17,718.3 21.54% 21.84%
Teledyne Technologies Inc TDY 5,141.3 20.89% 22.31%
DigitalGlobe Inc DGI 3,134.5 43.01% 42.80%
Kratos Defense and Security Solutions Inc KTOS.O 977.8 49.61% 51.52%
KEYW Holding Corp KEYW.O 579.4 55.39% 64.39%
Low 17.98% 18.38%
25th Percentile 20.16% 20.97%
Median 32.28% 32.55%
Average 34.74% 36.87%
75th Percentile 51.05% 54.73%
High 55.39% 64.39%
Selected 51.00% 55.00%
Notes
¹ Calculated as 5 years of historical volatil ity or since IPO, ending at the Valuation Date.
² Calculated as 3 years of historical volatil ity or since IPO, ending at the Valuation Date.
Source: Thomson Reuters

Sample Company Inc. 4 0 9 A V a l u a t i o n
Page 7
Exhibit D: Market Comparables - Guideline Public Company Financial Analysis
Sample Company Inc. Exhibit D
Valuation of Sample Company Inc. Common Stock (In USD)
Valuation Date: February 28, 2017
Market Comparables - Guideline Public Company Financial Analysis
Comparable Companies Financial Analysis Size (USD Millions) Historical and Expected Growth Rates Profitability Ratios Leverage Ratios
Company Symbol
Enterprise
Value TTM Revenue
1-year
Historical
Revenue
Growth %
5-year
Historical
Revenue
CAGR %
2017E
Revenue
2018E
Revenue
TTM Gross
Profit Margin %
TTM EBITDA
Margin %
Total
Debt/Equity
%
Total
Debt/Capital
%
LT
Debt/Capital
%
Depreciation
&
Amortization
% TTM Rev.
Net Working
Capital % TTM
Rev.
Capex % TTM
Rev.Raytheon Co RTN $47,528.5 $24,069.0 3.5% (0.8%) 4.2% 4.4% 25.4% 15.6% 53.0% 33.7% 33.7% (2.1%) 3.9% (2.6%)
Harris Corp HRS 17,718.3 7,191.0 16.4% 4.2% (19.1%) 4.0% 32.1% 19.8% 139.4% 58.2% 54.1% (4.8%) 8.1% (2.0%)
Teledyne Technologies Inc TDY 5,141.3 2,155.2 (6.1%) 4.6% 3.3% 3.5% 38.6% 15.9% 39.7% 28.4% 23.7% (4.1%) 11.4% (4.1%)
DigitalGlobe Inc DGI 3,134.5 725.4 3.3% 14.5% 17.0% 4.2% 78.1% 51.9% 109.9% 52.4% 50.4% (36.8%) (9.4%) (26.5%)
Kratos Defense and Security Solutions Inc KTOS.O 977.8 668.7 1.8% 8.6% 6.5% 5.4% 22.9% 2.3% 156.3% 61.0% 60.8% (3.4%) 16.1% (1.4%)
KEYW Holding Corp KEYW.O 579.4 299.8 1.1% 18.6% 3.7% 6.3% 32.2% 9.3% 55.7% 35.8% 35.8% (5.0%) 10.2% (3.1%)
Low $579.4 $299.8 (6.1%) (0.8%) (19.1%) 3.5% 22.9% 2.3% 39.7% 28.4% 23.7% (36.8%) (9.4%) (26.5%)
25th Percentile 878.2 576.5 (0.7%) 2.9% (2.3%) 3.9% 24.8% 7.5% 49.7% 32.4% 31.2% (13.0%) 0.6% (9.7%)
Median 4,137.9 1,440.3 2.5% 6.6% 3.9% 4.3% 32.2% 15.7% 82.8% 44.1% 43.1% (4.4%) 9.2% (2.9%)
Average 12,513.3 5,851.5 3.3% 8.3% 2.6% 4.6% 38.2% 19.1% 92.3% 44.9% 43.1% (9.4%) 6.7% (6.6%)
75th Percentile 25,170.9 11,410.5 6.7% 15.5% 9.1% 5.6% 48.5% 27.8% 143.6% 58.9% 55.8% (3.1%) 12.6% (1.9%)
High 47,528.5 24,069.0 16.4% 18.6% 17.0% 6.3% 78.1% 51.9% 156.3% 61.0% 60.8% (2.1%) 16.1% (1.4%)
Notes
Source: Thomson Reuters
Operational Ratios

Sample Company Inc. 4 0 9 A V a l u a t i o n
Page 8
Exhibit E: Option Pricing Method
Sample Company Inc. Exhibit E
Valuation of Sample Company Inc. Common Stock
Valuation Date: February 28, 2017
Option Pricing Method
Option Pricing Model Assumptions
Fair Market Value of Equity $54,889,264
Risk Free Rate (February 28, 2017) 1.47%
Volatil ity (February 28, 2017) 55.00%
Years to Liquidity 3.0
Liquidity Date 2/28/2020
Valuation Date 2/28/2017
Series B Preferred
Stock
Series A Preferred
Stock
Series Seed
Preferred Stock
Common Options
FMV Strike
Common Options
$0.354 Strike
Common Options
$0.039 Strike Common Stock
Total Number of
Shares Number of Shares 14,424,951 13,444,472 6,169,802 3,378,278 3,056,379 1,115,449 17,650,000 59,239,331
Original Purchase Price/Exercise Price per share $1.7851 $1.1157 $0.4349 $0.4082 $0.3537 $0.0390
Preference Multiple 1.0x 1.0x 1.0x
Liquidation Preference $25,749,980 $14,999,997 $2,683,247
Number of As-Converted Shares (Common Stock Equivalents) 14,424,951 13,444,472 6,169,802 3,378,278 3,056,379 1,115,449 17,650,000 59,239,331
Liquidation Preference per share (As-Converted Basis) 1.7851 1.1157 0.4349 0.4082 0.3537 0.0390
Company Value
From To Delta Equity Tranche Value
$0 $43,433,224 $43,433,224 $29,879,821 59.29% 34.54% 6.18% 0.00% 0.00% 0.00% 0.00% 100.00%
$43,433,224 $44,121,574 $688,350 $279,040 0.00% 0.00% 0.00% 0.00% 0.00% 0.00% 100.00% 100.00%
$44,121,574 $50,027,061 $5,905,487 $2,228,552 0.00% 0.00% 0.00% 0.00% 0.00% 5.94% 94.06% 100.00%
$50,027,061 $51,215,814 $1,188,753 $415,221 0.00% 0.00% 0.00% 0.00% 14.01% 5.11% 80.88% 100.00%
$51,215,814 $51,889,277 $673,462 $230,610 0.00% 0.00% 0.00% 13.41% 12.13% 4.43% 70.04% 100.00%
$51,889,277 $73,245,910 $21,356,633 $5,884,905 0.00% 0.00% 19.67% 10.77% 9.74% 3.56% 56.26% 100.00%
$73,245,910 $103,244,656 $29,998,746 $5,143,985 0.00% 30.00% 13.77% 7.54% 6.82% 2.49% 39.38% 100.00%
$103,244,656 Inifinity Infinity $10,827,129 24.35% 22.70% 10.42% 5.70% 5.16% 1.88% 29.79% 100.00%
Total $54,889,264
Company Value
From To Description Equity Tranche Value
$0 $43,433,224 Series B, Series A, Series Seed Preference $29,879,821 $17,714,660 $10,319,226 $1,845,936 $0 $0 $0 $0 $29,879,821
$43,433,224 $44,121,574 Until $0.039 Options Exercise $279,040 $0 $0 $0 $0 $0 $0 $279,040 $279,040
$44,121,574 $50,027,061 Until $0.3537 Options Exercise $2,228,552 $0 $0 $0 $0 $0 $132,469 $2,096,083 $2,228,552
$50,027,061 $51,215,814 Until Common Options FMV Excerice $415,221 $0 $0 $0 $0 $58,156 $21,225 $335,840 $415,221
$51,215,814 $51,889,277 Until Series Seed Conversion $230,610 $0 $0 $0 $30,915 $27,969 $10,208 $161,518 $230,610
$51,889,277 $73,245,910 Until Series A Conversion $5,884,905 $0 $0 $1,157,437 $633,755 $573,368 $209,255 $3,311,090 $5,884,905
$73,245,910 $103,244,656 Until Series B Conversion $5,143,985 $0 $1,543,214 $708,196 $387,773 $350,824 $128,036 $2,025,942 $5,143,985
$103,244,656 Inifinity Pro-Rata Participation $10,827,129 $2,636,438 $2,457,236 $1,127,650 $617,445 $558,612 $203,870 $3,225,877 $10,827,129
Total $54,889,264 $20,351,098 $14,319,676 $4,839,219 $1,669,889 $1,568,930 $705,062 $11,435,390 $54,889,264
Per share value $1.4108 $1.0651 $0.7843 $0.4943 $0.5133 $0.6321 $0.6479
Discount for Non-Marketability 37.00%
Estimated Common Stock value (per share) $0.41
Sample Company Inc. 4 0 9 A V a l u a t i o n
Page 9
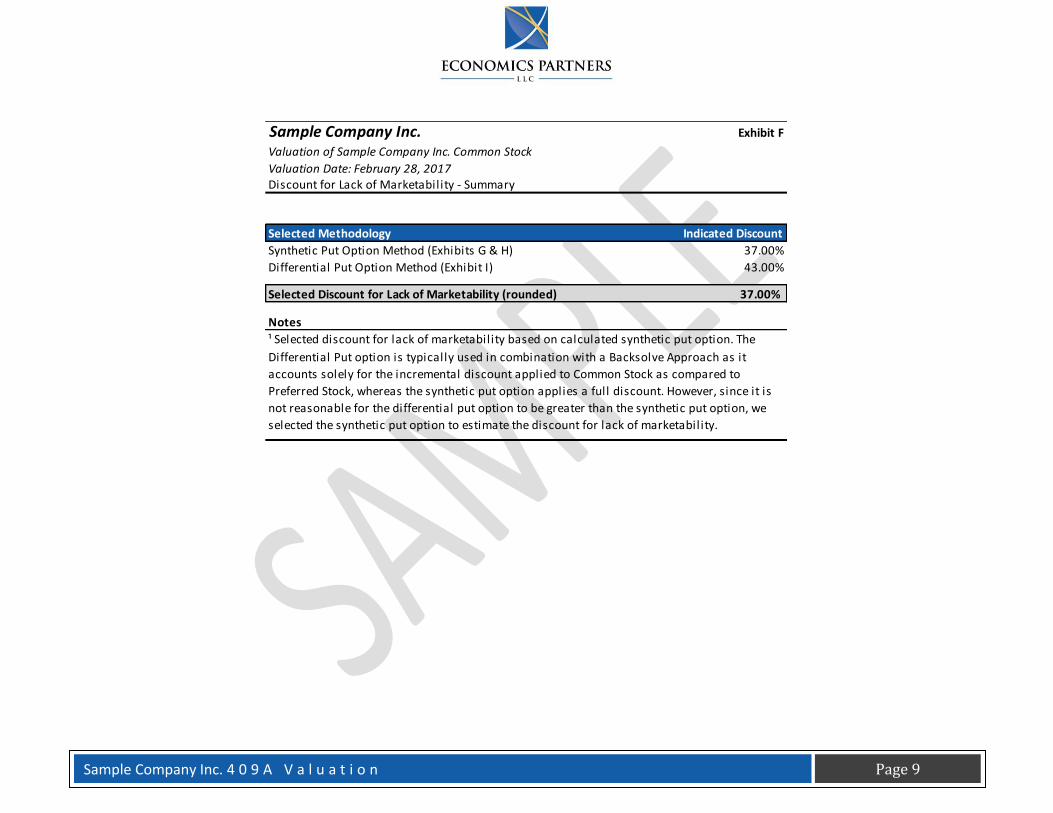
Exhibit F: Discount for Lack of Marketability - Summary
Sample Company Inc. Exhibit F
Valuation of Sample Company Inc. Common Stock
Valuation Date: February 28, 2017Discount for Lack of Marketability - Summary
Selected Methodology Indicated Discount
Synthetic Put Option Method (Exhibits G & H) 37.00%
Differential Put Option Method (Exhibit I) 43.00%
Selected Discount for Lack of Marketability (rounded) 37.00%
Notes
¹ Selected discount for lack of marketability based on calculated synthetic put option. The
Differential Put option is typically used in combination with a Backsolve Approach as it
accounts solely for the incremental discount applied to Common Stock as compared to
Preferred Stock, whereas the synthetic put option applies a full discount. However, since it is
not reasonable for the differential put option to be greater than the synthetic put option, we
selected the synthetic put option to estimate the discount for lack of marketability.

Sample Company Inc. 4 0 9 A V a l u a t i o n
Page 10
Exhibit G: Discount for Lack of Marketability - Synthetic Put
Sample Company Inc. Exhibit G
Valuation of Sample Company Inc. Common Stock
Valuation Date: February 28, 2017
Discount for Lack of Marketability - Synthetic Put
Risk Free Rate 1.88%
Volatil ity 51.00%
Years to Exit 5.0
Fair Market Value $54,889,264
Put Value $20,309,027
Discount for Lack of Marketability (rounded) 37.00%

Sample Company Inc. 4 0 9 A V a l u a t i o n
Page 11
Exhibit H: Discount for Lack of Marketability Chart - Synthetic Put
Sample Company Inc. Exhibit H
Valuation of Sample Company Inc. Common Stock
Valuation Date: February 28, 2017
Discount for Lack of Marketability Chart - Synthetic Put
Year 1 3.48% 7.39% 11.29% 15.18% 19.02% 22.82% 26.56% 30.24% 33.84%
Year 2 4.42% 9.83% 15.25% 20.59% 25.83% 30.95% 35.91% 40.70% 45.29%
Year 3 4.96% 11.46% 17.95% 24.33% 30.51% 36.47% 42.17% 47.57% 52.66%
Year 4 5.31% 12.66% 20.01% 27.17% 34.05% 40.61% 46.78% 52.52% 57.83%
Year 5 5.53% 13.59% 21.64% 29.43% 36.85% 43.82% 50.29% 56.21% 61.57%
0%
10%
20%
30%
40%
50%
60%
70%
11.00% 21.00% 31.00% 41.00% 51.00% 61.00% 71.00% 81.00% 91.00%
Est
ima
ted
Dis
cou
nt
Discount for Lack of MarketabilityYear 1 Year 2 Year 3 Year 4 Year 5
Volatility

Sample Company Inc. 4 0 9 A V a l u a t i o n
Page 12
Exhibit I: Discount for Lack of Marketability - Differential Put
Sample Company Inc. Exhibit I
Valuation of Sample Company Inc. Common Stock
Valuation Date: February 28, 2017
Discount for Lack of Marketability - Differential Put
Risk Free Rate 1.88%
Volatil ity 51.00%
Years to Exit 5.0
Equity Volatil ity 51.00%
Preferred Stock Class Volatil ity¹ 35.49%
Common Stock Class Volatil ity¹ 83.70%
Calculated DLOM for Preferred Stock 25.17%
Calculated DLOM for Common Stock 57.72%
Incremental DLOM for Common Stock (Rounded)² 43.00%
Notes
¹ Class volatil ities calculated based on the selected equity volatil ity, the security
delta implied in Exhibit E, and the ratio of the total allocated class value to the total
equity value.² Incremental value calculated as 1 - (1 - Common DLOM) / (1 - Preferred DLOM).
This calculation is based on the rationale that a portion of the Common Stock's
i l l iquidity has already been priced by investors into the preferred round util ized in
the backsolve methodology.
Sample Company Inc. 4 0 9 A V a l u a t i o n
Page 13
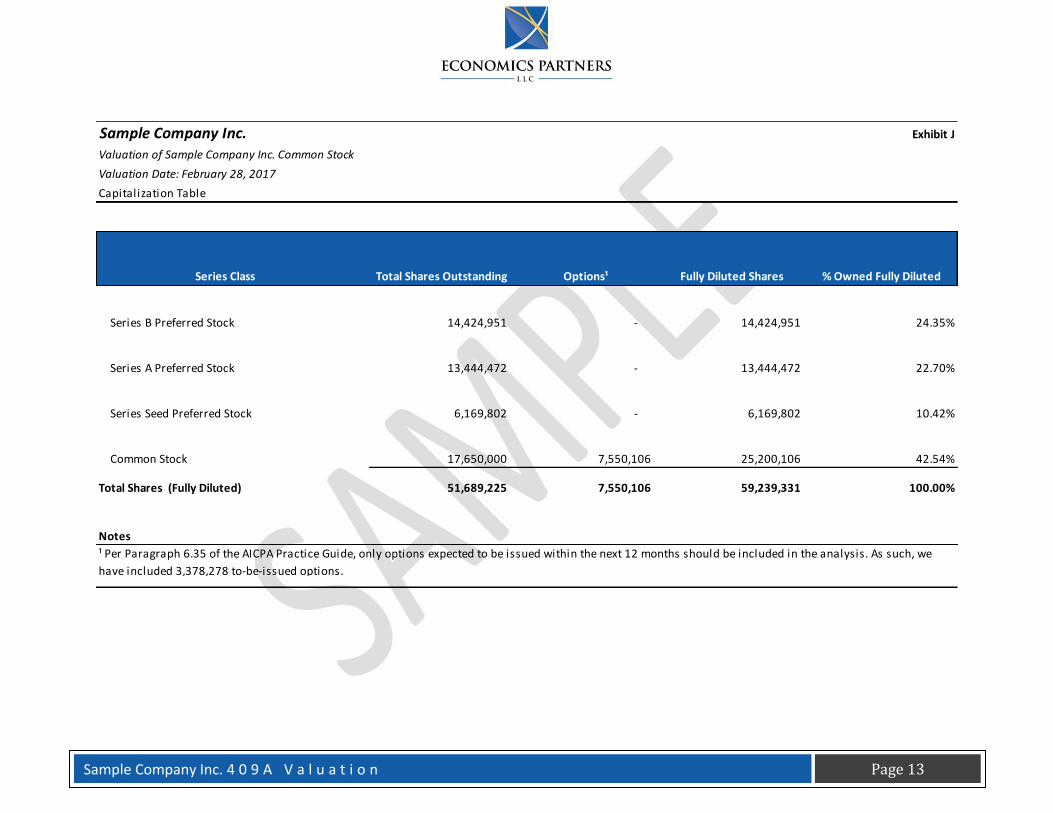
Exhibit J: Capitalization Table
Sample Company Inc. Exhibit J
Valuation of Sample Company Inc. Common Stock
Valuation Date: February 28, 2017
Capitalization Table
Series Class Total Shares Outstanding Options¹ Fully Diluted Shares % Owned Fully Diluted
Series B Preferred Stock 14,424,951 - 14,424,951 24.35%
Series A Preferred Stock 13,444,472 - 13,444,472 22.70%
Series Seed Preferred Stock 6,169,802 - 6,169,802 10.42%
Common Stock 17,650,000 7,550,106 25,200,106 42.54%
Total Shares (Fully Diluted) 51,689,225 7,550,106 59,239,331 100.00%
Notes
¹ Per Paragraph 6.35 of the AICPA Practice Guide, only options expected to be issued within the next 12 months should be included in the analysis. As such, we
have included 3,378,278 to-be-issued options.

Sample Company Inc. 4 0 9 A V a l u a t i o n
Page 14
Exhibit K: Income Statement
Sample Company Inc. Exhibit K
Valuation of Sample Company Inc. Common Stock
Valuation Date: February 28, 2017
Income Statement
Blended TTM
12/31 YTD 2/28
(US Dollars) 2016 2017
Total Revenue $88,500 $0
Cost of Goods Sold $0 ($117,269)
Gross Profit $88,500 ($117,269)
Gross Margin 100.00% NA
Total Operating Expenses (7,550,331) (1,787,818)
EBITDA ($7,461,831) ($1,905,087)
EBTIDA Margin -8431.45% NA
Depreciation & Amortization Expenses $0 ($12,062)
EBIT ($7,461,831) ($1,917,149)
Explicit NTM
Other Income & Expenses ($63,454) $11,091
Net Income ($7,525,285) ($1,906,058)
Notes
Blended NTM¹ Unless otherwise indicated, data provided by Management

Sample Company Inc. 4 0 9 A V a l u a t i o n
Page 15
Exhibit L: Balance Sheet
Sample Company Inc. Exhibit L
Valuation of Sample Company Inc. Common Stock
Valuation Date: February 28, 2017
Balance Sheet
12/31 2/28
(US Dollars) 2016 2017
Cash and Cash Equivalents $25,643,949 $32,709,392
Other Current Assets 77,984 116,481
Total Current Assets $25,721,933 $32,825,873
Fixed Assets $67,114 $62,114
Other Assets 173,840 166,778
Total Assets $25,962,887 $33,054,765
Credit Cards $116,822 $93,228
Accounts Payable 215,981 148,862
Other Current Liabilities 15,230 38,870
Total Current Liabilities $348,033 $280,960
Total Liabilities $348,033 $280,960
Common Stock $123,795 $123,795
Preferred Stock 34,329,663 43,403,877
Net Income (7,525,285) (1,906,058)
Retained Earnings (1,313,319) (8,847,808)
Total Equity $25,614,854 $32,773,806
Total Liabilities & Equity $25,962,887 $33,054,765
Total Debt $0 $0
Book Value of Invested Capital (BVIC) $25,614,854 $32,773,806
Cash-Free Net Working Capital (CFNWC) ($270,049) ($164,479)
CFNWC % of Revenue -305.1% -185.9%

Sample Company Inc. 4 0 9 A V a l u a t i o n
Page 16
PART II: NARRATIVE REPORT

Sample Company Inc. 4 0 9 A V a l u a t i o n
Page 17
A. COMPANY, INDUSTRY, & ECONOMIC OVERVIEW
Company Overview
Sample Company is making drones a part of everyday life by building its drone platform. Sample Company is the world-leading provider of airspace information and services and helps unmanned aircraft operate safely in the low-altitude space. Sample Company has integrated drones with vital technology to help the interface appeal to a broader user selection than before experienced. The company has grown in large portions due to its help from Other Fake Company and their potential market reach across the areas in which Sample Company does business.
Industry Overview1
Over the past five years, revenue for the Unmanned Aerial Vehicles (UAV) Manufacturing industry rapidly descended from its height in 2010. Industry players manufacture UAVs, or drones, which are remotely piloted or autonomously operated aircraft. From its inception, the industry has primarily relied on military funding for the development and procurement of its aircraft. Prior to the five-year period, increased military use of drones for antiterrorism, combat and surveillance missions led to a surge in demand for industry products and funding for their further development. However, as US combat operations in the Middle East began to wind down and rising federal debt levels forced the government to reduce spending, federal funding for defense declined, and the Department of Defense (DoD) UAV budget shrank. Therefore, in the five years to 2015, industry revenue is expected to decrease at an annualized rate of 8.2% to $3.3 billion.
Defense Spending Drives Demand
The DoD accounts for the vast majority of spending on industry products and development, with nearly 90.0% of industry revenue coming from the US Air Force, Army, Navy and Marine Corps. Since UAVs can be operated remotely or function autonomously, they reduce the risk of military casualties for troops that would otherwise have their boots on the ground or fly the required missions themselves. In addition, because there is no pilot in the aircraft, drones are typically less expensive to operate and can loiter in the air relatively undetected, making them ideal for surveillance, reconnaissance and strike missions. As a result, when the United States began its wars and antiterrorist operations in the Middle East, the Pentagon poured billions of dollars into the industry, and revenue skyrocketed 33.9% in 2010 alone. In particular, the military prioritized acquisition of
1 Industry Overview information obtained from IBISWorld Industry Report OD4424 - Unmanned Aerial Vehicle Mfg. in the US, December 2015.

Sample Company Inc. 4 0 9 A V a l u a t i o n
Page 18
new UAV platforms. This included the medium- to high altitude, long-endurance Gray Eagle and Reaper surveillance and strike drones, as well as the smaller Shadow and Raven drones that are used at a more tactical level. The military also stepped up the development and procurement of the high-altitude Global Hawk surveillance UAV.
However, the boom in military spending eventually came to a halt. The combination of reduced combat operations in the Middle East and Congress’s attempts to cut the deficit (including sequestration) caused military spending to decline, with federal funding for defense expected to fall an annualized 4.9% to $597.5 billion in the five years to 2015. As US forces withdrew from Iraq in 2011 and operations in Afghanistan began to wind down, the operational need for UAVs began to slowly decline. Moreover, years of drone procurement left the military with enough UAVs to meet its current need, further reducing UAV procurement amid the recent budget cuts. As a result, industry revenue began to decline in 2011 and continued to do so through 2014, when it plunged 22.1%. Nonetheless, the military has continued to spend billions on development of UAVs, including the Global Hawk, stealth combat and surveillance drones, aircraft carrier launched drones and many other initiatives, including top-secret projects. Combined with recently increased drone use over Iraq, Syria and Yemen, this is expected to help industry revenue grow 6.2% in 2015.
The Civil and Export Market
The civil and commercial applications of UAVs seem unlimited, with new platforms being developed each year. Applications include border enforcement, humanitarian relief, search and rescue, scientific research, meteorology, firefighting, precision agriculture, infrastructure surveying, police surveillance, freight delivery and communication signals relaying. However, stringent regulations have prevented the domestic civil and commercial market for drones from taking off. Currently, regulators fear drones can’t adequately interact with other aircraft and objects, heightening the chances of a collision or crash. As a result, drone operators have to obtain special authorization and certification from the Federal Aviation Administration (FAA) to operate UAVs in US airspace, and heavy use is limited to recreational purposes. However, in 2012, Congress ordered the FAA to create rules for the integration of UAVs into domestic airspace by 2015. As a result, in early 2015 the FAA submitted a notice of proposed rulemaking outlining how it intends to regulate small UAVs. The rules include the restriction of UAV flights to daytime and within the line-of-sight of drone operators, in addition to requiring pilot certification. However, it will be some time until these proposed regulations are finalized. Until then, the use of UAVs, especially for commercial purposes, will remain limited to the few companies that get special permission. For instance, in 2014, BP became the first company to domestically use UAVs for commercial purposes after the FAA allowed it to use small drones to monitor its Alaskan oil pipelines.
Conversely, regulations covering recreational drones are more laidback. Currently, hobbyist or recreational use of UAVs is allowed as long as the UAV is flown at an altitude of less than 400 feet, is within sight of the operator and stays clear of people,

Sample Company Inc. 4 0 9 A V a l u a t i o n
Page 19
stadiums, airports and other objects. Less restrictive regulations and the introduction of relatively inexpensive drones has led to a surge in consumer drone sales. This has led to many issues, such as drones crashing into streets, drones coming near airliners and privacy concerns. Moreover, because of lower barriers to entry and the importance of prices, most consumer drones have been imported instead of produced domestically.
As in the domestic civil market, strict regulations have prevented the industry from entering the export market in any significant way. Military UAVs, which dominate the industry, fall under the US Munitions List, a list of articles, services and related technology designated as defense- and space-related by the government. The export of items under the list requires special State Department approval, making international sales more difficult for the industry. Moreover, many UAVs fall under the Missile Technology Control Regime (MTCR), which is a grouping of 34 countries designed to prevent the proliferation of systems capable of delivering weapons of mass destruction. The regime requires State and Commerce Department authorization to export UAVs that can fly farther than 300 kilometers and carry more than 500 kilograms. Under MTCR guidelines, export of UAVs carries a “strong presumption of denial” of an export license. As a result of these restrictions, the industry has practically been locked out of the export market. However, in early 2015, the Obama administration loosened export restrictions, with new rules allowing the export of UAVs, even armed ones, to allies through government programs and with the recipient nation’s agreement to “end use assurances,” to quote MTCR regulations.
Profitability and Other Trends
Due to a recent reduction in government funding for UAV projects, industry profit is expected to remain nearly stagnant, declining slightly from 11.7% of revenue in 2010 to 11.6% in 2015. Recent declines in the world price of aluminum and the price of semiconductor and electronic components (all major manufacturing inputs) have relieved some margin pressure. On the other hand, despite reduced defense spending, industry employment has remained more level due to high demand for technical staff and the growth of the commercial drone segment. Therefore, in the five years to 2015, industry employment is expected to increase an annualized 1.4% to 8,302 workers. The rise of commercial UAV startups is also expected to cause the number of industry enterprises to increase an annualized 3.2% to 97 over the five-year period.

Sample Company Inc. 4 0 9 A V a l u a t i o n
Page 20
Industry Outlook
Over the next five years, the Unmanned Aerial Vehicles (UAV) Manufacturing industry is anticipated to slowly recover from recent declines. In the near future, the industry will continue to come under pressure from reduced defense spending. However, the military is still anticipated to invest substantial resources into UAV projects, with spending on drones expected to increase over the five-year period. Moreover, as new regulations are established, the domestic market for drones is finally projected to take off in a substantial manner. Lastly, operators will look to offset uncertain military demand at home with foreign sales. Therefore, in the five years to 2020, industry revenue is forecast to climb an annualized 5.8% to $4.3 billion.
Economic Overview2
In its January 12, 2017 release, the Federal Reserve Bank of San Francisco (the "FRBSF") stated the following:
Recent data confirm that the economy has picked up from its modest pace of the first half of 2016. Indeed, in the third quarter of 2016 GDP growth was revised up from an annualized rate of 3.2% to 3.5%. This rapid pace in part reflected transitory factors such as inventory accumulation and agricultural exports. Going forward, GDP growth is likely to remain for some time a bit above its long-run trend of 1½% to 1¾%. The fundamentals of consumer spending remain healthy, including solid income growth and strong household balance sheets. And business capital spending is poised to rebound from its weak pace of the past several years.
Employment gains remain solid. Nonfarm payroll employment rose by 156,000 jobs in December. Unusually cold weather in many parts of the country appear to have held down those job gains somewhat. However, even without controlling for weather, the pace of gains remains well above the “breakeven” level needed to absorb new entrants to the labor force, which we estimate at roughly 80,000 new jobs on average per month.
The labor market remains near its sustainable, full employment level. The unemployment rate in December ticked up to 4.7%, a touch below our estimate of the natural rate of unemployment of 5%. The December unemployment rate was the lowest end-of-year rate since 2006.
Inflation remains below the Federal Reserve’s 2% objective, but has been gradually increasing towards the target rate since early 2016. Overall consumer prices, as measured by the price index for personal consumer expenditures, were 1.4% higher in November than a year earlier. Core consumer prices, which strip out volatile movements in energy and food prices, were 1.6%
2 Economic overview information obtained from - http://www.frbsf.org/economic-research/publications/fedviews/2017/january/january-12-2017/
Sample Company Inc. 4 0 9 A V a l u a t i o n
Page 21
higher. With a tight labor market and the waning effects of past energy price declines, we expect overall and core consumer price inflation to run just a shade below 2% this year.
Interest rates have risen sharply since the election in early November. In addition, the Federal Open Market Committee as widely expected raised its target for the federal funds rate at its December meeting. At the post-meeting press conference, Federal Reserve Chair Yellen noted that the decision to raise the fed funds target was “a reflection of the confidence we have in the progress the economy has made and our judgment that progress will continue.”
There is considerable uncertainty about the scope of policy changes that might be implemented under the incoming administration and about their effects on the Federal Reserve’s dual-mandate objectives of maximum employment and price stability. Of particular focus are possible changes in Federal tax and spending policy.
Federal revenues fell short of federal outlays in 2015, leaving a deficit of about 2½% of GDP. There are conflicting political pressures that could influence the path of future government spending. On the one hand, there is some desire to restrain spending in order to keep the budget deficit down. On the other hand, there is some desire to increase military and infrastructure spending, while an aging population will put upward pressure on Social Security and Medicare spending.
Federal spending as a share of GDP typically goes up in recessions and stabilizes or falls in expansions. That was particularly true in the past decade. The Great Recession of 2007-09 lowered GDP deeply, and, to help cushion the downturn, the government increased spending under the 2009 American Recovery and Reinvestment Act. Since 2010, the spending share has fallen as the economy has grown and the temporary stimulus package ended. In addition, budget caps implemented in 2011 have constrained spending. Given the competing political pressures, our forecast assumes that the path of overall federal spending remains unchanged although there may be shifts in composition.
Federal revenue as a share of GDP typically goes down in recessions and rises in expansions. For example, with a progressive tax system, the average tax rate falls when income falls. As with spending, this pattern was especially pronounced in the Great Recession. Revenues as a share of GDP are currently close to their average levels over the past few decades. Our forecast assumes that there will be reductions in individual and corporate taxes amounting to about 1 percent of GDP.
All else equal, tax cuts boost household and business income. Although the details of the tax cut matter, a plausible estimate is that desired spending may rise by perhaps 0.6 percent of GDP. (Households and businesses will try to save the rest.) However, because the economy already is near full employment, this increase in desired spending likely will be dampened somewhat by higher interest rates and a stronger dollar. On balance, we expect that tax cuts will raise the level of GDP by a total of about 0.4%. Since it is likely to take time for the legislation to be passed and for the increase in spending to occur, we expect that tax changes will boost our growth forecast by 0.1% to 0.2% for the next few years.

Sample Company Inc. 4 0 9 A V a l u a t i o n
Page 22
B. VALUATION METHODOLOGIES AND ASSUMPTIONS
Today, most financial analysts rely on three commonly used methods for estimating the value of a company. These include:
The asset or cost method
The market method
The income method
In addition, some analysts utilize a hybrid methodology that combines more than one of the above methods.
Valuation Strategies
To establish an estimated fair market value for Sample Company Inc. Economics Partners reviewed each methodology available for the valuation, and then weighted each approach based on the perceived reliability of inputs and assumptions used in each valuation. Using this strategy, Economics Partners utilized the market method to estimate the fair market value of the Company's total invested capital. Lastly, Economics Partners used an option valuation model to allocate the Company's total equity value to the various classes of shares and derivatives.
Asset or Cost Method
The asset or cost method estimates the fair market value of a business by modifying the asset and liability balances on their balance sheet to the Company's corresponding fair market value. This method is usually derived by first adding up the individual values of a Company's primary assets. The fair market value is then defined as the sum total of the Company's assets minus the sum total of their corresponding liabilities.
As a practical matter, the net/underlying assets method has numerous variations. By inherently assuming that the Company will continue to operate in the foreseeable future, this method utilizes a replacement cost model as a reasonable measure of value. The method operates under the basic assertion that the value of a business should be consistent with the replacement cost of the Company's assets.
Thus, if a Company’s existing assets deliver fewer benefits than new ones as a consequence of functional obsolescence or wear and tear, the value of these assets can be adjusted accordingly. For these reasons, the net/underlying assets method is typically used when determining the value of capital-intensive businesses or holding companies. Consequently, the net/underlying assets method was considered inappropriate for this analysis.

Sample Company Inc. 4 0 9 A V a l u a t i o n
Page 23
Market Method
The market method to business valuation is historically rooted in the economic principles of competition that suggests that in a free market, buyers will not pay more for a business, and the sellers will not accept less, than the price of a comparable business enterprise. It is similar, in many respects, to the “comparable sales” method that is commonly utilized in real estate appraisals. In the business valuation arena, the market price of the stocks of publicly traded companies engaged in the same or a similar line of business, whose shares are actively traded in a free and open market, can be used as a valid indicator of value when the transactions in which stocks are traded are sufficiently similar to permit meaningful comparison.
Likewise, indicators of value based on specific financial variables can also be extracted from comparable companies. Using these parameters, appropriate valuation multiples can then be developed and applied to reflect significant differences and divergent levels of risks in contrast to the compared companies. The valuation process is also subject to the specific source of the analyzed data. For example, if the multiples applied are generated from actively traded public companies, the resultant value is defined as a marketable, non-controlling interest value. On the other hand, if the multiples are produced from transactional data, the resulting value is defined as a controlling interest value. The resulting multiples are then applied to the relevant financial metrics of the subject company under the guideline public company and guideline transaction methods.
According to AICPA business valuation guidelines, a recent securities transaction is also a relevant input for calculating the company’s equity value. Additionally, for financial reporting purposes, fair value is normally defined as the amount at which an asset can be sold or purchased in a current transaction between willing participants (excluding a forced or liquidation based sale). An investor buying the recent round of preferred stock constitutes a willing buyer and the company issuing it is a willing seller. Therefore, the recent rounds of financing can be used as an input in determining the value of Sample Company Inc. under the market approach to valuation. Thus, the Backsolve Method was also chosen to evaluate the transaction of Sample Company Inc. Preferred Stock because it is viewed as one of the most reliable indicators of value for privately-held companies.
Based on discussions with Management, the recent Series B Preferred round of financing included a number of strategic investors. According to management, these investors were eager to place themselves in a favorable position within the industry, given its significant upside potential. Similarly, the Series B round was led by an investment from Large Finance Company which established the agreed upon terms for the remaining investors. Given the strategic considerations of the Series B investors, we felt that it would not be appropriate to rely entirely on this round of financing to determine the fair market value of the Company. In addition, it is our understanding that the Series Seed and Series A investors were comprised primarily of smaller investors that were primarily concerned with economic returns. Management also indicated that the terms of the Series A and Series Seed financings were heavily negotiated. As such, we also considered the total equity value concluded in the report performed by XYZ

Sample Company Inc. 4 0 9 A V a l u a t i o n
Page 24
Valuation Company following the Series A investment. This was ultimately weighted at 50% in our analysis in addition to the concluded value for the recent Series B investment. For additional information, please refer to Exhibits A & B.
Income Method
The income method of business valuation is an estimate of the present value of the estimated future monetary benefits to the Company. Consequently, this method requires a projection of the cash flows that the business is expected to produce. Using the discounted cash flow method (“DCF”), these cash flows are subsequently converted to their present value using a specific discount rate that factors in the time value of money and any measurable level of risks associated with the business. Lastly, depending upon the actual adjustments that are made to the projected cash flows, the resultant interest value may represent either a controlling value or a non-controlling value.
Economics Partners deemed that the income or DCF valuation methodology would not be appropriate in this case, given the Company's development stage and the unpredictable nature of its future cash flows.
Market Method - Backsolve Method
In the AICPA practice aid for Valuation of Privately-Held-Company Equity Securities Issued as Compensation, the Backsolve Method is accepted as a method that derives the equity value for the company from a transaction involving the company’s own securities. The rights and preferences of each class of equity, market interest rates, industry sector volatility data, and an estimated time period to a liquidity event are all considered and included in an option pricing model.
The model then allows for an isolated analysis of the Company’s most recent round of equity financing. An excel solver function is used, which adjusts the input for total equity value until the implied value of the most recent round stock equals its original issue price. As such, the model solves for the total equity value that was implied by the price paid in the transaction, under an option pricing framework. After the implied total equity value is determined, the option pricing model consequently produces relative values for other securities in the Company's capital structure.
Unlike traditional post-money valuations, the Backsolve Method considers the economic rights and preferences unique to each class of stock. We note that post-money calculations assume that each class of stock is worth the same amount, whereas the option pricing model considers differing economic rights in assigning less value to junior securities such as Common Stock. The derived total equity value for the Company can then be used to compute an implied enterprise value for the Company. For additional information, please refer to Exhibit B.

Sample Company Inc. 4 0 9 A V a l u a t i o n
Page 25
Determination of Company Value
After weighting the most recent preferred rounds of financing at 50% each, the Market Valuation Methodology produced an approximate Equity Value of $54.89 million (please refer to Exhibit A). Given that, under valuation methodology, fair value techniques should maximize the use of relevant observable inputs (such as the Backsolve Method) and minimize the use of unobservable inputs, we weighted the Market Valuation Methodology at 100%. For additional information, please refer to Exhibit A.
Sample Company Inc. 4 0 9 A V a l u a t i o n
Page 26
C. VALUING THE SUBJECT SECURITY
Most financial analysts rely on four commonly used methods for allocating value on an enterprise level to individual equity securities. These methods include the:
Probability-weighted Expected Return Method (PWERM);
Option Pricing Method (OPM);
Current Value Method (CVM); and the
Hybrid Method.
Probability-weighted Expected Return Method (PWERM)
Under a PWERM, the value of the underlying equity securities is estimated based on an analysis of specific possible future liquidity outcomes. In this method, the share value is determined based on the probability-weighted present value of potential scenarios. The PWERM is typically used when a company can reliably predict specific outcomes, as can be the case when approaching an exit and when the probability of each potential exit scenarios can be reasonably assessed. Similarly, the limitations of this approach lie in reasonably assessing the likelihood of each potential exit scenario for a subject company.
Option Pricing Method (OPM)
The OPM treats common and preferred stock as call options on the Company’s Equity Value, with exercise prices based on the equity breakpoints of the various share classes. The method usually uses a modified Black-Scholes analysis to price these call options. The OPM assumes a distribution of potential outcomes and assigns current value based on the current capital structure, including on a pro forma basis any shares that are reasonably expected to be granted in the near term. Although the actual distribution of possible outcomes is unknown, the assumptions used under black Scholes calculations are expected to give reliable estimates on security value while taking into account the option-like payoffs of the various shares.
This method is extremely valuable when valuing different share classes with unique economic rights as it allocates value to the various share classes based on these unique rights and preferences.
Current Value Method (CVM)
In the AICPA practice aid for Valuation of Privately-Held-Company Equity Securities Issued as Compensation, the CVM of allocation is based on first estimating equity value, assuming immediate sale of the enterprise, and then allocating that value to the various

Sample Company Inc. 4 0 9 A V a l u a t i o n
Page 27
series of stock based on the series’ liquidation preferences or conversion values, whichever would be greater. When a series’ liquidation is “in the money” it is counted as converted to common stock at the time of transaction, and series’ liquidation that is “out of the money” is assigned a value with regards to its liquidation preference.
An advantage of this method is that it doesn’t require assumptions about the future exits of the company and is very intuitive. A disadvantage to the CVM is that it is not forward looking and therefore does not account for upside potential for each class of equity. For this reason, the CVM is typically only used either when a dissolution event is imminent or when there is only one class of stock. When there are multiple classes of stock with different economic rights and a dissolution event is not imminent, the ACIPA guide recommends a forward-looking method that considers a potential distribution of outcomes (e.g. the OPM or the PWERM).
Hybrid Methods
The hybrid method is most often applied as a hybrid between the PWERM and OPM, estimating the probability-weighted value across multiples scenarios while using the OPM to estimate the allocation of value within one or more of the scenarios. According to AICPA Guideline section 6.49, the hybrid method can be a useful alternative to explicitly modeling all PWERM scenarios in situations when the company has transparency into one or more near-term exits but is unsure about what will occur if the current plans fall through. In this case the OPM scenario is used to assign value on a “going concern” basis if none of the discrete scenarios were to occur.
Selected Method - Option Pricing Methodology
Given that there are multiple classes of equity, we utilized the Option Pricing Model in this analysis. Please refer to Exhibit E. This methodology models the value of the various components of an entity’s capital structure as a succession of call options on the proceeds expected from the sale of the business or the pending liquidation of the Company's assets at some future date. Furthermore, this model also treats the fair market value of a security as a function of the current fair market value of the aggregate equity and debt and assumptions based on the securities’ rights and preferences through the use of an option model, such as the Black-Scholes formula shown here:
C0 = S0N(d1) – Xe -rN(d2)
Where:
d1 (ln(S0/X) + (r + σ2)T)/σ√T and d2 = d1 – σ√T

Sample Company Inc. 4 0 9 A V a l u a t i o n
Page 28
C0 Current call option value;
S0 Current stock price;
N(d) The probability that a random draw from a standard normal distribution will be less than d;
X Exercise price;
r Risk-free rate;
T Time to maturity of option (years);
σ Standard deviation of the annualized continuously compounded rate of return.
The Black-Scholes model supports the premise that an investment in an underlying security that is financed with debt results in a payoff stream that is equivalent to the payoff stream of an option on the security. If the values for the two positions were different, arbitrage would be possible. Hence, the Black-Scholes model provides a reasonable estimate of the option's value.
In addition, the valuation of the Subject Security is rooted in the long-standing tenets of option-pricing theory. In short, the Subject Security is basically a call option on the combined debt and equity of the business with an exercise price equal to the principal due to the debt holders plus the liquidation preferences of the preferred securities.
Option Pricing Method Explanation
Our application of the Black-Scholes Option Pricing Model was designed around the following steps:
1. Determine the different levels of equity value (breakpoints)
This step consists of determining different levels of Equity Value, called breakpoints (also known as “waterfall” distribution). Each consecutive breakpoint represents an incremental claim on Sample Company Inc. Equity Value by a certain class of shareholders/option holders triggered by their respective liquidation, participation, and/or conversion rights.
2. Determine the proportion of incremental equity value to be distributed
After calculating the breakpoints, the proportion in which incremental Equity Value would be distributed between consecutive breakpoints is determined.

Sample Company Inc. 4 0 9 A V a l u a t i o n
Page 29
3. Determine the incremental equity value of each option
Each consecutive breakpoint is considered a strike price in the call options on the Company’s Equity Value. Using the Black-Scholes Option Pricing model, with other inputs as discussed above, the incremental value of each option is calculated.
4. Distribute the incremental equity value
The incremental value of each call option is distributed among different classes of shareholders based on their respective distribution proportion as calculated in Step 3.
Application to the Subject Security
Using the option-pricing model, several input parameters were used to compute the Subject Security's value. This includes the value of the Company’s underlying assets; the collective liquidation preferences of the preferred equity (in the form of the exercise prices); the volatility of the underlying assets; the risk-free rate; as well as the estimated time until the expiration of the option. As of the Valuation Date, Economics Partners assumed the following values:
Indicated Value of Allocated Capital: Approximately $54.89 million on a marketable, majority-interest basis;
Risk Free Rate: Approximately 1.47%, based on the effective 3-year U.S Treasury bond yield as of the Valuation Date;
Volatility: Approximately 55.0%, based on the 75th percentile historical volatility of the comparable companies' common stock.
Time to Liquidity: Approximately three years estimated to a liquidation event based on a weighted average consideration of the Company’s most likely exit prospects. On a going concern basis, we considered a five-year term to exit. However, we note that companies in this stage of development tend to fail at a much higher rate than mature companies given a dependence on financing. We assigned a probability of approximately 55% that the Company would survive through the traditional 5-year exit assumption, and also considered a 45% likelihood that the Company may not be able to successfully raise the additional funds necessary to stay in business. The 45% likelihood was used based on a Kaufmann Foundation study suggesting that steed stage and early stage companies have an average failure rate of approximately 45%.

Sample Company Inc. 4 0 9 A V a l u a t i o n
Page 30
Summary of the Capital Structure
As of the Valuation Date, the Company’s capitalization included the following securities:
Series B Preferred Stock
Sample Company Inc. had approximately 14.42 million outstanding shares of Series B Preferred Stock with a liquidation preference of $1.7851 per share, plus any declared but unpaid dividends. Shareholders had the same voting rights as Common Stock shareholders on an as-converted basis. As of the Valuation Date, the stock was convertible into Common Stock at a 1:1 ratio.
Series A Preferred Stock
Sample Company Inc. had approximately 13.44 million outstanding shares of Series A Preferred Stock with a liquidation preference of $1.1157 per share, plus any declared but unpaid dividends. Shareholders had the same voting rights as Common Stock shareholders on an as-converted basis. As of the Valuation Date, the stock was convertible into Common Stock at a 1:1 ratio.
Series Seed Preferred Stock
Sample Company Inc. had approximately 6.17 million outstanding shares of Series Seed Preferred Stock with a liquidation preference of $0.4349 per share, plus any declared but unpaid dividends. Shareholders had the same voting rights as Common Stock shareholders on an as-converted basis. As of the Valuation Date, the stock was convertible into Common Stock at a 1:1 ratio.
Common Stock
Sample Company Inc. had approximately 17.65 million outstanding shares of Common Stock. Shareholders had rights to dividends as declared by the Board of Directors, but not before the full payment of dividends to all Preferred Stock shareholders. Shareholders of the Common Stock had full voting rights.
Options on Common Stock
As of the Valuation Date, Sample Company Inc.. had approximately 4.17 million options outstanding on Common Stock. Additionally, there were approximately 3.38 million options on Common Stock to be issued in the near future with a strike price equal to the fair market value of the Subject Security as determined by this report. As per paragraph 6.35 of the AICPA practice aid, such options should be included in the option pricing method.

Sample Company Inc. 4 0 9 A V a l u a t i o n
Page 31
Liquidation Preferences
In the case of a qualifying liquidation event, the above referenced securities share in the liquidation proceeds in the following manner:
1) Prior and in preference to any other equity security, the holders of the Series B, Series A & Series Seed Preferred Stock are entitled to receive an amount equal to $1.7851, $1.1157 & $0.4349 per share, respectively and on a pari-passu basis, plus any declared but unpaid dividends.
2) Upon payment of above, any remaining proceeds would be shared ratably among the holders of the Common Stock. 3) The holders of the Series B, Series A & Series Seed Preferred Stock could elect to forego their preference payments and
convert into Common Stock if such conversion results in higher proceeds.
Adjustments for Lack of Marketability
In general, the value of a Company's equity securities typically requires an adjustment to account for the security’s lack of a readily available market in which it can be sold. In addition, practical evidence suggests that the discount for the lack of marketability (of an unregistered, closely held, non-controlling interest) should take into account financial risks, performance issues, resale restrictions, and other potential liabilities. It should also be noted that the Company’s Common Stock and other equity securities have specific restrictions regarding their sale and transferability. Likewise, the Company’s closely held nature and restrictions on its equity securities could make an investment in the Company somewhat undesirable in contrast to investments in otherwise comparable publicly traded securities. These factors limit the potential market for the Company, thus limiting the liquidity of the securities.
Actual evidence of discounting for lack of marketability can be found in private placements of stock by private companies that afterwards went through an IPO of their stock. As a result, the difference between the price at which the privately placed stock was sold and the price at which the stock was later sold to the public (in the IPO) is commonly used to determine the specific discount for a lack of marketability. As a practical matter, there are two factors that tend to affect the size of the discount to cover a lack of marketability: (1) factors that impact the length of the holding period required to locate a buyer and close a sale and; (2) factors that impact the level of risk faced per unit of time during this holding period. In fact, the risk per unit of time is a commonly used measure of volatility of an investment’s total return (i.e., both dividends and capital appreciation). It's also a common measure of the probability that an investment’s actual return will differ from its expected return.

Sample Company Inc. 4 0 9 A V a l u a t i o n
Page 32
In general, the studies indicate that the greater the risk that an IPO will not take place or will not take place at an anticipated price the lower the stock price in a pre-IPO transaction.
The IRS Valuation Guide for Income, Estate and Gift Taxes, Valuation Training for Appeals Officers acknowledges the relationship between value and marketability, stating: “Investors prefer an asset which is easy to sell, that is, liquid.” Additionally, the AICPA Accounting & Valuation Guide, Valuation of Privately-Held-Company Equity Securities Issued as Compensation, states that “Estimating a discount for lack of marketability is challenging, and (no one method) is completely satisfactory in all respects. All put-based methods share the conceptual shortcoming that purchasing a put is not equivalent to purchasing marketability alone because it also limits the downside risk while leaving the upside potential…The strength of these put-based methods is that they appropriately capture the relationship between the duration of the restriction (time) and risk (volatility), and they have been correlated with the limited observable market data.”
Ultimately, a quantitative analysis was performed to determine the appropriate discount for lack of marketability for the various analyses in this report. We used the 75th percentile volatility of the comparable companies, which is 51.0%. (see Exhibit C).
The cost of a synthetic put option was calculated to reflect the cost of ensuring that the current valuation of a security would be realizable at the time of eventual liquidity. This would, in theory, eliminate the risk due to lack of marketability and the cost would reflect the appropriate discount. For more information, see Exhibits G & H.
Based on this analysis, we estimated an approximate discount of 37.00% for lack of marketability for Sample Company Inc. Common Shares. For additional information, please refer to Exhibits F, G, & H.
The resulting figure was compared to historical studies of lack of marketability discounts (such as restricted stock studies and pre-IPO studies), and found to be reasonable and consistent.

Sample Company Inc. 4 0 9 A V a l u a t i o n
Page 33
D. PROFESSIONAL QUALIFICATIONS
Internal Revenue Bulletin states: “The final regulations also clarify that significant experience generally means at least five years of relevant experience in business valuation or appraisal, financial accounting, investment banking, private equity, secured lending, or other comparable experience in the line of business or industry in which the service recipient operates.” The signor of this report meets the experiential requirements as outlined by the IRS in the previous sentence.
Bryson Lord
A Managing Director of Economics Partners and has over thirteen years of experience in finance and accounting. He started his career at Arthur Andersen in Washington DC. He then implemented two Sarbanes-Oxley certification programs, one at Nextel Communications and the other at Harcourt Education. Bryson then returned to business school, and upon graduating, worked as an investment banker for Bank of America Merrill Lynch in the U.S. and Latin America financial institutions groups. Most recently, he was a Senior Principal at a boutique advisory firm that assists small and medium sized businesses obtain growth capital. He has raised over $3.7 billion in public and private capital offerings. Bryson received a B.S. in Accounting and an M.B.A., both from BYU. He is also a Certified Public Accountant (CPA) and holds the Accredited in Business Valuation (ABV) designation sponsored by the American Institution of Certified Public Accountants (AICPA).
Trent Read
A Managing Director of Economics Partners, Trent has been a CFO of two private equity-backed companies that ranked on Inc. Magazine’s list of fastest growing companies in the country; which he helped guide from their infancy to full liquidity events. He began his career as an Analyst in investment banking with Deutsche Bank helping many consumer and business services companies with public and private equity and debt capital raises as well as mergers and acquisitions. He was then a Senior Financial Analyst for a $200 million business unit of Honeywell. He then returned to investment banking as an Associate and then Vice President at Wachovia Securities and Sagent Advisors respectively. He worked with media, digital media, telecommunications, software/SaaS, and internet infrastructure companies on transactions that varied from multi-billion dollar LBOs to small growth equity capital raises. He was the CFO of OrangeSoda, an online marketing business, which he led to a sale to Deluxe Corp. and then Goal Zero. Trent received his B.A. and M.B.A. from BYU where he was a Hawes Scholar.
Dan Gore
A Senior Analyst of Economics Partners, Daniel joined the firm in August of 2015. Prior to joining Economics Partners, Daniel started his career in valuation with Andersen Tax where he worked in the San Francisco office for two years. Daniel has performed valuations of closely-held companies, common stock, intangible assets, and debt instruments for tax and financial reporting purposes. Daniel received his B.S. in Business Management with an emphasis in Finance Magna Cum Laude from BYU.

Sample Company Inc. 4 0 9 A V a l u a t i o n
Page 34
E. INFORMATION SOURCES AND LIMITING CONDITIONS
Information Sources
During the development of this valuation, Economics Partners relied on information provided by the Company's Management and/or information acquired from publicly available sources. In addition, some of Economics Partners assumptions and conclusions were based on reasonable projections pertaining to future events and/or future financial performances. Consequently, actual and/or future events or results may differ significantly. The principal information sources used in performing this analysis included:
Discussions and correspondence with the Company Management;
Company historical financials and performance as of the Valuation Date;
Company projections;
The Company's capitalization table (as of the Valuation Date);
Company marketing, investment, and business development related materials;
Industry research and data pertaining to the financial performance, value, and future outlook of the Company;
General market data that could affect the financial performance, value, and future outlook of the Company and;
Publicly available information (including financial data) for existing companies that were regarded, in some useful manner, as comparable to the Company.
Economics Partners inherently depended on the completeness and accuracy of the information described above. While Economics Partners did not conduct an independent verification of any information obtained from the Company or other publicly published sources, the information appears to be consistent with current standards of reliability and completeness.
Furthermore, Economics Partners has inquired of Management as to whether there have been any events ("Post Valuation Events") that have occurred from the Valuation Date to the date this report was issued that would provide useful information to the users of this report. Management has affirmed that there have not been any material Post Valuation Events.

Sample Company Inc. 4 0 9 A V a l u a t i o n
Page 35
Statement of Limiting Conditions
The value conclusions related to the Subject Security specified in our appraisal report (the “Analysis”) are governed by the following limiting conditions:
1. No investigation of the legal description or matters, including title or encumbrances, will be made, and the owner’s claim to the Subject Security is assumed to be valid and marketable. Further, unless otherwise specifically indicated, we have made the following assumptions: (i) the Subject Security is free and clear of any liens or encumbrances; (ii) the Subject Security meets full compliance with all applicable federal, state, and local zoning, as well as use, environmental, and similar laws and regulations; and (iii) all licenses, certificates, consents, or other legislative or administrative authority from any local, state, federal government, or private entity have been or can be obtained or renewed for any use on which the value conclusion is based in the Analysis.
2. Economics Partners, LLC (“Economics Partners”) has relied upon information furnished by others, which is believed to be
reliable. We have not independently verified the accuracy or completeness of the information. 3. During the course of our analysis, we were provided certain financial information, including estimates of cash flow, by
Management. We have not performed an examination, review, or compilation in accordance with standards prescribed by the American Institute of Certified Public Accountants and, therefore, do not express an opinion or offer any form of assurance on the cash flow data or their underlying assumptions.
4. The value conclusions are not intended to represent values for the Subject Security at any date other than the Valuation Date
in the Analysis. We assume no responsibility for changes in market conditions or physical factors that could affect the value of the Subject Security at a later date, or the inability of the owner to sell the Subject Security at the value specified in the Analysis.
5. The Analysis has been prepared solely for the purpose stated, and should not be used for any other purpose or by any other
person/party than to or for whom it is addressed and prepared. Our value conclusions are not intended to represent investment advice of any kind and do not constitute a recommendation as to the purchase price or sale of the Subject Security.
6. Neither the Analysis nor any portion thereof (including, without limitations, any conclusions as to value, the identity of the
appraiser, or the identity of Economics Partners) shall be disseminated to the public or third parties through advertising,

Sample Company Inc. 4 0 9 A V a l u a t i o n
Page 36
public relations, news, sales, mail, direct transmittal, Securities and Exchange Commission disclosure documents, or any other media without the prior written consent and approval of Economics Partners. Possession of the Analysis, or a copy thereof, does not afford the holder the right to publication. The Analysis may not be used without the prior written consent of Economics Partners and the Company.
7. Our engagement team is not required to give further consultation, testimony, or be in attendance in court with reference to
the Subject Security in question or to update any report, recommendation, analysis, conclusion, or other document related to our services, unless additional arrangements are made.
8. Responsible ownership and competent property/asset management are assumed.

Sample Company Inc. 4 0 9 A V a l u a t i o n
Page 37
F. APPRAISAL CERTIFICATION I certify that, to the best of my knowledge and belief: The statements of fact contained in this report are true and correct.
The reported analyses, opinions, and conclusions are limited only by the assumptions and limiting conditions contained
herein, and are my personal, unbiased professional analyses, opinions, and conclusions.
I have no present or prospective interest in the property that is the subject of this report, and no personal interest or bias with respect to the parties involved. I am not aware of any such interest held by Economics Partners or any of the individuals involved in this appraisal.
Our engagement or compensation is not contingent on an action or event resulting from the analyses, opinions, or
conclusions in, or the use of, this report.
Our analyses, opinions, and conclusions were developed, and the report has been prepared, in conformity with the Uniform Standards of Professional Appraisal Practice.
The conclusion of value is based solely on work performed by us or by individuals working under our direction.
[Signature to come in actual report] Bryson Lord Managing Director Tax ID: ##-###### March 28, 2017

Sample Company Inc. 4 0 9 A V a l u a t i o n
Page 38
One West Main Street
American Fork, UT 84003
(650) 260-5092
http://econpartners.com
BUSINESS VALUATION
Fairness Opinions ASC 805
Gift & Estate Tax ASC 350
Annual ESOP IRC 409A
ASC 718 Partnership Buy/Sell
Unique Securities Acquisition Loans
CONSULTING SERVICES
Transfer Pricing Services
Due Diligence Support (Buy-side or Sell-Side)
Custom Business Intelligence Implementation
Evaluation of Corporate Strategic Alternatives
Transaction Consequence Analysis (Accretion/Dilution)