Embed Size (px)
Citation preview

SAMPLE ASSESSMENT TASKS
INTEGRATED SCIENCE ATAR YEAR 11

2014/16002v4
Copyright
© School Curriculum and Standards Authority, 2014
This document – apart from any third party copyright material contained in it – may be freely copied, or communicated on an intranet, for non-commercial purposes in educational institutions, provided that the School Curriculum and Standards Authority is acknowledged as the copyright owner, and that the Authority’s moral rights are not infringed.
Copying or communication for any other purpose can be done only within the terms of the Copyright Act 1968 or with prior written permission of the School Curriculum and Standards Authority. Copying or communication of any third party copyright material can be done only within the terms of the Copyright Act 1968 or with permission of the copyright owners.
Any content in this document that has been derived from the Australian Curriculum may be used under the terms of the Creative Commons Attribution-NonCommercial 3.0 Australia licence
Disclaimer
Any resources such as texts, websites and so on that may be referred to in this document are provided as examples of resources that teachers can use to support their learning programs. Their inclusion does not imply that they are mandatory or that they are the only resources relevant to the course.

1
Sample assessment tasks | Integrated Science | ATAR Year 11
Sample assessment task
Integrated Science – ATAR Year 11
Task 3 – Unit 1
Assessment type: Science Inquiry
Conditions Period allowed for completion of the task: • Part A: Research and investigation planning completed and submitted week 6 (23 marks) • Part B: Conducting investigation, using 3 class periods between weeks 6–7 • Part C: Reporting and writing up of investigation results completed and submitted week 7 (30 marks)
Task weighting 6% of the school mark for this pair of units ________________________________________________________________________________________________________
Investigating vehicle safety design (53 marks)
Secondary safety design features are those that provide increased occupant protection, such as seatbelts, air bags and crumple zones. Investigate one of these features and write a scientific report on your findings.
Part A: 1. Research notes (15 marks)
• research the following safety design features – seatbelts, air bags and crumple zones • use the following to make organised notes about each of the safety design features: definition description operation (how it works, why it works) applications
2. Plan the investigation (8 marks)
• select one of these features to investigate • develop an hypothesis and select independent, dependent and controlled variables in your
investigation • describe in detail the method you will follow when conducting your investigation • propose the way that you will record your data • state how you will process the data to arrive at some conclusions
Part B: 3. Conduct the investigation
• set up equipment required for your investigation • carry out your investigation recording results in an appropriate way

2
Sample assessment tasks | Integrated Science | ATAR Year 11
Part C: 4. Process, evaluate and communicate findings (30 marks)
Write up your investigation as a scientific report including the following: • Introduction – include background information and hypothesis • Materials and Method – list materials, state how you collected your data, how you minimised
the effect of uncontrolled variables, present raw data in an appropriate format • Results – show processing of raw data, identify any outliers, and plot by hand any graphs to
show results • Analysis and Evaluation – describe the trend and pattern in your data, state how your data
relates to your hypothesis, use your knowledge and understanding to explain your results, comment on the reliability and accuracy of the data collected, comment on the reliability of your collection strategy, list at least two (2) limitations in the data collection strategy that may have affected the accuracy of your data, list at least two (2) improvements you could make to the data collection strategy.
• Conclusion – summarise your findings and comment on the validity of the investigation.
3
Sample assessment tasks | Integrated Science | ATAR Year 11
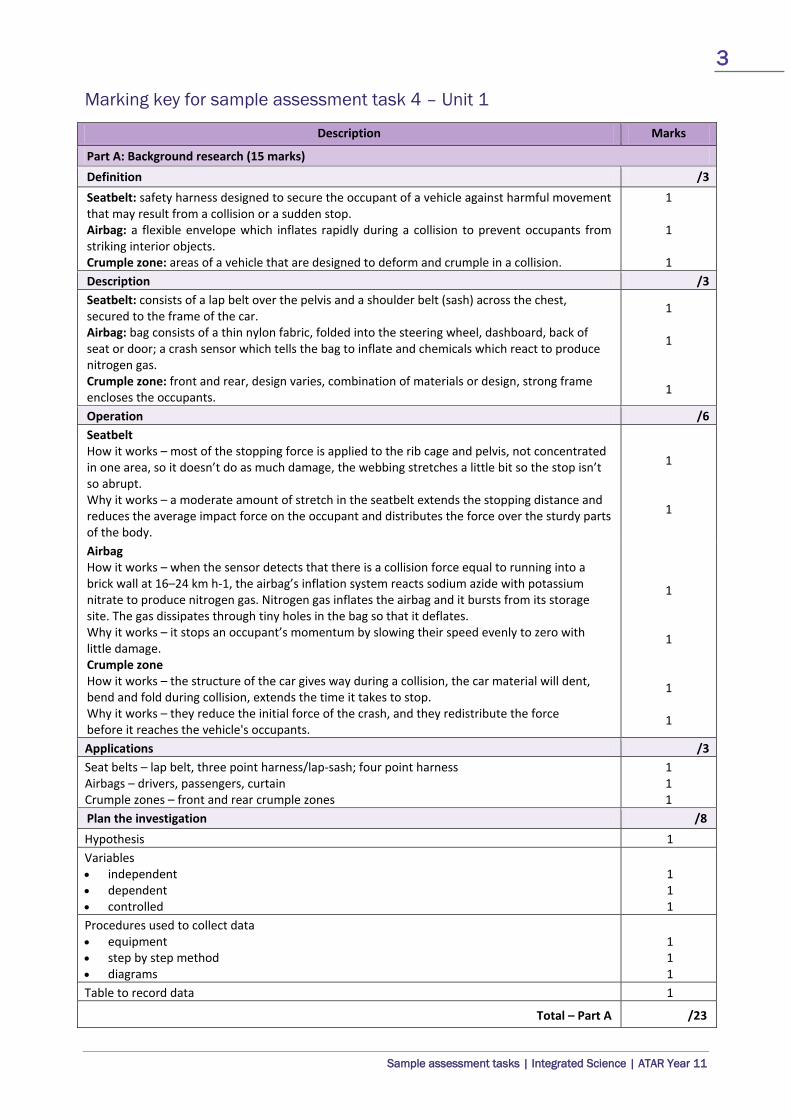
Marking key for sample assessment task 4 – Unit 1
Description Marks
Part A: Background research (15 marks) Definition /3 Seatbelt: safety harness designed to secure the occupant of a vehicle against harmful movement that may result from a collision or a sudden stop. Airbag: a flexible envelope which inflates rapidly during a collision to prevent occupants from striking interior objects. Crumple zone: areas of a vehicle that are designed to deform and crumple in a collision.
1 1 1
Description /3 Seatbelt: consists of a lap belt over the pelvis and a shoulder belt (sash) across the chest, secured to the frame of the car. Airbag: bag consists of a thin nylon fabric, folded into the steering wheel, dashboard, back of seat or door; a crash sensor which tells the bag to inflate and chemicals which react to produce nitrogen gas. Crumple zone: front and rear, design varies, combination of materials or design, strong frame encloses the occupants.
1 1 1
Operation /6 Seatbelt How it works – most of the stopping force is applied to the rib cage and pelvis, not concentrated in one area, so it doesn’t do as much damage, the webbing stretches a little bit so the stop isn’t so abrupt. Why it works – a moderate amount of stretch in the seatbelt extends the stopping distance and reduces the average impact force on the occupant and distributes the force over the sturdy parts of the body.
1 1 1 1 1 1
Airbag How it works – when the sensor detects that there is a collision force equal to running into a brick wall at 16–24 km h-1, the airbag’s inflation system reacts sodium azide with potassium nitrate to produce nitrogen gas. Nitrogen gas inflates the airbag and it bursts from its storage site. The gas dissipates through tiny holes in the bag so that it deflates. Why it works – it stops an occupant’s momentum by slowing their speed evenly to zero with little damage. Crumple zone How it works – the structure of the car gives way during a collision, the car material will dent, bend and fold during collision, extends the time it takes to stop. Why it works – they reduce the initial force of the crash, and they redistribute the force before it reaches the vehicle's occupants. Applications /3 Seat belts – lap belt, three point harness/lap-sash; four point harness Airbags – drivers, passengers, curtain Crumple zones – front and rear crumple zones
1 1 1
Plan the investigation /8 Hypothesis 1 Variables • independent • dependent • controlled
1 1 1
Procedures used to collect data • equipment • step by step method • diagrams
1 1 1
Table to record data 1
Total – Part A /23
4
Sample assessment tasks | Integrated Science | ATAR Year 11
Description Marks
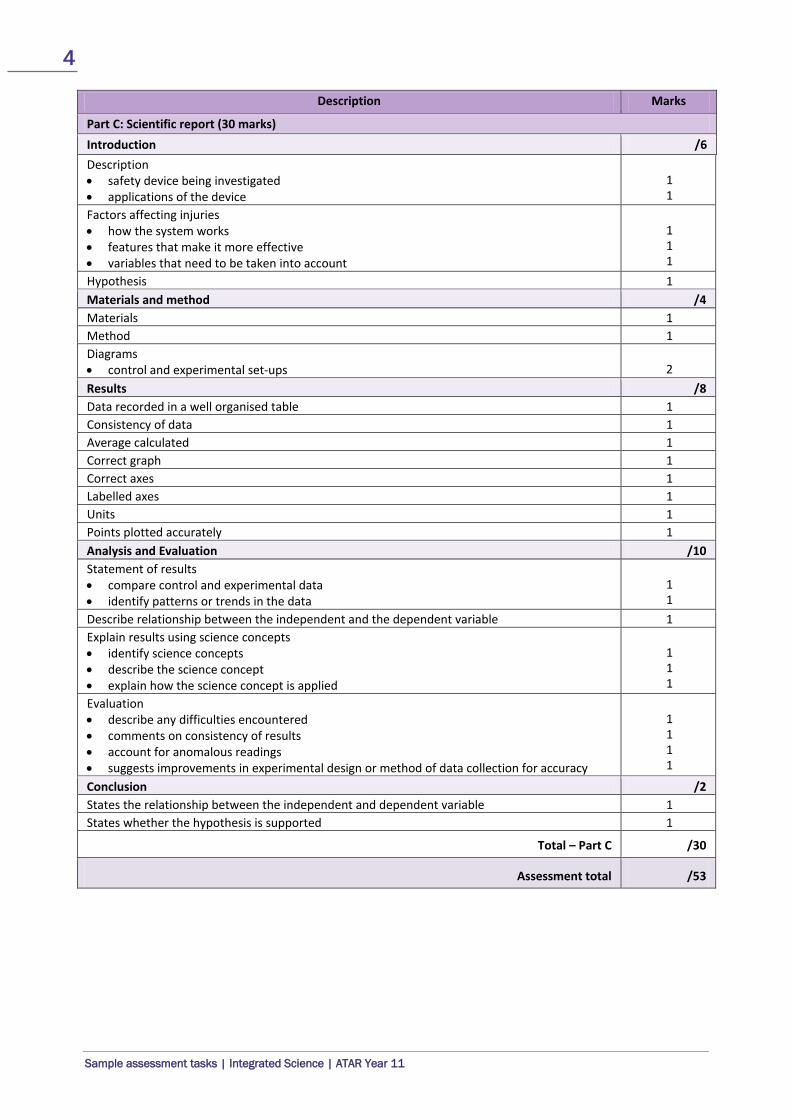
Part C: Scientific report (30 marks) Introduction /6 Description • safety device being investigated • applications of the device
1 1
Factors affecting injuries • how the system works • features that make it more effective • variables that need to be taken into account
1 1 1
Hypothesis 1 Materials and method /4 Materials 1 Method 1 Diagrams • control and experimental set-ups
2
Results /8 Data recorded in a well organised table 1 Consistency of data 1 Average calculated 1 Correct graph 1 Correct axes 1 Labelled axes 1 Units 1 Points plotted accurately 1 Analysis and Evaluation /10 Statement of results • compare control and experimental data • identify patterns or trends in the data
1 1
Describe relationship between the independent and the dependent variable 1 Explain results using science concepts • identify science concepts • describe the science concept • explain how the science concept is applied
1 1 1
Evaluation • describe any difficulties encountered • comments on consistency of results • account for anomalous readings • suggests improvements in experimental design or method of data collection for accuracy
1 1 1 1
Conclusion /2 States the relationship between the independent and dependent variable 1 States whether the hypothesis is supported 1
Total – Part C /30
Assessment total /53
5
Sample assessment tasks | Integrated Science | ATAR Year 11
Sample assessment task
Integrated Science – ATAR Year 11
Task 10 – Unit 1
Assessment type: Extended Response Conditions Time for the task: • Part 1: two lessons to research topic and complete notes • Part 2: one lesson for in class validation – extended response exam-style question Task weighting 5% of the school mark for this pair of units ________________________________________________________________________________________________________ Feral animals in Western Australia Australia’s unique biota has come to be, through adaptation to life on an isolated continent over millions of years. The balance has been interrupted, since settlement by Europeans, and the native flora and fauna now have to compete with introduced plan ts and animals for habitat, food and shelter. In Australia introduced organisms have few natural controls such as predators or disease and conditions which optimise reproduction rates. Part 1: Research notes (8 marks) For the following invasive species, European red fox, cane toad, Lantana, Patterson’s curse/Salvation Jane, use library and internet sources to research the following:
• History: the background to the introduction of the species into Australia • Ecology: habitat and reproductive cycle and conditions required for successful spread • Environmental impact: the effect on native flora and fauna • Distribution: the spread of the introduced species in Australia • Control: strategies for controlling the spread of the introduced species. *Note: all research should be based on Australian information.
Part 2: In-class assessment (33 marks) • You will be given specific examination style questions based on the topic you have researched. • No notes will be allowed for this task.
6
Sample assessment tasks | Integrated Science | ATAR Year 11
Part 2: In-class assessment (33 marks) 1. The cane toad (Bufo marinus) was introduced into Australia in 1935 as a biological control for the
management of sugar cane beetle populations, but it proved ineffective. For the past 80 years, cane toads have been expanding their territory across Australia and are capable of occupying at least the states of Queensland, New South Wales, Northern Territory, Western Australia and Victoria.
a. What steps should have been taken before the cane toad was first introduced in 1935 to
prevent it from becoming a pest? (6 marks) b. Discuss, using examples of successful and unsuccessful biological controls for feral animals, the
kinds of biological controls that might be used to control the cane toad in the future. (14 marks)
2. Lantana is an attractive ornamental plant which was introduced to Australia from Mexico. It is hardy
and drought-tolerant, making it suitable to Australian conditions. Its escape from gardens and establishment as a noxious weed has led to it becoming a serious environmental concern. Discuss the impact lantana has had on native flora and fauna and outline the best strategy to seek effective control of lantana. (13 marks)

7
Sample assessment tasks | Integrated Science | ATAR Year 11
Marking key for sample assessment task 10 – Unit 1
Part 1: Research notes
Description Marks
Appropriate research notes including history, ecology, environmental impact, control for each introduced species
European red fox 1–2 cane toad 1–2 lantana 1–2 Patterson’s curse/Salvation Jane 1–2
Total /8
Part 2: In-class assessment
1. a. What steps should have been taken before the cane toad was first introduced in 1935 to prevent it from becoming a pest?
Description Marks
Research of biological control agent should involve: • specific for pests species only 1
• not poisonous to native fauna 1 • not a competitor of native fauna that have come to rely on introduced species as food source 1 • release in an affected area that is isolated, controlled and quarantined to observe
effectiveness before wide spread release 1–2
• unlikely to introduce an exotic disease 1 Total /6
b. Discuss, using examples of successful and unsuccessful biological controls for feral animals, the
kinds of biological controls that might be used to control the cane toad in the future.
Description Marks
Kinds of biological control: (1 mark name, 1 mark explanation) Predator: to kill and eat pest Parasite: to weaken pest, kill or sterilise Competitor: compete and limit resources available to pest Disease: to weaken, kill or sterilise pest Poison: to specifically kill pests species and not affect native plants
5–10
Name a successful example of biological control explaining type and pest e.g. 1080 (poison), cactoblastis moth (parasite), or other suitable response 1–2
Name an unsuccessful example of biological control e.g. cane toad (predator), myxomatosis (disease), or other suitable response 1–2
Total /14

8
Sample assessment tasks | Integrated Science | ATAR Year 11
2. Discuss the impact Lantana has had on the native flora and fauna and the outline the best strategy to seek effective control of lantana.
Description Marks
Impact • all forms are thought to be toxic to livestock • reduces pasture productivity • costs an estimated $22 million per annum to control • competes with native seedlings for sunlight, water and space in disturbed ecosystems • can restrict access to river banks and areas of bushland due to dense growth
1–5
An integrated management strategy is the best form of control, combining manual, mechanical, chemical and biological. 1
Manual control strategy • Hand grubbing/clearing/cutting of smaller infestations • to create access in largely infested areas for access of larger machinery OR • Proper grazing management • to prevent overgrazing will prevent lantana infestation
1–2
Mechanical control • Bulldozing or slashing extensive mature infestations. Needs to be followed up by herbicide
treatment to prevent reinfestation 1–2
Chemical control • Use of herbicide chemicals for effective control of lantana infestations 1
Biological control • Use of lantana rust • a fungal pathogen that attacks a particular type of lantana plant OR • Use of two types of leaf miners • to attack lantana plants and restrict plant growth and flowering OR • Use of leaf sucking bug • to damage plants and reduce growth OR • Use of lantana seed fly • attacks the flowers and seeds of plants reducing reproduction of plants
1–2
Total /13

9
Sample assessment tasks | Integrated Science | ATAR Year 11
Sample assessment task
Integrated Science – ATAR Year 11
Task 14 – Unit 2
Assessment type: test Conditions Time for the task: 45 minutes Task weighting 5% of the school mark for this pair of units ________________________________________________________________________________________________________ Part A: Multiple-choice (15 marks) This section has 15 questions. Answer all questions on the multiple-choice answer sheet provided. 1. Which of the following statements about biological field techniques is correct?
a) The capture-recapture method assumes that tagged individuals are more likely to be caught than untagged individuals.
b) Handling practices in tracking studies of feral animals should be ethical. c) Quadrat sampling can be used to study plants but not animals. d) Transect sampling is based on counting organisms on points within a grid.
2. Biologists used the capture-recapture method to estimate the size of a population of tiger snakes on
an island. They captured and tagged 35 snakes and released them. They returned several weeks later and captured 48 snakes, 12 of which had a tag. Using the capture-recapture method, the size of the population on the island is
a) 47. b) 95. c) 140. d) 468.
3. Some types of ants live on Acacia trees. The trees provide shelter and food for the ants. The ants
attack animals that attempt to eat the Acacia trees. The relationship between the ants and the Acacia tree is an example of
a) mutualism. b) competition. c) parasitism. d) collaboration.

10
Sample assessment tasks | Integrated Science | ATAR Year 11
4. The following table shows the percentage of males and females of three different species of rat caught during a trapping study.
Rats trapped Male (%) Female (%) Total (%)
Norway rat 10 10 20 Black rat 30 30 60 Bush rat 4 16 20 Total 44 56 100
The value shown in bold in the table indicates that
a) 30 black rats trapped are female. b) 30 black rats trapped are male. c) 30% of male rats trapped are black rats. d) 50% of black rats trapped are male.
5. Quadrats were used to estimate the number of thistle plants in a field. A total of 480 thistle plants
were counted in 40 randomly placed quadrats in the field. Each quadrat measured 1 metre x 1 metre. If the area of the field was about 800 square metres, the estimated number of thistle plants in the field was
a) 480. b) 800. c) 9600. d) 19 200.
6. Which one of the following statements best describes the movement of matter and energy in an
ecosystem?
a) Producers convert matter to energy, which then passes through the levels before being recycled.
b) Consumers absorb heat energy from the environment and convert it to matter, which is then recycled.
c) Producers convert light energy to heat energy, which is then used to support the consumers. d) Energy enters an ecosystem as light and is lost as heat, while matter is recycled.
7. Plants are found at the beginning of food chains because they
a) cannot move around to obtain food. b) are the most common food source available. c) do not have any structures for biting and chewing. d) are able to convert light energy into food.
11
Sample assessment tasks | Integrated Science | ATAR Year 11
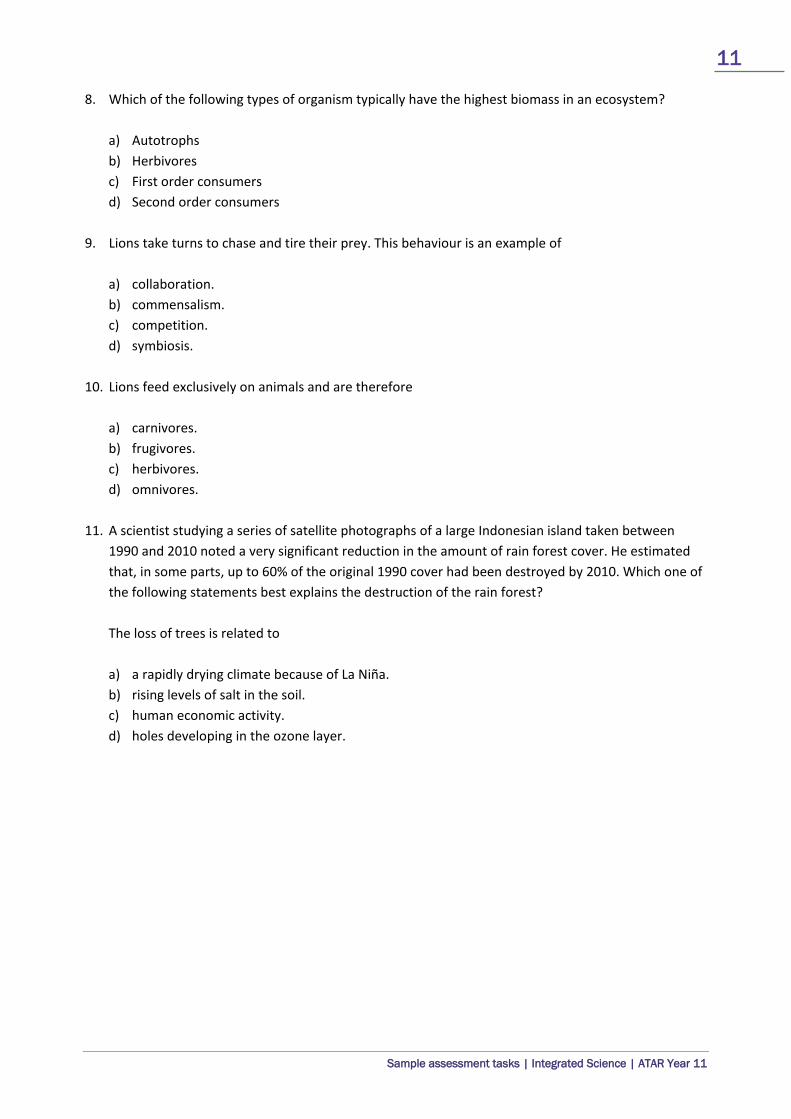
8. Which of the following types of organism typically have the highest biomass in an ecosystem?
a) Autotrophs b) Herbivores c) First order consumers d) Second order consumers
9. Lions take turns to chase and tire their prey. This behaviour is an example of
a) collaboration. b) commensalism. c) competition. d) symbiosis.
10. Lions feed exclusively on animals and are therefore
a) carnivores. b) frugivores. c) herbivores. d) omnivores.
11. A scientist studying a series of satellite photographs of a large Indonesian island taken between
1990 and 2010 noted a very significant reduction in the amount of rain forest cover. He estimated that, in some parts, up to 60% of the original 1990 cover had been destroyed by 2010. Which one of the following statements best explains the destruction of the rain forest? The loss of trees is related to
a) a rapidly drying climate because of La Niña. b) rising levels of salt in the soil. c) human economic activity. d) holes developing in the ozone layer.

12
Sample assessment tasks | Integrated Science | ATAR Year 11
Questions 12 and 13 relate to the following information about moths. Biologists collected moths that were attracted to a lamp. Four species of moth were found in the collection. The following pie chart shows the percentage of individuals of each species in the collection.
12. Based on the pie chart, the second-most abundant species in the collection was Species
a) 1. b) 2. c) 3. d) 4.
13. If 500 moths were collected, which of the following statements is correct?
a) At least 400 moths are from Species 1 and 2 combined. b) Fewer than 250 moths are from Species 3 and 4 combined. c) More than 250 moths are from Species 2. d) About 125 moths are from Species 1.

13
Sample assessment tasks | Integrated Science | ATAR Year 11
Use the following diagram for the next two questions
14. What is the name of this apparatus?
a) Secchi disc b) conductivity meter c) dissolved Oxygen meter d) water depth measurer
15. What does this measure when conducting water quality tests?
a) temperature b) turbidity c) salinity d) water depth

14
Sample assessment tasks | Integrated Science | ATAR Year 11
Part B: Short answer (35 marks) This section has five questions. Answer all questions on in the spaces provided.
16. Seagrass meadows support diverse communities of organisms. The organisms in the seagrass meadows acquire nutrients in a variety of ways. Indicate whether each of the following organisms is an autotroph, a herbivore, a carnivore or a detrivore. (4 marks)
a) i) Marine worms that feed on dead pieces of seagrass
______________________________________________________________________________
ii) Photosynthetic algae that live attached to the seagrass
______________________________________________________________________________
iii) Fish that feed only on the other fish in the area
______________________________________________________________________________
iv) Dugongs (sea cows) that eat only the seagrass
______________________________________________________________________________
b) The organisms in seagrass meadow communities show a variety of relationships. Distinguish between the following types of relationship.
i) Competition and collaboration (2 marks)
______________________________________________________________________________
______________________________________________________________________________
______________________________________________________________________________
______________________________________________________________________________
ii) Parasitism and commensalism (2 marks)
______________________________________________________________________________
______________________________________________________________________________
______________________________________________________________________________
______________________________________________________________________________
15
Sample assessment tasks | Integrated Science | ATAR Year 11
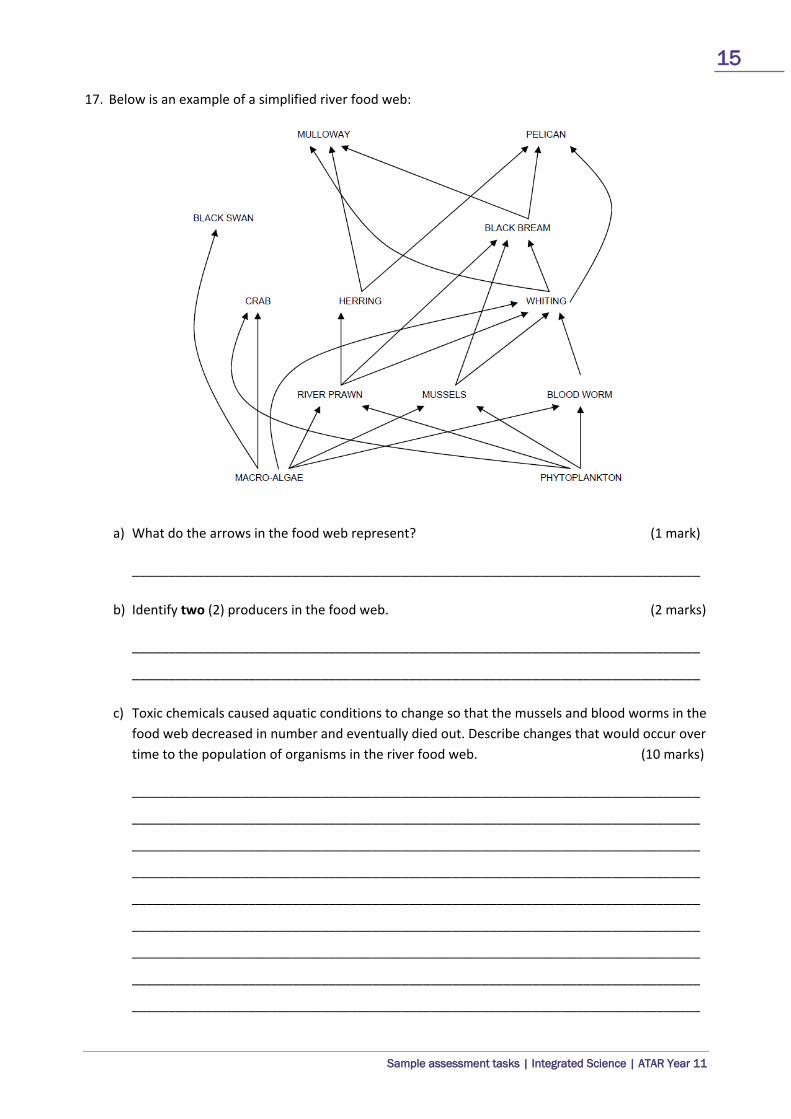
17. Below is an example of a simplified river food web:
a) What do the arrows in the food web represent? (1 mark)
______________________________________________________________________________
b) Identify two (2) producers in the food web. (2 marks)
______________________________________________________________________________
______________________________________________________________________________
c) Toxic chemicals caused aquatic conditions to change so that the mussels and blood worms in the food web decreased in number and eventually died out. Describe changes that would occur over time to the population of organisms in the river food web. (10 marks)
______________________________________________________________________________
______________________________________________________________________________
______________________________________________________________________________
______________________________________________________________________________
______________________________________________________________________________
______________________________________________________________________________
______________________________________________________________________________
______________________________________________________________________________
______________________________________________________________________________

16
Sample assessment tasks | Integrated Science | ATAR Year 11
18. Scientists measured the number of species of small invertebrates (animals without backbones), living on the bottom of a section of a river, to establish the river’s health. One measurement was taken upstream from a sewage outlet and further measurements were taken at intervals downstream. The results are shown in the column graph below. The numbers on the bottom of each column indicate how far downstream from the sewage outlet the sample was taken.
a) Where along the river were the greatest numbers of different species found? (1 mark)
______________________________________________________________________________
b) Describe how the location of the sewage outlet affects the number of species found as you move downstream. (2 marks)
______________________________________________________________________________
______________________________________________________________________________
c) Give an explanation for sampling water upstream of the sewage outlet, when the investigation was on effects of the sewage outlet on the number of species in the river. (2 marks)
______________________________________________________________________________
______________________________________________________________________________

17
Sample assessment tasks | Integrated Science | ATAR Year 11
Scientists use many measurements to build up a picture of the health of a river environment. These include measuring pH, salinity, turbidity, dissolved nutrients, and oxygen levels. They also use biological indicators. However, determining the number of species is time consuming and requires that they be collected and identified. Nevertheless, many scientists believe it is more reliable as it gives a long-term picture of the health of the waterway.
d) Suggest one advantage and one disadvantage of using physical measurements (such as measuring pH and oxygen levels) compared with biological measurements. (2 marks) Advantage:
________________________________________________________________________
Disadvantage:
________________________________________________________________________
e) How would you expect the oxygen levels to change along the length of this river? Give
an explanation for your answer. (6 marks) _________________________________________________________________________________
_________________________________________________________________________________
_________________________________________________________________________________
_________________________________________________________________________________
_________________________________________________________________________________
_________________________________________________________________________________
_________________________________________________________________________________
f) Other than an algal bloom, what could cause high turbidity? (1 mark)
__________________________________________________________________________________

18
Sample assessment tasks | Integrated Science | ATAR Year 11
Marking key for sample assessment task 14 – Unit 2
Part A: Multiple-choice
1. B 2. C 3. A 4. D 5. C 6. D 7. D 8. A 9. B
10. A 11. C 12. C 13. B 14. A 15. B
Part B: Short answer 16. Seagrass meadows support diverse communities of organisms. The organisms in the seagrass
meadows acquire nutrients in a variety of ways. Indicate whether each of the following organisms is an autotroph, a herbivore, a carnivore or a detrivore.
Description Marks a. Seagrass meadows support diverse communities of organisms. The organisms in the seagrass
meadows acquire nutrients in a variety of ways. Indicate whether each of the following organisms is an autotroph, a herbivore, a carnivore or a detrivore.
/4
i) Marine worms that feed on dead pieces of seagrass /1 Detrivore 1
ii) Photosynthetic algae that live attached to the seagrass /1 Producer 1 iii) Fish that feed only on the other fish in the area /1 Carnivore 1 iv) Dugongs (sea cows) that eat only the seagrass /1 Herbivore 1 b. The organisms in seagrass meadow communities show a variety of relationships. Distinguish
between the following types of relationship. /4
i) Competition and collaboration /2 Contending for resources with same species or different species 1 Corporation within species for the benefit of all members 1 ii) Parasitism and commensalism /2 Parasitism – when one organism (parasite) benefits at the detriment of the other
organism (host) usually leading to harm of host 1
Commensalism – when one organism benefits from another without causing harm 1
Total /8

19
Sample assessment tasks | Integrated Science | ATAR Year 11
17.
a) What do the arrows in the food web represent?
Description Marks Transfer/flow of energy 1
Total /1
b) Identify two (2) producers in the food web.
Description Marks Macro-algae 1 Plankton 1
Total /2
c) Toxic chemicals caused aquatic conditions to change so that the mussels and blood worms in the food web decreased in number and eventually died out. Describe changes that would occur over time to the population of organisms in the river food web.
Description Marks Loss of bloodworms and mussels Less competition for phytoplankton leads to increase in abundance of organism 1–2 Loss of half of food source for whiting leading to decrease in numbers of whiting and to increased predation on prawns leading to decreased prawns population 1–4
Increased competition for prawns between whiting and black bream loss of more whiting numbers 1
Loss of whiting numbers leads to increased competition between pelican and black bream for whiting leading to decrease in black bream numbers 1–3
Total /10 18. Scientists measured the number of species of small invertebrates (animals without backbones),
living on the bottom of a section of a river, to establish the river’s health. One measurement was taken upstream from a sewage outlet and further measurements were taken at intervals downstream. The results are shown in the column graph below. The numbers on the bottom of each column indicate how far downstream from the sewage outlet the sample was taken.
a) Where along the river were the greatest numbers of different species found?
Description Marks Upstream of the river 1
Total /1
b) Describe how the location of the sewage outlet affects the number of species found as you move downstream.
Description Marks Number of species drops dramatically at the sewage outlet 1 Number of species slowly increases as distance increases from the outlet 1
Total /2

20
Sample assessment tasks | Integrated Science | ATAR Year 11
d) Give an explanation for sampling water upstream of the sewage outlet, when the investigation was on effects of the sewage outlet on the number of species in the river.
e) Suggest one advantage and one disadvantage of using physical measurements (such as
measuring pH and oxygen levels) compared with biological measurements.
f) How would you expect the oxygen levels to change along the length of this river? Give an
explanation for your answer.
g) Other than an algal bloom, what could cause high turbidity?
Description Marks Get baseline data of species present without sewage 1 Comparison of sewage affected area 1
Total /2
Description Marks Physical measurements are a quick and simple test compared to biological measurements 1 Physical measurement only provides detail for the present short term and not long term health like biological measurement 1
Total /2
Description Marks Lower oxygen close to sewage outlet, increasing with distance away from outlet 1–2 Sewage leads to increased nutrients in water which leads to growth of algae (algal bloom) once algae die causing increased decomposer activity using more oxygen in water
1–4
Total /6
Description Marks Any of the following or other reasonable: • chemicals • mud/silt/sediment • sewage/pollution
1
Total /1