Embed Size (px)
Citation preview

SALLIE MAEABS East Investor Presentation
September 2015

2
Forward-Looking Statements and Disclaimer
Cautionary Note Regarding Forward-Looking Statements
The following information is current as of August 24, 2015 (unless otherwise noted) and should be read in connection with the quarterly report on Form 10-Q of SLM Corporation (the
“Company”) for the quarter ended June 30, 2015 (filed with the Securities Exchange Commission (“SEC”) on July 22, 2015) and subsequent reports filed with the SEC.
This Presentation contains “forward-looking” statements and information based on management’s current expectations as of the date of this presentation. Statements that are not historical
facts, including statements about the Company’s beliefs, opinions or expectations and statements that assume or are dependent upon future events, are forward-looking statements. Forward-
looking statements are subject to risks, uncertainties, assumptions and other factors that may cause actual results to be materially different from those reflected in such forward-looking
statements. These factors include, among others, the risks and uncertainties set forth in Item 1A “Risk Factors” and elsewhere in the Company’s Annual Report on Form 10-K for the year
ended Dec. 31, 2014 (filed with the SEC on Feb. 26, 2015) and subsequent filings with the SEC; increases in financing costs; limits on liquidity; increases in costs associated with compliance
with laws and regulations; changes in accounting standards and the impact of related changes in significant accounting estimates; any adverse outcomes in any significant litigation to which
the Company is a party; credit risk associated with the Company’s exposure to third parties, including counterparties to the Company’s derivative transactions; and changes in the terms of
education loans and the educational credit marketplace (including changes resulting from new laws and the implementation of existing laws). The Company could also be affected by, among
other things: changes in its funding costs and availability; reductions to its credit ratings; failures or breaches of its operating systems or infrastructure, including those of third-party vendors;
damage to its reputation; failures or breaches to successfully implement cost-cutting and restructuring initiatives and adverse effects of such initiatives on the Company’s business; risks
associated with restructuring initiatives; changes in the demand for educational financing or in financing preferences of lenders, educational institutions, students and their families; changes in
law and regulations with respect to the student lending business and financial institutions generally; changes in banking rules and regulations, including increased capital requirements;
increased competition from banks and other consumer lenders; the creditworthiness of customers; changes in the general interest rate environment, including the rate relationships among
relevant money-market instruments and those of earning assets versus funding arrangements; rates of prepayment on the loans made by the Company and its subsidiaries; changes in general
economic conditions and the Company’s ability to successfully effectuate any acquisitions; and other strategic initiatives. The preparation of the Company’s consolidated financial statements
also requires management to make certain estimates and assumptions including estimates and assumptions about future events. These estimates or assumptions may prove to be incorrect.
All forward-looking statements contained in this Presentation are qualified by these cautionary statements and are made only as of the date of this Presentation. The Company does not
undertake any obligation to update or revise these forward-looking statements to conform such statements to actual results or changes in its expectations.
The Company reports financial results on a GAAP basis and also provides certain core earnings performance measures. The difference between the Company’s “Core Earnings” and GAAP
results for the periods presented were the unrealized, mark-to-market gains/losses on derivative contracts. These are recognized in GAAP but not in “Core Earnings” results. The Company
provides “Core Earnings” measures because this is what management uses when making management decisions regarding the Company’s performance and the allocation of corporate
resources. The Company’s “Core Earnings” are not defined terms within GAAP and may not be comparable to similarly titled measures reported by other companies.
For additional information, see “Management’s Discussion and Analysis of Financial Condition and Results of Operations – GAAP Consolidated Earnings Summary-Core Earnings” in the
Company’s Quarterly Report on Form 10-Q for the quarter ended June 30, 2015 for a further discussion and for a complete reconciliation between GAAP net income and core earnings.
Disclaimer. A significant portion of the historical data relating to historical Smart Option Student Loan performance used to prepare certain of these materials was provided to the Company by
Navient Corporation (“Navient”) pursuant to a Data Sharing Agreement executed in connection with the Spin-Off (as hereinafter defined). Under the Data Sharing Agreement, Navient makes
no representations or warranties to the Company concerning the accuracy and completeness of information that they provided. Sallie Mae Bank has not independently verified, and is not able
to verify, the accuracy or completeness of the data provided under the agreement or of Navient’s representations and warranties. Although we have no reason to believe that the data used to
prepare the tabular and graphic presentations in this document as a whole, is materially inaccurate or incomplete, and have assumed that the data provided by Navient under the Data Sharing
Agreement as a whole to be materially accurate and complete, neither the Company nor any person on its behalf has independently verified the accuracy and completeness of such data.

33
Sallie Mae Bank

4
► #1 saving, planning and paying for education
company with 40-years of leadership in the
education lending market
► Top ranked brand: 6 out of 10 consumers of
education finance recognize the Sallie Mae brand
► Industry leading market share in private education
lending: 54% market share(1)
► Over 2,400 actively managed university
relationships across the U.S.
► Complementary consumer product offerings
► Over one million long-term engaged customers
across the Sallie Mae brands
The Sallie Mae Brand
(1) Source: MeasureOne CBA Report as of June 2015

5
- National sales and
marketing
- Largest salesforce in
the industry
- Specialized underwriting
capability
- Capital markets expertise
Private Education Loan -
Originator and Servicer
Deposits -
Upromise Rewards -
Credit Card -
($B as of 6/30/15)
Assets 12.9 -
FFELP Loans 1.2 -
Private Loans 9.2 -
Deposits 10.3 -
Preferred Equity 0.6 -
Tangible Common Equity 1.4 -
- Leading private education
loan franchise
- Conservative credit and
funding
- Expanding consumer
finance product suite
Sallie Mae Summary
Strategic Overview
KeyBusinesses
BalanceSheet
CompetitiveAdvantage

6
► Over one year since legal separation from Navient on April 30, 2014
► Completed the roll out of independent servicing and customer support capabilities
October 13, 2014
► Generated Earnings of $91 million in Q2 2015 and $139 million through Q2 2015
► Originated $4.1 billion of high quality Private Education Loans in 2014 (+7% vs. 2013),
$2.0 billion through Q2 2015 (+8% vs. 2014 YTD)
► Grew Private Education Loan portfolio 24% from Q2 2014 to Q2 2015
► Completed a second quarter 2015 loan sale at a pre-tax premium of 10.4%
► Completed the first term funding securitization in the third quarter 2015
Sallie Mae Highlights

77
High Quality Private Student Loan Originations Growth
$2,737
$3,342
$3,795
$4,076
$2,047
$0
$500
$1,000
$1,500
$2,000
$2,500
$3,000
$3,500
$4,000
$4,500
$5,000
2011 2012 2013 2014 2015
Ori
gin
ati
on
s
($
MM
)
Private Education Loan Originations
$1,902
$4,300
7%
14%
22%
YTD 8%
5%
Originations Statistics ($) 2011 2012 2013 2014 Q2 2014 Q2 2015
% Cosigned 91% 90% 90% 90% 90% 90%
% In School Payment 73% 58% 56% 56% 52% 52%
Average Originated FICO 748 746 745 749 745 747

8
High Quality Private Education Loan Portfolio
Customer FICO at Origination Smart Option Payment Type
Portfolio Interest Rate Type
Variable81%
Fixed19%
780+
30%
740 - 780
23%
700 - 740
26%
<700
21%
Weighted Average FICO: 746
Portfolio by Originations Vintage
Interest Only21%
Fixed Pay32%
Deferred47%
Smart Option Loans: $8.9bn
Pre 201210%
201216%
201326%
201439%
20159%
Weighted Average Age of Loan: ~1.7 years
As of June 30, 2015

9
Sallie Mae’s Smart Option Loan Product Overview
The Smart Option loan product was introduced by
Sallie Mae in 2009
The Smart Option loan program consists of:
Smart Option Interest Only loans - require full
interest payments during in-school, grace, and
deferment periods
Smart Option Fixed Pay loans - require $25
fixed payments during in-school, grace, and
deferment periods
Smart Option Deferred loans – do not require
payments during in-school and grace periods
Variable rate loans indexed to LIBOR, or fixed rate
Smart Option payment option may not be changed after
selected at origination
Underwritten using proprietary credit score model
Marketed primarily through the school channel and also
directly to consumers, with all loans certified by and
disbursed directly to schools
Smart Option Loan Program
Origination Channel School
Typical Borrower Student
Typical Co-signer Parent
Typical Loan
$10,000 avg orig bal, 5 to 15 yr term,
in-school payments of interest only, $25 fixed or
fully deferred
Origination Period March 2009 to present
Certification and
DisbursementSchool certified and school disbursed
Borrower UnderwritingFICO, custom credit score model, and judgmental
underwriting
Borrowing Limits $200,000
Current ABS CriteriaFor-Profit; FICO ≥ 670
Not-for-Profit; FICO ≥ 640
Historical Risk-Based Pricing L + 2% to L + 14%
Dischargeable in Bankruptcy No (1)
Additional Characteristics
Made to students and parents primarily through
college financial aid offices to fund 2-year, 4-year
and graduate school college tuition, room and
board
Also available on a limited basis to students and
parents to fund non-degree granting secondary
education, including community college, part
time, technical and trade school programs
Both Title IV and non-Title IV schools
(1) Private education loans are typically non-dischargeable in bankruptcy, unless a
borrower can prove that repayment of the loan would impose an "undue hardship“.

10
Sallie Mae Bank Collections, Charge-Off and Recovery Policy
Policy Pre-Spin, Legacy SLM Serviced Post-Spin, Sallie Mae Bank Serviced(1)
Delinquencies All loans serviced by an affiliate of legacy SLM; loan
owned by Sallie Mae Bank sold to legacy SLM after
becoming 90+ days past due
Sallie Mae Bank collects delinquent loans thru charge-off, with
emphasis on returning loans to current status during early stages
of delinquency
Charge-offs Loans serviced by legacy SLM charge off at 212+
days past due
Loans serviced by Sallie Mae Bank charge off at 120+ days past
due
Post-Default
Recoveries
Post-charge off collections managed by legacy SLM;
recoveries realized over 10+ years
Charged-off loans either sold after charge-off, or managed
internally by Sallie Mae Bank(1)
Forbearance Granted for 3 mo. intervals with a 12 month
maximum, with fee
Granted for 3 mo. intervals with a 12 month maximum, no fee
Sallie Mae Bank Forbearance Policy -
First choice is always to collect a payment from the borrower or co-signer
If payment is not possible, forbearance temporarily provides borrowers limited time to improve their ability to repay during temporary economic hardship
The vast majority of loans do not use forbearance; for those that do, forbearance is made available in three month increments for no more than 12 months over the life of a loan
(1) Sallie Mae Bank intends to add third party collection agency management, account placement and other functionality necessary to manage charged-off loan collections internally. In the
future, Sallie Mae expects to have the option of selling or internally managing collections of charged-off loans, and to utilize one or both of those strategies at any time based on market
conditions.

1111
Sallie Mae Bank ABS Program

12
► Low cost deposit base with no branch overhead
— 90% of retail deposits are savings accounts
— Brokered deposits used as alternative funding source
► Term funding / securitizations will augment deposit
funding for future growth
— Experienced capital markets team
— Capacity to securitize $2 – $3bn of private education
loans
— Completed term funding securitization in the third quarter
2015
► Multi-year revolving conduit facility
— Provides seasonal loan funding and backup liquidity
— $750mm conduit with 1-year revolving term and an
additional 1-year amortization term provided by
consortium of banks
► Whole loan sales used to manage balance sheet growth
— Targeting $1 – $2bn of loan sales annually
► Substantial liquidity portfolio
— $1.3bn of on-balance sheet cash as of 6/30/15
60%
40%
60%
40%
Conservative Funding Approach
2014 Target
Retail deposits
Brokered deposits
Secured debt

13
Sallie Mae Bank ABS Structures
(1) Represents offered amount. SMB retained 5% of Classes A through B and all of Class C ($50mm). Total bond size was $714mm.
(2) Overcollateralization for Class A & B bonds
(3) Estimated based on a variety of assumptions concerning loan repayment behavior. Actual average life may vary significantly from estimates.
SMB 2015-B SMB 2015-A
Size $630.80MM(1) $704MM
Pricing Date July 23, 2014 April 15, 2015
CollateralSmart Option
Private Education Loans
Smart Option
Private Education Loans
Servicer Sallie Mae Bank Sallie Mae Bank
Overcollateralization (2) 13% 13%
Prepayment Speed (3) 4% 4%
Tranche Structure
WA Borrower Interest Rate 8.21% 8.21%
WA FICO at Issuance 741 744
% Loans with Cosigner 92% 92%
Variable Rate Loans 82% 82%
Class
Amt
($mm) Mdy's WAL Pricing
A-1 263.00 Aaa 1.75 1mL +60
A-2a 164.00 Aaa 5.90 IntS +90
A-2b 82.00 Aaa 5.90 1mL +100
A-3 70.00 Aaa 8.50 1mL +150
B 75.00 Aa3 9.75 IntS +220
C 50.00 A3 10.79 IntS +295
Class
Amt
($mm) (1) Mdy's WAL Pricing
A-1 225.15 Aaa 1.50 1mL +80
A-2a 182.40 Aaa 5.46 IntS +120
A-2b 85.50 Aaa 5.46 1mL +130
A-3 71.25 Aaa 8.40 1mL +180
B 66.50 Aa3 9.67 IntS +235
C Retained A3 10.68 N/A

14
SMB 2015-B Structure
(1) Structure is run at 4% CPR; SMB 2015-B structure priced to 10% clean up call.
(2) As a percentage of the initial pool balance.
(3) As a percentage of the current pool balance. Target Credit Enhancement is reached on the first distribution date on which the pool balance minus the outstanding aggregate
principal balance of class A and class B notes equals to 30% of the pool balance.
(4) Consists of Overcollateralization, Reserve and Subordination.
(5) Does not include the Reserve balance.
0%
10%
20%
30%
40%
50%
60%
70%
80%
90%
100%
$0
$100
$200
$300
$400
$500
$600
$700
$800
$900
0 3 6 9
12
15
18
21
24
27
30
33
36
39
42
45
48
51
54
57
60
63
66
69
72
75
78
81
84
87
90
93
96
99
102
105
108
111
114
117
120
123
126
129
Mill
ion
s
C B A-3 A-2 A-1 Collateral C/E (%)
Collateral Balance
Class A-1 Balance
Class A-3 Balance
Class B BalanceClass C Balance
Period 31: 30% Target Credit
Enhancement(3)(5) Reached
Expected Class B
Paydown
Expected Class C
Paydown
% Credit Enhancement(5)
Class A-2A and A-2B Balance
Balance
Deal Credit Enhancement(2,4) Reserve WAL to Call(1) (4% CPR) Principal Window to Call(1) Projected Class A
Credit Enhancement(3)
Class A Class B Target(3)(5) Floor(5) Non-
decliningA1 A2 A3 B C A1 A2 A3 B C 12 mo 24 mo 36 mo 60 mo
SMB
2015-B22% 13% 30% 11% 0.25% 1.50 5.46 8.40 9.67 10.68 1 - 35 35 - 93 93 - 107 107 - 125 125 - 128 30% 37% 42% 46%

15
Sallie Mae Bank vs. Legacy SLM Private Education Loan ABS Summary
(1) Smart Option loans considered in ‘P&I Repayment’ only if borrowers are subject to full principal and interest payments on the loan.
11-A 11-B 11-C 12-A 12-B 12-C 12-D 12-E 13-A 13-B 13-C 14-A 14-A 15-A 15-B 14-A 15-A 15-B
Total Bond Amount ($mil) 562 825 721 547 891 1,135 640 976 1,108 1,135 624 676 664 689 700 382 704 714
Initial AAA Enhancement (%) 21% 18% 24% 27% 26% 25% 25% 21% 26% 22% 28% 24% 30% 32% 36% 21% 23% 22%
Initial Class B Enhancement (%) -- -- -- -- -- -- -- -- 15% 13% 20% 15% 22% 23% -- 12% 13% 13%
Loan Program (%)
Signature/Law/MBA/Med 88% 91% 71% 61% 48% 43% 37% 35% 26% 29% 26% 19% 26% 27% 52% 0% 0% 0%
Smart Option -- -- 10% 20% 30% 40% 45% 48% 63% 63% 64% 63% 50% 50% -- 100% 100% 100%
Consolidation 0% 0% 7% 6% 9% 5% 5% 5% 3% 5% 0% 6% 9% 2% 8% 0% 0% 0%
Direct to Consumer 9% 6% 12% 12% 12% 12% 12% 12% 8% 3% 10% 12% 15% 21% 26% 0% 0% 0%
Career Training 3% 3% 0% 1% 1% 0% 0% 0% 0% 0% 0% 0% 0% 0% 13% 0% 0% 0%
Total 100% 100% 100% 100% 100% 100% 100% 100% 100% 100% 100% 100% 100% 100% 100% 100% 100% 100%
Loan Status (%)(1)
School, Grace, Deferment 55% 55% 45% 37% 38% 40% 39% 44% 59% 62% 63% 49% 46% 24% 9% 91% 79% 78%
P&I Repayment 43% 43% 52% 60% 60% 57% 59% 54% 39% 36% 36% 50% 53% 68% 89% 9% 20% 21%
Forbearance 2% 3% 2% 2% 2% 3% 2% 2% 2% 2% 1% 1% 1% 8% 2% 0% 2% 1%
Wtd Avg Term to Maturity (Mo.) 192 189 182 171 164 151 144 148 144 146 143 150 161 155 157 140 133 130
% Loans with Cosigner 72% 75% 71% 75% 77% 79% 80% 80% 80% 80% 81% 82% 79% 80% 64% 93% 92% 92%
% Loans with No Cosigner 28% 25% 29% 25% 23% 21% 20% 20% 20% 20% 19% 18% 21% 20% 36% 7% 8% 8%
Wtd Avg FICO at Origination 737 736 733 735 736 737 740 733 741 740 740 742 739 731 730 747 747 746
Wtd Avg Recent FICO at Issuance 723 722 720 724 726 728 730 722 733 734 733 741 737 714 726 745 744 741
WA FICO (Cosigner at Origination) 747 745 744 745 745 745 748 741 751 750 749 750 748 738 742 750 750 749
WA FICO (Cosigner at Rescored) 736 731 734 732 734 735 738 728 745 746 745 750 746 724 739 748 748 745
WA FICO (Borrower at Origination) 709 710 704 705 705 707 710 702 703 702 705 707 707 701 704 708 714 715
WA FICO (Borrower at Rescored) 690 695 688 700 700 702 698 696 683 684 682 701 707 672 704 701 702 699
Variable Rate Loans 100% 100% 100% 100% 100% 100% 100% 100% 100% 100% 100% 100% 89% 97% 100% 85% 82% 82%
Wtd Avg Annual Borrower Interest Rate 7.75% 7.45% 6.61% 7.04% 7.23% 7.38% 7.43% 7.70% 6.88% 6.89% 7.13% 6.85% 6.89% 7.60% 5.82% 7.82% 8.21% 8.21%
Legacy SLM Navient Sallie Mae Bank

1616
Private Education Loan Market Background

17
Higher Education Value Proposition
0%
2%
4%
6%
8%
10%
12%
0
200
400
600
800
1,000
1,200
1,400
1,600
1,800
Unemployment
Average weekly income
Incremental Earnings From a College Degree
Has Increased For Generations(2) Payment to Income Ratio(4)
$ 7,499
$ 9,690
$ 14,245
$ 15,780
$ 17,500
Silents in1965
EarlyBoomers in
1979
LateBoomers in
1986
Gen Xers in1995
Millenials in2013
Key Statistics
► The unemployment rate for 25 to 34 year-olds with four-year college degrees was 2.1%, compared to 8.4% for high
school graduates(1)
► 60% of students graduate with student loans(3)
► 69% of student loan borrowers have debt balances less than $25,000 and 4% have balances above $100,000
(average borrowings of $27,300) (3)
► The average payment-to-income ratio declined from 15% in 1992 to 7% in 2010(4)
(1) Source: U.S. Bureau of Labor Statistics- March 2015
(2) Source: PEW Research Center- The Rising Cost of Not Going to College February 2014
(3) Source: Trends in College Pricing.© 2014 The College Board, www.collegeboard.org, U.S. Department of Education 2014
(4) Source: Brown Center on Education Policy at Brookings: Is a Student Loan Crisis on the Horizon -Released June 2014
Relationship Between Higher Education,
Income and Employment(1)

18
$17 $17
$93
$28
AY 2004-2005
$110
$46
Full-Time Private School
Full-Time Public School
$27 $27
$143
$49
AY 2014-2015$168
$76
Full-Time Private School
Full-Time Public School
$17 $17 $27 $27
$93
$28
$143
$49
Full-TimePrivate School
Full-TimePublic School
Full-TimePrivate School
Full-TimePublic School
Ed Spending Limit Cost of Attendance Gap
Favorable Student Loan Market Trends
12.1
12.9 13.3 13.5 13.5 13.7
2008 2009 2010 2011 2012 2013
(millions)
Enrollment at Four-Year Degree Granting Institutions(1) Annual Cost of Education(2)
$12 $13 $14 $14 $15 $16 $17 $18 $18 $19
$29 $30 $32 $34 $35 $36 $38 $39 $41 $42
2005 2006 2007 2008 2009 2010 2011 2012 2013 2014
Public Private(thousands)
Federal
Loans
$99
Family
Contributions
$151
Grants
$124
Private
Education
Loans
$8
Ed. Tax
Benefit /
Work Study
$20
($ in billions)
Total Estimated Cost: $402
Estimated Total Cost of Education – 2014 / 2015 AY(3) Cost of College (Based on a Four-Year Term)(4)
(billions) (thousands)
$17 $17
$93
$28
AY 2004-2005
$110
$46
Full-Time Private School
Full-Time Public School
$27 $27
$143
$49
AY 2014-2015$168
$76
Full-Time Private School
Full-Time Public School
(1) Source: U.S. Department of Education, National Center for Education Statistics, Projections of Education Statistics to 2022
(2) Source: Trends in College Pricing.© 2014 The College Board,. www.collegeboard.org, Note: Academic years, average published tuition, fees, room and board charges at four-year institutions; enrollment-weighted
(3) “Total post-secondary education spend” is estimated by Sallie Mae by determining the full-time equivalents for both graduates and undergraduates and multiplying by estimated total per person cost of
attendance for each school type. In doing so, we utilize information from the U.S. Department of Education, College Board, MeasureOne, National Student Clearinghouse and Company Analysis. Other
sources for these data points also exist publicly and may vary from our computed estimates.
(4) Source: Trends in College Pricing.© 2014 The College Board, www.collegeboard.org, U.S. Department of Education 2014
$17 $17
$93
$28
AY 2004-2005
$110
$46
Full-Time Private School
Full-Time Public School
$27 $27
$143
$49
AY 2014-2015$168
$76
Full-Time Private School
Full-Time Public School
$110
$45
$170
$76

19
► Unsecured consumer loans made to qualified borrowers and co-signers to fund the cost of undergraduate,
graduate and other forms of post-secondary education
► Unlike FFELP Loans, private education loans are not guaranteed against losses by the Department of
Education, or any other entity
► Also unlike FFELP loans, private education loans are not subject to income based repayment programs
► Similar to FFELP loans, private education loans are generally non-dischargeable in bankruptcy
► Private education loans are made to students attending public, private, not-for-profit, and for profit institutions
► Students and parents are encouraged to exhaust other sources of aid prior to applying for a private
education loan
Private Education Loan Characteristics

20
Sallie Mae Bank Smart Option Private Education LoansFFELP vs. Sallie Mae Bank Smart Option Private Education Loan Comparison
FFELP Stafford LoansSallie Mae Bank Smart Option
Private Education Loans(1)
Borrower Student Student or Parent
Co-signer None Typically a parent
Lender Eligible banks and private lenders under FFELP Banks and other private sector lenders
Guarantee97-100% of principal and interest by the U.S. Department
of EducationNot guaranteed by the U.S. Government or any other entity
Interest Subsidy/Special Allowance
PaymentsPaid by the U.S. Department of Education Not Applicable
UnderwritingBorrower must have no outstanding student loan defaults
or bankruptcy
Consumer credit underwriting, with minimum FICO, custom
credit score model, and judgmental underwriting
PricingFixed or floating rate depending on origination year and
loan programRisk-based, variable rate indexed to LIBOR or fixed rate
Maximum Amount per Year$5,500-$7,500 for dependent student, based on year in
school
Up to the full cost of education, less grants and federal
loans
Repayment Term 10 years, with repayment deferred until after graduation5 to 15 years, may pay interest or a $25 fixed payment
while in school, or may be deferred until after graduation
Collections Based on prescribed U.S. Dept of Education regulationsTypical consumer loan collections activities, managed
independent of FFELP
DefermentPermitted for a variety of reasons, including economic
hardship
Granted to students who return to school, and are involved
in active military service
ForbearancePermitted for a variety of reasons, including economic
hardship
Typically granted for economic hardship, up to a maximum
of 12 months
Dischargeable in Bankruptcy No No (2)
(1) Pertains to the Sallie Mae Smart Option loan product.
(2) Private education loans are typically non-dischargeable in bankruptcy, unless a borrower can prove that repayment of the loan would impose an "undue hardship“.

21
Private Education Loan Lifecycle for Deferred Loan Products
Loan made to
borrower/
co-signer
In School Status
(Additional Borrowing)
Grace Status
After graduation
(generally 6 months)
P&I Repayment
Status
Deferment Status
(back to school)
(up to 48 months)
Default
(120+ days
delinquent)
IN SCHOOL AND GRACE P&I REPAYMENT
On Time
Payment PAID IN FULL
Delinquent
(30+ days)
Post-Default
RecoveryNote: Interest capitalization occurs after Grace,
Deferment, and Forbearance periods
Forbearance Status
(3 month increments;
up to 12 months)

2222
Historical Smart Option Loan Performance

23
On April 30, 2014 (the “Spin-Off Date”), the former SLM Corporation legally separated (the “Spin-Off”) into two distinct publicly traded entities: an education loan management, servicing and asset recovery business called Navient Corporation (“Navient”), and a
consumer banking business called SLM Corporation. SLM Corporation’s primary operating subsidiary is Sallie Mae Bank. We sometimes refer to SLM Corporation, together with its subsidiaries and its affiliates, during the period prior to the Spin-Off as “legacy
SLM.”
In connection with the Spin-Off, all private education loans owned by legacy SLM, other than those owned by its Sallie Mae Bank subsidiary as of the date of the Spin-Off, and all private education loan asset-backed securities (“ABS”) trusts previously sponsored
and administered by legacy SLM were transferred to Navient. As of the Spin-Off Date, Navient and its sponsored ABS trusts owned $30.8 billion of legacy SLM’s private education loan portfolio originated both prior to and since 2009. As of the Spin-Off Date, Sallie
Mae Bank owned $7.2 billion of private education loans, the vast majority of which were unencumbered Smart Option Student Loans originated since 2009.
Legacy SLM’s Private Education Loan and ABS Programs Prior to the Spin-Off
In 1989, legacy SLM began making private education loans to graduate students. In 1996, legacy SLM expanded its private education loan offerings to undergraduate students. Between 2002 and 2007, legacy SLM issued $18.6 billion of private education loan-
backed ABS in 12 separate transactions.
In 2008, in response to the financial downturn, legacy SLM revised its private education loan underwriting criteria, tightened its forbearance and collections policies, ended direct-to-consumer disbursements, and ceased lending to students attending certain for-
profit schools. Legacy SLM issued no private education loan ABS in 2008.
In 2009, legacy SLM introduced its Smart Option Student Loan product and began underwriting private education loans with a proprietary custom credit score. The custom credit score included income-based factors, which led to a significant increase in the
percentage of loans requiring a co-signer, typically a parent. The initial loans originated under the Smart Option Student Loan program (the “Interest Only SOSLs”) were variable rate loans and required interest payments by borrowers while in school, which
reduced the amounts payable over the loans’ lives and helped establish repayment habits among borrowers. In 2010, legacy SLM introduced a second option for its Smart Option Student Loan customers, which required a $25 fixed monthly payment while
borrowers were in school (the “Fixed Pay SOSLs”). In 2011, legacy SLM introduced another option for its Smart Option Student Loan customers, which allowed borrowers to defer interest and principal payments until after a student graduates or separates from
school (the “Deferred SOSLs”). In 2012, legacy SLM introduced a fixed rate loan option for its Interest Only, Fixed Pay and Deferred SOSLs. Borrowers must select which of these options they prefer at the time of loan origination and are not permitted to change
those options once selected.
In 2011, legacy SLM included private education loans originated under the Smart Option Student Loan program in its ABS pools for the first time. Between 2011 and 2014, the mix of Smart Option Student Loans included in legacy SLM’s private education loan
ABS steadily increased as a percentage of the collateral pools, from 10% initially to 64% in later transactions.
Sallie Mae Bank’s Private Education Loan and ABS Programs Post-Spin Off
Originations. Following the Spin-Off, Sallie Mae Bank continued to originate loans under the Smart Option Student Loan program. As of December 31, 2014, it owned $9.5 billion of private education loans, the vast majority of which were Smart Option Student
Loans originated since 2009, and two-thirds of which were originated in 2013 and 2014. Navient ceased originating private education loans following the Spin-Off.
Servicing. Immediately prior to the Spin-Off, Sallie Mae Bank assumed responsibility for collections of delinquent loans on the vast majority of its Smart Option Student Loan portfolio. Following the Spin-Off Date, Navient continued to service all private education
loans owned by the two companies on its servicing platform until October 2014, when servicing for the vast majority of Sallie Mae Bank’s private education loan portfolio was transitioned to Sallie Mae Bank. Sallie Mae Bank now services and is responsible for
collecting the vast majority of the Smart Option Student Loans it owns.
Securitization and Sales. In August 2014, Sallie Mae Bank sponsored its first private education loan ABS, SMB Private Education Loan Trust 2014-A (the “SMB 2014-A transaction”). Because this transaction occurred prior to the transfer of loan servicing from
Navient to Sallie Mae Bank, Sallie Mae Bank acted as master servicer for the transaction and Navient as subservicer, and the loan pool is serviced pursuant to Navient servicing policies. Also in August 2014, Sallie Mae Bank sold Navient approximately $800
million of performing Smart Option Student Loans. In April 2015, Sallie Mae Bank sponsored a second securitization and residual sale, SMB Private Education Loan Trust 2015-A, for which Sallie Mae Bank acted as servicer.
Additional Information. Prior to the Spin-Off, all Smart Option Student Loans were originated and initially held by Sallie Mae Bank, as a subsidiary of legacy SLM. Sallie Mae Bank typically then sold certain of the performing Smart Option Student Loans to an
affiliate of legacy SLM for securitization. Additionally, on a monthly basis Sallie Mae Bank sold all loans that were over 90 days past due, in forbearance, restructured or involved in a bankruptcy to an affiliate of legacy SLM. As a result of this second practice, prior
to the occurrence of the Spin-Off, historical performance data for Sallie Mae Bank’s Smart Option Student Loan portfolio reflected minimal later stage delinquencies, forbearance or charge-offs.
Legacy SLM collected Smart Option Student Loans pursuant to policies that required loans be charged off after 212 days of delinquency. In April 2014, Sallie Mae Bank began collecting the vast majority of its Smart Option Student Loans pursuant to policies that
required loans be charged off after 120 days of delinquency, in accordance with bank regulatory guidance. As a result of the various policies described above, it was not until recently that (a) a meaningful amount of Smart Option Student Loan charge-offs
occurred in Sallie Mae Bank’s portfolio, and (b) performance data on Sallie Mae Bank’s owned Smart Option Student Loan portfo lio became useful as a basis for evaluating historical trends for Smart Option Student Loans. For the reasons described above, much
of Sallie Mae Bank’s historical performance data does not reflect current collections and charge off practices and may not be indicative of the future performance of the Bank’s Smart Option Student Loans. We do not believe the credit performance indicators for
Sallie Mae Bank-owned and -serviced Smart Option Student Loans yet provide meaningful period-over-period comparisons.
Important Information Regarding Historical Loan Performance Data

24
Types of Smart Option Loan Portfolio Data
The portfolio data we used in this report comes from two separate sources of information:
(1) Combined Smart Option Student Loan Portfolio Data for Legacy SLM, Navient and Sallie Mae Bank. Information in this category is presented on a combined basis for loans originated under the Smart Option Student Loan program, whether originated by Sallie
Mae Bank when it was part of legacy SLM or by Sallie Mae Bank post Spin-Off, and regardless of whether the loan is currently held by an ABS trust, or held or serviced by Navient or Sallie Mae Bank. Data in this category is used in the tables below under the
following headings:
“Cumulative Defaults by P&I Repayment Vintage and Years in P&I Repayment” and
“Cumulative Recovery Rate for Combined Charge Offs and Charge-Off Vintages Since 2010.”
This combined Smart Option Student Loan portfolio data provides insight into gross defaults of all Smart Option Student Loans since 2010, regardless of ownership or servicing standard. We believe historical loan performance data since 2010 is more
representative of the expected performance of Smart Option Student Loans to be included in new Sallie Mae Bank trusts than data available for earlier periods. Data available for earlier periods includes a limited number of Smart Option Student Loan product
types, a limited amount of loans in principal and interest repayment status, and limited periods of loan performance history.
A significant portion of the combined Smart Option Student Loan performance data described in this category is provided to Sallie Mae Bank by Navient under a data sharing agreement executed in connection with the Spin-Off. This data
sharing agreement expires in 2019. Under the data sharing agreement, Navient makes no representations or warranties to Sallie Mae Bank concerning the accuracy and completeness of information that it provided. Sallie Mae Bank has not
independently verified, and is not able to verify, the accuracy or completeness of the data provided under the agreement.
Loans contained in the combined Smart Option Student Loan portfolio category were serviced by legacy SLM prior to the Spin-Off, and by either Navient or Sallie Mae Bank after the Spin-Off. As noted above, loans serviced by legacy SLM and Navient were
serviced pursuant to different policies than those loans serviced by Sallie Mae Bank after the Spin-Off. Specifically, legacy SLM charged off loans after 212 days of delinquency, and Navient has continued this policy. Sallie Mae Bank currently charges off loans
after 120 days of delinquency. All loans included in the combined Smart Option Student Loan portfolio were serviced by legacy SLM pursuant to a 212-day charge off policy prior to the Spin-Off. Following the Spin-Off, a portion of the loans included in the
combined Smart Option Student Loan portfolio data have been serviced by Navient pursuant to a 212-day charge off policy, and a portion have been serviced by Sallie Mae Bank pursuant to a 120-day charge off policy. As a result, future performance of loans
serviced by Sallie Mae Bank may differ from the historical performance of loans reflected in this combined Smart Option Student Loan portfolio data.
(2) Legacy SLM Consolidated Smart Option Student Loan Portfolio Data prior to the Spin-Off Date, and Sallie Mae Bank-Only Smart Option Student Loan Data from and after the Spin-Off Date. Information in this category is presented (a) prior to the Spin-Off
Date for Smart Option Student Loans owned or serviced by legacy SLM prior to the Spin-Off, and (b) from and after the Spin-Off Date for Smart Option Student Loans serviced by Sallie Mae Bank from and after the Spin-Off. Data in this category is used in the
tables below under the following headings:
This consolidated Smart Option Student Loan portfolio data provides insight into historical delinquencies, forbearance, defaults and prepayment rates specifically of the Smart Option Student Loans covered, regardless of the loans’ ownership at the time, or
whether the loans serve as collateral for an ABS trust. We believe this data is currently the most relevant data available for assessing historical Smart Option Student Loan performance.
Loans owned or serviced by legacy SLM and contained in this consolidated Smart Option Student Loan portfolio category were serviced pursuant to legacy SLM servicing policies prior to the Spin-Off. Loans serviced by Sallie Mae Bank and contained in this
consolidated Smart Option Student Loan portfolio were serviced pursuant to Sallie Mae Bank servicing policies since the Spin-Off. The servicing policies of legacy SLM were different than the servicing policies of Sallie Mae Bank. Specifically, legacy SLM
charged off loans after 212 days of delinquency, while Sallie Mae Bank charges off loans after 120 days of delinquency in accordance with bank regulatory guidance. As a result, future performance of loans serviced by Sallie Mae Bank may differ from the
historical performance of loans reflected in this consolidated Smart Option Student Loan portfolio data.
Any data or other information presented in the following report is for comparative purposes only, and, is not to be deemed a part of any offering of securities.
“31-60 Day Delinquencies as a Percentage of Loans in P&I Repayment;”
“61-90 Day Delinquencies as a Percentage of Loans in P&I Repayment ;”
“91-plus Day Delinquencies as a Percentage of Loans in P&I Repayment ;”
“Forbearance as a Percentage of Loans in P&I Repayment and Forbearance;”
“Annualized Gross Defaults as a Percentage of Loans in P&I Repayment;”
“Voluntary Constant Prepayment Rates by Origination Vintage and Product;” and
“Total Constant Prepayment Rates by Origination Vintage and Product.”
Important Information Regarding Historical Loan Performance Data (cont.)

25
Smart Option Vintage Data: Cumulative Gross Default by Loan Type
5.7%
4.8%
3.4%
2.4%
1.3%
0.0%
1.0%
2.0%
3.0%
4.0%
5.0%
6.0%
7.0%
8.0%
9.0%
10.0%
0 1 2 3 4 5 6 7 8 9 10 11
Cu
mu
lati
ve D
efau
lt R
ate
as a
% o
f O
rigi
nal
Bal
ance
Years in P&I Repayment
Smart Option Student Loans - Serviced Portfolio: All ProductsCumulative Defaults by P&I Repayment Vintage
and Years in P&I Repayment (1)
Data for Legacy SLM, Navient and Sallie Mae Bank Combined thru Present (2)
2010
2011
2012
2013
2014
5.7%
4.6%
2.8%
1.9%
1.0%
0.0%
1.0%
2.0%
3.0%
4.0%
5.0%
6.0%
7.0%
8.0%
9.0%
10.0%
0 1 2 3 4 5 6 7 8 9 10 11
Cu
mu
lati
ve D
efau
lt R
ate
as a
% o
f O
rigi
nal
Bal
ance
Years in P&I Repayment
Smart Option Student Loans - Serviced Portfolio: Interest OnlyCumulative Defaults by P&I Repayment Vintage
and Years in P&I Repayment (1)
Data for Legacy SLM, Navient and Sallie Mae Bank Combined thru Present (2)
2010
2011
2012
2013
2014
5.3%
4.0%
2.4%
1.1%
0.0%
1.0%
2.0%
3.0%
4.0%
5.0%
6.0%
7.0%
8.0%
9.0%
10.0%
0 1 2 3 4 5 6 7 8 9 10 11
Cu
mu
lati
ve D
efau
lt R
ate
as a
% o
f O
rigi
nal
Bal
ance
Years in P&I Repayment
Smart Option Student Loans - Serviced Portfolio: Fixed PayCumulative Defaults by P&I Repayment Vintage
and Years in P&I Repayment (1)
Data for Legacy SLM, Navient and Sallie Mae Bank Combined thru Present (2)
2011
2012
2013
2014
3.9%3.2%
1.8%
0.0%
1.0%
2.0%
3.0%
4.0%
5.0%
6.0%
7.0%
8.0%
9.0%
10.0%
0 1 2 3 4 5 6 7 8 9 10 11
Cu
mu
lati
ve D
efau
lt R
ate
as a
% o
f O
rigi
nal
Bal
ance
Years in P&I Repayment
Smart Option Student Loans - Serviced Portfolio: DeferredCumulative Defaults by P&I Repayment Vintage
and Years in P&I Repayment (1)
Data for Legacy SLM, Navient and Sallie Mae Bank Combined thru Present (2)
2012
2013
2014
(1) Loans in ‘P&I Repayment’ includes only those loans for which scheduled principal and interest payments are due. Data as of June 30, 2015.
(2) Certain data used in the charts above was provided by Navient under a data sharing agreement. Sallie Mae Bank has not independently verified, and is not able to verify, the accuracy or completeness of the data provided under the
agreement. Cumulative charge off rate calculations for the period ended June 30, 2015 include $28.7 million of charged off loans sold to third parties prior to March 31, 2015 not included in previously reported cumulative charge off rate
calculations. Inclusion of these charge offs contributed to the increase in cumulative charge off rates for the period ended June 30, 2015 over those previously reported for the period ended March 31, 2015.
Note: Legacy SLM and Navient portfolio serviced pursuant to a 212 day charge-off policy. Sallie Mae Bank portfolio serviced pursuant to a 120 day charge-off policy. Historical trends may not be indicative of future performance.

26
Smart Option Serviced Portfolio: 31-60 Day Delinquencies
0.0%
2.0%
4.0%
6.0%
8.0%
10.0%
Dec
-09
Mar-
10
Ju
n-1
0
Se
p-1
0
Dec
-10
Mar-
11
Ju
n-1
1
Se
p-1
1
Dec
-11
Mar-
12
Ju
n-1
2
Se
p-1
2
Dec
-12
Mar-
13
Ju
n-1
3
Se
p-1
3
Dec
-13
Mar-
14
Ju
n-1
4
Se
p-1
4
Dec
-14
Mar-
15
Ju
n-1
5
Pe
rcen
t o
f P
&I R
epay
men
t B
alan
ce
Smart Option Student Loans - Serviced Portfolio31-60 Day Delinquencies as a % of Loans in P&I Repayment (1)
Data for Legacy SLM thru April 30, 2014 and Sallie Mae Bank since May 1, 2014P&I Vintages 2010-2014 (2)
Legacy SLM 2010 Vintage: 31-60 Delinquencies as a % of P&I
Legacy SLM 2011 Vintage: 31-60 Delinquencies as a % of P&I
Legacy SLM 2012 Vintage: 31-60 Delinquencies as a % of P&I
Legacy SLM 2013 Vintage: 31-60 Delinquencies as a % of P&I
Legacy SLM 2014 Vintage: 31-60 Delinquencies as a % of P&I
SLM Bank 2011 Vintage: 31-60 Delinquencies as a % of P&I
SLM Bank 2012 Vintage: 31-60 Delinquencies as a % of P&I
SLM Bank 2013 Vintage: 31-60 Delinquencies as a % of P&I
SLM Bank 2014 Vintage: 31-60 Delinquencies as a % of P&I
Pre-Split Post-Split
0.0%
2.0%
4.0%
6.0%
8.0%
10.0%
Dec
-09
Mar-
10
Ju
n-1
0
Se
p-1
0
Dec
-10
Mar-
11
Ju
n-1
1
Se
p-1
1
Dec
-11
Mar-
12
Ju
n-1
2
Se
p-1
2
Dec
-12
Mar-
13
Ju
n-1
3
Se
p-1
3
Dec
-13
Mar-
14
Ju
n-1
4
Se
p-1
4
Dec
-14
Mar-
15
Ju
n-1
5
Pe
rcen
t o
f P
&I R
ep
aym
ent
Bal
ance
Smart Option Student Loans - Serviced Portfolio31-60 Day Delinquencies as a % of Loans in P&I Repayment (1)
Data for Legacy SLM thru April 30, 2014 and Sallie Mae Bank since May 1, 2014
Legacy SLM: 31-60 Delinquencies as a % of P&I
SLM Bank: 31-60 Delinquencies as a % of P&I
Pre-Split Post-Split
(1) Loans in ‘P&I Repayment’ includes only those loans for which scheduled principal and interest payments are due.
(2) SLM Bank 2010 ‘P&I Repayment’ vintage not included due to insufficient data.
Note: Legacy SLM portfolio serviced pursuant to a 212 day charge off policy. Sallie Mae Bank portfolio serviced pursuant to a 120 day charge off policy. Historical trends may not be
indicative of future performance.

27
Smart Option Serviced Portfolio: 61-90 Day Delinquencies
(1) Loans in ‘P&I Repayment’ includes only those loans for which scheduled principal and interest payments are due.
(2) SLM Bank 2010 ‘P&I Repayment’ vintage not included due to insufficient data.
Note: Legacy SLM portfolio serviced pursuant to a 212 day charge off policy. Sallie Mae Bank portfolio serviced pursuant to a 120 day charge off policy. Historical trends may not be
indicative of future performance.
0.0%
2.0%
4.0%
6.0%
8.0%
10.0%
Dec
-09
Mar-
10
Ju
n-1
0
Se
p-1
0
Dec
-10
Mar-
11
Ju
n-1
1
Se
p-1
1
Dec
-11
Mar-
12
Ju
n-1
2
Se
p-1
2
Dec
-12
Mar-
13
Ju
n-1
3
Se
p-1
3
Dec
-13
Mar-
14
Ju
n-1
4
Se
p-1
4
Dec
-14
Mar-
15
Ju
n-1
5
Pe
rcen
t o
f P
&I R
epay
men
t B
alan
ce
Smart Option Student Loans - Serviced Portfolio61-90 Day Delinquencies as a % of Loans in P&I Repayment (1)
Data for Legacy SLM thru April 30, 2014 and Sallie Mae Bank since May 1, 2014P&I Vintages 2010-2014 (2)
Legacy SLM 2010 Vintage: 61-90 Delinquencies as a % of P&I
Legacy SLM 2011 Vintage: 61-90 Delinquencies as a % of P&I
Legacy SLM 2012 Vintage: 61-90 Delinquencies as a % of P&I
Legacy SLM 2013 Vintage: 61-90 Delinquencies as a % of P&I
Legacy SLM 2014 Vintage: 61-90 Delinquencies as a % of P&I
SLM Bank 2011 Vintage: 61-90 Delinquencies as a % of P&I
SLM Bank 2012 Vintage: 61-90 Delinquencies as a % of P&I
SLM Bank 2013 Vintage: 61-90 Delinquencies as a % of P&I
SLM Bank 2014 Vintage: 61-90 Delinquencies as a % of P&I
Pre-Split Post-Split
0.0%
2.0%
4.0%
6.0%
8.0%
10.0%
Dec
-09
Mar-
10
Ju
n-1
0
Se
p-1
0
Dec
-10
Mar-
11
Ju
n-1
1
Se
p-1
1
Dec
-11
Mar-
12
Ju
n-1
2
Se
p-1
2
Dec
-12
Mar-
13
Ju
n-1
3
Se
p-1
3
Dec
-13
Mar-
14
Ju
n-1
4
Se
p-1
4
Dec
-14
Mar-
15
Ju
n-1
5
Pe
rcen
t o
f P
&I R
epay
men
t B
alan
ce
Smart Option Student Loans - Serviced Portfolio61-90 Day Delinquencies as a % of Loans in P&I Repayment (1)
Data for Legacy SLM thru April 30, 2014 and Sallie Mae Bank since May 1, 2014
Legacy SLM: 61-90 Delinquencies as a % of P&I
SLM Bank: 61-90 Delinquencies as a % of P&I
Pre-Split Post-Split

28
Smart Option Serviced Portfolio: 91+ Day Delinquencies
0.0%
2.0%
4.0%
6.0%
8.0%
10.0%
Dec
-09
Mar-
10
Ju
n-1
0
Se
p-1
0
Dec
-10
Mar-
11
Ju
n-1
1
Se
p-1
1
Dec
-11
Mar-
12
Ju
n-1
2
Se
p-1
2
Dec
-12
Mar-
13
Ju
n-1
3
Se
p-1
3
Dec
-13
Mar-
14
Ju
n-1
4
Se
p-1
4
Dec
-14
Mar-
15
Ju
n-1
5
Pe
rcen
t o
f P
&I R
epay
men
t B
alan
ce
Smart Option Student Loans - Serviced Portfolio91+ Day Delinquencies as a % of Loans in P&I Repayment (1)
Data for Legacy SLM thru April 30, 2014 and Sallie Mae Bank since May 1, 2014P&I Vintages 2010-2014 (2)
Legacy SLM 2010 Vintage: 91+ Delinquencies as a % of P&I
Legacy SLM 2011 Vintage: 91+ Delinquencies as a % of P&I
Legacy SLM 2012 Vintage: 91+ Delinquencies as a % of P&I
Legacy SLM 2013 Vintage: 91+ Delinquencies as a % of P&I
Legacy SLM 2014 Vintage: 91+ Delinquencies as a % of P&I
SLM Bank 2011 Vintage: 91+ Delinquencies as a % of P&I
SLM Bank 2012 Vintage: 91+ Delinquencies as a % of P&I
SLM Bank 2013 Vintage: 91+ Delinquencies as a % of P&I
SLM Bank 2014 Vintage: 91+ Delinquencies as a % of P&I
Pre-Split Post-Split
0.0%
2.0%
4.0%
6.0%
8.0%
10.0%
Dec
-09
Mar-
10
Ju
n-1
0
Se
p-1
0
Dec
-10
Mar-
11
Ju
n-1
1
Se
p-1
1
Dec
-11
Mar-
12
Ju
n-1
2
Se
p-1
2
Dec
-12
Mar-
13
Ju
n-1
3
Se
p-1
3
Dec
-13
Mar-
14
Ju
n-1
4
Se
p-1
4
Dec
-14
Mar-
15
Ju
n-1
5
Pe
rcen
t o
f P
&I R
epay
men
t B
alan
ce
Smart Option Student Loans - Serviced Portfolio91+ Day Delinquencies as a % of Loans in P&I Repayment (1)
Data for Legacy SLM thru April 30, 2014 and Sallie Mae Bank since May 1, 2014
Legacy SLM: 91+ Delinquencies as a % of P&I
SLM Bank: 91+ Delinquencies as a % of P&I
Pre-Split Post-Split
(1) Loans in ‘P&I Repayment’ includes only those loans for which scheduled principal and interest payments are due.
(2) SLM Bank 2010 ‘P&I Repayment’ vintage not included due to insufficient data.
Note: Legacy SLM portfolio serviced pursuant to a 212 day charge off policy. Sallie Mae Bank portfolio serviced pursuant to a 120 day charge off policy. Historical trends may not be
indicative of future performance.

29
Smart Option Serviced Portfolio: Forbearance
(1) Loans in ‘P&I Repayment’ includes only those loans for which scheduled principal and interest payments are due.
(2) On June 1, 2015 the FDIC published FIL-23-2015, which encouraged lenders to work constructively with borrowers impacted by the floods in Texas in the spring of 2015. A one-
time, two month disaster forbearance was granted to all student loan customers resident in the impacted area. This doubled our forbearance rate in June. Substantially all of the
borrowers were current at the time the forbearance was granted.
(3) SLM Bank 2010 ‘P&I Repayment’ vintage not included due to insufficient data.
Note: Legacy SLM portfolio serviced pursuant to a 212 day charge off policy. Sallie Mae Bank portfolio serviced pursuant to a 120 day charge off policy. Historical trends may not be indicative
of future performance.
0.0%
2.0%
4.0%
6.0%
8.0%
10.0%
12.0%
14.0%
16.0%
18.0%
20.0%
Dec
-09
Mar-
10
Ju
n-1
0
Se
p-1
0
Dec
-10
Mar-
11
Ju
n-1
1
Se
p-1
1
Dec
-11
Mar-
12
Ju
n-1
2
Se
p-1
2
Dec
-12
Mar-
13
Ju
n-1
3
Se
p-1
3
Dec
-13
Mar-
14
Ju
n-1
4
Se
p-1
4
Dec
-14
Mar-
15
Ju
n-1
5Pe
rcen
t o
f P
&IR
ep
aym
ent
and
Fo
rbea
ran
ce B
alan
ce
Smart Option Student Loans - Serviced PortfolioForbearance as a % of Loans in P&I Repayment and Forbearance (1), (2)
Data for Legacy SLM thru April 30, 2014 and Sallie Mae Bank since May 1, 2014P&I Vintages 2010-2014 (3)
Legacy SLM 2010 Vintage: Forbearance as a % of P&I Repayment and ForbearanceLegacy SLM 2011 Vintage: Forbearance as a % of P&I Repayment and ForbearanceLegacy SLM 2012 Vintage: Forbearance as a % of P&I Repayment and ForbearanceLegacy SLM 2013 Vintage: Forbearance as a % of P&I Repayment and ForbearanceLegacy SLM 2014 Vintage: Forbearance as a % of P&I Repayment and ForbearanceSLM Bank 2011 Vintage: Forbearance as a % of P&I Repayment and ForbearanceSLM Bank 2012 Vintage: Forbearance as a % of P&I Repayment and ForbearanceSLM Bank 2013 Vintage: Forbearance as a % of P&I Repayment and ForbearanceSLM Bank 2014 Vintage: Forbearance as a % of P&I Repayment and Forbearance
Pre-Split Post-Split
0.0%
2.0%
4.0%
6.0%
8.0%
10.0%
12.0%
14.0%
16.0%
18.0%
20.0%
Dec
-09
Mar-
10
Ju
n-1
0
Se
p-1
0
Dec
-10
Mar-
11
Ju
n-1
1
Se
p-1
1
Dec
-11
Mar-
12
Ju
n-1
2
Se
p-1
2
Dec
-12
Mar-
13
Ju
n-1
3
Se
p-1
3
Dec
-13
Mar-
14
Ju
n-1
4
Se
p-1
4
Dec
-14
Mar-
15
Ju
n-1
5Pe
rcen
t o
f P
&IR
ep
aym
ent
and
Fo
rbea
ran
ce B
alan
ce
Smart Option Student Loans - Serviced PortfolioForbearance as a % of Loans in P&I Repayment and Forbearance (1), (2)
Data for Legacy SLM thru April 30, 2014 and Sallie Mae Bank since May 1, 2014
Legacy SLM: Forbearance as a % of P&I Repayment and Forbearance
SLM Bank: Forbearance as a % of P&I Repayment and Forbearance
Pre-Split Post-Split

30
Smart Option Serviced Portfolio: Annualized Gross Defaults
(1) Loans in ‘P&I Repayment’ include only those loans for which scheduled principal and interest payments are due. Defaults occurring prior to ‘P&I Repayment’ are not represented
in the data.
(2) SLM Bank 2010 ‘P&I Repayment’ vintage not included due to insufficient data.
Note: Legacy SLM portfolio serviced pursuant to a 212 day charge off policy. Sallie Mae Bank portfolio serviced pursuant to a 120 day charge off policy. Historical trends may not be
indicative of future performance.
0.0%
2.0%
4.0%
6.0%
8.0%
10.0%
Dec
-09
Mar-
10
Ju
n-1
0
Se
p-1
0
Dec
-10
Mar-
11
Ju
n-1
1
Se
p-1
1
Dec
-11
Mar-
12
Ju
n-1
2
Se
p-1
2
Dec
-12
Mar-
13
Ju
n-1
3
Se
p-1
3
Dec
-13
Mar-
14
Ju
n-1
4
Se
p-1
4
Dec
-14
Mar-
15
Ju
n-1
5
Pe
rcen
t o
f P
&I R
epay
men
t B
alan
ce
Smart Option Student Loans - Serviced PortfolioAnnualized Gross Defaults as a % of Loans in P&I Repayment(1)
Data for Legacy SLM thru April 30, 2014 and Sallie Mae Bank since May 1, 2014P&I Vintages 2010-2014 (2)
Legacy SLM 2010 Vintage: Annualized Gross Defaults as a % of Loans in P&I RepaymentLegacy SLM 2011 Vintage: Annualized Gross Defaults as a % of Loans in P&I RepaymentLegacy SLM 2012 Vintage: Annualized Gross Defaults as a % of Loans in P&I RepaymentLegacy SLM 2013 Vintage: Annualized Gross Defaults as a % of Loans in P&I RepaymentLegacy SLM 2014 Vintage: Annualized Gross Defaults as a % of Loans in P&I RepaymentSLM Bank 2011 Vintage: Annualized Gross Defaults as a % of Loans in P&I RepaymentSLM Bank 2012 Vintage: Annualized Gross Defaults as a % of Loans in P&I RepaymentSLM Bank 2013 Vintage: Annualized Gross Defaults as a % of Loans in P&I RepaymentSLM Bank 2014 Vintage: Annualized Gross Defaults as a % of Loans in P&I Repayment
Pre-Split Post-Split
0.0%
2.0%
4.0%
6.0%
8.0%
10.0%
Dec
-09
Mar-
10
Ju
n-1
0
Se
p-1
0
Dec
-10
Mar-
11
Ju
n-1
1
Se
p-1
1
Dec
-11
Mar-
12
Ju
n-1
2
Se
p-1
2
Dec
-12
Mar-
13
Ju
n-1
3
Se
p-1
3
Dec
-13
Mar-
14
Ju
n-1
4
Se
p-1
4
Dec
-14
Mar-
15
Ju
n-1
5
Pe
rcen
t o
f P
&I R
epay
men
t B
alan
ce
Smart Option Student Loans - Serviced PortfolioAnnualized Gross Defaults as a % of Loans in P&I Repayment(1)
Data for Legacy SLM thru April 30, 2014 and Sallie Mae Bank since May 1, 2014
Legacy SLM: Annualized Gross Defaults as a % of Loans in P&I Repayment
SLM Bank: Annualized Gross Defaults as a % of Loans in P&I Repayment
Pre-Split Post-Split

31
Smart Option Vintage Data: Voluntary Prepayments
0.0%
2.0%
4.0%
6.0%
8.0%
10.0%
12.0%
14.0%
1 2 3 4 5 6 7 8 9 10 11 12 13 14 15 16 17
% C
PR
Quarters Since Disbursement
Smart Option Student Loans - Serviced PortfolioVoluntary CPR by Origination Vintage (1)
Interest Only, Fixed Payment and Deferred ProductsData for Legacy SLM thru April 30, 2014 and Sallie Mae Bank since May 1, 2014 (2)
2010 Vintage 2011 Vintage
2012 Vintage 2013 Vintage
2014 Vintage
► Following the first year after disbursement, voluntary prepayments have generally ranged from between 2-3% for
the Smart Option Deferred loan product, to 5-6% for the Interest Only product
(1) Data for all loans from initial disbursement, whether or not scheduled payments are due. Voluntary CPR includes only voluntary prepayments.
(2) Data as of June 30, 2015. Partial periods are removed from the analysis.
Note: Legacy SLM and Navient portfolio serviced pursuant to a 212 day charge-off policy. Sallie Mae Bank portfolio serviced pursuant to a 120 day charge-off policy. Historical trends may not be indicative of future performance.
0.0%
2.0%
4.0%
6.0%
8.0%
10.0%
12.0%
14.0%
1 2 3 4 5 6 7 8 9 10 11 12 13 14 15 16 17
% C
PR
Quarters Since Disbursement
Smart Option Student Loans - Serviced PortfolioVoluntary CPR by Origination Vintage and Product (1)
Interest Only, Fixed Payment and Deferred ProductsData for Legacy SLM thru April 30, 2014 and Sallie Mae Bank since May 1, 2014 (2)
2010 Cohort, Smart Option IO Total 2010 Cohort, Smart Option Fixed Total2011 Cohort, Smart Option IO Total 2011 Cohort, Smart Option Fixed Total2012 Cohort, Smart Option IO Total 2012 Cohort, Smart Option Fixed Total2012 Cohort, Smart Option Deferred Total 2013 Cohort, Smart Option IO Total2013 Cohort, Smart Option Fixed Total 2013 Cohort, Smart Option Deferred Total2014 Cohort, Smart Option IO Total 2014 Cohort, Smart Option Fixed Total2014 Cohort, Smart Option Deferred Total

32
Smart Option Vintage Data: Total Prepayments
► Following the first year after disbursement, total prepayments have generally ranged around 4%
(1) Data for all loans from initial disbursement, whether or not scheduled payments are due. Total CPR includes both voluntary prepayments and defaults.
(2) Data as of June 30, 2015. Partial periods are removed from the analysis.
Note: Legacy SLM and Navient portfolio serviced pursuant to a 212 day charge-off policy. Sallie Mae Bank portfolio serviced pursuant to a 120 day charge-off policy. Historical trends may not be indicative of future performance.
0.0%
2.0%
4.0%
6.0%
8.0%
10.0%
12.0%
14.0%
1 2 3 4 5 6 7 8 9 10 11 12 13 14 15 16 17
% C
PR
Quarters Since Disbursement
Smart Option Student Loans - Serviced PortfolioTotal CPR by Origination Vintage (1)
Interest Only, Fixed Payment and Deferred ProductsData for Legacy SLM thru April 30, 2014 and Sallie Mae Bank since May 1, 2014 (2)
2010 Vintage 2011 Vintage 2012 Vintage
2013 Vintage 2014 Vintage
0.0%
2.0%
4.0%
6.0%
8.0%
10.0%
12.0%
14.0%
1 2 3 4 5 6 7 8 9 10 11 12 13 14 15 16 17
% C
PR
Quarters Since Disbursement
Smart Option Student Loans - Serviced PortfolioTotal CPR by Origination Vintage and Product (1)
Interest Only, Fixed Payment and Deferred ProductsData for Legacy SLM thru April 30, 2014 and Sallie Mae Bank since May 1, 2014 (2)
2010 Cohort, Smart Option IO Total 2010 Cohort, Smart Option Fixed Total2011 Cohort, Smart Option IO Total 2011 Cohort, Smart Option Fixed Total2012 Cohort, Smart Option IO Total 2012 Cohort, Smart Option Fixed Total2012 Cohort, Smart Option Deferred Total 2013 Cohort, Smart Option IO Total2013 Cohort, Smart Option Fixed Total 2013 Cohort, Smart Option Deferred Total2014 Cohort, Smart Option IO Total 2014 Cohort, Smart Option Fixed Total2014 Cohort, Smart Option Deferred Total

33
Smart Option: Cumulative Recoveries
► Recoveries of charged-off Smart Option Student Loans® historically have occurred over a longer period than for
many other types of unsecured consumer credit
(1) Certain data used in the charts above was provided by Navient under a data sharing agreement. Sallie Mae Bank has not independently verified, and is not able to verify, the accuracy or completeness of the data provided under the
agreement.
Note: Recovery data is for collections of charged-off Smart Option loans managed by legacy SLM and Navient only. Sallie Mae Bank is currently selling charged off loans to third parties. Sallie Mae Bank intends to add third party collection
agency management, account placement and other functionality necessary to manage charged-off loan collections internally. In the future, Sallie Mae expects to have the option of selling or internally managing collections of charged off
loans, and to utilize one or both of those strategies at any time based on market conditions. Legacy SLM and Navient portfolio serviced pursuant to a 212 day charge-off policy. Sallie Mae Bank portfolio serviced pursuant to a 120 day charge-
off policy. Historical trends may not be indicative of future performance.
24.0%
0.0%
5.0%
10.0%
15.0%
20.0%
25.0%
30.0%
0 4 8 12 16 20 24 28 32 36 40 44 48 52 56 60
Cu
mu
lati
ve R
eco
very
Rat
e as
a %
of
Ch
arge
d O
ff L
oan
Bal
ance
Monthly Periods Since Charge Off
Smart Option Loan Cumulative Recovery Ratefor Combined Charge-Offs Since 2010
Data for Legacy SLM and Navient thru June 30, 2015 (1)
Combined Charge-Offs; Recoveries as a % of Charge-Off Principal
26.6%
24.7%
21.7%
16.7%
14.0%
0.0%
5.0%
10.0%
15.0%
20.0%
25.0%
30.0%
0 4 8 12 16 20 24 28 32 36 40 44 48 52 56 60
Cu
mu
lati
ve R
eco
very
Rat
e as
a %
of
Ch
arge
d O
ff L
oan
Bal
ance
Monthly Periods Since Charge Off
Smart Option Loan Cumulative Recovery RateFor Charge-Off Vintages Since 2010Data for Legacy SLM and Navient thru June 30, 2015 (1)
2010 Charge-Off Vintage; Recoveries as a % of Charge-Off Principal
2011 Charge-Off Vintage; Recoveries as a % of Charge-Off Principal
2012 Charge-Off Vintage; Recoveries as a % of Charge-Off Principal
2013 Charge-Off Vintage; Recoveries as a % of Charge-Off Principal
2014 Charge-Off Vintage; Recoveries as a % of Charge-Off Principal

3434
Cohort Default Triangles

35
The following cohort default triangles provide loan performance information for Legacy SLM, Navient and Sallie Mae Bank
serviced Smart Option loans combined, thru the most recent period indicated (1)
Terms and calculations used in the cohort default triangles are defined below:
P&I Repayment Year – The calendar year that loans entered P&I repayment
All Smart Option loans are considered to be in P&I repayment any time the borrower is required to make full principal and interest
payments on the loan
Disbursed Principal Entering P&I Repayment – The amount of principal entering P&I repayment in a given year, based on disbursed principal
prior to any interest capitalization
Years in P&I Repayment – Measured in years between P&I repayment start date and default date. Year zero represents defaults that occurred
prior to the start of P&I repayment
Periodic Defaults – Defaulted principal in each Year in P&I Repayment as a percentage of the disbursed principal entering repayment in each
P&I Repayment Year
Defaulted principal includes any interest capitalization that occurred prior to default
Defaulted principal is not reduced by any amounts recovered after the loan defaulted
Because the numerator includes capitalized interest while the denominator does not, default rates are higher than if the numerator and
denominator both included capitalized interest
Total – The sum of Periodic Defaults across Years in P&I Repayment for each P&I Repayment Year
(1) Data excludes loans made to borrowers attending certain for profit schools not included in legacy SLM securitizations. Excluded loans represent less than one percent of the total loan balances.
Note: Historical trends suggested by the cohort default triangles may not be indicative of future performance. Legacy SLM and Navient serviced loans were serviced pursuant to a 212 day charge off
policy. Sallie Mae Bank serviced loans were serviced pursuant to a 120 day charge off policy.
Smart Option Loan Program Cohort Default Triangles

36
Cohort Default Triangles – Smart Option Combined (IO, Fixed & Deferred)
Data as of 6/30/15.
(1) Private education loans marketed under the Smart Option Student Loan brand.
(2) Periodic Defaults for the most recent calendar Year in P& I Repayment are for a partial year.
(3) Numerator is the amount of principal in each P&I Repayment Cohort that defaulted in each Year in P&I Repayment. Denominator is the amount of disbursed principal for that P&I Repayment Year.
Smart Option Combined (P&I Repayment Status - No Co-Signer)
Smart Option Combined (P&I Repayment Status - Co-Signer)
Smart Option Combined (P&I Repayment Status - Total)
P&I
Repayment
Year
Disbursed Principal
Entering P&I
Repayment ($m)
Periodic Defaults by Years in P&I Repayment (1), (2), (3)
0 1 2 3 4 5 Total
2010 $440 1.0% 1.2% 1.1% 1.0% 0.9% 0.4% 5.7%
2011 $1,020 0.8% 1.0% 1.3% 1.0% 0.7% 4.8%
2012 $1,657 0.5% 0.8% 1.3% 0.8% 0.0% 3.4%
2013 $2,298 0.3% 0.9% 1.2% 0.0% 0.0% 2.4%
2014 $2,848 0.3% 1.0% 0.0% 0.0% 0.0% 1.3%
P&I
Repayment
Year
Disbursed Principal
Entering P&I
Repayment ($m)
Periodic Defaults by Years in P&I Repayment (1), (2), (3)
0 1 2 3 4 5 Total
2010 $420 1.0% 1.1% 1.1% 1.0% 0.9% 0.4% 5.5%
2011 $936 0.7% 0.9% 1.2% 1.0% 0.6% 4.4%
2012 $1,512 0.4% 0.6% 1.1% 0.8% 0.0% 2.9%
2013 $2,083 0.3% 0.7% 1.0% 0.0% 0.0% 2.0%
2014 $2,567 0.3% 0.7% 0.0% 0.0% 0.0% 1.0%
P&I
Repayment
Year
Disbursed Principal
Entering P&I
Repayment ($m)
Periodic Defaults by Years in P&I Repayment (1), (2), (3)
0 1 2 3 4 5 Total
2010 $20 1.5% 2.4% 1.7% 1.6% 1.2% 0.5% 8.9%
2011 $85 1.8% 2.6% 2.2% 1.8% 1.0% 9.3%
2012 $145 1.1% 2.5% 2.9% 1.6% 0.0% 8.0%
2013 $215 0.8% 2.6% 2.7% 0.0% 0.0% 6.1%
2014 $282 0.9% 2.9% 0.0% 0.0% 0.0% 3.8%
Note: Certain data used in the charts above was provided by Navient under a data sharing agreement. Sallie Mae Bank has not independently verified, and is not able to verify, the accuracy or completeness of the data provided under
the agreement. Cumulative charge off rate calculations for the period ended June 30, 2015 include $28.7 million of charged off loans sold to third parties prior to March 31, 2015 not included in previously reported cumulative charge off
rate calculations. Inclusion of these charge offs contributed to the increase in cumulative charge off rates for the period ended June 30, 2015 over those previously reported for the period ended March 31, 2015.

37
Cohort Default Triangles – Smart Option Interest Only
Smart Option IO (P&I Repayment Status - No Co-Signer)
Smart Option IO (P&I Repayment Status - Co-Signer)
Smart Option IO (P&I Repayment Status - Total)
P&I
Repayment
Year
Disbursed Principal
Entering P&I
Repayment ($m)
Periodic Defaults by Years in P&I Repayment (1), (2), (3)
0 1 2 3 4 5 Total
2010 $439 1.1% 1.2% 1.1% 1.0% 0.9% 0.4% 5.7%
2011 $785 0.9% 0.9% 1.2% 0.9% 0.6% 0.0% 4.6%
2012 $865 0.7% 0.6% 0.9% 0.6% 0.0% 0.0% 2.8%
2013 $901 0.6% 0.6% 0.8% 0.0% 0.0% 0.0% 1.9%
2014 $870 0.5% 0.5% 0.0% 0.0% 0.0% 0.0% 1.0%
P&I
Repayment
Year
Disbursed Principal
Entering P&I
Repayment ($m)
Periodic Defaults by Years in P&I Repayment (1), (2), (3)
0 1 2 3 4 5 Total
2010 $419 1.0% 1.1% 1.1% 1.0% 0.9% 0.4% 5.5%
2011 $724 0.8% 0.8% 1.2% 0.9% 0.6% 0.0% 4.3%
2012 $797 0.6% 0.5% 0.8% 0.6% 0.0% 0.0% 2.6%
2013 $827 0.5% 0.5% 0.7% 0.0% 0.0% 0.0% 1.6%
2014 $790 0.5% 0.4% 0.0% 0.0% 0.0% 0.0% 0.8%
P&I
Repayment
Year
Disbursed Principal
Entering P&I
Repayment ($m)
Periodic Defaults by Years in P&I Repayment (1), (2), (3)
0 1 2 3 4 5 Total
2010 $20 1.5% 2.5% 1.7% 1.6% 1.2% 0.5% 9.0%
2011 $61 2.0% 2.2% 1.8% 1.5% 0.9% 0.0% 8.5%
2012 $68 1.3% 1.8% 2.2% 1.0% 0.0% 0.0% 6.3%
2013 $74 1.4% 1.9% 1.7% 0.0% 0.0% 0.0% 5.0%
2014 $80 1.3% 1.5% 0.0% 0.0% 0.0% 0.0% 2.8%Data as of 6/30/15.
(1) Private education loans marketed under the Smart Option Student Loan brand.
(2) Periodic Defaults for the most recent calendar Year in P&I Repayment are for a partial year.
(3) Numerator is the amount of principal in each P&I Repayment Cohort that defaulted in each Year in P&I Repayment. Denominator is the amount of disbursed principal for that P&I Repayment Year.
Note: Certain data used in the charts above was provided by Navient under a data sharing agreement. Sallie Mae Bank has not independently verified, and is not able to verify, the accuracy or completeness of the data provided under
the agreement. Cumulative charge off rate calculations for the period ended June 30, 2015 include $28.7 million of charged off loans sold to third parties prior to March 31, 2015 not included in previously reported cumulative charge off
rate calculations. Inclusion of these charge offs contributed to the increase in cumulative charge off rates for the period ended June 30, 2015 over those previously reported for the period ended March 31, 2015.
38
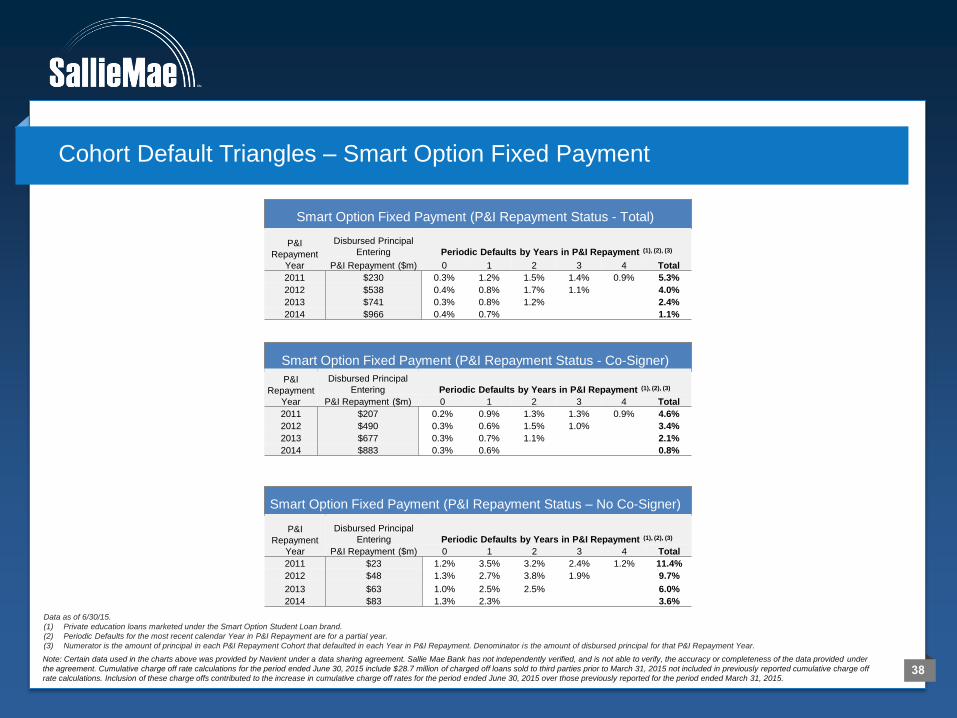
Cohort Default Triangles – Smart Option Fixed Payment
Smart Option Fixed Payment (P&I Repayment Status – No Co-Signer)
Smart Option Fixed Payment (P&I Repayment Status - Co-Signer)
Smart Option Fixed Payment (P&I Repayment Status - Total)
P&I
Repayment
Year
Disbursed Principal
Entering Periodic Defaults by Years in P&I Repayment (1), (2), (3)
P&I Repayment ($m) 0 1 2 3 4 Total
2011 $230 0.3% 1.2% 1.5% 1.4% 0.9% 5.3%
2012 $538 0.4% 0.8% 1.7% 1.1% 0.0% 4.0%
2013 $741 0.3% 0.8% 1.2% 0.0% 0.0% 2.4%
2014 $966 0.4% 0.7% 0.0% 0.0% 0.0% 1.1%
P&I
Repayment
Year
Disbursed Principal
Entering Periodic Defaults by Years in P&I Repayment (1), (2), (3)
P&I Repayment ($m) 0 1 2 3 4 Total
2011 $207 0.2% 0.9% 1.3% 1.3% 0.9% 4.6%
2012 $490 0.3% 0.6% 1.5% 1.0% 0.0% 3.4%
2013 $677 0.3% 0.7% 1.1% 0.0% 0.0% 2.1%
2014 $883 0.3% 0.6% 0.0% 0.0% 0.0% 0.8%
P&I
Repayment
Year
Disbursed Principal
Entering Periodic Defaults by Years in P&I Repayment (1), (2), (3)
P&I Repayment ($m) 0 1 2 3 4 Total
2011 $23 1.2% 3.5% 3.2% 2.4% 1.2% 11.4%
2012 $48 1.3% 2.7% 3.8% 1.9% 0.0% 9.7%
2013 $63 1.0% 2.5% 2.5% 0.0% 0.0% 6.0%
2014 $83 1.3% 2.3% 0.0% 0.0% 0.0% 3.6%
Data as of 6/30/15.
(1) Private education loans marketed under the Smart Option Student Loan brand.
(2) Periodic Defaults for the most recent calendar Year in P&I Repayment are for a partial year.
(3) Numerator is the amount of principal in each P&I Repayment Cohort that defaulted in each Year in P&I Repayment. Denominator is the amount of disbursed principal for that P&I Repayment Year.
Note: Certain data used in the charts above was provided by Navient under a data sharing agreement. Sallie Mae Bank has not independently verified, and is not able to verify, the accuracy or completeness of the data provided under
the agreement. Cumulative charge off rate calculations for the period ended June 30, 2015 include $28.7 million of charged off loans sold to third parties prior to March 31, 2015 not included in previously reported cumulative charge off
rate calculations. Inclusion of these charge offs contributed to the increase in cumulative charge off rates for the period ended June 30, 2015 over those previously reported for the period ended March 31, 2015.

39
Cohort Default Triangles – Smart Option Deferred Payment
Smart Option Deferred (P&I Repayment Status – No Co-Signer)
Smart Option Deferred (P&I Repayment Status - Co-Signer)
Smart Option Deferred (P&I Repayment Status - Total)
P&I Repayment
Disbursed Principal
Entering P&I Periodic Defaults by Years in P&I Repayment (1), (2),(3)
Year Repayment ($m) 0 1 2 3 Total
2012 $253 0.0% 1.2% 1.4% 1.2% 3.9%
2013 $657 0.0% 1.3% 1.8% 0.0% 3.2%
2014 $1,012 0.1% 1.6% 0.0% 0.0% 1.8%
P&I Repayment
Disbursed Principal
Entering P&I Periodic Defaults by Years in P&I Repayment (1), (2),(3)
Year Repayment ($m) 0 1 2 3 Total
2012 $224 0.0% 0.9% 1.2% 1.1% 3.2%
2013 $579 0.0% 1.1% 1.5% 0.0% 2.6%
2014 $893 0.1% 1.2% 0.0% 0.0% 1.4%
P&I Repayment
Year
Disbursed Principal
Entering P&I Periodic Defaults by Years in P&I Repayment (1), (2),(3)
Repayment ($m) 0 1 2 3 Total
2012 $29 0.0% 3.8% 3.0% 2.3% 9.1%
2013 $78 0.1% 3.3% 3.7% 0.0% 7.1%
2014 $119 0.3% 4.3% 0.0% 0.0% 4.7%
Data as of 6/30/15.
(1) Private education loans marketed under the Smart Option Student Loan brand.
(2) Periodic Defaults for the most recent calendar Year in P&I Repayment are for a partial year.
(3) Numerator is the amount of principal in each P&I Repayment Cohort that defaulted in each Year in P&I Repayment. Denominator is the amount of disbursed principal for that P&I Repayment Year.
Note: Certain data used in the charts above was provided by Navient under a data sharing agreement. Sallie Mae Bank has not independently verified, and is not able to verify, the accuracy or completeness of the data provided under
the agreement. Cumulative charge off rate calculations for the period ended June 30, 2015 include $28.7 million of charged off loans sold to third parties prior to March 31, 2015 not included in previously reported cumulative charge off
rate calculations. Inclusion of these charge offs contributed to the increase in cumulative charge off rates for the period ended June 30, 2015 over those previously reported for the period ended March 31, 2015.