Embed Size (px)
Citation preview


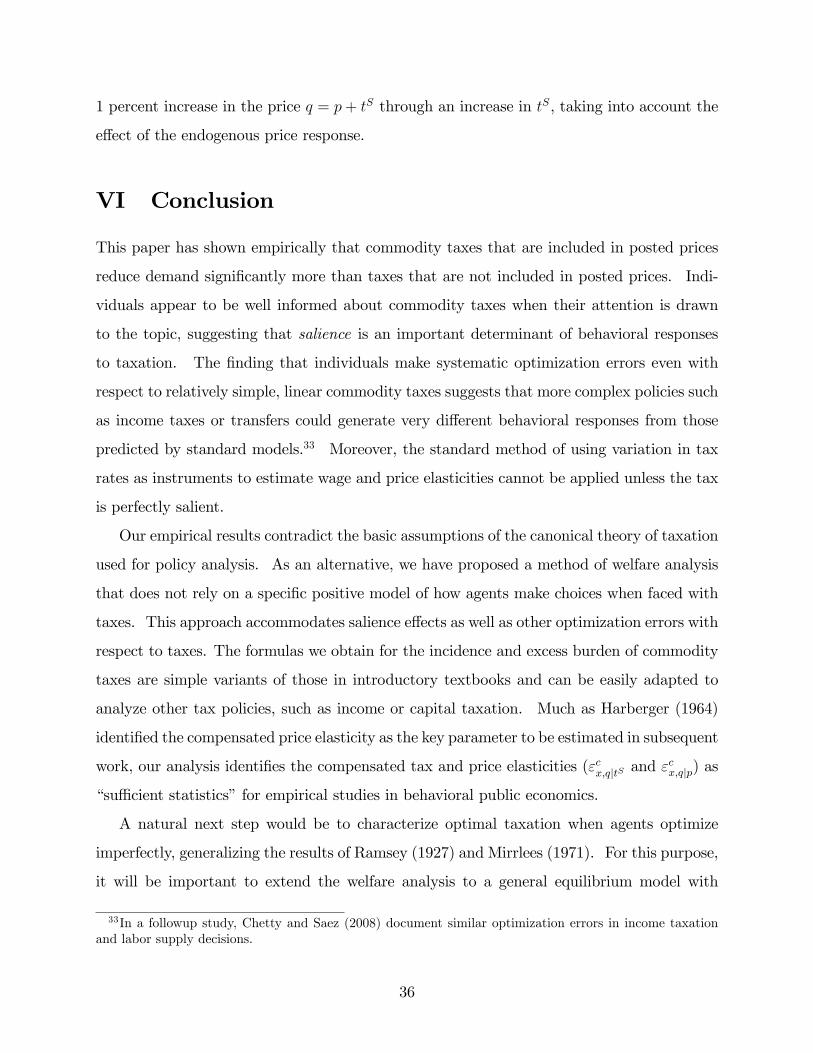


EXHIBIT 1Tax-Inclusive Price Tags
Orig.Tag
Exp.Tag

Figure 1Distribution of Placebo Estimates: Log Quantity
Em
piric
al C
DF
Estimated Placebo Coefficient (δP)
1.9
.8.7
.6.5
.4.3
.2.1
0
-.2 -.1 0 .1 .2
NOTE– This figure plots the empirical distribution of placebo effects (G for log quantity. The CDF isconstructed from 4,725 estimates of P using the specification in column 3 of Table 4. No parametricsmoothing is applied: the CDF appears smooth because of the large number of points used to constructit. The vertical line shows the treatment effect estimate reported in Table 4.

-.1
-.05
0.0
5.1
-.02 -.015 -.01 -.005 0 .005 .01 .015 .02
Figure 2aPer Capita Beer Consumption and State Beer Excise Taxes
Cha
nge
in L
og P
er C
apita
Bee
r C
onsu
mpt
ion
Change in Log(1+Beer Excise Rate)
-.1
-.05
0.0
5.1
-.02 -.015 -.01 -.005 0 .005 .01 .015 .02
Figure 2bPer Capita Beer Consumption and State Sales Taxes
Cha
nge
in L
og P
er C
apita
Bee
r C
onsu
mpt
ion
Change in Log(1+Sales Tax Rate)
NOTE–These figures plot within-state annual changes in beer consumption against within-statechanges in gross-of-tax-prices (1 tE and 1 tS). To construct Figure 2a, we round each state excisetax change to the nearest tenth of a percent (0.1%), and compute the mean change in log beerconsumption for observations with the same rounded excise tax change. Figure 2a plots the meanconsumption change against the rounded excise tax rates. Figure 2b is constructed analogously,rounding sales tax changes to the nearest 0.1%. See Appendix A for data sources and sampledefinition.

S,D
Pre-tax price p
Figure 3Incidence of Taxation
1
2
1 – excess supply of Ecreated by imposition of tax
2 – re-equilibriation of marketthrough pre-tax price cut
)( pS
/( )S Dp pdp E ∂ ∂
∂ ∂= −
1
0
p
p
E tS D/ t S
D p|tS 0
D p|tS
NOTE–This figure illustrates the incidence of introducing a tax ts levied on consumers in a marketthat is initially untaxed. The figure plots supply and demand as a function of the pre-tax price p. Theinitial price-demand curve is D p|tS 0 ; the price-demand curve after the tax is introduced is D p|tS .When the tax is levied, the demand curve shifts inward by tS D/ tS units, creating an excess supplyof E tS D/ tS. To re-equilibriate the market, producers cut the pre-tax price byE/ S/ p D/ p units, implying dp
dtS
D/ tS
S/ p D/ p.

Figure 4Excess Burden with Quasilinear Utility
Stp,
x
0p
0x
)(')0,( xupx =
AB
C
D EG
H
F
1x*1x
I
p0 tS
x p0, tS
tS x
tS
tS x/ tS
x/ p
EB 12
tS 2 x/ tS
x/ px/ tS
NOTE–This figure illustrates the deadweight cost of introducing a tax ts levied on consumers whenutility is quasilinear and producer prices are fixed. The figure plots two demand curves: (1) theprice-demand curve x p, 0 , which shows how demand varies with the pre-tax price of the good and (2)the tax-demand curve x p0, tS , which shows how demand varies with the tax. The figure is drawnassuming | x/ tS | | x/ p | consistent with the empirical evidence. The tax reduces demand from x0 tox1. The consumer’s surplus after the implementation of the tax is given by triangle DGC minustriangle DEF. The revenue raised from the tax corresponds to the rectangle GBEH. The change intotal surplus – government revenue plus consumer surplus – equals the shaded triangle AFH.

Panel A: Classroom Survey: Mean Median Standard Deviation
Original Price Tags: Correct tax-inclusive price w/in $0.25 0.18 0.00 0.39
Experimental Price Tags: Correct tax-inclusive price w/in $0.25 0.75 1.00 0.43
T-test for equality of means: p < 0.001
N=49
Panel B: Grocery Store SurveyMean Median Standard Deviation
Local Sales Tax Rate 7.48 7.39 0.80 (Actual rate is 7.375 percent)
Fraction correctly reporting tax status:
All items 0.82 1.00 0.38
Beer 0.90 1.00 0.30
Cigarettes 0.98 1.00 0.15
Cookies 0.65 1.00 0.48
Magazines 0.87 1.00 0.34
Milk 0.82 1.00 0.38
Potatoes 0.81 1.00 0.39
Soda 0.76 1.00 0.43
Toothpaste 0.80 1.00 0.40
N=91
TABLE 1Survey Evidence: Summary Statistics
Notes: Panel A : Reports summary statistics for a survey of 49 students who were shown regular (non-tax inclusive) price tax and the experimental (tax-inclusive) price tags. Statistics shown are for an indicator for whether individual reported total bill within 25 cents of total tax-inclusive price. See Appendix Exhibit 1 for survey instrument. Panel B : Reports summary statistics for a survey of 91 customers at the treatment grocery store. See Appendix Exhibit 2 for survey instrument.

TotalTreatment Control Treatment Control All StoresProducts Products Products Products and Products
A. Category Level Statistics: (1) (2) (3) (4) (5)
Weekly quantity sold 25.08 26.63 27.84 30.64 29.01per category (24.1) (38.1) (27.4) (47.0) (42.5)
Weekly revenue $97.85 $136.05 $107.04 $154.66 $143.10per category (81.9) (169.9) (92.3) (207.7) (187.1)
Number of categories 13 95 13 95 108
B. Product Level Statistics
Pre-tax product price $4.46 $6.26 $4.52 $6.31 $6.05(1.8) (4.3) (1.7) (4.2) (4.1)
Pre-tax product price $4.27 $5.61 $4.29 $5.59 $5.45(weighted by quantity sold) (1.7) (3.9) (1.6) (3.8) (3.7)
Weekly quantity sold 1.47 1.82 1.61 1.98 1.88per product (conditional >0) (0.9) (1.6) (1.1) (1.9) (1.7)
TABLE 2Grocery Experiment: Summary Statistics
Notes: Statistics reported are means with standard deviations in parentheses. Statistics are based on sales between 2005 week 1 and 2006 week 15. Data source is scanner data obtained from a grocery chain. The "Treatment Store" is the store where the intervention took place; the "Control Stores" are two nearby stores in the same chain. "Treatment products" are cosmetics, hair care accessories, and deodorants. "Control Products" are other toiletries located in the same aisles; see Appendix Table 2 for complete list. Product price reflects actual price paid, including any discount if product is on sale. See Appendix A for data sources and sample definition.
Treatment Store Control Stores

Period Difference
Baseline 26.48 25.17 -1.31(2005:1- (0.22) (0.37) (0.43) 2006:6) [5,510] [754] [6,264]
Experiment 27.32 23.87 -3.45(2006: 8- (0.87) (1.02) (0.64) 2006:10) [285] [39] [324]
Difference 0.84 -1.30 DDTS = -2.14over time (0.75) (0.92) (0.68)
[5,795] [793] [6,588]
Period Difference
Baseline 30.57 27.94 -2.63(2005:1- (0.24) (0.30) (0.32) 2006:6) [11,020] [1,508] [12,528]
Experiment 30.76 28.19 -2.57(2006: 8- (0.72) (1.06) (1.09) 2006:10) [570] [78] [648]
Difference 0.19 0.25 DDCS = 0.06over time (0.64) (0.92) (0.95)
[11,590] [1,586] [13,176]
DDD Estimate -2.20(0.59)
[19,764]
CONTROL STORES
Control Categories Treated Categories
Notes: Each cell shows mean quantity sold per category per week, for various subsets of the sample. Standard errors (clustered by week) in parentheses, number of observations in square brackets. Experimental period spans week 8 in 2006 to week 10 in 2006. Baseline period spans week 1 in 2005 to week 6 in 2006. Lower panel reflects averages across the two control stores.
Effect of Posting Tax-Inclusive Prices: DDD Analysis of Mean Quantity SoldTABLE 3
TREATMENT STORE
Control Categories Treated Categories

Dependent Variable: Quantity per category
Revenue per category ($)
Log quantity per category
Quantity per category
Quantity (treat. categories only)
(1) (2) (3) (4) (5)Treatment -2.20 -13.12 -0.101 -2.27 -1.55
(0.60) (4.89) (0.03) (0.60) (0.35)
Average Price -3.15 -3.24 -3.04 -15.06(0.26) (1.74) (0.25) (3.55)
Average Price Squared 0.05 0.06 0.05 1.24(0.00) (0.03) (0.00) (0.34)
Log Average Price -1.59(0.11)
Before Treatment -0.21(1.07)
After Treatment 0.20(0.78)
Category, Store, Week FEs x x x x x
Sample size 19,764 19,764 18,827 21,060 2,379
TABLE 4Effect of Posting Tax-Inclusive Prices: Regression Estimates
Notes: Standard errors, clustered by week, reported in parentheses. All columns report estimates of the linear regression model specified in equation (4). Quantity and revenue reflect total sales of products within a given category per week in each store. Average price is a weighted average of the prices of the products for sale in each category using a fixed basket of products (weighted by total quantity sold) over time. In column 3, observations are weighted by total revenue by category-store. Specification 4 includes "placebo" treatment variables (and their interactions) for the 3 week period before the experiment and the 3 week period after the experiment. Specification 5 reports DD estimates restricting the sample to treatment product categories only (at both treatment and control stores). In this specification, the "Treatment" variable is defined as the interaction between the treatment store dummy and treatment time dummy.

Per-Capita Beer Consumption (cans) 243.2(46.1)
State Beer Excise Tax ($/case) 0.51(0.50)
State Beer Excise Tax (percent) 6.5(8.2)
Sales Tax (percent) 4.3(1.9)
Drinking Age is 21 0.73(0.44)
Drunk Driving Standard 0.65(0.47)
Any Alcohol Regulation Change 0.19(0.39)
N (number of state-year pairs) 1,666
TABLE 5Summary Statistics for State Beer Consumption, Taxes, and Regulation
Notes: Statistics reported are means with standard deviations in parentheses. Observations are by state for each year from 1970 to 2003. "Drinking Age is 21" is an indicator for whether the state-year has a legal drinking age of 21; "Drunk Driving Standard" indicates state-year has a threshold blood alcohol content level above which one is automatically guilty of drunk driving. "Any Alcohol Regulation Change" is a dummy variable equal to one in any year where a state has raised the drinking age, implemented a stricter drunk driving standard, implemented an administrative license revocation law, or a zero tolerance youth drunk driving law. See Appendix A for data sources and sample definition.

Dependent Variable: Change in Log(per capita beer consumption)
Baseline Bus. Cycle Alc. Regulations Region Trends(1) (2) (3) (4)
Log(1+Excise Tax Rate) -0.88 -0.91 -0.89 -0.71(0.17) (0.17) (0.17) (0.18)
Log(1+Sales Tax Rate) -0.20 -0.01 -0.02 -0.05(0.30) (0.30) (0.30) (0.30)
Log(Population) 0.03 -0.07 -0.07 -0.09(0.06) (0.07) (0.07) (0.08)
Log(Income per Capita) 0.22 0.22 0.22(0.05) (0.05) (0.05)
Log(Unemployment Rate) -0.01 -0.01 -0.01(0.01) (0.01) (0.01)
Alcohol Regulation Controls x x
Year Fixed Effects x x x x
Region Fixed Effects x
F-Test for Equality of Tax Elasticities (Prob>F) 0.05 0.01 0.01 0.06
Sample Size 1,607 1,487 1,487 1,487
TABLE 6Effect of Excise and Sales Taxes on Beer Consumption
Notes: Standard errors, clustered by state, in parentheses. All specifications are estimated on full sample for which data are available (state unemployment rate data is unavailable in early years). Column 3 includes three indicators for whether the state implemented per se drunk driving standards, administrative license revocation laws, or zero tolerance youth drunk driving laws, and the change in the minimum drinking age (measured in years). Column 4 includes fixed effects for each of nine census regions. F-test tests null hypothesis that coefficients on excise and sales tax rate variables are equal.

Dependent Variable: Change in Log(per capita beer consumption) Dep Var:IV for Excise w/
Policy3-Year
DifferencesIV for ACCRA
Beer Price Food Exempt Share Ethanol from Beer
(1) (2) (3) (4) (5)
Log(1+Excise Tax Rate) -0.63 -1.10 -0.91 0.16(0.28) (0.47) (0.22) (0.13)
Log(Beer Price) -0.88(0.42)
Log(1+Sales Tax Rate) -0.03 -0.00 0.10 -0.14 0.25(0.30) (0.33) (0.59) (0.30) (0.22)
Log(Population) -0.06 -1.24 -0.06 0.03 0.09(0.07) (0.33) (0.15) (0.07) (0.05)
Log(Income per Capita) 0.22 0.08 0.23 0.22 0.01(0.05) (0.05) (0.10) (0.05) (0.03)
Log(Unemployment Rate) -0.01 -0.00 0.00 -0.01 0.00(0.01) (0.01) (0.01) (0.01) (0.01)
Alcohol Regulation Controls x x x x x
Year Fixed Effects x x x x x
F-Test for Equality of Tax Elasticities (Prob>F) 0.15 0.05 0.12 0.04 0.73
Sample Size 1,487 1,389 825 937 1,487
TABLE 7Effect of Excise and Sales Taxes on Beer Consumption: Robustness Checks
Notes: Standard errors, clustered by state, in parentheses. Column 1 replicates column 3 of Table 6, instrumenting for excise tax rate changes with the nominal excise tax rate divided by the average price of a case of beer from 1970 to 2003 to eliminate variation in the tax rate due to inflation erosion. In Column 2, all variables are defined using three-year differences instead of first-differences. Column 3 instruments for the the log change in the ACCRA survey price of beer using the log change in the gross-of-excise tax rate. Column 4 restricts the sample to states where all food was exempt from taxation in 2000. In column 5, the dependent variable is the fraction of total ethanol consumption in each state-year accounted for by beer. F-test tests null hypothesis that coefficients on excise and sales tax rate variables are equal.


Categories Group Description Category Description Mean Weekly Revenue
Treatment5101 Deodorant Aerosols 82.405103 Deodorant Body Sprays 55.225105 Deodorant Roll-ons 44.125110 Deodorant Clear Solids 323.385115 Deodorant Clear Soft 35.135120 Deodorant Clear 123.485125 Deodorant Visible Sticks 75.575245 Hair Care Accessories 189.475501 Cosmetics Facial 84.205505 Cosmetics Eye 195.005510 Cosmetics Nail 73.385515 Cosmetics Lipstick 48.395520 Cosmetics Accessories 19.37
Control5005 Oral Hygiene At Home Whitening 107.245010 Oral Hygiene Manual Toothbrush 340.575012 Oral Hygiene Power Toothbrush 120.895015 Oral Hygiene Oral Rinse/Mouthwash 314.755020 Oral Hygiene Denture Care 96.825025 Oral Hygiene Dental Floss Products 116.755030 Oral Hygiene Interdental Implements 26.765035 Oral Hygiene Oral Analgesics 115.455040 Oral Hygiene Portable Oral Care 52.845201 Hair Care Professional Daily Hair Care 310.755205 Hair Care Performance Daily Hair Care 983.315210 Hair Care Value Daily Hair Care 290.115215 Hair Care Dandruff Hair Care 116.375220 Hair Care Therapeutic Hair Care 20.545225 Hair Care Hair Growth 12.855230 Hair Care Kids Hair Care 46.755235 Hair Care Hair Color 430.185250 Hair Care African American Hair Care 59.915301 Skin Care Bar Soap 395.655305 Skin Care Liquid Hand Soap 138.955308 Skin Care Liquid Waterless Sanitizer 41.005310 Skin Care Body Wash 339.045312 Skin Care Bath Care 29.825314 Skin Care Image Bath Boutique 36.075315 Skin Care Acne Prevention 140.025318 Skin Care Acne Treatment 12.575320 Skin Care Basic Facial Care 427.175322 Skin Care Anti-aging/Treatments skin care 27.995325 Skin Care Hand & Body Skin Care 312.465330 Skin Care Lip Care 91.975335 Skin Care Cotton 169.725340 Skin Care Depilatories 33.61
APPENDIX TABLE 1Category Classification in Grocery Store Data

5345 Skin Care Adult Skin Care 172.575350 Skin Care Child/Baby Sun Care 26.065401 Shave Needs/Men's Personal Care Razors 161.135405 Shave Needs/Men's Personal Care Cartridges 389.025410 Shave Needs/Men's Personal Care Disposable Razors 195.955415 Shave Needs/Men's Personal Care Shave Preps 210.235420 Shave Needs/Men's Personal Care Men's Skin Care 14.985601 Vitamins and Dietary Supplements Multiple Vitamins 264.955605 Vitamins and Dietary Supplements Joint Relief 89.575610 Vitamins and Dietary Supplements Calcium 72.595615 Vitamins and Dietary Supplements Letters 120.325620 Vitamins and Dietary Supplements Specialty Supplements 65.915625 Vitamins and Dietary Supplements A/O Minerals 31.655630 Vitamins and Dietary Supplements Herbal Supplements 74.185701 Pain Relief Adult Aspirin 48.235703 Pain Relief Enteric/Antacid/Buffered Aspirin 14.905704 Pain Relief Low Strength Aspirin 62.195705 Pain Relief Adult Acetaminophen 203.245710 Pain Relief Ibuprofen Adult 252.895715 Pain Relief Naproxen Sodium 54.635716 Pain Relief Adult Compounds 86.755718 Pain Relief Specialty Indication Pain 88.925725 Pain Relief Children's/Infants Analgesics 187.255730 Pain Relief Sleeping Aids 64.995735 Pain Relief Stimulants 14.825750 Pain Relief Nighttime Pain Relief 76.195760 Pain Relief External Analgesic 144.085799 Pain Relief GM/HBC Trial Size 66.885801 Respiratory Pediatric Cold/Flu/Cough/Allergy/Sinus 229.735805 Respiratory Adult Cough, Cold, Flu 925.935835 Respiratory Adult Allergy/Sinus 500.745840 Respiratory Nasal Products 269.195845 Respiratory Bronchial Asthma 41.455850 Respiratory Cough Drops/Throat Relief 252.645855 Respiratory Thermometers/Covers 37.725901 Digestive Health Acid Neutralizers 243.375905 Digestive Health Acid Combination 17.215910 Digestive Health Acid Blockers 131.625915 Digestive Health Proton Pump Inhibitors (PPI) 92.825920 Digestive Health Multi Symptom Gastro Intestinal Relief 70.605925 Digestive Health Gas Relief 49.465930 Digestive Health Motion Sickness/Anti-Nausea 24.325935 Digestive Health Anti-diarrhea 82.705940 Digestive Health Laxatives 265.295945 Digestive Health Lactose Intolerance 22.145950 Digestive Health Rectal/Hemmorhoidal 58.795955 Digestive Health Pediatric Laxatives 31.576001 Eye/Ear Care Soft Contact Lens Care 155.166005 Eye/Ear Care Rigid Gas Permeable Contact Lens Care 18.556010 Eye/Ear Care General Eye Care 203.626040 Eye/Ear Care Reading Glasses 71.666042 Eye/Ear Care Sunglasses 43.876045 Eye/Ear Care Misc. Eye Glass Accessories 15.28

6050 Eye/Ear Care Ear Care/Ear Plugs 33.256101 Foot Care Insoles/Inserts 75.906105 Foot Care Corns/Callous/Padding/Bunion/Blister 28.886110 Foot Care Odor/Wetness Control 19.646115 Foot Care Anti-Fungal/Athlete's Foot 107.496120 Foot Care Jock Itch 20.226130 Foot Care Wart Removers 37.766190 Foot Care Grooming and Misc. Foot Care 12.70
Note: Weekly revenue statistics based on sales in calendar year 2005.

Treatment Store Control Store #1 Control Store #2
A. Store Characteristics
Mean Weekly Revenue ($) 307,297 268,193 375,114Total Floor Space (sq ft) 41,609 34,187 37,251Store Opening Year 1992 1992 1990
B. City Characteristics (in 1999)
Population 88,625 96,178 90,532Median Age (years) 33.9 31.1 32.3Median Household Income ($) 57,667 51,151 60,359Mean Household Size 2.8 2.9 3.1Percent bachelor's degree or higher 19.4 20.4 18.2Percent Married 60.2 56.9 58.1Percent White 72.1 56.2 65.3Distance to Treatment Store (miles) 7.7 27.4
APPENDIX TABLE 2Descriptive Statistics: Grocery Stores
Notes: Data on store characteristics obtained from grocery chain. Weekly revenue statistics based on sales in calendar year 2005. Data for city characteristics are obtained from the U.S. Census Bureau, Census 2000. Control stores were chosen using a least-squares minimum-distance criterion based on this set of variables.

APPENDIX EXHIBIT 1: CLASSROOM SURVEY
Short survey on spending patterns
Major: _____________
Year: _____________
Gender: _____________
Choose two items from the image projected on the screen.
Number of item #1: ___________
Number of item #2: ___________
Total bill due at the register for these two items:
$_________

APPENDIX EXHIBIT 2: TAX SURVEYUniversity of California, Berkeley
Department of Economics
This survey is part of a project about taxes being conducted by researchers at UC Berkeley. Your identity will be kept strictlyconfidential and will not be used in the research. If you have any questions about your rights or treatment as a participant in this research project, please contact UC-Berkeley’s Committee for Protection of Human Subjects at (510) 642-7461, or e-mail: [email protected].
Gender:
Male
Female
Age: Marital Status:
Married
Unmarried
Education: High School
College Degree
Graduate Degree
Years You Have Lived in California:
Is tax added at the register (in addition to the price posted on the shelf) for each of the following items?
milk Y N toothpaste Y N
magazines Y N soda Y N
beer Y N cookies Y N
potatoes Y N cigarettes Y N
Have you purchased these items within the last month?
milk Y N toothpaste Y N
magazines Y N soda Y N
beer Y N cookies Y N
potatoes Y N cigarettes Y N
What is the sales tax rate in [city]? ___________%
What is the California state income tax rate in the highest tax bracket? _____________ %
What percentage of families in the US do you think pay the federal estate tax when someone dies?
< 2% 2-10% 10-25% 25-50% > 50%
Thank you for your time!