Embed Size (px)
Citation preview

International Journal of Forecasting 16 (2000) 369–382www.elsevier.com/ locate / ijforecast
Sales forecasting updates: how good are they in practice?
*Michael Lawrence , Marcus O’ConnorSchool of Information Systems, University of New South Wales, Sydney 2052, Australia
Abstract
Both theory and the opinions of practising forecasters expect that, as the lead time before an event reduces, updates to theforecast will efficiently incorporate more recent information and so be more accurate and less biased. However, in practice, itmay be anticipated that there will be some inefficiency due to excessive anchoring on the last forecast, leading to positivecorrelations in forecast revisions. This study tests these expectations using a large sample drawn from judgementallyestimated sales forecasts from 10 manufacturing organisations. The results suggest that forecast accuracy does not improveas much as anticipated as the lead time reduces, and that the forecast revisions display negative not positive first-orderautocorrelations. The inefficiency of the fixed-event forecast revisions does not appear to be related to the rolling-eventforecast accuracy. This is in distinction to the one period ahead forecast errors where efficiency was strongly related toforecast accuracy performance. Some reasons for the findings are discussed. 2000 International Institute of Forecasters. Published by Elsevier Science B.V. All rights reserved.
Keywords: Forecast updates; Fixed-event forecasts; Sales forecasting accuracy
1. Introduction O’Connor, 1992; Makridakis et al., 1993; Good-win & Fildes, 1999). In contrast, few studies
Many studies have compared the performance have examined the updating of forecasts for aof alternative approaches to time series forecast- fixed time period in the future as the lead timeing. Generally, these studies have examined reduces. Forecasts of this nature are calledrolling-event forecasts: that is, forecasts for a fixed-event forecasts. Nordhaus (1987) has dis-fixed lead time with the sample constructed cussed and analysed fixed-event forecastfrom either sequential events within the one rationality for forecasts developed by major UStime series or events pooled across a number of consultancies, and Clements (1997) examined atime series (e.g., Fildes, 1992; Lawrence & number of theoretical issues concerning the
pooling of fixed-event forecasts and presentedresults for the rationality of UK economic
*Corresponding author. Tel.: 161-2-9385-4417; fax:forecasts of growth and inflation. McNees161-2-9662-4061.(1990) and Zarnowitz (1992) have analysed USE-mail address: [email protected] (M. Law-
rence). macroeconomic forecasts. O’Connor, Remus
0169-2070/00/$ – see front matter 2000 International Institute of Forecasters. Published by Elsevier Science B.V. All rights reserved.PI I : S0169-2070( 00 )00059-5

370 M. Lawrence, M. O’Connor / International Journal of Forecasting 16 (2000) 369 –382
and Griggs (1999) have studied forecast updates issue of the incorporation of new informationby means of a laboratory study where the into the forecast revision by collecting a sampleinformation set is limited to the time series of judgementally estimated sales forecasts anditself. We know of no study which has ex- analysing their fixed-event forecast perform-amined, in a real-life field setting, fixed-event ance.forecasts of sales time series which is the focus The plan we adopt for this paper is asof this paper. follows. Section 2 reviews published results
We are interested in three measures of fore- relevant to the performance of fixed-event fore-casting performance: accuracy, bias and ef- casts which Section 3 draws on to propose theficiency. Both theory and opinions of practising research hypotheses. Section 4 presents theforecasters expect that, as the lead time before details on the study setting and data collected.an event reduces, updates to the forecast will, In Section 5 the analysis methodology is out-because they incorporate more recent informa- lined and the results given in Section 6. Discus-tion, result in a forecast of greater accuracy. It sion of the results is contained in Section 7 andalso seems reasonable to expect that forecast a concluding summary given in Section 8.
1bias will reduce as lead time shortens. Ef-ficiency is the requirement that forecasts in-corporate new information as it becomes avail-
2. Backgroundable. Thus, taken together, these three measuresof forecasting performance relate to how well In this section we examine the findings whichnew information is incorporated into the fore- have been published relevant to the measures ofcast as the lead time reduces and evaluate the accuracy, bias and efficiency of fixed-eventbenefit of this new information. forecasts.
Most sales forecasts are estimated judgemen-tally (Sanders & Manrodt, 1994) in an environ-ment where much new information becomes 2.1. Accuracyavailable just before the event time. For exam-ple, shortages of raw material, a strike or a Theoretically, how accuracy changes as aproduction breakdown would only be known function of lead time depends very much on theshortly before the event time. The promotion time series. If we assume an MA(1) process, thebudget exercises a considerable impact on the standard deviation of the forecast error is con-sales of many manufactured goods and this stant for lead times greater than two periodsimpact is often only able to be assessed as the (Pankratz, 1983). However for an ARMA(1,1)details of the promotion campaign are firmed process, the standard deviation may increaseup. Competitor response is also often only able quite steeply as the lead time increases. Indeed,to be guessed at very short lead times. In such a if f 5 0.9 and u 5 2 0.5, a forecast at a six
2setting it is vital that new information be period lead time has a relative standard devia-incorporated efficiently as the costs of a poor tion of forecast error of 2.7. Table 1 shows aforecast can be high in either lost sales or sample of these theoretical results for lead timesexcessive inventory. This paper examines the of 1, 2, 3, 4, 6 and 12 periods and demonstrates
1 2Bias is a systematic tendency for the forecast to be less Forecast errors are presented as relative to the one periodthan or greater than the actual. ahead forecast error.

M. Lawrence, M. O’Connor / International Journal of Forecasting 16 (2000) 369 –382 371
Table 1Theoretical and empirical accuracy as a function of lead time
Time series Accuracy relative to one step aheadNumber of periods ahead
1 2 3 4 6 12aTheory
MA(1) (u 5 0.5) 1 1.1 1.1 1.1 1.1 1.1ARMA(1,1) 1 1.7 2.1 2.4 2.7 3.2(f 5 0.9, u 5 2 0.5)
AR(1) (f 50.9) 1 1.3 1.6 1.7 1.9 2.2bM1 Competition monthly series
Avg stat methods 1 1.2 1.3 1.2 1.5 1.6DSE 1 1.4 1.7 1.9 2.2 1.7Judgement 1 1.2 1.4 1.5 1.7 2.0
aM2 Competition monthly seriesDampen 1 1.7 2.1 3.1 3.1 3.5Judgement 1 1.3 1.3 2.0 2.1 2.6
bMelliss & Whittaker (quarterly results averaged over a 25 year time span)UK GDP 1 1.4 1.7 2.1Retail Price Index 1 2.3 4.0 5.7
a Relative standard deviation of forecast error.b Relative mean absolute percentage forecast error.
the importance of the underlying process in that the 6 month lead time relative error isinfluencing the result. If such issues as possible between 1.5 and 3.1. Obviously, in such data wemodel mis-specification, uncertainty in parame- are not examining fixed-event forecasts and theter estimation and instability in the series are incorporation of new information. In addition,also included, the impact of lead time is likely no contextual information is present: all resultsto be much greater. are for simple extrapolation of time series. But
The M1 Competition (Makridakis et al., these results do give some indication of the1982; Lawrence, Edmundson & O’Connor, increase in difficulty as one extends the lead1985) and the M2 Competition (Makridakis, time further ahead.1993) compared forecasts from a stable of We also show in Table 1 the results reportedtechniques for a large sample of real life time by Melliss and Whittaker (1998) for macro-series. For monthly series, forecasts for lead economic quarterly forecasts by the UK Treas-times up to 18 months were estimated from a ury of GDP and Retail Price Index (RPI). Thesefixed point in time. Although adopting rolling- show a strong effect of lead time on accuracy.event forecast evaluation, the results can be The relative MAPE accuracy of the four quarterexamined to see how the accuracy varies as a ahead forecast of GDP is 2.1 while for the RPIfunction of lead time. Table 1 shows the it is 5.7. Overall, we see from Table 1 that thecompetition results for monthly time series for empirical relative accuracies as a function ofsome quantitative and judgemental methods. lead time are, apart from the RPI, generallyThe forecast accuracies reported are in mean bracketed by the theoretical ARMA relativeabsolute percentage error (MAPE). One sees accuracies.

372 M. Lawrence, M. O’Connor / International Journal of Forecasting 16 (2000) 369 –382
2.2. Bias for example, Mendenhall, 1991; Abarbanell &Bernard, 1992; Ali, Klein & Rosenfield, 1992;
While bias is a relatively insignificant com- Ackert & Hunter, 1995). Around half the or-ponent of judgemental extrapolations carried out ganisations studied by Lawrence et al. (1999)under laboratory conditions (Lawrence et al., exhibited inefficiency in their sales forecasts.1985), it is frequently a component in There is much less evidence for the efficiencyjudgemental forecasts estimated under real life of fixed-event forecasts. Nordhaus (1987) an-conditions. Lawrence, O’Connor and Edmun- ticipated positive correlations and found evi-dson (1999), in examining one period ahead dence for them in forecast revisions of nuclearsales forecasts of 13 large Australian manufac- capacity, energy consumption and GNP growthturing organisations, found that seven signifi- from four major US forecasting services. Cle-cantly overforecasted, five had no significant ments (1995, 1997) tested a small sample ofbias and one had a significant underforecasting fixed-event UK macro-economic quarterly fore-bias (i.e. forecast less than actual). These differ- casts and found, on the other hand, no evidenceences between laboratory and field probably of positive correlation, but some evidence ofreflect differing incentive structures in these two negative correlation in forecast revisions.settings. Abarbanell and Bernard (1992) ob-served significant biases in security analysts’forecasts. However, for macro-economic fore- 3. Development of research hypothesescasts, bias does not appear to be a generalphenomenon (Melliss & Whittaker, 1998), al- We are interested in this paper in the per-though Egginton (1999) found bias in ‘city formance of real life, judgementally estimated,forecasts’ of UK economic data. Ehrbeck and sales forecasts which can be expected to differWaldmann (1996) analysed a sample of econ- from the results in laboratory studies of salesomic forecasts to determine if an agency expla- time series, operational forecasts of macro-econ-nation could be responsible for persistent biases, omic time series, or studies of security analysts’but found little evidence to support this argu- forecasts.ment. Findings of bias in judgemental forecast- In framing our research hypotheses we wereing are consistent with more general psycholog- informed by our observations in the companiesical research on human judgement (Tversky & that we studied. In a number of companies, weKahneman, 1974). There is no known evidence were present during their monthly forecastingas to how bias in fixed-event forecasts is meetings where sales, marketing and productioninfluenced by lead time, although we later posit personnel worked through their product line toa behavioural model applicable to sales fore- both provide initial forecasts and to revise theircasting developed from our contact with organi- previous forecasts. These meetings seemed tosations using judgemental methods to estimate serve two main purposes. First, they were usedtheir forecasts (Lawrence et al., 1999). to allow the latest information about the product
environment to be incorporated into the latestforecasts. Information as to the reactions and2.3. Efficiencystrategies of competitors and any problems of
Rolling-event forecasts with a judgemental the production processes were commonly dis-component appear to be frequently inefficient. cussed (O’Connor & Lawrence, 1998). Second,Security analysts’ forecasts have been exten- the meetings served as a vehicle for communi-sively studied and shown to be inefficient (see, cation device between sales, marketing, pro-

M. Lawrence, M. O’Connor / International Journal of Forecasting 16 (2000) 369 –382 373
duction and finance personnel. In many cases, forecast. This is because the company forecast¨these meetings were used as ways of informing is informed by both past actuals (e.g., the naıve
others of potential problems that may be rel- forecast) and future focussed contextual infor-evant to the sales forecasting process. mation. Specifically, we hypothesise:
On the basis of these observations, we sug-H1: Accuracy will increase substantially as lead-
gest real life judgemental sales forecasts aretime reduces down to one period.characterised by the following set of unique
factors (O’Connor & Lawrence, 1998):H1a: Accuracy will increase faster as lead time -
• Company personnel can exercise a degree of ¨reduces than for the naıve forecast.control over the eventual outcome by suchstrategies as shifting sales forwards or back- 3.2. Biaswards and manipulating pricing or promo-
Typically, the first or earliest forecasts are ational activity.set of budget estimates developed by sales and• Considerable contextual knowledge is pres-marketing personnel with very little input froment, but much is only firmed up at short leadproduction. These estimates are examined andtimes.revised on a monthly basis in a company• As most judgemental sales forecasts are setforecasting meeting at which sales, marketingby a meeting comprising sales, marketingand production personnel are present and typi-and production personnel, significant behav-cally play roles reflecting their specific respon-ioural elements will impact the forecast.sibilities. Sales and marketing generally have a• Forecasts act as budgets and communicatestrong interest in having sufficient stock to sell,information throughout an organisation. Inare not charged with the cost of excess inven-an attempt to manage the uncertainties asso-tory and tend to be optimistic about the likelyciated with this process, it has been sug-impact of their planned promotional or salesgested that accountants smooth changes tocampaigns. On the other hand, production isminimise disruptions (Birnberg, Turopolec,generally charged with the cost of keepingYoung & Buckley, 1983)inventory and frequently is less optimistic about
These factors, together with the literature the impact of marketing plans. So we mightsurveyed, motivate the establishment of our anticipate that: (a) longer lead time forecastsresearch hypotheses as outlined below. will be close to the budgets and so be weighted
in favour of the interests of sales and marketing,and (b) the short-term forecasts are likely also3.1. Accuracyto reflect the contribution of production and sobe less optimistic. Thus we hypothesise:The above characteristics lead us to anticipate
a strong improvement in the forecast accuracy H2: Forecast bias will be less at short lead times-over lead time. While each time series and than at longer lead times.setting is different, we expect, on average, thatthe improvement will be greater than we saw 3.3. Efficiencywith the M1 and M2 Competition results inTable 1. We would also anticipate that the One of the most widely observed heuristics inrelative forecast accuracy would increase, as a human judgement is the anchor and adjustment
¨function of lead time, faster than for the naıve heuristic (Tversky & Kahneman, 1974). In this

374 M. Lawrence, M. O’Connor / International Journal of Forecasting 16 (2000) 369 –382
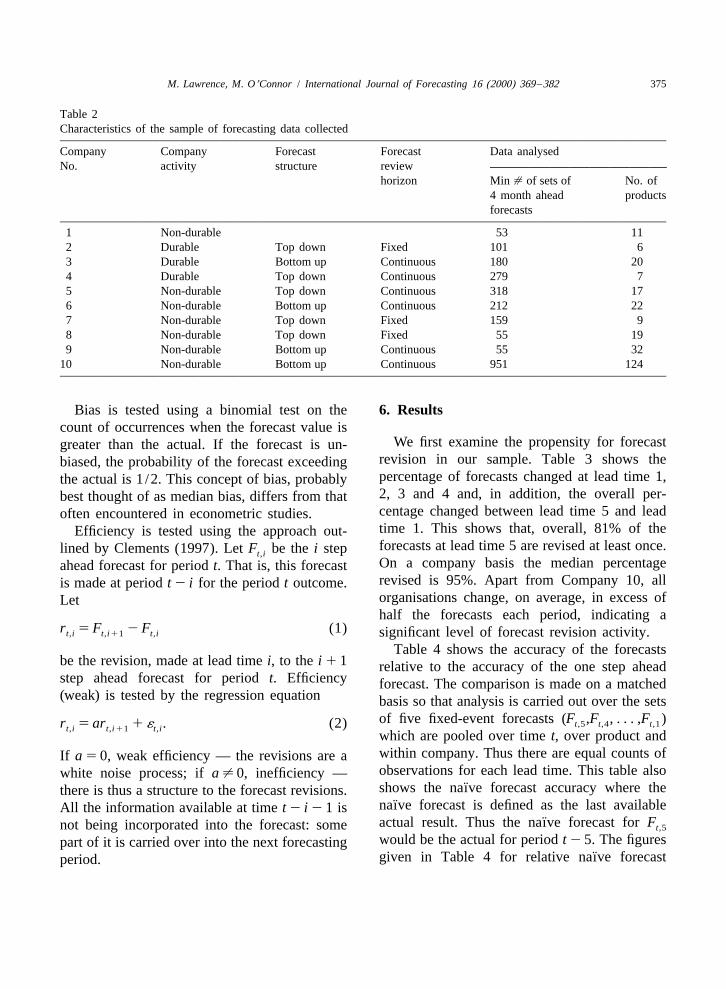
heuristic, judges seeking to develop an estimate consideration for most of the organisations sotend to identify an anchor point and then to the participating companies are identified onlyform their judgement by adjusting from this by number. Monthly actual sales for a selectedpoint. A dominant finding is that the adjustment range of products (identified by the company asis too small leaving the estimate too close to the important products for achieving good forecast-anchor point. This has also been shown to be a ing accuracy) covering generally a 12 monthgood model to explain how judgemental fore- period were obtained from the participatingcasts are estimated (Lawrence & O’Connor, companies. In total there were around 10001992, 1995). When a forecast is to be revised, actual sales values and 7000 forecasts in thewe can expect anchoring to take place on this data base, but missing values for forecasts atforecast and for the adjustment away from this some lead times meant that the actual numberanchor point to be too little. This will lead to a used was less. The characteristics of the 10series of changes in successive periods as the organisations participating in the study arefull extent of the desired change is gradually given in Table 2 along with a summary of thetaken up. New information is not immediately data collected. This shows the essential structurereflected in the forecast but only over a period of the forecasting process and the nature of theof time due to excessive anchoring at each product line. The structure has been classifiedrevision time. This mode of judgement will lead by whether the forecasting process is basicallyto positively correlated revisions and to inef- top down or bottom up and whether the reviewficiency. Another argument for this model is the horizon is fixed for the current calendar yearsuggestion that accountants smooth changes to (shown in the table as Fixed) or is constantly 12budgets to minimise disruption in an organisa- months ahead (shown as Continuous). Thetion in the face of uncertainty (Birnberg et al., product line is classified as durable or non-1983) This leads us to hypothesise: durable. The data in this table were obtained
from the interviews. The extent of the dataH3: Forecast revisions will be inefficient and po- collected from each organisation is also summa-
rised in Table 2. This shows the minimumsitively correlated.number of sets of at least four period aheadfixed-event forecasts and the number of separateproducts or product groups for which data was4. The studysupplied.
The sample group of companies from whichsales forecasts were collected comprised 10
5. Analysis methodologylarge Australian national and internationalmanufacturing based organisations selling
The symmetric mean absolute percentagebranded consumer, frequently purchased goodserror (SMAPE) is used as the accuracy metricand infrequently purchased durable items. Thesefor the reasons given in Lawrence et al. (1999).firms are a subset of those reported on byThe SMAPE is defined as the average ofLawrence et al. (1999) in which one step ahead
rolling-event forecasts were studied. Repre- 2u(actual 2 forecast)u /(actual 1 forecast).sentatives of sales forecasting management ineach company were interviewed in person and This metric, which is very similar to the MAPE,the objectives of the study explained. Data was proposed by Makridakis (1993) in order tosecurity and confidentiality were an important reduce the asymmetry of the MAPE metric.
M. Lawrence, M. O’Connor / International Journal of Forecasting 16 (2000) 369 –382 375
Table 2Characteristics of the sample of forecasting data collected
Company Company Forecast Forecast Data analysedNo. activity structure review
horizon Min [ of sets of No. of4 month ahead productsforecasts
1 Non-durable 53 112 Durable Top down Fixed 101 63 Durable Bottom up Continuous 180 204 Durable Top down Continuous 279 75 Non-durable Top down Continuous 318 176 Non-durable Bottom up Continuous 212 227 Non-durable Top down Fixed 159 98 Non-durable Top down Fixed 55 199 Non-durable Bottom up Continuous 55 32
10 Non-durable Bottom up Continuous 951 124
Bias is tested using a binomial test on the 6. Resultscount of occurrences when the forecast value is
We first examine the propensity for forecastgreater than the actual. If the forecast is un-revision in our sample. Table 3 shows thebiased, the probability of the forecast exceedingpercentage of forecasts changed at lead time 1,the actual is 1 /2. This concept of bias, probably2, 3 and 4 and, in addition, the overall per-best thought of as median bias, differs from thatcentage changed between lead time 5 and leadoften encountered in econometric studies.time 1. This shows that, overall, 81% of theEfficiency is tested using the approach out-forecasts at lead time 5 are revised at least once.lined by Clements (1997). Let F be the i stept,iOn a company basis the median percentageahead forecast for period t. That is, this forecastrevised is 95%. Apart from Company 10, allis made at period t 2 i for the period t outcome.organisations change, on average, in excess ofLethalf the forecasts each period, indicating a
r 5 F 2 F (1)t,i t,i11 t,i significant level of forecast revision activity.Table 4 shows the accuracy of the forecasts
be the revision, made at lead time i, to the i 1 1 relative to the accuracy of the one step aheadstep ahead forecast for period t. Efficiency forecast. The comparison is made on a matched(weak) is tested by the regression equation basis so that analysis is carried out over the sets
of five fixed-event forecasts (F ,F , . . . ,F )t,5 t,4 t,1r 5 ar 1 ´ . (2)t,i t,i11 t,iwhich are pooled over time t, over product andwithin company. Thus there are equal counts ofIf a 5 0, weak efficiency — the revisions are aobservations for each lead time. This table alsowhite noise process; if a ± 0, inefficiency —
¨shows the naıve forecast accuracy where thethere is thus a structure to the forecast revisions.¨naıve forecast is defined as the last availableAll the information available at time t 2 i 2 1 is
¨actual result. Thus the naıve forecast for Fnot being incorporated into the forecast: some t,5
would be the actual for period t 2 5. The figurespart of it is carried over into the next forecasting¨given in Table 4 for relative naıve forecastperiod.

376 M. Lawrence, M. O’Connor / International Journal of Forecasting 16 (2000) 369 –382
Table 3Propensity to update forecasts — average percentage changed
Company Percentage of forecasts changedNo. from lead time i to lead time j
2→1 3→2 4→3 5→4 5→1
1 56 62 64 59 952 77 76 75 69 953 72 70 58 53 934 87 70 64 60 995 72 80 84 86 966 75 83 10 10 937 37 43 53 76 968 98 93 95 100 1009 44 50 65 76 84
10 15 18 21 22 61Avg. 49 50 45 45 81
Table 4 basis, only Company 1 showed a better relativeRelative accuracy as a function of lead time ¨accuracy gain than the naıve. For Company 8,Company Relative SMAPE (to one period ahead) the forecasts decline in accuracy as the leadNo. Period ¨time reduces, while for the naıve they improve
in accuracy! However, for Company 8, the2 3 4 5¨naıve (in absolute terms) is significantly less
1 1.16 1.29 1.48 1.88accurate than the company forecast.2 1.15 1.24 1.38 1.45
We repeat in Table 4 the M1 and M2 results3 1.07 1.09 1.15 1.174 1.17 1.22 1.25 1.24 from Table 1 because we indicated that we5 1.02 0.99 1.05 1.09 anticipated that the forecast accuracy of the6 1.05 1.02 1.02 1.02 judgemental sales forecasts would improve7 1.05 1.02 1.22 1.15 more rapidly as lead time reduced than in the8 0.55 0.59 0.58 0.73
two M Competition results. One can see that9 1.00 0.89 1.38 1.24this is clearly not the case apart from perhaps10 1.07 1.12 1.15 1.21Company 1. It is surprising how similar theTotal 1.07 1.09 1.14 1.18patterns are, company to company, with few
¨Naıve 1.01 1.22 1.29 1.40 ¨achieving the improvement shown by the naıveM1 Comp 1.2 1.4 1.5 1.6 forecast. It would appear that the substantialM2 Comp 1.3 1.3 2.0 2.0 short-term contextual information that we ob-
served was available to the forecasters is notaccuracy are averaged for all companies and so playing the anticipated role in improving fore-are comparable with the Total (all companies) cast accuracy. Neither is the organisation’sline immediately above. This shows that, over- ability to exert control over the forecastingall, the relative accuracy gain, as a function of outcome. We conclude that hypothesis H1 is notlead time, is less for the company forecasts than supported.
¨for the naıve forecast, thus not supporting In Table 5 we show the bias in the form ofhypothesis H1a. On an individual company the percentage of cases where the forecast is

M. Lawrence, M. O’Connor / International Journal of Forecasting 16 (2000) 369 –382 377
Table 5 the forecast revisions at period 1, 2 and 3. ForBias in forecast by lead time (the percentage of observa- each period the table shows the value of thetions for which forecast$actual) coefficient a in the regression of the form (2)
2Company Lead time and the value of the R statistic. Only results forNo. which the t-statistic significance of the a coeffi-
1 2 3 4 5 cient is better than 0.03 are reported. We see1 62 67* 76* 73* 76* from the table that all the companies, except2 66* 55 54 58 58 Company 10, exhibit inefficiency at either3 68* 61* 51 54 51 period 1, 2 or 3 with greater evidence of4 73* 77* 76* 76* 78*
inefficiency as the horizon decreases. We antici-5 62* 62* 63 66* 65*pated that the forecast revisions would be6 56 49 48 47 47
7 43 46 45 47 45 positively correlated. However, the results in8 94* 44 83* 83* 89* Table 6 show the correlations to be mostly9 68 68 60 56 64 negative apart from Company 1. Three of the
10 53 54 54 53 55companies have coefficients around 20.5 and
2Total 59* 58* 58* 58* 59* one (Company 8) is in excess of 21 with an R*Significance ,0.01 in binomial test (±0.5). value over 0.5, suggesting a very high level of
inefficiency. Thus we conclude that hypothesisgreater than the actual and indicate by an H3 is not supported.asterisk where the result is statistically signifi- Four companies exhibited significant inef-cant. We see that, contrary to our hypothesis, ficiency in their (rolling-event) one period aheadthere is no general reduction of bias as the lead forecasts (Lawrence et al., 1999) and these aretime reduces. It appears that bias is very con- indicated in the last column of Table 6. We notestant over lead time. We thus conclude that that there does not appear much difference inhypothesis H2 is not supported. the fixed-event results of these companies com-
Table 6 shows the analysis of efficiency of pared to the others. Furthermore, the Lawrence
Table 6aEfficiency results for regressions r 5 ar 1 ´t,i t,i11 t,i
Company i 5 1 i 5 2 i 5 3 InefficientNo. rolling
2 2 2a R a R a R forecast
1 0.30** 0.1312 20.25* 0.04 20.34** 0.343 20.51** 0.134 20.38** 0.20 Yes5 20.46** 0.12 Yes6 20.41** 0.28 Yes7 20.20* 0.03 20.28** 0.08 20.28** 0.058 21.17** 0.569 20.10** 0.02 20.77** 0.76 Yes
10a Results only reported if coefficient a has significance of ,0.03.*Significance ,0.01.**Significance ,0.001.

378 M. Lawrence, M. O’Connor / International Journal of Forecasting 16 (2000) 369 –382
et al. (1999) study suggested a relationship The same situation can arise even if news isbetween rolling-event forecast accuracy and available but the revisions are made by anchor-efficiency. They showed that the companies ing on the original forecast and only the most(Companies 2, 3, 7 and 8) which performed recent news is incorporated into the forecast.significantly better in one period ahead (rolling- Thus if n is the news component at periodt,i
event) forecast accuracy (in comparison with t 2 i impacting the forecast for period t, and Ft,i
¨the naıve forecast) were the only ones which is the original budget forecast for period t, thendid not exhibit inefficiency. In the fixed-event F 5 F 1 n 1 ´ (4)t,i t,i t,i t,iforecast results in this paper there does notappear to be a relationship between relative andaccuracy and efficiency, perhaps because all r 5 (n 2 n ) 1 (´ 2 ´ ). (5)t,i t,i11 t,i t,i11 t,icompanies exhibited varying levels of inef-
If n is either a white noise series or is aficiency. The lack of superior fixed-event fore- t,i
relatively small component in the revision, thecast performance by these companies which didtheoretical autocorrelation coefficient of r iswell in rolling-event forecasting indicates a t,i
again 21/2. We call this fixed revision becausedifference between rolling-event and fixed-eventthe anchor point is fixed on the same value forforecasting. It would appear that an organisationeach revision. This can be contrasted with ourmay perform well in one arena but poorly in theassumption of incremental revision whereother. This suggests that rolling-event inef-
ficiency and fixed-event inefficiency appear toF 5 F 1 n 1 ´ (6)t,i t,i11 t,i t,ibe unrelated phenomena in the judgemental
forecasting process, although they come out of and hencethe one judgemental event. r 5 n 1 ´ (7)t,i t,i t,i
which results in r being a white noise series ift,i
7. Discussion n and ´ have the characteristics of white noise.It would appear, from the relatively small
Clements (1997) argued that a possible increase in accuracy over the lead times re-reason for his finding of a negative correlation ported, that the news component makes afor forecast revisions was perhaps the relative relatively minor contribution in forecast revisionabsence of news for incorporation in the fore- and most of the revision is a random errorcast revision. This might lead to anchoring on component. As two of the companies have theirthe original forecast and adjusting with a white regression coefficient values close to 21/2, itnoise component as the revision. Thus if F ist,i would seem that they conform to the fixedthe original forecast for period t and ´ is at,i revision model outlined above. The others most-white noise component introduced at time t 2 i, ly have smaller negative coefficients, suggestingthen some contribution of the fixed model but with
additional factors also influencing the revisionF 5 F 1 ´ . (3)t,i t,i t,iprocess. A coefficient of 21 (Company 8)suggests a see-sawing approach to revisionUnder these circumstances, Clements points outwhere the changes made one period are reversedthat the revisions become differenced whitethe next. (This company had the worst resultsnoise for which the theoretical first-order auto-for relative forecast accuracy in Table 4.)correlation coefficient, or the value of the
Another possible explanation of the forecastcoefficient in (2), is 21/2.

M. Lawrence, M. O’Connor / International Journal of Forecasting 16 (2000) 369 –382 379
Table 7revisions’ negative correlation and their minorRegression of one period ahead forecast error against lastcontribution to improving accuracy is that theforecast revision: error 5 a 1 brt t,iforecast revisions are, in fact, not too small as
2Company a b Rhypothesised but are excessive. The tendency toNo.over-react has been observed in studies of
judgemental forecasting by Andreassen (1990), 2 254.4* 0.26** 0.0913 275.3 0.36** 0.072Lim and O’Connor (1995), and O’Connor,5 2114.9* 0.54** 0.061Remus and Griggs (1993). These studies dem-7 2228.124 0.42** 0.107onstrate, in a variety of contexts, that it is a 8 1.39 0.66** 0.38
natural tendency for people to over-react to the 9 2268.7** 0.19** 0.020latest news (Andreassen, 1990) or the latest
*Significance ,0.01.actual value of the time series (O’Connor et al., **Significance ,0.001.1993). It may be that people have little conceptof noise and its influence on a criterion.
To investigate this possibility we evaluated thus reducing the forecast error, but is toothe regression small.
Table 7 shows the results of running theerror 5 a 1 br 1 ´ (8)t t,1 t
regressions for each company. We only showresults for a company for which the significancewhere error is the one step ahead forecast errortof the b coefficient is less than 0.01. The results(actual minus forecast) for period t. We couldshow four companies have a significant positivehave also included in the regression the twob coefficient with a value less than 1/2. How-period ahead forecast revision. But due to theever, two companies (Companies 5 and 8) havesignificant correlation already found betweena coefficient value greater than 1/2, indicatingthis and the one period ahead revision, we 3the revision has worsened the forecast . Fordecided not to include it to eliminate the multi-Company 8, where the regression coefficient iscollinearity problem. If the forecast revision is0.66, the relative accuracy for the two periodmade efficiently and without bias, the coeffi-forecast is 0.55! Thus we conclude that, for fourcients a and b are both zero. Noting that the onecompanies, the revisions are excessive, over-step ahead forecast error is 2 b /(1 2 b) timesshooting the actual but resulting in a smallerthe two step ahead error, we distinguish threeerror. None of the companies had a negative bcases if b is not zero.coefficient, indicating too timid forecast revi-sions or excessive anchoring on the previous1. If 0 , b , 1/2, the revision improves theforecast. This finding of over-reaction is con-forecast, but is excessive. That is, it hassistent with the findings of Andreassen (1990),overshot in that it has revised the lead timeLim and O’Connor (1995), and O’Connor et al.two forecast from one side of the actual to(1993), where excessive over-reactions werethe other thus reversing the sign of the error.also discovered, albeit in primarily laboratory2. If b $ 1/2, the revision leads to a worsesettings. The finding in our study supportingforecast. This may be because it overshoots
by too much the actual (reversing the sign oferror) or because the revision is made in the
3wrong direction (same sign of error). However, for neither company is the hypothesis H :0
3. If b , 0, the revision is in the right direction, b $ 1/2 supported at the 0.05 level.

380 M. Lawrence, M. O’Connor / International Journal of Forecasting 16 (2000) 369 –382
these results adds credence to the ubiquity of actual). However, we did not find this to be thethis phenomenon in real life. case, suggesting, rather surprisingly, that the
contextual information appears to play only asmall role. When we investigated further, itappeared that, for nearly half the companies, a8. Summaryreason for the lack of improvement was exces-
In this study we have analysed the perform- sive revision of the forecasts causing overshoot-ance of fixed-event judgementally estimated ing of the actual and reversing the sign of thesales forecasts developed by 10 manufacturing error. This is likely to be from an over-reactionorganisations. Specifically, we have examined to news suggesting that the contextual infor-the accuracy, bias and efficiency of the forecasts mation has played a role, indeed too large aas a function of lead time. Our overarching role. None of the companies displayed evidenceassumption, made on the basis of our observa- of a tendency to too timid or excessivelytions of sales forecasting practice, was that, in anchored forecast revisions.sales forecasting, a great deal of highly relevant No relationship was evident between theinformation is received in the last few periods companies performing well in one period aheadbefore the event being forecasted. We assumed forecasting (Lawrence et al., 1999) and thosethat the forecast revision process would in- performing better in this fixed-event forecastcorporate this information, so improving fore- performance evaluation. It would appear thatcast accuracy and reducing bias, although this efficiently incorporating new information intowould be associated with some inefficiency due forecast revisions is a different process fromto the anchor and adjustment heuristic which being efficient in rolling-event forecasting, al-would give rise to positive correlations in the though the two would appear to be related byforecast revisions. We found that the hypotheses the underlying human processes of estimatingwe constructed for these facets of performance and revising the forecasts. More research on thiswere not supported by the data. phenomenon is needed to tease out these dis-
A significant amount of forecast revision tinctions.activity did take place, with around half the The number of organisations present in theforecasts revised each period. However, there sample and the number of forecasts collectedwas little evidence of much value from this from each suggests a level of generality to theprocess of forecast revision with accuracy im- findings. In addition, Clements (1997) foundproving only marginally in the interval between negative correlation values ranging from 20.17a lead time of five periods and a lead time of to 20.48 for GDP and CPI forecast data. Butone period. Improvements in accuracy were the lack of clear benefit from the contextual dataless, in general, than in the pure extrapolations is a source of concern. Our results suggest that,of the M1 and M2 forecasting competitions in about half the companies, this is due towhere competitors forecasted a large number of over-reaction. What about the other companies?time series from a given start point. Because the We suggest that more research should be under-information playing a role in the forecast revi- taken to study these issues. Having been presentsion activity is both the latest actuals and during a number of company forecasting meet-contextual information (e.g., marketing plans), ings (O’Connor & Lawrence, 1998) and seenthe improvement in company forecast accuracy the intense activity invested in understanding
¨could be expected to exceed that of a naıve the market-place and estimating the likely im-forecast (which is only informed by the latest pact of various factors on sales, it is hard to

M. Lawrence, M. O’Connor / International Journal of Forecasting 16 (2000) 369 –382 381
ing methods with discussion. International Journal ofunderstand that such a concentration of minds isForecasting 8, 81–111.having so little impact on accuracy, bias or
Goodwin, P., & Fildes, R. (1999). Judgemental forecasts ofefficiency.time series affected by special events: does providing astatistical forecast improve accuracy? Journal of Be-havioural Decision Making 12, 37–53.
Acknowledgements Lawrence, M., & O’Connor, M. (1992). Exploringjudgemental forecasting. International Journal of Fore-casting 8, 15–26.This paper was written while the lead author
Lawrence, M., & O’Connor, M. (1995). The anchoring andwas visiting at the Management School, Lancas-adjustment heuristic in time series forecasting. Journalter University, and he wishes to acknowledgeof Forecasting 14, 443–451.their support. He also wishes to acknowledge
Lawrence, M., Edmundson, R., & O’Connor, M. (1985).the role of Bob Edmundson of the School of An examination of the accuracy of judgemental extrapo-Information Systems, University of New South lation of time series. International Journal of Forecast-Wales, who helped to collect the data. ing 1, 25–35.
Lawrence, M., O’Connor, M., & Edmundson, B. (1999). Afield study of sales forecasting accuracy and processes.European Journal of Operations Research (in press).References
Lim, J. S., & O’Connor, M. (1995). Judgemental adjust-ment of initial forecasts: its effectiveness and biases.
Abarbanell, J. S., & Bernard, V. L. (1992). Tests ofJournal of Behavioral Decision Making 8, 149–168.
analysts’ overreaction /underreaction to earnings infor-Makridakis, S. (1993). Accuracy measures: theoretical and
mation as an explanation for anomalous stock pricepractical concerns. International Journal of Forecasting
behaviour. Journal of Finance 47, 1181–1207.9, 527–529.Ackert, L., & Hunter, W. (1995). Rational expectations and
Makridakis, S., Anderson, A., Carbone, R., Fildes, R.,security analysts’ earnings forecasts. The FinancialHibon, M., Lewandowski, R., Newton, J., Parzen, E., &Review Tallahassee 30, 427–444.Winkler, R. (1982). The accuracy of extrapolation (timeAli, A., Klein, A., & Rosenfield, J. (1992). Analysts use ofseries) methods: results of a forecasting competition.information about permanent and transitory componentsJournal of Forecasting 1, 1–153.in forecasting annual EPS. The Accounting Review 67,
Makridakis, S., Chatfield, C., Hibon, M., Lawrence, M.,183–198.Mills, T., Ord, K., & Simmons, L. (1993). The M2Andreassen, P.B. (1990). Causal prediction versus extrapo-competition: a real time judgemental based forecastinglation: effects of information source on judgmentalstudy. International Journal of Forecasting 9, 5–22.forecasting accuracy. Working paper, MIT.
McNees, S. K. (1990). The role of judgement in macro-Birnberg, J., Turopolec, L., Young, S., & Buckley, J.economic forecasting accuracy. International Journal of(1983). The organizational context of accounting /com-Forecasting 6, 287–299.ments / reply. Accounting, Organizations and Society 8,
Melliss, C., & Whittaker, R. (1998). The Treasury fore-111–136.casting record: some new results. National InstituteClements, M. (1995). Rationality and the role of judge-Economic Review 164, 65–79.ment in macroeconomic forecasting. Economic Journal
Mendenhall, R. R. (1991). Evidence on the possible105, 410–420.underweighting of earnings-related information. JournalClements, M. (1997). Evaluating the rationality of fixed-of Accounting Research 29, 170–179.event forecasts. Journal of Forecasting 16, 225–239.
Nordhaus, W. (1987). Forecasting efficiency: concepts andEgginton, D. (1999). Testing the efficiency and rationalityof City forecasts. International Journal of Forecasting applications. Review of Economics and Statistics 69,15, 57–66. 667–674.
Ehrbeck, T., & Waldmann, R. (1996). Why are profession- O’Connor, M. J., & Lawrence, M. J. (1998). Judgementalal forecasters biased? Agency versus behavioural expla- forecasting and the use of available information. In:nations. The Quarterly Journal of Economics 111, 21– Goodwin, P., & Wright, G. (Eds.), Forecasting with41. judgement, Wiley, New York.
Fildes, R. (1992). The evaluation of extrapolative forecast- O’Connor, M., Remus, W., & Griggs, K. (1993). Judg-

382 M. Lawrence, M. O’Connor / International Journal of Forecasting 16 (2000) 369 –382
mental forecasting in times of change. International Faculty at the University of New South Wales, Sydney,Journal of Forecasting 9, 163–172. Australia. He has a PhD from the University of California,
O’Connor, M. J., Remus, W., & Griggs, K. (1999). Does Berkeley in Operations Research. Before joining theupdating judgemental forecasts improve forecast accura- University he worked for Ciba-Geigy Corporation andcy? International Journal of Forecasting 16, 101–109. Corning Glass Works in the USA. He has held visiting
Pankratz, A. (1983). Forecasting with univariate Box– positions at Insead, France; London Business School andJenkins models, Wiley, New York. Imperial College, London; and Lancaster University, Eng-
Sanders, N., & Manrodt, K. (1994). Forecasting practices land. He is past President of the International Institute ofin US corporations: survey results. Interfaces 24, 92– Forecasters, the major professional and academic body100. committed to improving the state of the art of forecasting.
Tversky, A., & Kahneman, D. (1974). Judgement under His research interests are in forecasting and more broadlyuncertainty: heuristics and biases. Science 185, 1124– in supporting decision making where a significant com-1131. ponent of the decision involves management judgment.
Zarnowitz, V. (1992). Business cycles: theory, history,indicators and forecasting, University of Chicago Press, Marcus O’CONNOR is a Professor in the School ofChicago. Information Systems at the University of New South
Wales, Sydney, Australia. His research interests center onBiographies: Michael LAWRENCE is Professor of In- the process of forecasting, especially the way judgement isformation Systems in the Commerce and Economics incorporated into the final forecasts.