Embed Size (px)
Citation preview
i
Sales and Operation Execution A study at SKF Group
Master of Science Thesis in the Supply Chain Management
Master’s Programme
ADARSH MOHAN NULLIPADY
ELTON ASHOK RAJU
Department of Technology Management and Economics
Division of Supply and Operations Management
Chalmers University of Technology
Gothenburg, Sweden
Year of publication: 2020
ii
REPORT NO. E2020:092
Sales and Operations Execution A study at SKF
ADARSH MOHAN NULLIPADY
ELTON ASHOK RAJU
Department of Technology Management and Economics
Division of Supply and Operations Management
CHALMERS UNIVERSITY OF TECHNOLOGY
Gothenburg, Sweden 2020

iii
Sales and Operations Execution: A study at SKF
ADARSH MOHAN NULLIPADY and ELTON ASHOK RAJU
© ADARSH MOHAN NULLIPADY and ELTON ASHOK RAJU, 2020
Master’s Thesis E2020:092
Department of Technology Management and Economics
Division of Supply and Operations Management
Chalmers University of Technology
SE-412 96 Gothenburg, Sweden
Telephone: + 46 (0)31-772 1000
Chalmers Reproservice
Gothenburg, Sweden 2020
iv
Sales and Operations Execution. A study at SKF
ADARSH MOHAN NULLIPADY AND ELTON ASHOK RAJU
Department of Technology Management and Economics
Chalmers University of Technology
Abstract Sales and operations execution as a new business process concept has been rising dramatically to
tackle volatile planning environments with high uncertainty. S&OE enables alignment of what
was planned in the S&OP process to what is being executed. Although this subject has been talked
about over the years as “weekly S&OP, short-term horizon, disaggregated plans and weekly
frequency”, the study on this topic is scarce. Hence, the primary goal of this thesis is to conduct
exploratory research using a case study and contribute to literature the topic of S&OE.
This thesis was conducted as a case study at SKF, Gothenburg. SKF has successfully implemented
the S&OE process in the US and Turkey markets without establishing the S&OP process and is
continuing to expand the business process globally. SKF had initiated the S&OE process
specifically to tackle the abnormal demand from the demand side of their supply chain. This
provided an opportunity to examine the practical perspective of S&OE and explore the literature
to what is nearly close to sales and operations execution. With this case study and using the
abductive research methodology three research questions were formulated. RQ1 is defined to
determine the general characteristics of S&OE from the research and compare it with SKF. RQ2
focuses on describing the workflow of S&OE at SKF and from a practical perspective dives into
the roles and responsibilities of the main stakeholders of the process. RQ three defines if the
S&OE process can be evaluated based on a maturity model considering the planning environment
of SKF.
This thesis contributes literature on the topic of S&OE and aids SKF in evaluating their S&OE
process. From the analysis it was concluded that the characteristics of S&OE are determined with
a comparison from the case study to the literature. An S&OE maturity model was developed using
the S&OP and S&OE literature gathered wherein an organization with the similar context as SKF
can use this model to determine their present stance and look for future improvements.
Keywords: Sales and Operation Execution, S&OE, S&OE Maturity, Supply chain management,
Industrial market, Demand control, Demand execution, Weekly S&OP, Maturity model
v
Acknowledgements This master thesis was conducted at SKF Group Bearing Operation as a project during the period
of January to June in the year 2020. This master thesis is a part of the master’s degree program of
Supply Chain Management at Chalmers University of Technology.
First and foremost, we would like to thank our supervisors at SKF, Matthias Pallhuber, Martina
Zlatar and Ganesh Karekar, who was helpful in providing the right guidance and helpful advice
through the research. We would also like to thank our colleagues Vignesh Mohan and Caroline
Ostman at the department of Global planning and Demand management for sharing their
knowledge and conversations that contributed to the project.
We also like to thank our supervisor Joakim Andersson and examiner Patrik Jonsson at Chalmers
for supporting us all the way from the beginning of the thesis by giving necessary guidance and
knowledge for driving the master thesis forward.
Adarsh Mohan Nullipady
Elton Ashok Raju
Gothenburg, Sweden, May 2020
vi
Table of Contents
1 Introduction ......................................................................................................... 1
1.1 Theoretical background ............................................................................................. 1
1.2 Company background ................................................................................................ 3
1.2.1 History................................................................................................................... 3
1.2.2 Current Businesses at SKF ..................................................................................... 3
1.3 Problem Description .................................................................................................. 5
1.4 Scope ........................................................................................................................ 6
1.5 Aim ........................................................................................................................... 6
1.6 Delimitations ............................................................................................................. 7
2 Theoretical Framework ...................................................................................... 9
2.2 Levels of planning hierarchy ...................................................................................... 9
2.3 Sales and operations planning .................................................................................. 10
2.4 Sales and operations execution ................................................................................. 13
2.4.1 S&OE Fundamentals ........................................................................................... 14
2.5 Relation of S&OE process to other planning process ................................................ 18
2.5.1 Reconciling sales and operations management ..................................................... 18
2.5.2 Demand control ................................................................................................... 18
2.6 Carvalho’s proposed model...................................................................................... 20
2.7 Business process flow chart ..................................................................................... 24
2.8 Review of roles and responsibilities ......................................................................... 25
2.9 Maturity model ........................................................................................................ 27
2.9.1 S&OP maturity model .......................................................................................... 28
2.9.2 Contingency theory for the design of S&OP ......................................................... 30
2.10 Demand planning maturity ....................................................................................... 32
3 Methodology ...................................................................................................... 35
3.2 Research approach ................................................................................................... 35
3.2.1 Primary data ........................................................................................................ 35
3.2.2 Secondary data..................................................................................................... 39
3.3 Model of analysis .................................................................................................... 40
vii
3.3.1 Research question 1 ............................................................................................. 40
3.3.2 Research question 2 ............................................................................................. 40
3.3.3 Research question 3 ............................................................................................. 41
3.4 Research quality criteria .......................................................................................... 41
4 Empirical Data .................................................................................................. 43
4.2 Description of SKF supply chain.............................................................................. 43
4.3 SKF S&OE context ................................................................................................. 44
4.3.1 Internal Context ................................................................................................... 44
4.3.2 External context ................................................................................................... 46
4.4 Sales & Operations Execution at SKF ...................................................................... 48
4.4.1 S&OE horizon ..................................................................................................... 48
4.4.2 Data hierarchies ................................................................................................... 49
4.4.3 S&OE inputs and outputs ..................................................................................... 49
4.4.4 Implementation of S&OE..................................................................................... 50
4.5 Roles and responsibilities......................................................................................... 51
4.5.1 Understanding the business process workflow ...................................................... 51
4.5.2 Roles and responsibilities of the S&OE team ....................................................... 55
4.6 S&OE Maturity at SKF ............................................................................................ 55
4.6.1 Meetings and collaboration .................................................................................. 55
4.6.2 Organization ........................................................................................................ 57
4.6.3 Measurements ...................................................................................................... 57
4.6.4 Information technology ........................................................................................ 59
4.6.5 Integration between sales and operations .............................................................. 60
4.7 Demand planning maturity ....................................................................................... 60
5 Analysis and discussion..................................................................................... 62
5.2 Comparison of characteristics with SKF’s current S&OE process ............................ 62
5.3 Roles and responsibilities matrix .............................................................................. 67
5.4 Contingency theory for the design of an S&OE process in SKF ............................... 69
5.5 Sales and operations execution maturity model ........................................................ 73
5.5.1 Meetings and collaboration .................................................................................. 75
5.5.2 Organization. ....................................................................................................... 77
viii
5.5.3 Performance Indicators ........................................................................................ 79
5.5.4 Information technology ........................................................................................ 81
5.5.5 S&OE Integration ................................................................................................ 83
6 Recommendations ............................................................................................. 86
6.2 Short term................................................................................................................ 86
6.2.1 Roles and responsibilities of Operational demand manager .................................. 86
6.2.2 Importance of forecast accuracy and improving demand planning maturity .......... 88
6.3 Long term ................................................................................................................ 89
6.3.1 Inclusion of supply side ....................................................................................... 89
6.3.2 Future looking S&OE process .............................................................................. 93
6.3.3 Incorporating additional technologies to increase S&OE maturity ........................ 94
6.3.4 Demand sensing ................................................................................................... 94
7 Conclusion .......................................................................................................... 96
7.2 Summary ................................................................................................................. 96
7.3 Generalizability ....................................................................................................... 97
7.4 Limitations .............................................................................................................. 98
7.5 Future research areas ............................................................................................... 98
Appendix A ............................................................................................................. 103
Appendix B ............................................................................................................. 104

ix
List of Figures
Figure 1: Angular contact ball bearing. Source: SKF(2020) ...................................................... 4
Figure 2: SKF global representations of Business. Source: SKF ............................................... 5
Figure 3: Anthony’s Hierarchical Control. Source: Anthony (1965).......................................... 9
Figure 4: Stages of S&OP process. Source: Adapted from Bagni & Marçola (2019) ............... 11
Figure 5: Routine Tactical Planning process. Source: Lapide (2005)....................................... 12
Figure 6: The role of S&OP in Anthony’s planning Hierarchy. Source: Carvalho (2018) ........ 12
Figure 8: Planning horizon and time buckets. Source: Chainalytics (2019) ............................. 15
Figure 9: Data hierarchies. Source: Chainalytics (2019) ......................................................... 15
Figure 10: S&OE process deployment. Source: Chainalytics (2019) ....................................... 16
Figure 11: Agenda for demand control meeting. Source adapted from: Lindsey (2019) ........... 19
Figure 12: S&OP Maturity model. Source: Grimson and Pyke (2007) .................................... 28
Figure 13: Analytical framework. Source: Ivert et al. (2015) .................................................. 31
Figure 14: Abductive research approach: Source adapted from: Kovacs & Spens (2005) ........ 35
Figure 15: SKF supply chain before integrated planning. Source: SKF ................................... 43
Figure 16: SKF supply chain with integrated planning. Source: SKF ...................................... 44
Figure 17: SKF Organizational chart. Source: SKF ................................................................. 45
Figure 18: S&OE planning horizon. Source: Author’s contribution ........................................ 48
Figure 19: Data hierarchies set at SKF. Source: Author’s contribution .................................... 49
Figure 21: Implementation of S&OE process. Source: Author’s contribution. ......................... 50
Figure 23: SKF Current states S&OE BPMM. Source: Author’s contribution. ........................ 52
Figure 22: Daily activities of Operational demand manager in S&OE process. Source: Author’s
contribution ............................................................................................................................ 54
Figure 24: Results of the demand planning assessment done. Source: Results from survey done
at SKF by Authors .................................................................................................................. 61
Figure 25: SKF analytical framework. Source adapted from: Ivert et al. (2015). ..................... 69
Figure 26: Linking PE variables with S&OE set-up and Process parameter. Source: Author’s
contribution ............................................................................................................................ 73
Figure 28: Supply chain planning matrix. Source adapted from: Stadler et al. (2012) .............. 90
Figure 29: Demand and supply side activities in S&OE. Source: Author’s contribution .......... 92
Figure 31: Overview of S&OE activities. Source: Author’s contribution .............................. 103
x
List of Tables
Table 1: Characteristics of S&OE process. Source: Carvalho (2018) and (Pukkila, 2016) ....... 23
Table 2: Business process model and notation. Source: OMG (2011) ...................................... 25
Table 3: RACI matrix. Source adapted from: Nevin (2014) .................................................... 26
Table 4: Demand planning maturity model. Source: Vereecke et al. (2018, p.1633) ................ 33
Table 5: Rating scale. Source: Vereecke et al. (2018) .............................................................. 34
Table 6: List of interviewees with purpose of interview and location. Source: Author’s
contribution. ........................................................................................................................... 39
Table 7: Comparison of characteristics of Carvalho (2018) versus SKFs process. Source:
Author’s Contribution. ............................................................................................................ 67
Table 8: RACI matrix for S&OE process. Source: Author’s contribution. ............................... 68
Table 9: S&OE maturity framework. Source: Author’s own contribution ................................ 75
Table 10: S&OE meetings and collaboration. Source: Author’s contribution........................... 77
Table 11: S&OE organization. Source: Author’s contribution. ................................................ 79
Table 12: S&OE performance indicators. Source: Author’s contribution. ................................ 81
Table 13: S&OE information technology. Source: Author’s contribution ................................ 83
Table 14: S&OE integration. Source: Author’s contribution ................................................... 85
xi
List of Abbreviations
Abbreviation Full form
S&OE Sales and Operations execution
S&OP Sales and operations planning
MPS Master production schedule
DP Demand planning
PE Planning environment
ML Machine learning
AI Artificial intelligence
MTS Make to stock
MTO Make to order
OTIF One-time order in full
BPMN Business process model and notation
WH Warehouse
LWH Local warehouse
FWH Factory warehouse
RWH Regional warehouse
IP Integrate planning
CSR Customer service representative
DMI Demand management inquiry
SME Subject matter experts
KPIs Key Performance indicators
1
1 Introduction
In this chapter we present the background of the thesis and the company followed by the problem
description as to why this master thesis was conducted. Research questions, aim, scope and
delimitations of this thesis are also presented in this chapter.
1.1 Theoretical background
In the present business environment balancing demand and supply has become an essential
problem to solve and obtain smooth operations in the company’s supply chain. Primarily because
the market is shifting from operational excellence to customer excellence. Increasing market
volatility is compelling top executives in companies to deliberately look for various methods and
processes in order to be flexible to demand variations, achieve cost and service benefits, reduce
inventory and overall satisfy customers and increase profits (Chase & Chase, 2016). According
to Grimson & Pyke (2007), sales and operation planning (S&OP) is one such process that
synchronizes demand and supply in order to attain maximum profits.
The S&OP process initially began in the 1950s with aggregated production planning which then
later evolved into manufacturing resource planning in the 1980s. It then later became well-known
in the 90s as a process that supports more internal decisions of the firm. S&OP first came to
academic works when it was referred to production planning by Ling & Goddard (1988).
According to Gianesi (1998), S&OP is a process that connects manufacturing to top management
and other functional areas of the company. Thus, aiming to balance demand and supply by
collaborating plans with different supply chain departments within the company i.e. both
vertically, from strategic to operational, and horizontally, between functional areas (Carvalho,
2018). The main role of S&OP is to facilitate the Master Production Schedule (MPS), Demand
Planning (DP) and support in the connection between these two processes. In order to acquire this
link between MPS and DP, the two main components of S&OP are the sales and the production
plan must be synchronized. Sales plan is based on the demand forecast and the production plan
ultimately provides the requirement of capacity needed, inventory level and order backlogs
(Carvalho, 2018).
According to Lapide (2011), the business environments change drastically over time depending
on global factors. Therefore, in order to balance the supply chain S&OP processes must best suit
the context of the firm i.e. the S&OP process must help the firm conquer business difficulties such
2
as facing demand uncertainties, supply chain imbalance, profit, loss, etcetera and prevent any
possible mishap. Ivert et al. (2015) contributes to this topic of designing S&OP process based on
contextual factors. Ivert et al. (2015) uses the contingency theory to find planning environment
(PE) variables that affect the S&OP processes. These PE variables requires more of agile planning
with higher planning frequencies and shorter horizons and lower level of aggregated planning
which puts out a requirement for weekly S&OP (Carvalho, 2018). These PEs could be high
complexity environments, product complexity, long lead times, demand uncertainty, supply
uncertainty, stock outs etcetera.
In addition, Pukkila (2016) states that plans made by top management were difficult to coordinate
and execute since the S&OP process does not lend itself to an actionable plan but only to strategic
plans. Hoey (2018) also highlights that there is no “established business function” which deals
with “daily and weekly supply chain adjustments” which are required to maintain mid-to-long
term plans. Therefore, agile planning has now become a recent highlight in the last two years
where it is developing as a new process which aligns the tactical planning of S&OP to operations
in volatile environments called Sales and Operations execution (S&OE) (Pukkila, 2016).
Shaikh (2018) discusses the importance of technology in the field of management and its
evolution over the years which has tremendously impacted organizations positively in
orchestrating the business process. Renowned organizations today are investing in advanced
technology in order to provide solutions that are seamlessly coordinating their S&OP and S&OE
process. New innovations such machine learning (ML) and Artificial intelligence (AI) facilitate a
closed loop process by collecting and applying important data in a way that aids managers in
recognizing disruptions earlier.
At present there is very limited academic works about S&OE, therefore throughout this paper
literature will be used from specific papers written by Carvalho (2018) and Bower (2018) which
discusses in depth about sales and operations execution and also, grey literature such as white
papers from consulting groups, blogs, and articles published from Gartner and other sources will
be used to build theoretical knowledge on S&OE. This master thesis is about establishing a stance
theoretically on the topic of S&OE by exploring and analyzing the sales and operations execution
on collaboration with a case company that is implementing this process globally.

3
1.2 Company background
1.2.1 History
This thesis is carried out at and in collaboration with SKF Group. SKF group is a Swedish bearing
company that provides products and services within rolling bearing, seals, mechatronics, services,
and lubrication systems. The company was founded in 1907 by Sven Wingqvist who had a patent
on multi-row self-aligning radial ball bearings. The patent was granted to Sven Wingqvist on 6th
June in Sweden along with other patents from ten different countries. The new ball bearing was
very successful and by 1910 SKF had 325 employees and a subsidiary from the United Kingdom.
With two years of establishment in Sweden by 1912 SKF had expanded globally to 32 countries
and by 1930 SKF had employed 21000 people for 12 manufacturing sites worldwide, the largest
manufacturing site located in Philadelphia.
In 1926, sales manager Assar Gabrielsson and managing director Björn Prytz of SKF founded the
company Volvo AB. At the beginning, Volvo AB functioned as a subsidiary automobile company
within the SKF group and it funded Volvo AB in the production of the first thousand cars which
was built at Hisingen, Gothenburg. The ownership of Volvo lasted only till 1935 till the last shares
were divested.
In the 1970s SKF undertook an enormous production development program in Europe. It was a
visionary project called the “production concept of the 80s” which aimed to run production
overnight without the laborers in order to increase productivity. To run production consistently
and maintain the product quality an automatic flow of bearing was necessary, hence, SKF
developed the flex link multi flex plastic chain conveyor system. SKF divested the flex link
system as a separate entity in 1997. Since then, SKF has grown even more and holds a large
market share in the production and distribution of bearings.
1.2.2 Current Businesses at SKF
Today, SKF is one among the largest manufacturers of bearings globally and currently it employs
43,360 people in approximately 103 manufacturing sites that are spread across 130 countries.
SKF organization is split focusing on two markets i.e. Industrial as one and Automotive and
Aerospace as the other.
With regard to the industrial market SKF supplies more than 40 industries worldwide with
products and services, both directly and indirectly through a network of more than 7000
distributors. The product offerings include developing and manufacturing a wide range of
bearings, seals, lubrication systems and providing services and solutions for the rotating shaft for

4
various applications across different industries. In the industrial sector SKF holds a leading
position in certain industries such as railway and heavy industries, this position is also shared
among other companies. The industrial sector is currently 72% of SKF’s net sales with a market
value of SEK 255-275 billion which also leads the position in the industrial distribution market
serving products for the aftermarket industries.
Figure 1: Angular contact ball bearing. Source: SKF(2020)
With respect to the automotive and aerospace sector, SKF supplies customized bearing, seals, and
related products for rotation of wheels, driveline, engine, e-powertrain, suspension and steering
applications for automotive manufacturers such as cars, trucks, buses and two-wheelers. Few of
the automotive manufacturers are Volvo, BMW, Rolls Royce, Formula One racing teams etcetera.
SKF’s position in this sector is also quite strong compared to their competitors. This company
leads in the development of components for automotive electrification and the aftermarket
industry for automotive. SKF holds a strong global position with its enormous distribution
network containing more than 10,000 distributors. According to SKF Group (2019), it is recorded
that 28% of SKF’s net sales are from the automotive industry having a market value of SEK 145-
155 billion. The competitors for SKF are also quite strong, just to name a few; they are; Schaeffler
group, Timken, NSK, NTN, JTEKT, lljin, C&U and Wanxiang Qianchao. The Figure 1 presents
a traditional ball bearing which is one of many other product variants that SKF produces. The
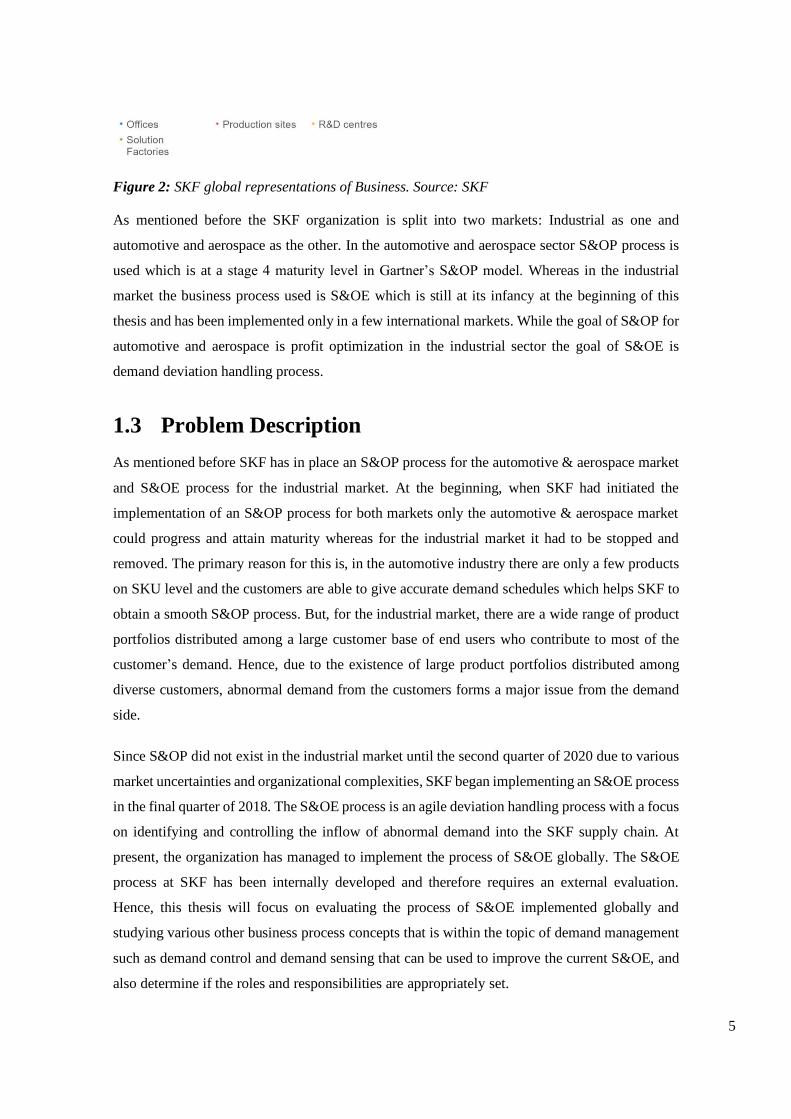
Figure 2 below represents SKF’s business coverage worldwide.
5
Figure 2: SKF global representations of Business. Source: SKF
As mentioned before the SKF organization is split into two markets: Industrial as one and
automotive and aerospace as the other. In the automotive and aerospace sector S&OP process is
used which is at a stage 4 maturity level in Gartner’s S&OP model. Whereas in the industrial
market the business process used is S&OE which is still at its infancy at the beginning of this
thesis and has been implemented only in a few international markets. While the goal of S&OP for
automotive and aerospace is profit optimization in the industrial sector the goal of S&OE is
demand deviation handling process.
1.3 Problem Description
As mentioned before SKF has in place an S&OP process for the automotive & aerospace market
and S&OE process for the industrial market. At the beginning, when SKF had initiated the
implementation of an S&OP process for both markets only the automotive & aerospace market
could progress and attain maturity whereas for the industrial market it had to be stopped and
removed. The primary reason for this is, in the automotive industry there are only a few products
on SKU level and the customers are able to give accurate demand schedules which helps SKF to
obtain a smooth S&OP process. But, for the industrial market, there are a wide range of product
portfolios distributed among a large customer base of end users who contribute to most of the
customer’s demand. Hence, due to the existence of large product portfolios distributed among
diverse customers, abnormal demand from the customers forms a major issue from the demand
side.
Since S&OP did not exist in the industrial market until the second quarter of 2020 due to various
market uncertainties and organizational complexities, SKF began implementing an S&OE process
in the final quarter of 2018. The S&OE process is an agile deviation handling process with a focus
on identifying and controlling the inflow of abnormal demand into the SKF supply chain. At
present, the organization has managed to implement the process of S&OE globally. The S&OE
process at SKF has been internally developed and therefore requires an external evaluation.
Hence, this thesis will focus on evaluating the process of S&OE implemented globally and
studying various other business process concepts that is within the topic of demand management
such as demand control and demand sensing that can be used to improve the current S&OE, and
also determine if the roles and responsibilities are appropriately set.
6
1.4 Scope
The scope of the study is to evaluate the current setup of the S&OE process with a focus on
evaluation of characteristics, roles and responsibilities and already set KPIs. In order to improve
the current setup at SKF by giving a direction as to how their maturity can be improved and as a
theoretical contribution towards S&OE process maturity, a maturity model is developed from the
existing frameworks present in literature. Regarding the study, the thesis is conducted over 5
months within one focal company at the company headquarters in Gothenburg.
1.5 Aim
The aim of this thesis is to explore and evaluate the current S&OE process that is implemented at
SKF Industrial markets and improve the capabilities of the S&OE process. In order to fulfill the
aim, three research questions are to be answered as follows:
As mentioned before, there is a lack of academic work on the topic of S&OE. Hence, with the
first research question stated below; it enables the authors of this paper to conduct an exploratory
research among various journals, grey literature and consultant papers to obtain and establish
literature on the topic of S&OE. With the literature in place, the S&OE process of the case
company is analyzed.
Research question 1: What are the characteristics of the S&OE process at SKF?
At present, the case company is in need of an external evaluation of the S&OE process, with the
second research question stated below and the literature established in this paper it enables the
authors of this paper to examine the workflow and provide the necessary recommendation for
suggestions and improvement in specific areas.
Research question 2: How is SKF’s S&OE process designed with respect to workflow and are
the roles and responsibilities appropriately set for the process?
In order to evaluate the maturity of the S&OE process of the case company, a maturity model
must be used to determine its current state and provide suggestions on how the company can
improve. With the third research question stated below it enables the authors to explore the
maturity models available in academic works and select the nearly appropriate model from which
it can be adapted in order to evaluate the S&OE process and provide recommendations.
Research question 3: What are the contextual factors affecting the S&OE process at SKF and
how can the maturity of the S&OE process be assessed.?
7
The answer to the first research question proceeds by comparing SKF’s S&OE characteristics to
an S&OE model developed by Carvalho (2018). This comparison is done to find out how much
of the practical characteristics of a business process such as S&OE is aligned to theory. For the
second research questions, the workflow of the S&OE process and the role and responsibilities of
stakeholders involved is reviewed with a focus on roles and responsibilities of Operational
demand manger and the relevant KPIs. The answer to the third research question proceeds by
analyzing the S&OP maturity model developed by Grimson & Pyke (2007) and identifying the
similarities between S&OP and S&OE. A conceptual S&OE model is then developed by adapting
from the S&OP maturity model. This model will be used to determine SKF’s S&OE maturity.
1.6 Delimitations
This section explains the delimitations which were considered during the study i.e. the choices
made by the authors to set the boundaries for the study.
This thesis is done purely on a qualitative basis with data collected through primary and secondary
data sources. There is no consideration given to the analysis ERP systems used for the S&OE
process as there is no quantitative analysis done.
This thesis was performed during a period of 6 months. Due to this time restriction it was decided
to adapt the S&OE maturity framework instead of developing a maturity model and testing it
which would require approximately a years’ time or more. This research does not go in depth on
factors affecting sustainability due to the time restriction on theory exploration and analysis
related to sustainability. For instance, the sustainability aspect is briefly described in the
recommendation section of "inclusion of supply side” where impact of reduced transport
expedites on sustainability is explained. This is since the time to invest in depth on the
sustainability part of the thesis was limited due to time restrictions.
Also, due to the unfortunate pandemic of COVID 19, there were difficulties getting the interviews
from the stakeholders such as sales/demand managers which hindered the assessment of roles and
responsibilities of other stakeholders involved in the S&OE process. Mainly, the company was in
a survival mode where many planned interviewees had to prioritize their tasks instead of
participating in the interviews of this thesis work.
During the halfway phase of this research, the S&OP process were implemented which was not
included as majority of data collection for research were finalized. For instance, the company had
lacked maturity in some aspects of demand planning which was analyzed in the beginning of
research. Based on this analysis, demand planning maturity assessment was done to improve the
8
input to S&OE process. But later SKF had decided to take advantage of the pandemic of covid-
19 to implement the S&OP process. Hence, S&OP which is in its infancy at SKF is not considered
to be part of this research. Also, for the development of the maturity model it was considered not
to include S&OP which is explained in first two stages of the S&OE maturity model.
Lastly, there was also an organizational change which was not considered under this scope of this
thesis. But one aspect of the organization changes which is considered is the change of department
of “Demand chain and Logistics” to “Global planning and Demand management”. One aspect
which is ignored is the organization structure as to how the Automotive and Aerospace and
Industrial market changed after SKF underwent the reorganization.
With respect to data collection, most of primary data was collected in a virtual environment. i.e.
using the organization’s communication tool of “Microsoft teams”. In an online interview,
although there is access to technology and good communication capability, the subtle visual non-
verbal clues which aids to contextualize the interviewee in a face-to-face scenario are lost. Also,
the participation in virtual interviews requires a higher level of motivation than compared to the
conventional interview which is conducted face to face.
9
2 Theoretical Framework
This chapter explains the literature on the area of study. The aim of this chapter is to set a
theoretical foundation in order to analyze the case company from the empirical finding in chapter
four. The first section covers the planning hierarchy used in the business process of S&OP and
S&OE and the following sections provide a detailed description of both the business processes.
Thereafter, literature on the relation of other business processes and concepts are reviewed such
as BPMN model, contingency theory, demand planning maturity and the RACI matrix.
2.2 Levels of planning hierarchy
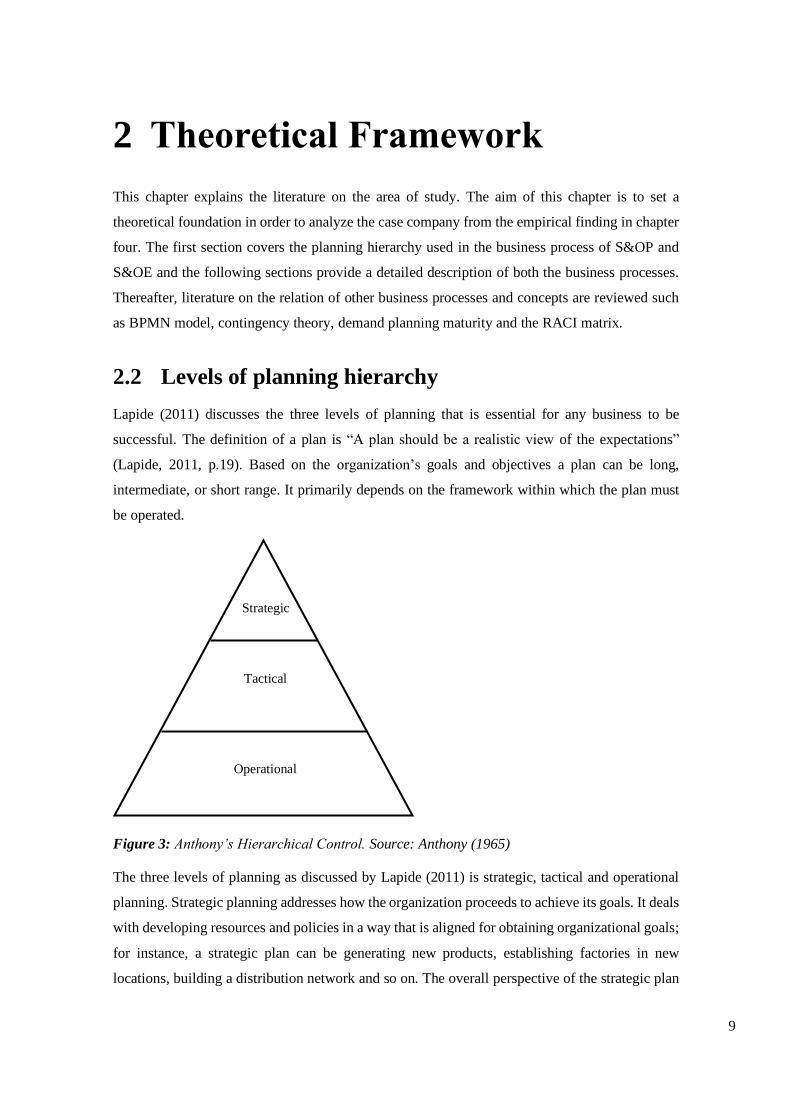
Lapide (2011) discusses the three levels of planning that is essential for any business to be
successful. The definition of a plan is “A plan should be a realistic view of the expectations”
(Lapide, 2011, p.19). Based on the organization’s goals and objectives a plan can be long,
intermediate, or short range. It primarily depends on the framework within which the plan must
be operated.
Figure 3: Anthony’s Hierarchical Control. Source: Anthony (1965)
The three levels of planning as discussed by Lapide (2011) is strategic, tactical and operational
planning. Strategic planning addresses how the organization proceeds to achieve its goals. It deals
with developing resources and policies in a way that is aligned for obtaining organizational goals;
for instance, a strategic plan can be generating new products, establishing factories in new
locations, building a distribution network and so on. The overall perspective of the strategic plan
Strategic
Tactical
Operational
10
should be very broad which is based on a longer horizon along with decisions made by executives
of the organization (Jonsson & Mattsson, 2009).
Tactical planning addresses on how the capacity or resources should be utilized for achieving the
strategic plan for e.g., setting up production machines and man hour required to produce a certain
product. The tactical plan should have a medium range planning horizon with items aggregated
into product families (Jonsson & Mattsson, 2009). Tactical plans can also be updated based on
whether it is achieving the strategic goals in an efficient manner.
Operational planning is activities that are on a done daily basis. The plans generated in tactical
planning are disaggregated for daily activities. These plans are worked over a short planning
horizon with lower management involved in managing and executing these activities. Carvalho
(2018) presents a general structure of planning hierarchy by using Anthony (1965) which is
presented in Figure 3. By using the planning structure presented in Figure 3, it is important to
clearly distinguish where S&OP and S&OE can be placed in the hierarchy. This is done in
consideration to avoid skepticism of understanding the aim of each process by looking into how
far the plan is stretched out and what each process aims to achieve. In the later sections of this
literature review Anthony’s hierarchical control structure will be used to present where S&OP
and S&OE is currently placed.
2.3 Sales and operations planning
Sales and operations planning (S&OP) is a process that has been implemented in companies
worldwide. The definition of S&OP varies among different authors, but, according to Jonsson &
Mattsson (2009), S&OP is a process that occurs at the top management level of a business
organization which involves in creating and establishing plans for sales and production. The
purpose of S&OP is to align cross-functional business decisions, goals and objectives that aim to
balance out supply and demand from month to month in-order to optimize profits (Jonsson &
Mattsson, 2009). The planning horizon for the S&OP process is between 3-24 months where
monthly meetings are conducted which focus on supply and demand of product groups making
necessary balance on factors such as revenues, customer service and costs (Shaikh, 2018). Bagni
& Marçola (2019) mention that there are numerous literature from authors that have presented
and explained similar S&OP models such as Palmatier & Crum (2003), Lapide (2004), Grimson
& Pyke (2007), Wallace & Stahl (2008), Esper et.al (2009) and Thome et al. (2012) and from
their paper a common Figure of S&OP is presented which is shown in the Figure 4.
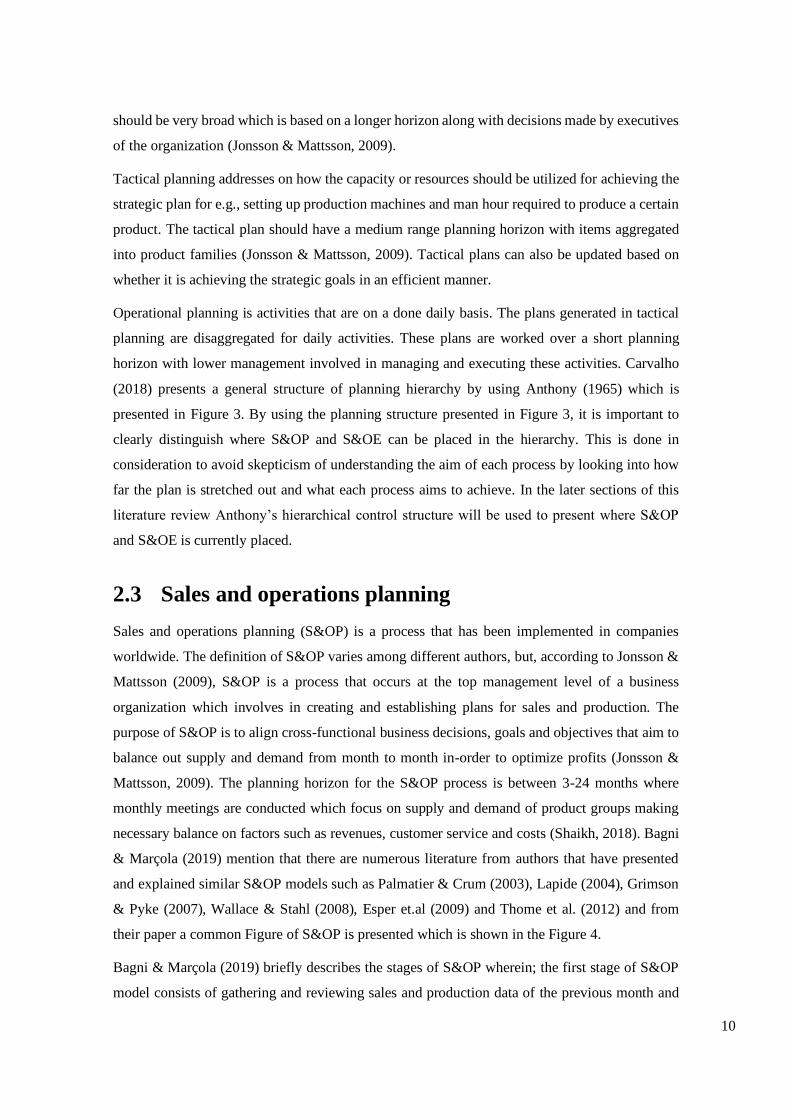
Bagni & Marçola (2019) briefly describes the stages of S&OP wherein; the first stage of S&OP
model consists of gathering and reviewing sales and production data of the previous month and
11
looking into present stock levels & backorders. The second stage defines the statistically
forecasted sales plan for the coming months. This plan is generated based on automated IT
systems and modified by field sellers, sales managers, and the marketing team. At this stage it is
also important to ensure that marketing plans regarding product promotions are aligned with
production plans. In the third stage the supply plans are discussed based on the new sales plan.
Stage four consists of meeting the entire S&OP team to present wherein topics on demand and
supply constraints are discussed. At this stage, the revenues of the firm are analyzed, and the sales
and supply teams together provide a solution or alternatives if required. Stage 5 consists of
meeting executives to present results of the previous month and discuss the risk and opportunities
for coming months.
Figure 4: Stages of S&OP process. Source: Adapted from Bagni & Marçola (2019)
Lapide (2011) defines S&OP process as a routine tactical process which synchronizes supply and
demand plans looking over a medium-term planning horizon. Lapide (2011) discusses about
S&OP planning and distinguishes it from different types of planning i.e. strategic, tactical and
operational planning. With regards to S&OP the tactical plans have a medium-term planning
horizon i.e. 3-24 months and use time buckets of months and weeks. The plans are more detailed
and are frequently changed. The Figure 5 below shows the relation between the strategic plan, the
level at which the S&OP process is conducted and its connection to executing daily operations
which influences the performance of the company.
12
Figure 5: Routine Tactical Planning process. Source: Lapide (2005)
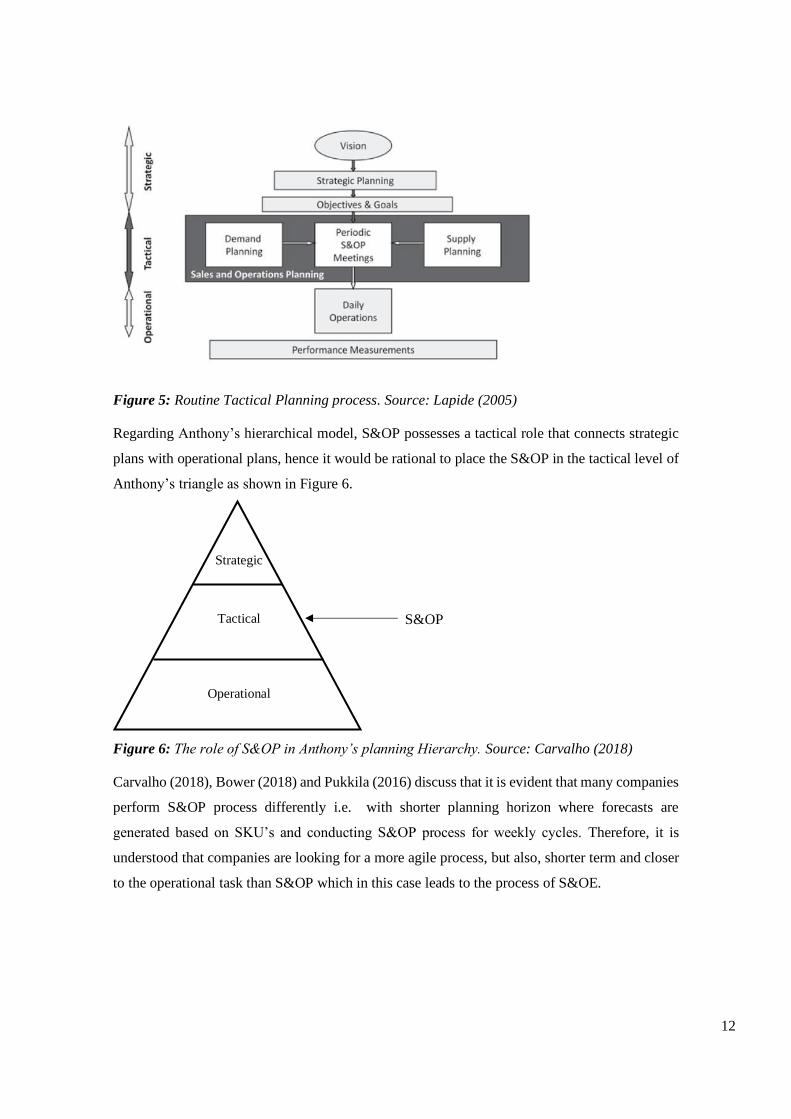
Regarding Anthony’s hierarchical model, S&OP possesses a tactical role that connects strategic
plans with operational plans, hence it would be rational to place the S&OP in the tactical level of
Anthony’s triangle as shown in Figure 6.
Figure 6: The role of S&OP in Anthony’s planning Hierarchy. Source: Carvalho (2018)
Carvalho (2018), Bower (2018) and Pukkila (2016) discuss that it is evident that many companies
perform S&OP process differently i.e. with shorter planning horizon where forecasts are
generated based on SKU’s and conducting S&OP process for weekly cycles. Therefore, it is
understood that companies are looking for a more agile process, but also, shorter term and closer
to the operational task than S&OP which in this case leads to the process of S&OE.
Strategic
Tactical
Operational
S&OP
13
2.4 Sales and operations execution
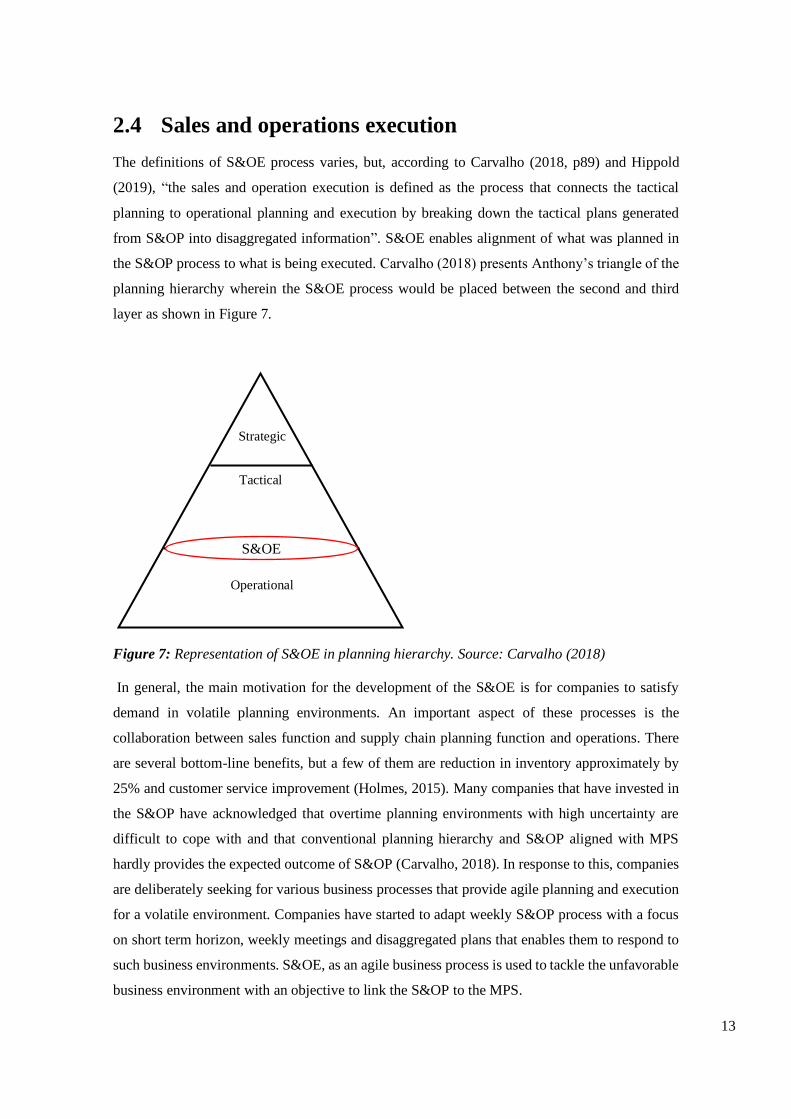
The definitions of S&OE process varies, but, according to Carvalho (2018, p89) and Hippold
(2019), “the sales and operation execution is defined as the process that connects the tactical
planning to operational planning and execution by breaking down the tactical plans generated
from S&OP into disaggregated information”. S&OE enables alignment of what was planned in
the S&OP process to what is being executed. Carvalho (2018) presents Anthony’s triangle of the
planning hierarchy wherein the S&OE process would be placed between the second and third
layer as shown in Figure 7.
Figure 7: Representation of S&OE in planning hierarchy. Source: Carvalho (2018)
In general, the main motivation for the development of the S&OE is for companies to satisfy
demand in volatile planning environments. An important aspect of these processes is the
collaboration between sales function and supply chain planning function and operations. There
are several bottom-line benefits, but a few of them are reduction in inventory approximately by
25% and customer service improvement (Holmes, 2015). Many companies that have invested in
the S&OP have acknowledged that overtime planning environments with high uncertainty are
difficult to cope with and that conventional planning hierarchy and S&OP aligned with MPS
hardly provides the expected outcome of S&OP (Carvalho, 2018). In response to this, companies
are deliberately seeking for various business processes that provide agile planning and execution
for a volatile environment. Companies have started to adapt weekly S&OP process with a focus
on short term horizon, weekly meetings and disaggregated plans that enables them to respond to
such business environments. S&OE, as an agile business process is used to tackle the unfavorable
business environment with an objective to link the S&OP to the MPS.
Strategic
Tactical
Operational
S&OE

14
S&OE is a granular process which focuses on a daily and weekly demand and supply variations
which requires execution of a tactical plan i.e. observing demand and supply data and making the
required changes on a daily basis to obtain a balance on demand and supply. This is done by
focusing on executing plans on a shorter horizon of 0-13 weeks rather than 3-18 months which
occurs in the S&OP process. Moreover, S&OE is a process that unfolds the tactical S&OP plans
into less aggregated information that is easier to understand and execute. As a result, the S&OE
process provides effective communication and aligns cross-functional teams and stakeholders.
Meetings conducted in S&OE are focused more on item level such as SKU’s, shipments, fill rates,
inventory levels etcetera. By focusing on a more granular level, it is possible to obtain more
flexibility in terms of variations in demand and supply, prevent stock outs, increase sales, and
overall optimize profits.
2.4.1 S&OE Fundamentals
According to Chainalytics (2019), the fundamentals of S&OE required to have an end to end
workflow are , namely, about the decision that can be made from S&OE, the inputs and outputs
of S&OE, S&OE horizon and data hierarchies that should be set for the process. These are
explained in detail below.
Decisions Made in S&OE process
The sales and operations execution process are mainly used to disaggregate or spread the latest
S&OP monthly plan into weekly plans to determine and act on deviations that occur between the
latest S&OP plan to operational details. The decisions that are made to act on daily deviations
“help to define the business logic needed to make the S&OP plan actionable” (Chainalytics, 2019,
p.5). This also sets the business rules for “criteria and threshold” in identifying an accurate
forecast vs actual deviation and actions that follow” (Chainalytics, 2019, p.5).
S&OE Outputs and Inputs
The outputs (plans and decisions) in S&OE process are the actions and alerts that require the
attention and execution by human organizations, it can also be the data that is inserted into other
processes and IT systems, for e.g., MPS (Chainalytics, 2019). Each output that is generated needs
a "definition" for the receiver to perform any actions. Inputs for these actions and alerts are created
depending on the requirements of the output. For e.g. an output would be a Demand manager
receiving an alert due to an unanticipated order quantity of an item from a customer when
compared to previous week’s demand. The input would depend on the necessary action to take
place, for instance, it can be rescheduling the order due stock unavailability, the order can be split
into two delivery dates, reconfirm why such order has been placed, and so on.

15
S&OE horizon
Figure 8: Planning horizon and time buckets. Source: Chainalytics (2019)
Planning horizon as defined by Jonsson & Mattsson (2009, p.45) is “the amount of time a plan
extends into the future”. The planning horizon for the S&OE process is 0 to 3 months (Carvalho,
2018). The Figure 8 indicates that the S&OE horizon ends when the S&OP horizon begins, and
the length of the S&OE horizon should be identified depending on the type of business or industry.
The S&OE process in some businesses begin instantly or for e.g. when implying to manufacturing
business it can begin at the end of the frozen production period (Carvalho, 2018).
Data hierarchies of S&OE
Data hierarchies is a design for the planning hierarchies of the data which enables the users to
have access to the right level of detail for their planning process. For instance, one of the designs
for S&OP is a process done on monthly cadence over a subregion on product group level. In terms
of S&OE process, since it provides a detailed planning result it requires a higher level of
granularity. For e.g., Figure 9 shows the planning hierarchy design for S&OE would consist of a
time with weekly cadence, country in geography or customer level and product level in product
code or material code.
Figure 9: Data hierarchies. Source: Chainalytics (2019)
16
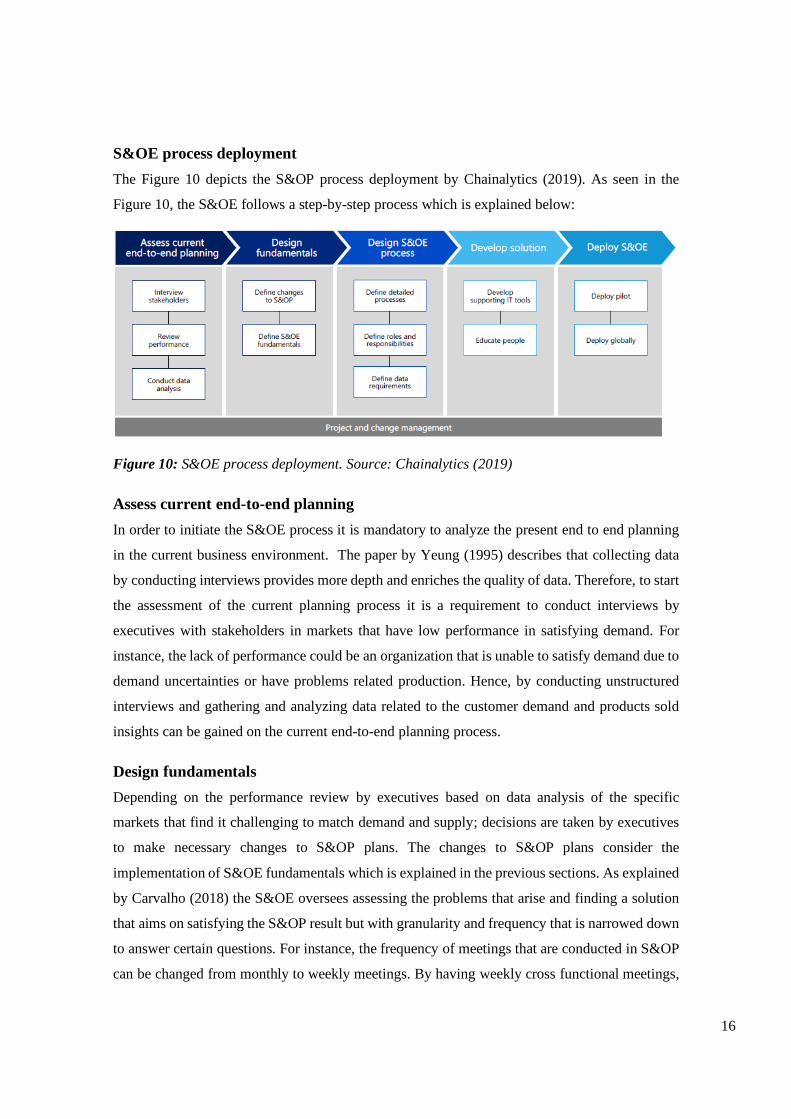
S&OE process deployment
The Figure 10 depicts the S&OP process deployment by Chainalytics (2019). As seen in the
Figure 10, the S&OE follows a step-by-step process which is explained below:
Figure 10: S&OE process deployment. Source: Chainalytics (2019)
Assess current end-to-end planning
In order to initiate the S&OE process it is mandatory to analyze the present end to end planning
in the current business environment. The paper by Yeung (1995) describes that collecting data
by conducting interviews provides more depth and enriches the quality of data. Therefore, to start
the assessment of the current planning process it is a requirement to conduct interviews by
executives with stakeholders in markets that have low performance in satisfying demand. For
instance, the lack of performance could be an organization that is unable to satisfy demand due to
demand uncertainties or have problems related production. Hence, by conducting unstructured
interviews and gathering and analyzing data related to the customer demand and products sold
insights can be gained on the current end-to-end planning process.
Design fundamentals
Depending on the performance review by executives based on data analysis of the specific
markets that find it challenging to match demand and supply; decisions are taken by executives
to make necessary changes to S&OP plans. The changes to S&OP plans consider the
implementation of S&OE fundamentals which is explained in the previous sections. As explained
by Carvalho (2018) the S&OE oversees assessing the problems that arise and finding a solution
that aims on satisfying the S&OP result but with granularity and frequency that is narrowed down
to answer certain questions. For instance, the frequency of meetings that are conducted in S&OP
can be changed from monthly to weekly meetings. By having weekly cross functional meetings,
17
it provides much faster transparency between departments wherein a mutual agreement can be
made to satisfy an uncertain demand. Examples such as these are used to define the fundamentals
of the S&OE to stakeholders to make S&OP plan actionable.
Designing the S&OE process
Explaining the fundamentals is a significant step, based on the S&OE fundamentals that is
established with stakeholders; executives take the next step to design the S&OE process. In this
step the S&OE process is designed according to the organization’s requirements and then
explained to stakeholders on how the process should be conducted. Usually the S&OE is designed
based on observing demand and supply data and making the required changes on a daily basis to
obtain a balance on demand and supply. The S&OE process is explained in terms of the planning
horizon, focusing on SKU’s that possess volatile demand, keeping track of orders and shipments
and keeping track on S&OP plans. Each stakeholder is given a specific role and responsibility in
executing the S&OE process. For e.g. the role of a sales executive would be to generate a demand
according to the production capacity of the company and not naively aiming to hit the sales target.
Developing solution
To solve the problems identified technology is essential to any organization. Lapide (2005)
mentions that business processes without the presence of information technology becomes a
burden to employees in the organization. Therefore, to support the large scale of benefits that the
business processes can offer technology becomes a necessary asset. According to Carvalho
(2018), one of the main systems used to facilitate the process of S&OE is the ERP system as it
helps monitoring the operations but other systems such as the MPS and the MRP can also be used
to derive the order from customers. In order to support the weekly meetings Carvalho (2018)
discusses the S&OE cockpit that should be developed in order to facilitate the weekly meetings.
This cockpit serves as an information tool with logic to operationalize the process of S&OE. The
cockpits can be dashboards, BI tools or simple excel sheets. With the supporting information
technology in place, enlightening the stakeholders on what information should be assessed to
make final decisions is very important. Hence, for the S&OE process executives develop KPIs
for specific markets and integrate the demand data on SKU level to the S&OE cockpit for
stakeholders to act upon.
Deploying S&OE process
In order to implement an S&OE process globally it is very essential to select a market with the
problem such as handling demand uncertainties by deploying a pilot project, it helps organizations
to control and minimize the risk. Testing a project in a controlled manner allows stakeholders to
18
assess the effects and discover unanticipated outcomes. Once the process is modified for the
expected outcomes it is then ready to be deployed globally.
2.5 Relation of S&OE process to other planning process
2.5.1 Reconciling sales and operations management
In an article by Lim, Alpan, & Penz (2014, p.23) wherein it describes a new planning process
used in an automotive manufacturer Renault. The process being “a hybrid intermediary between
S&OP and MPS”. In this planning process the sales department conducts a weekly demand
forecast every month for the next three months with a low product aggregation level focusing on
a weekly bucket. Although the Lim, Alpan, & Penz (2014) do not provide a name for this process
and the motivation to use this process is different it highly resembles S&OE.
Upon researching on the topic of S&OE it was also recognized that this process can also be related
to the workings of the master production schedule (MPS). Based on Jonsson & Mattsson (2009,
p179) the MPS is “defined as a process which involves establishing plans for a company’s sales
and production operations. The main concept of MPS is to synchronize demand and supply in a
way that company’s efficiency and competitiveness are promoted. The plans for production in the
MPS are extracted from demand forecasts of the future and the process is conducted more than
once a month just as it is done for the S&OE process. But, the relation to S&OE cuts off as the
MPS is more of an automated calculation procedure” for make to stock (MTS) and make to order
(MTO) companies (Jonsson & Mattsson, 2009). Moreover, the MPS is a manufacturing planning
tool administered by a master production scheduler who transforms the aggregate plans to specific
end items that are required to be produced within a time period whereas the S&OE is more of an
executional business process. In an advanced manufacturing company, the MPS would perform
the automated calculation for the specific items to be produced.
2.5.2 Demand control
According to Bower (2018) demand control is also sometimes called sales and operations
execution. Holmes (2015) & Lindsey (2019) have also worked on a similar concept called demand
control which is explained in the next section. Holmes (2015) defines “demand control is a process
to manage when demand materializes differently than planned in the near term, liberating sales,
marketing, and demand planning organizations to focus on the long term 5-25 month horizon and
addressing short term supply planning priorities, capabilities and concerns”.
19
With demand materializing differently than planned in the near term means that there could be
two scenarios.
Scenario 1: “If the demand is greater than planned in the near term and there are insufficient
products available to fulfill customer orders to the requested date by customers”. This situation
arises mainly due to poor behaviors of customers. In this scenario, the demand controlling process
highlights the sales organization of unproductive customer behavior and gives them a process to
prioritize the demand by giving them authority to make stock allocation decisions. This demand
controlling process gives confidence to sales that their priorities are being executed. But there
may arise a situation where the individual sales representatives may not always get their way, but
they get to know the priorities through the demand control meeting. For example, in such a
situation, companies can prioritize selling orders which are giving good margin to the company
(Holmes, 2015).
Scenario 2: “If the demand is less than planned in the near term, there will be excess inventory
buildup and reductions in sales revenue and volume”. This may force supply chain planners to
avoid critical cost overruns such as excess inventory or expired inventory. These actions taken by
the supply chain planners do not consider the timing of demand. For instance, actions such as,
manipulation of forecast directly to the system or not rolling unconsumed forecast into the
following period to protect against excessive inventory (Holmes, 2015).
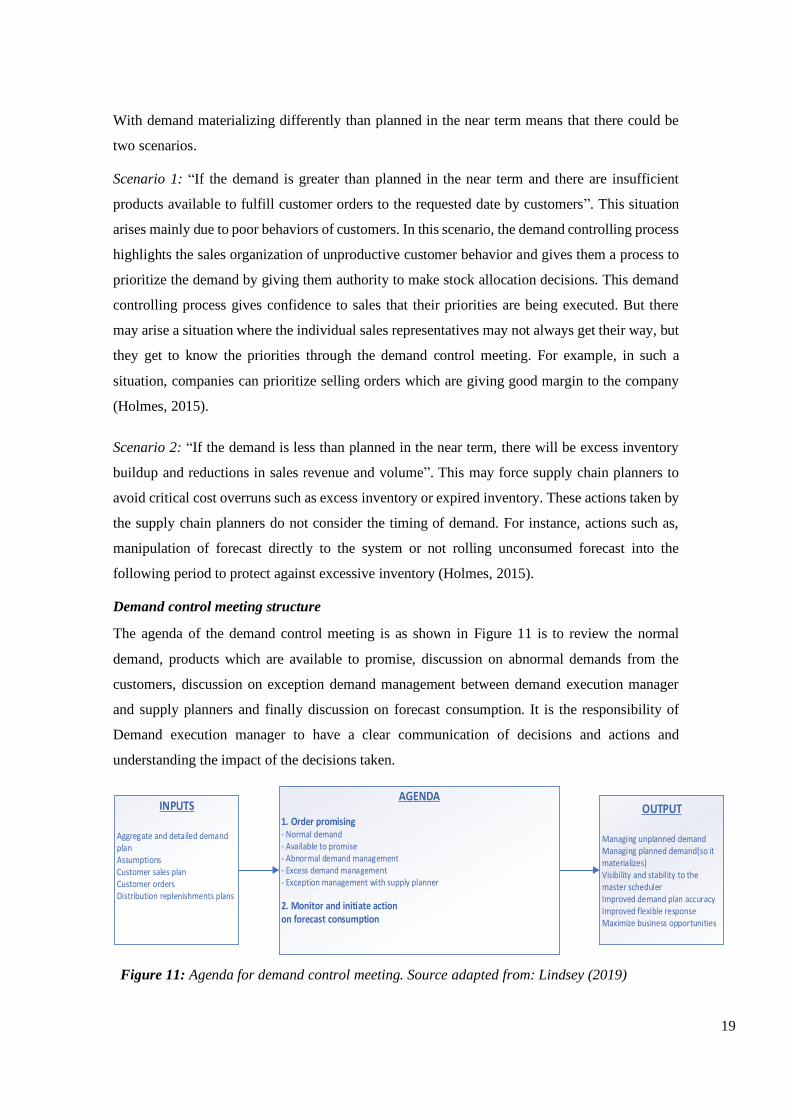
Demand control meeting structure
The agenda of the demand control meeting is as shown in Figure 11 is to review the normal
demand, products which are available to promise, discussion on abnormal demands from the
customers, discussion on exception demand management between demand execution manager
and supply planners and finally discussion on forecast consumption. It is the responsibility of
Demand execution manager to have a clear communication of decisions and actions and
understanding the impact of the decisions taken.
AGENDA
1. Order promising- Normal demand- Available to promise- Abnormal demand management- Excess demand management- Exception management with supply planner
2. Monitor and initiate action on forecast consumption
OUTPUT
Managing unplanned demandManaging planned demand(so it materializes)Visibility and stability to the master schedulerImproved demand plan accuracyImproved flexible responseMaximize business opportunities
INPUTS
Aggregate and detailed demand planAssumptionsCustomer sales planCustomer ordersDistribution replenishments plans
Figure 11: Agenda for demand control meeting. Source adapted from: Lindsey (2019)
20
The inputs for the S&OE process are aggregate and detailed plans, assumptions made, customer
sales plan, customer orders, distribution replenishment plans brought by different stakeholders.
The stakeholders involved are sales manager/director, supply planning manager, demand
planning manager, customer service manager and others depending on organization, for example,
transport manager, warehouse manager, etcetera (Lindsey, 2019). The output of these demand
control process would be mainly to increase the demand plan accuracy and management of
unplanned and planned demand. In addition to that, there is an increase in visibility and stability
to the master scheduler and since all sales and marketing representatives participate in the weekly
meetings, this enables better integration between sales and supply organization, ultimately,
maximizing the business opportunities (Lindsey, 2019).
2.6 Carvalho’s proposed model
Carvalho (2018) performs a literature review along with case studies of four companies with a
goal to formalize the S&OE process. These case studies were conducted across different
industries that identifies the main characteristics of S&OE process i.e. differences in S&OP, gains
obtained with the implementation of S&OE and determining greater challenges of the S&OE
process. Among these case studies conducted, the first is a pilot case study in the energy industry.
The remaining case studies are conducted in the ceramic tiles industry, footwear and cosmetics.
The intention to use Carvalho (2018) model of S&OE is due to the reliability of data that Carvalho
(2018) presents based on the cross-case analysis of four companies from various industries which
also provides detailed characteristics on each domain of the S&OE model of Pukkila (2016).
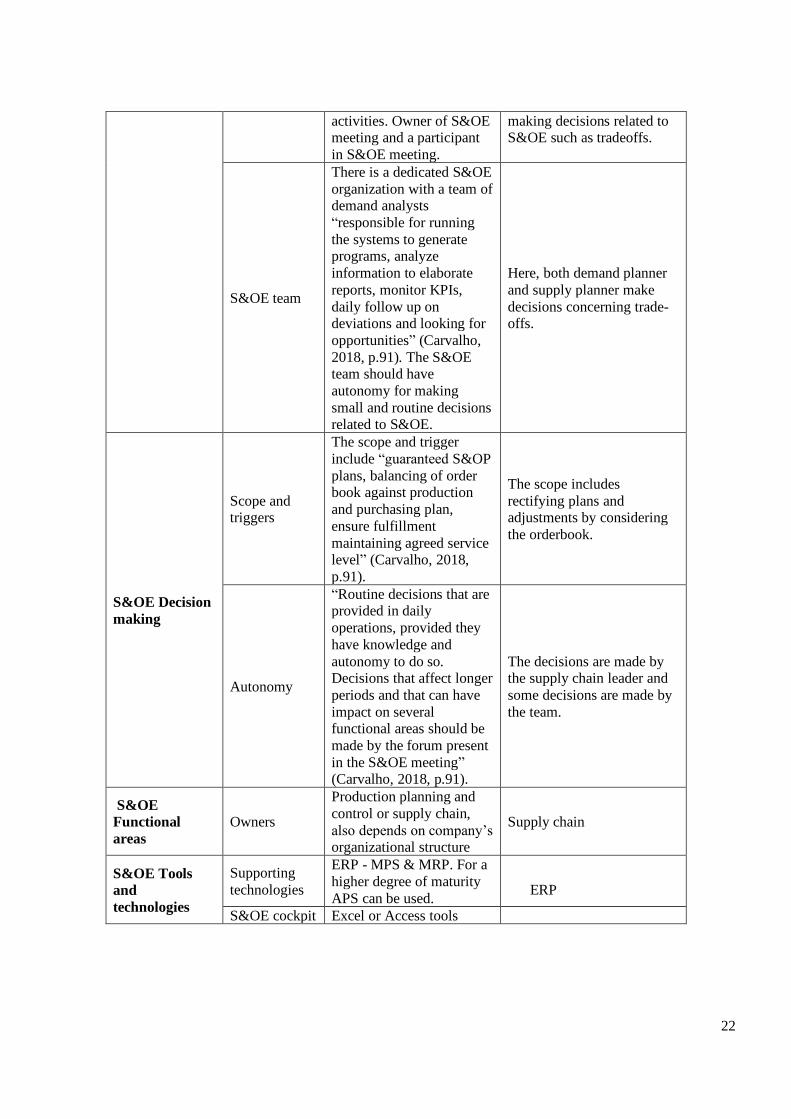
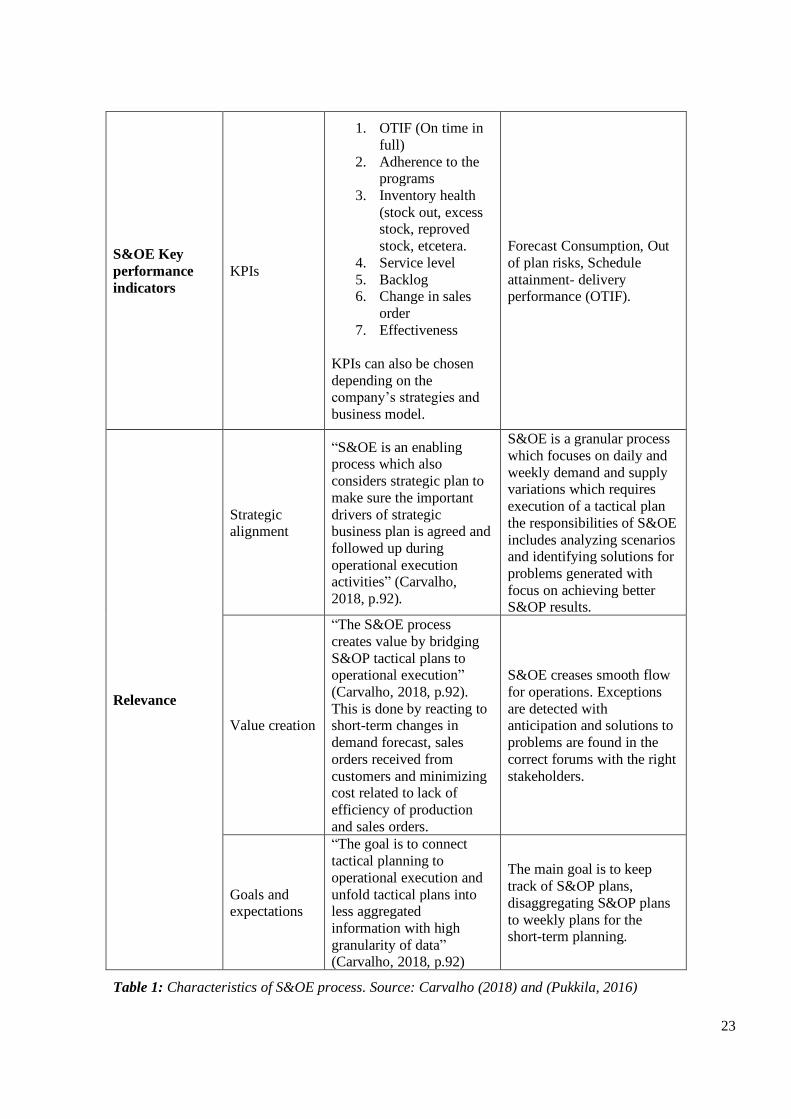
As seen in the Table 1, based on Carvalho (2018) S&OE model, the S&OE process is conducted
over a 3 months horizon with a weekly planning bucket that focuses on SKU level for critical
products and one level higher for non-critical products. By segregating the items based on its
criticality it enables S&OE participants to respond quickly and provide decisions for items that
undergo abnormal demand. For the S&OE process it is important that an S&OE team is created.
The S&OE team consists of managers or coordinators who are from the areas of production,
inventory, logistics, sales, supply chain, marketing, and IT. These participants are responsible for
analyzing data to elaborate on reports, monitor KPIs and follow up daily on deviations and look
for opportunities related to abnormal demand. The meetings are initiated by an S&OE leader who
could be a manager or coordinator, but the leader should have the mindset of aligning the activities
of the S&OE process to the S&OP plan. This way, by performing activities on the shorter horizon
it contributes to aligning the strategic goal of the S&OP process. The S&OE leader should possess
characteristics of being unbiased and think of the company in order to make decisions regarding

21
trade-offs. This leader is also a primary participant of the S&OP process and hence should be able
to assess the best scenario for the company with a systematic vision for a longer horizon.
The scope of the S&OE process is to promise on executing the S&OP plans, synchronizing the
customer demand from the order book with production and purchasing plans and promise on
sustaining or increasing the agreed service level for customers. Decisions that are made in daily
operations should be done by the S&OE team who have full knowledge of the company and the
autonomy to do so. Decisions pertaining to longer horizons which can affect other functional
departments or even involve tradeoffs should be only done through the forum present in weekly
S&OE meetings.
The most important technologies which facilitate the S&OE process is the ERP, with MPS and
MRP functionalities. By using information from the ERP system, it is possible to monitor and
operationalize the S&OE with an order fulfillment logic which later can be used to manage the
deviations in customer orders. If the company possesses a higher maturity in terms of technologies
used in their business process the advanced planning system can also support the S&OE process.
In addition, an efficient tool can also be the S&OE cockpit where participants can follow-up on
KPIs and monitor products daily on SKU level.
Carvalho (2018, p.91) mentions that KPIs in the “S&OE process are mostly related to service
level, order fulfillment and balance between supply and demand” i.e. production and order
book. Hence, the most common KPIs in this process is OTIF (order fulfillment), “adherence to
the programs including production, distribution and purchasing, Inventory health i.e. stock out,
excess stock, reproved stock. Service level, backlog” and change in customer orders. Overall,
the S&OE process generates value by making the S&OP plans tangible by reacting to changes
that occur in the short-term which occurs in the demand forecasts, sales orders and reducing the
inefficiencies related to rescheduling the production and sales orders. Table 1 below presents the
S&OE characteristics discussed by Carvalho (2018) proposed S&OE model.
Domains Main aspects Carvalho (2018) Gartner Webinar
Process model
Horizon 3 months 3 months
Bucket Weekly Weekly
Product
segregation
level
SKU (Stock keeping units)
level for critical products, subfamily for non-critical
products.
SKU
Meeting
frequency Once a week Once a week
S&OE process
roles and
responsibilities
S&OE leader
An individual who is
facilitator and responsible
for coordination of S&OE
A leader from Supply Chain
who is responsible for
22
activities. Owner of S&OE meeting and a participant
in S&OE meeting.
making decisions related to S&OE such as tradeoffs.
S&OE team
There is a dedicated S&OE
organization with a team of demand analysts
“responsible for running
the systems to generate programs, analyze
information to elaborate
reports, monitor KPIs,
daily follow up on deviations and looking for
opportunities” (Carvalho,
2018, p.91). The S&OE team should have
autonomy for making
small and routine decisions related to S&OE.
Here, both demand planner
and supply planner make
decisions concerning trade-offs.
S&OE Decision
making
Scope and triggers
The scope and trigger
include “guaranteed S&OP
plans, balancing of order book against production
and purchasing plan,
ensure fulfillment
maintaining agreed service level” (Carvalho, 2018,
p.91).
The scope includes
rectifying plans and adjustments by considering
the orderbook.
Autonomy
“Routine decisions that are provided in daily
operations, provided they
have knowledge and
autonomy to do so. Decisions that affect longer
periods and that can have
impact on several functional areas should be
made by the forum present
in the S&OE meeting” (Carvalho, 2018, p.91).
The decisions are made by the supply chain leader and
some decisions are made by
the team.
S&OE
Functional
areas
Owners
Production planning and
control or supply chain,
also depends on company’s organizational structure
Supply chain
S&OE Tools
and
technologies
Supporting
technologies
ERP - MPS & MRP. For a
higher degree of maturity
APS can be used.
ERP
S&OE cockpit Excel or Access tools
23
S&OE Key
performance
indicators
KPIs
1. OTIF (On time in
full)
2. Adherence to the programs
3. Inventory health
(stock out, excess stock, reproved
stock, etcetera.
4. Service level
5. Backlog 6. Change in sales
order
7. Effectiveness
KPIs can also be chosen
depending on the company’s strategies and
business model.
Forecast Consumption, Out
of plan risks, Schedule
attainment- delivery performance (OTIF).
Relevance
Strategic alignment
“S&OE is an enabling process which also
considers strategic plan to
make sure the important
drivers of strategic business plan is agreed and
followed up during
operational execution activities” (Carvalho,
2018, p.92).
S&OE is a granular process
which focuses on daily and
weekly demand and supply variations which requires
execution of a tactical plan
the responsibilities of S&OE
includes analyzing scenarios and identifying solutions for
problems generated with
focus on achieving better S&OP results.
Value creation
“The S&OE process
creates value by bridging
S&OP tactical plans to operational execution”
(Carvalho, 2018, p.92).
This is done by reacting to short-term changes in
demand forecast, sales
orders received from
customers and minimizing cost related to lack of
efficiency of production
and sales orders.
S&OE creases smooth flow
for operations. Exceptions
are detected with anticipation and solutions to
problems are found in the
correct forums with the right
stakeholders.
Goals and expectations
“The goal is to connect
tactical planning to
operational execution and
unfold tactical plans into less aggregated
information with high
granularity of data” (Carvalho, 2018, p.92)
The main goal is to keep
track of S&OP plans,
disaggregating S&OP plans
to weekly plans for the short-term planning.
Table 1: Characteristics of S&OE process. Source: Carvalho (2018) and (Pukkila, 2016)
24
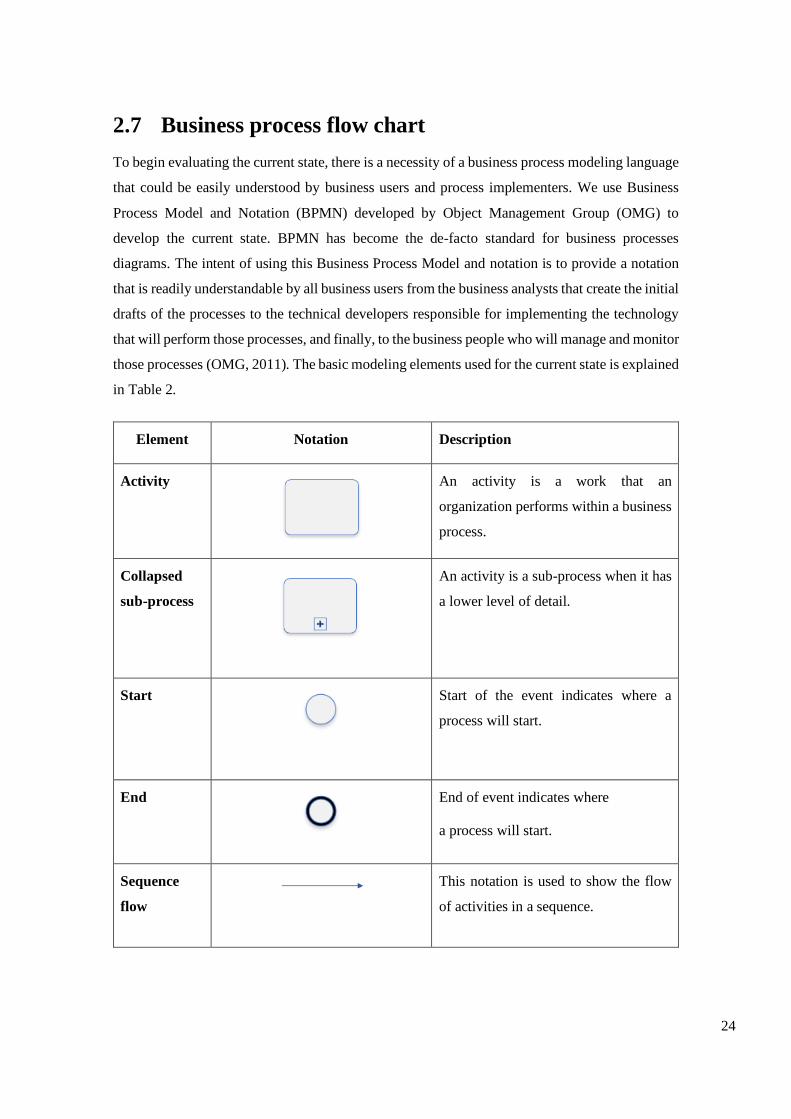
2.7 Business process flow chart
To begin evaluating the current state, there is a necessity of a business process modeling language
that could be easily understood by business users and process implementers. We use Business
Process Model and Notation (BPMN) developed by Object Management Group (OMG) to
develop the current state. BPMN has become the de-facto standard for business processes
diagrams. The intent of using this Business Process Model and notation is to provide a notation
that is readily understandable by all business users from the business analysts that create the initial
drafts of the processes to the technical developers responsible for implementing the technology
that will perform those processes, and finally, to the business people who will manage and monitor
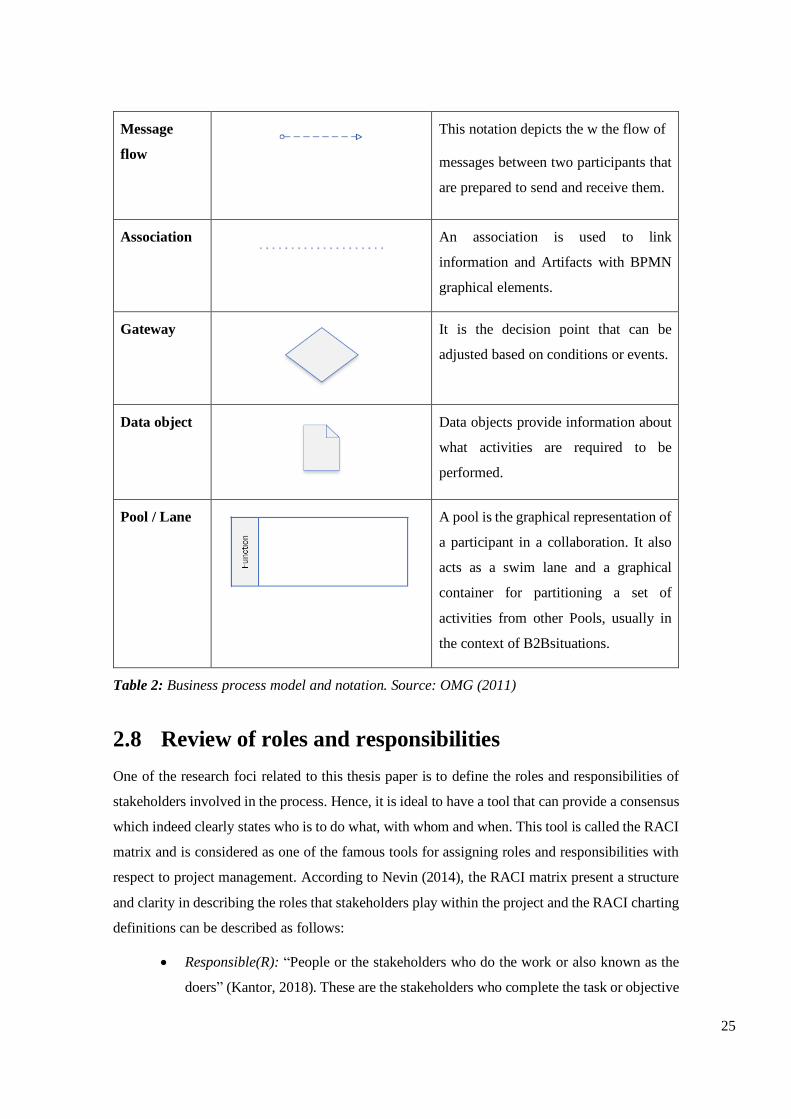
those processes (OMG, 2011). The basic modeling elements used for the current state is explained
in Table 2.
Element Notation Description
Activity
An activity is a work that an
organization performs within a business
process.
Collapsed
sub-process
An activity is a sub-process when it has
a lower level of detail.
Start
Start of the event indicates where a
process will start.
End
End of event indicates where
a process will start.
Sequence
flow
This notation is used to show the flow
of activities in a sequence.
25
Message
flow
This notation depicts the w the flow of
messages between two participants that
are prepared to send and receive them.
Association
An association is used to link
information and Artifacts with BPMN
graphical elements.
Gateway
It is the decision point that can be
adjusted based on conditions or events.
Data object
Data objects provide information about
what activities are required to be
performed.
Pool / Lane
A pool is the graphical representation of
a participant in a collaboration. It also
acts as a swim lane and a graphical
container for partitioning a set of
activities from other Pools, usually in
the context of B2Bsituations.
Table 2: Business process model and notation. Source: OMG (2011)
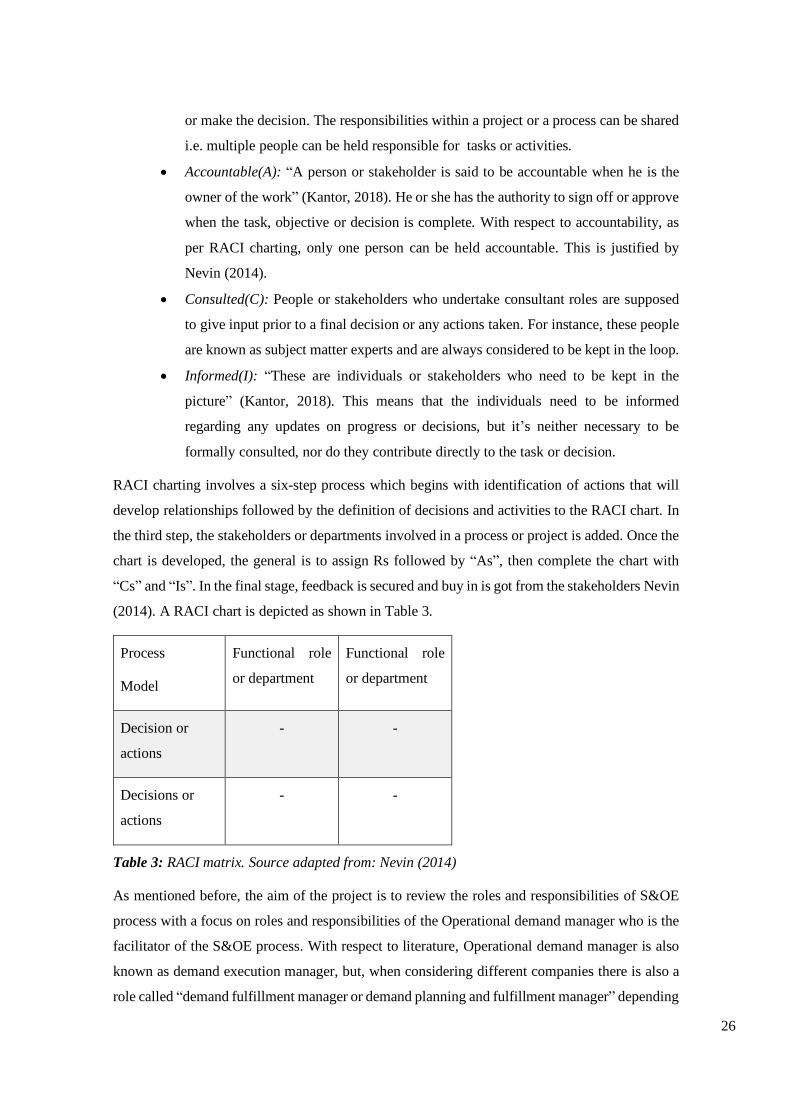
2.8 Review of roles and responsibilities
One of the research foci related to this thesis paper is to define the roles and responsibilities of
stakeholders involved in the process. Hence, it is ideal to have a tool that can provide a consensus
which indeed clearly states who is to do what, with whom and when. This tool is called the RACI
matrix and is considered as one of the famous tools for assigning roles and responsibilities with
respect to project management. According to Nevin (2014), the RACI matrix present a structure
and clarity in describing the roles that stakeholders play within the project and the RACI charting
definitions can be described as follows:
• Responsible(R): “People or the stakeholders who do the work or also known as the
doers” (Kantor, 2018). These are the stakeholders who complete the task or objective
26
or make the decision. The responsibilities within a project or a process can be shared
i.e. multiple people can be held responsible for tasks or activities.
• Accountable(A): “A person or stakeholder is said to be accountable when he is the
owner of the work” (Kantor, 2018). He or she has the authority to sign off or approve
when the task, objective or decision is complete. With respect to accountability, as
per RACI charting, only one person can be held accountable. This is justified by
Nevin (2014).
• Consulted(C): People or stakeholders who undertake consultant roles are supposed
to give input prior to a final decision or any actions taken. For instance, these people
are known as subject matter experts and are always considered to be kept in the loop.
• Informed(I): “These are individuals or stakeholders who need to be kept in the
picture” (Kantor, 2018). This means that the individuals need to be informed
regarding any updates on progress or decisions, but it’s neither necessary to be
formally consulted, nor do they contribute directly to the task or decision.
RACI charting involves a six-step process which begins with identification of actions that will
develop relationships followed by the definition of decisions and activities to the RACI chart. In
the third step, the stakeholders or departments involved in a process or project is added. Once the
chart is developed, the general is to assign Rs followed by “As”, then complete the chart with
“Cs” and “Is”. In the final stage, feedback is secured and buy in is got from the stakeholders Nevin
(2014). A RACI chart is depicted as shown in Table 3.
Process
Model
Functional role
or department
Functional role
or department
Decision or
actions
- -
Decisions or
actions
- -
Table 3: RACI matrix. Source adapted from: Nevin (2014)
As mentioned before, the aim of the project is to review the roles and responsibilities of S&OE
process with a focus on roles and responsibilities of the Operational demand manager who is the
facilitator of the S&OE process. With respect to literature, Operational demand manager is also
known as demand execution manager, but, when considering different companies there is also a
role called “demand fulfillment manager or demand planning and fulfillment manager” depending
27
on those companies. According to Lindsey(2019) and Holmes(2015), the demand execution
manager should be the facilitator of the demand controlling process ensuring sales participation
and prioritization in decision making and he/she is also responsible for monitoring the customer
orders against the demand plan in the short-term horizon and is the owner of the process. Demand
execution manager should be a trusted person by the functional leaders in sales, marketing,
demand planning and supply chain planning (Lindsey, 2019). Holmes (2015) & Lindsey (2019
lists out 5 main elements with respect to the roles and responsibilities of demand execution
manager:
• Order management- Analyze the historical database with customer orders received
and give feedback on abnormal demands.
• Management when demand is greater than supply i.e. aids sales in prioritization of
demand.
• Management when demand is less than planned i.e. alerting the sales when demand
is less than planned.
• Facilitate decision making when demand materializes than planned.
• He/she should have a detailed understanding of the agreed plan in ERP and should
monitor the actual demand on a daily basis.
• Identifying and managing the abnormal demand and is responsible for forecast roll
and tactical maintenance of forecast. Demand execution manager also should be
aware of supply interface failures and alert the necessary stakeholders about this.
2.9 Maturity model
Maturity models is a widely accepted technique for assessing the business process or some aspects
of the organization as it provides a path for improvement in an increasingly systematic and
organized way. According to De Bruin et al. (2005) the application of maturity model is to use on
the basis evaluation and comparison for the improvement of the business process. This feature of
maturity model enables to derive an informed approach to increase the capability of a selected
domain within an organization. To begin with the selection of maturity models, Van Looy et al.
(2013) questionnaire was used to identify the maturity model based on the criteria set by us. The
most important criteria set by us were to develop a maturity model based on basic capability,
explicit prescriptive, supply chain domain specific, collection of qualitative data and inclusion of
internal respondents for the maturity model. Based on these criteria assessment and decision
tables from Van Looy et al. (2013), it was understood to apply Global SC maturity framework by
Aberdeen Group with current requirements set by the us. In this maturity model, the categories

28
used were process, organization, resource effectiveness, IT architecture, decision making, and
collaboration. But it was ideal to use a framework which combines both Aberdeen framework
approach and Lapide (2005) framework called Grimson & Pyke (2007) because this model
stresses on the great potential of profit optimization. Hence, Grimson & Pyke (2007) is considered
for the development of S&OE maturity model. Further reasoning as to how Grimson & Pyke
(2007) model is adapted is explained in “Analysis and discussion” section of the report.
2.9.1 S&OP maturity model
Grimson and Pyke (2007) develop a S&OP maturity model with the aim of evaluating a
company’s current level of S&OP integration, which is also useful from a perspective of
recommending a firm to progress to the next stage of maturity in S&OP integration. Figure 12
represents the Grimson and Pyke (2007) S&OP maturity model.
Figure 12: S&OP Maturity model. Source: Grimson and Pyke (2007)
This model includes five dimensions which is both business and information process. It is set
across a 5-stage ranking wherein the first stage is classified as a company having no S&OP
practices which is the lowest level of maturity till the 5th stage which is classified as a proactive
stage i.e. highest level of maturity. It is important to note that the Lapide (2005) model is used as
a reference to construct this model. Therefore, Bagni & Marçola (2019) state that the main
difference between these two models is the introduction of two new dimensions which is
“organization” and “performance indicators”. Bagni & Marçola (2019) briefly describe the S&OP
model developed by Grimson and Pyke (2007) as described below:
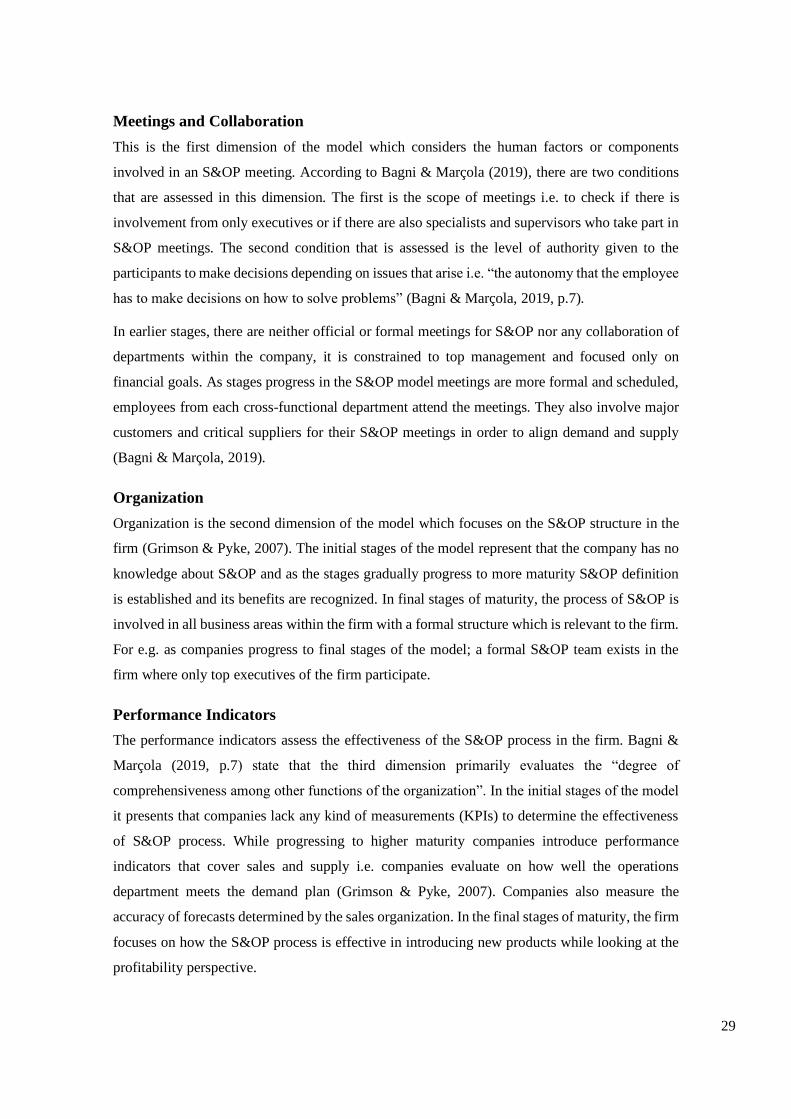
29
Meetings and Collaboration
This is the first dimension of the model which considers the human factors or components
involved in an S&OP meeting. According to Bagni & Marçola (2019), there are two conditions
that are assessed in this dimension. The first is the scope of meetings i.e. to check if there is
involvement from only executives or if there are also specialists and supervisors who take part in
S&OP meetings. The second condition that is assessed is the level of authority given to the
participants to make decisions depending on issues that arise i.e. “the autonomy that the employee
has to make decisions on how to solve problems” (Bagni & Marçola, 2019, p.7).
In earlier stages, there are neither official or formal meetings for S&OP nor any collaboration of
departments within the company, it is constrained to top management and focused only on
financial goals. As stages progress in the S&OP model meetings are more formal and scheduled,
employees from each cross-functional department attend the meetings. They also involve major
customers and critical suppliers for their S&OP meetings in order to align demand and supply
(Bagni & Marçola, 2019).
Organization
Organization is the second dimension of the model which focuses on the S&OP structure in the
firm (Grimson & Pyke, 2007). The initial stages of the model represent that the company has no
knowledge about S&OP and as the stages gradually progress to more maturity S&OP definition
is established and its benefits are recognized. In final stages of maturity, the process of S&OP is
involved in all business areas within the firm with a formal structure which is relevant to the firm.
For e.g. as companies progress to final stages of the model; a formal S&OP team exists in the
firm where only top executives of the firm participate.
Performance Indicators
The performance indicators assess the effectiveness of the S&OP process in the firm. Bagni &
Marçola (2019, p.7) state that the third dimension primarily evaluates the “degree of
comprehensiveness among other functions of the organization”. In the initial stages of the model
it presents that companies lack any kind of measurements (KPIs) to determine the effectiveness
of S&OP process. While progressing to higher maturity companies introduce performance
indicators that cover sales and supply i.e. companies evaluate on how well the operations
department meets the demand plan (Grimson & Pyke, 2007). Companies also measure the
accuracy of forecasts determined by the sales organization. In the final stages of maturity, the firm
focuses on how the S&OP process is effective in introducing new products while looking at the
profitability perspective.
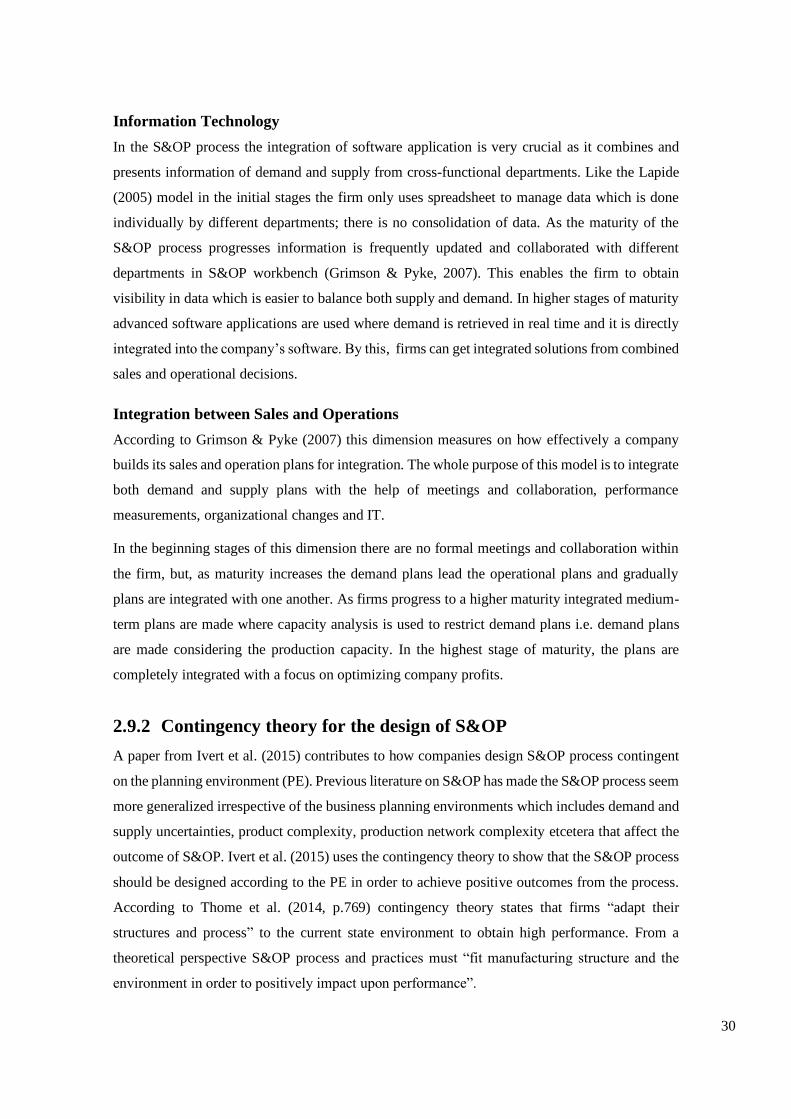
30
Information Technology
In the S&OP process the integration of software application is very crucial as it combines and
presents information of demand and supply from cross-functional departments. Like the Lapide
(2005) model in the initial stages the firm only uses spreadsheet to manage data which is done
individually by different departments; there is no consolidation of data. As the maturity of the
S&OP process progresses information is frequently updated and collaborated with different
departments in S&OP workbench (Grimson & Pyke, 2007). This enables the firm to obtain
visibility in data which is easier to balance both supply and demand. In higher stages of maturity
advanced software applications are used where demand is retrieved in real time and it is directly
integrated into the company’s software. By this, firms can get integrated solutions from combined
sales and operational decisions.
Integration between Sales and Operations
According to Grimson & Pyke (2007) this dimension measures on how effectively a company
builds its sales and operation plans for integration. The whole purpose of this model is to integrate
both demand and supply plans with the help of meetings and collaboration, performance
measurements, organizational changes and IT.
In the beginning stages of this dimension there are no formal meetings and collaboration within
the firm, but, as maturity increases the demand plans lead the operational plans and gradually
plans are integrated with one another. As firms progress to a higher maturity integrated medium-
term plans are made where capacity analysis is used to restrict demand plans i.e. demand plans
are made considering the production capacity. In the highest stage of maturity, the plans are
completely integrated with a focus on optimizing company profits.
2.9.2 Contingency theory for the design of S&OP
A paper from Ivert et al. (2015) contributes to how companies design S&OP process contingent
on the planning environment (PE). Previous literature on S&OP has made the S&OP process seem
more generalized irrespective of the business planning environments which includes demand and
supply uncertainties, product complexity, production network complexity etcetera that affect the
outcome of S&OP. Ivert et al. (2015) uses the contingency theory to show that the S&OP process
should be designed according to the PE in order to achieve positive outcomes from the process.
According to Thome et al. (2014, p.769) contingency theory states that firms “adapt their
structures and process” to the current state environment to obtain high performance. From a
theoretical perspective S&OP process and practices must “fit manufacturing structure and the
environment in order to positively impact upon performance”.
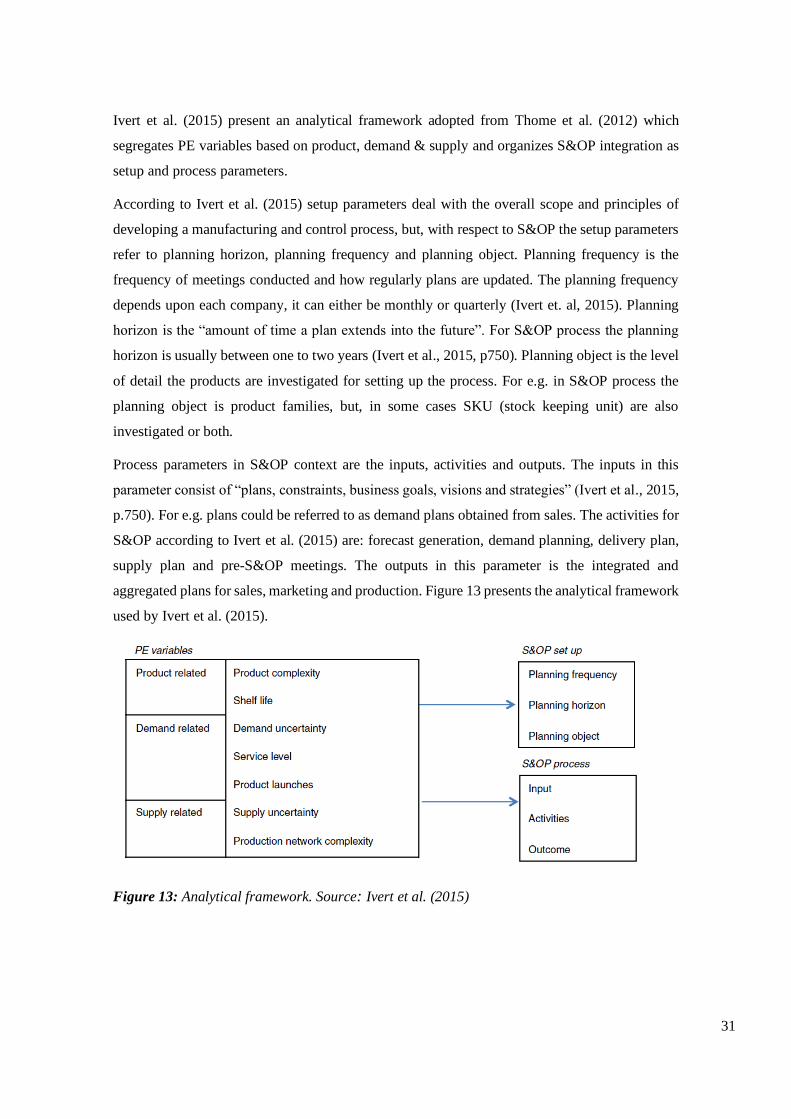
31
Ivert et al. (2015) present an analytical framework adopted from Thome et al. (2012) which
segregates PE variables based on product, demand & supply and organizes S&OP integration as
setup and process parameters.
According to Ivert et al. (2015) setup parameters deal with the overall scope and principles of
developing a manufacturing and control process, but, with respect to S&OP the setup parameters
refer to planning horizon, planning frequency and planning object. Planning frequency is the
frequency of meetings conducted and how regularly plans are updated. The planning frequency
depends upon each company, it can either be monthly or quarterly (Ivert et. al, 2015). Planning
horizon is the “amount of time a plan extends into the future”. For S&OP process the planning
horizon is usually between one to two years (Ivert et al., 2015, p750). Planning object is the level
of detail the products are investigated for setting up the process. For e.g. in S&OP process the
planning object is product families, but, in some cases SKU (stock keeping unit) are also
investigated or both.
Process parameters in S&OP context are the inputs, activities and outputs. The inputs in this
parameter consist of “plans, constraints, business goals, visions and strategies” (Ivert et al., 2015,
p.750). For e.g. plans could be referred to as demand plans obtained from sales. The activities for
S&OP according to Ivert et al. (2015) are: forecast generation, demand planning, delivery plan,
supply plan and pre-S&OP meetings. The outputs in this parameter is the integrated and
aggregated plans for sales, marketing and production. Figure 13 presents the analytical framework
used by Ivert et al. (2015).
Figure 13: Analytical framework. Source: Ivert et al. (2015)
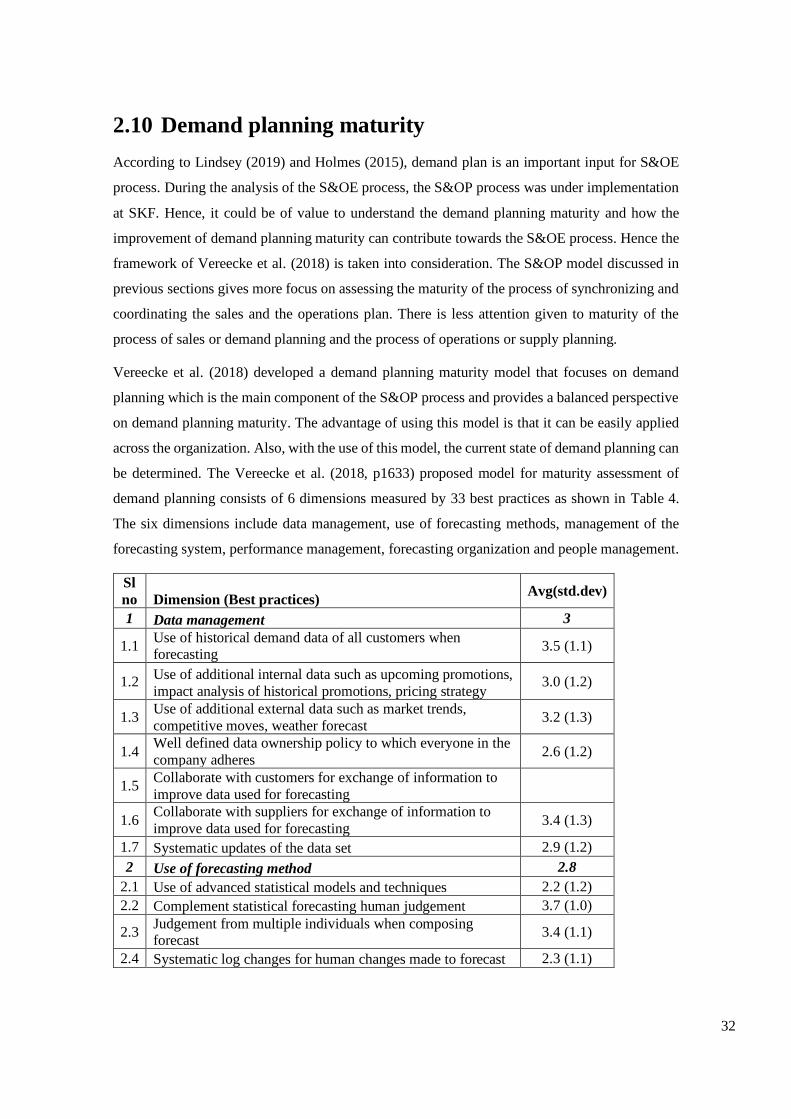
32
2.10 Demand planning maturity
According to Lindsey (2019) and Holmes (2015), demand plan is an important input for S&OE
process. During the analysis of the S&OE process, the S&OP process was under implementation
at SKF. Hence, it could be of value to understand the demand planning maturity and how the
improvement of demand planning maturity can contribute towards the S&OE process. Hence the
framework of Vereecke et al. (2018) is taken into consideration. The S&OP model discussed in
previous sections gives more focus on assessing the maturity of the process of synchronizing and
coordinating the sales and the operations plan. There is less attention given to maturity of the
process of sales or demand planning and the process of operations or supply planning.
Vereecke et al. (2018) developed a demand planning maturity model that focuses on demand
planning which is the main component of the S&OP process and provides a balanced perspective
on demand planning maturity. The advantage of using this model is that it can be easily applied
across the organization. Also, with the use of this model, the current state of demand planning can
be determined. The Vereecke et al. (2018, p1633) proposed model for maturity assessment of
demand planning consists of 6 dimensions measured by 33 best practices as shown in Table 4.
The six dimensions include data management, use of forecasting methods, management of the
forecasting system, performance management, forecasting organization and people management.
Sl
no Dimension (Best practices) Avg(std.dev)
1 Data management 3
1.1 Use of historical demand data of all customers when forecasting
3.5 (1.1)
1.2 Use of additional internal data such as upcoming promotions,
impact analysis of historical promotions, pricing strategy 3.0 (1.2)
1.3 Use of additional external data such as market trends,
competitive moves, weather forecast 3.2 (1.3)
1.4 Well defined data ownership policy to which everyone in the
company adheres 2.6 (1.2)
1.5 Collaborate with customers for exchange of information to
improve data used for forecasting
1.6 Collaborate with suppliers for exchange of information to
improve data used for forecasting 3.4 (1.3)
1.7 Systematic updates of the data set 2.9 (1.2)
2 Use of forecasting method 2.8
2.1 Use of advanced statistical models and techniques 2.2 (1.2)
2.2 Complement statistical forecasting human judgement 3.7 (1.0)
2.3 Judgement from multiple individuals when composing forecast
3.4 (1.1)
2.4 Systematic log changes for human changes made to forecast 2.3 (1.1)
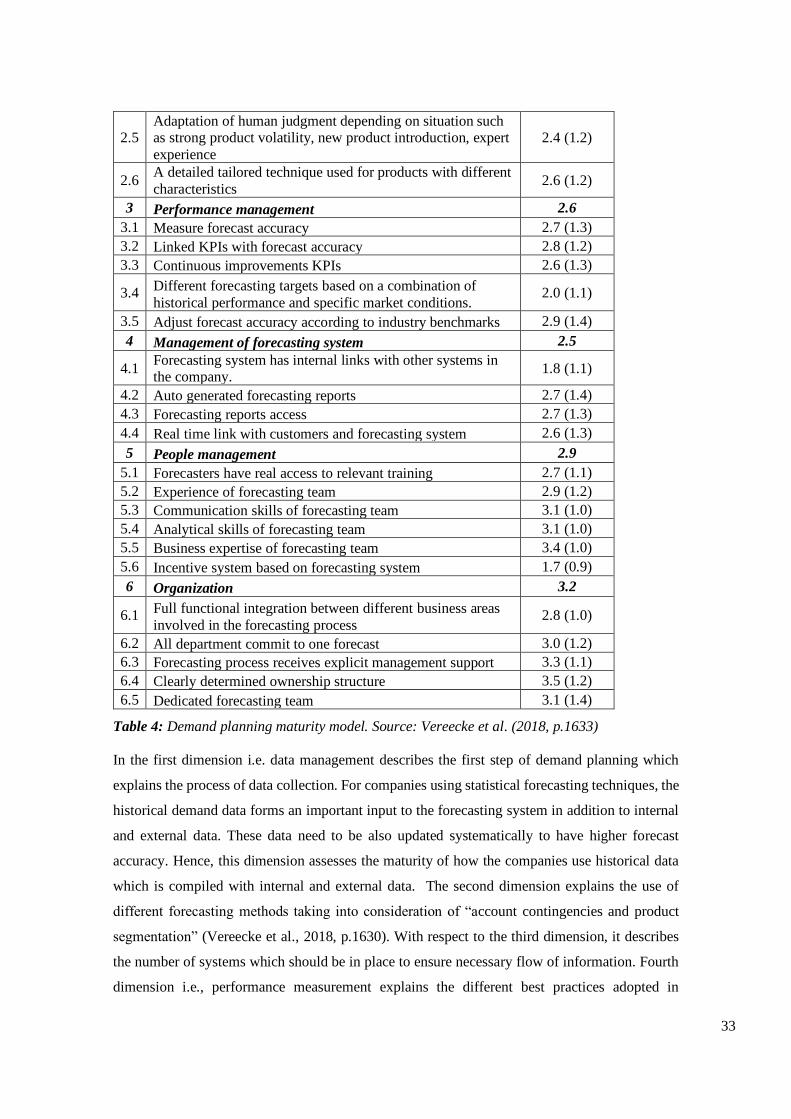
33
2.5 Adaptation of human judgment depending on situation such as strong product volatility, new product introduction, expert
experience
2.4 (1.2)
2.6 A detailed tailored technique used for products with different
characteristics 2.6 (1.2)
3 Performance management 2.6
3.1 Measure forecast accuracy 2.7 (1.3)
3.2 Linked KPIs with forecast accuracy 2.8 (1.2)
3.3 Continuous improvements KPIs 2.6 (1.3)
3.4 Different forecasting targets based on a combination of
historical performance and specific market conditions. 2.0 (1.1)
3.5 Adjust forecast accuracy according to industry benchmarks 2.9 (1.4)
4 Management of forecasting system 2.5
4.1 Forecasting system has internal links with other systems in the company.
1.8 (1.1)
4.2 Auto generated forecasting reports 2.7 (1.4)
4.3 Forecasting reports access 2.7 (1.3)
4.4 Real time link with customers and forecasting system 2.6 (1.3)
5 People management 2.9
5.1 Forecasters have real access to relevant training 2.7 (1.1)
5.2 Experience of forecasting team 2.9 (1.2)
5.3 Communication skills of forecasting team 3.1 (1.0)
5.4 Analytical skills of forecasting team 3.1 (1.0)
5.5 Business expertise of forecasting team 3.4 (1.0)
5.6 Incentive system based on forecasting system 1.7 (0.9)
6 Organization 3.2
6.1 Full functional integration between different business areas
involved in the forecasting process 2.8 (1.0)
6.2 All department commit to one forecast 3.0 (1.2)
6.3 Forecasting process receives explicit management support 3.3 (1.1)
6.4 Clearly determined ownership structure 3.5 (1.2)
6.5 Dedicated forecasting team 3.1 (1.4)
Table 4: Demand planning maturity model. Source: Vereecke et al. (2018, p.1633)
In the first dimension i.e. data management describes the first step of demand planning which
explains the process of data collection. For companies using statistical forecasting techniques, the
historical demand data forms an important input to the forecasting system in addition to internal
and external data. These data need to be also updated systematically to have higher forecast
accuracy. Hence, this dimension assesses the maturity of how the companies use historical data
which is compiled with internal and external data. The second dimension explains the use of
different forecasting methods taking into consideration of “account contingencies and product
segmentation” (Vereecke et al., 2018, p.1630). With respect to the third dimension, it describes
the number of systems which should be in place to ensure necessary flow of information. Fourth
dimension i.e., performance measurement explains the different best practices adopted in
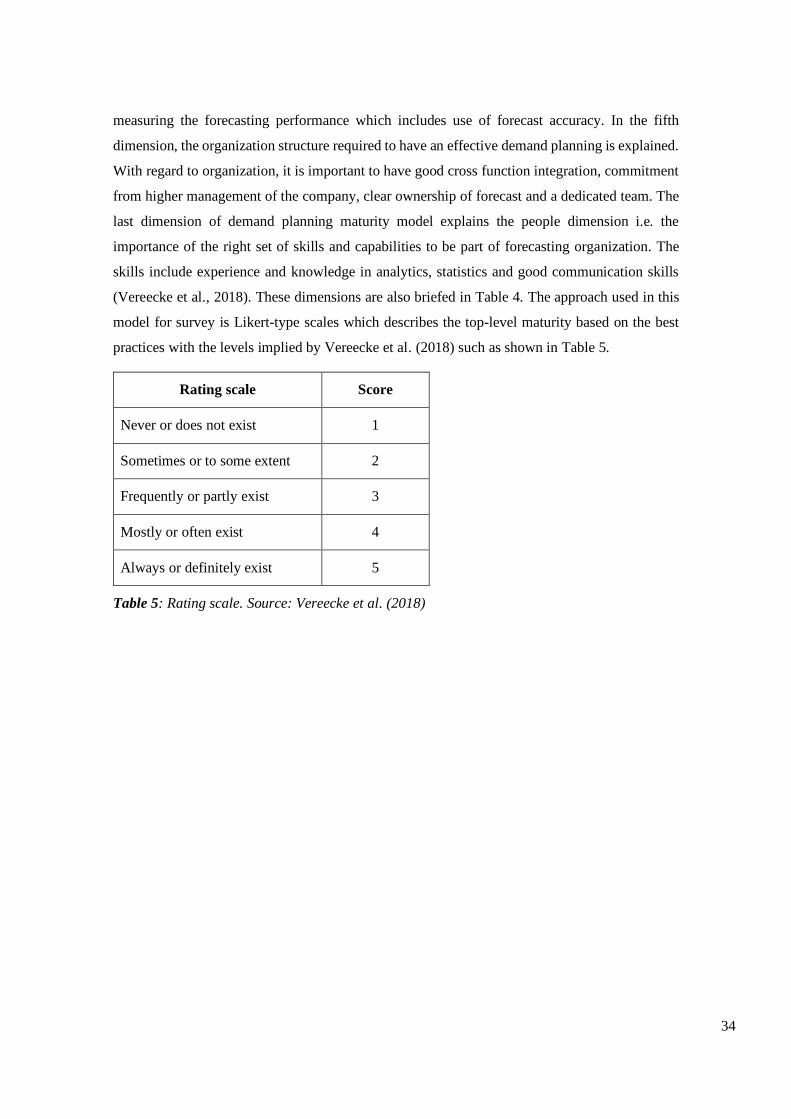
34
measuring the forecasting performance which includes use of forecast accuracy. In the fifth
dimension, the organization structure required to have an effective demand planning is explained.
With regard to organization, it is important to have good cross function integration, commitment
from higher management of the company, clear ownership of forecast and a dedicated team. The
last dimension of demand planning maturity model explains the people dimension i.e. the
importance of the right set of skills and capabilities to be part of forecasting organization. The
skills include experience and knowledge in analytics, statistics and good communication skills
(Vereecke et al., 2018). These dimensions are also briefed in Table 4. The approach used in this
model for survey is Likert-type scales which describes the top-level maturity based on the best
practices with the levels implied by Vereecke et al. (2018) such as shown in Table 5.
Rating scale Score
Never or does not exist 1
Sometimes or to some extent 2
Frequently or partly exist 3
Mostly or often exist 4
Always or definitely exist 5
Table 5: Rating scale. Source: Vereecke et al. (2018)

35
3 Methodology
This section describes the methodology adopted when conducting the thesis and it consists of
research method, data collection methods, and model of analysis used for research questions and
finally the research quality criteria which includes reliability and validity of the research.
3.2 Research approach
Sales and operations execution is a relatively new concept compared to S&OP and the amount of
academic work that exists on this topic is very limited. Hence, there was a need for a method
which is used by researchers to develop new knowledge. When looking at the working of
abductive research approach, “it also works through interpreting an individual phenomenon
within a contextual framework and tries to understand a concept in a new way, from the
perspective of a new conceptual framework” (Kovacs & Spens, 2005, p.138). Therefore, the
approach adopted for this thesis is the abduction research approach which is illustrated as shown
in Figure 14. With respect to this thesis, an abduction approach is used for all the research
questions which will be explained in later sections.
Figure 14: Abductive research approach: Source adapted from: Kovacs & Spens (2005)
3.2.1 Primary data
The primary data is an original data source which is collected by the researcher for the first time.
There are different ways in which primary data can be collected, but, out of these, the most popular
and important ones are observations, interviews, schedules, case studies, self-administered
surveys and questionnaires, etcetera (Kothari, 2004).
36
Observations
The observation method is a type of data collection method where the knowledge of the
researched topic is gathered by making observations of things around the topic. This sort of
method can be considered as a scientific tool when observation contributes to a formulated
research purpose and is well planned and recorded. There are several advantages to observation
method i.e. with the help of observation method, the information is looked for by the researcher
without asking any of the respondents which indeed explains the independence of this method
with respect to the willingness of the respondent to respond. Secondly, the observation method
eliminated the subjective bias (Kothari, 2004).
In this thesis, observation method was deployed to understand the S&OE process for the SKF’s
industrial market. The observations were made from the headquarters in Gothenburg with virtual
conducted S&OE meetings by a specific sales region. The meetings were observed to understand
the aspects which are discussed, the inputs to the S&OE meeting and outputs or decisions taken
with respect to S&OE. In addition to that, observation methods also enabled to get an overview
as to what is being contributed by different stakeholders. The agenda for S&OE meetings did not
have major differences but it was also customized based on the complexities and types of
deviations each sales unit was facing. Lastly, the majority of the meetings were recorded and
analyzed in detail to have a deeper understanding of the meetings which took place and follow-
up questions were asked during the interviews with subject matter experts as explained in the next
section.
Interviews
Interview is one of the commonly used methods for data collection which involves the medium
of communication between two persons (Kothari, 2004). There are several types of interviews
stated in literature such as face to face interviews, telephonic interviews, structured interviews,
semi structured interviews, etcetera. As this research is based on a qualitative study, interview is
an ideal method for data collection.
Semi structured interview is a popular data collection method used because of its versatility,
flexibility, and easiness of data collection. In this method, the interviewer can improvise the
follow-up questions based on interviewee’s response. This also enables the interviewer to gain a
deeper understanding since the question can be adapted based on the response from the
interviewee. But in order to conduct a semi structured interview, there needs to be some level of
research done prior to the interview. Hence the questions need to be formulated before the
interview (Kallio et al., 2016). Another type of interview which was conducted are the
unstructured interviews. It is a type of interview where there is no defined agenda or questions set

37
before the interview, but there are certain topics in mind which the interviewer wishes to cover
during the interview.
Both unstructured and semi-structured interviews were conducted virtually using the
organization’s communication application “Microsoft teams” in order to gather primary data. The
stakeholders with whom these interviews are conducted is listed in Table 6. There are two main
purposes for conducting the unstructured interview. First, the intention was to gather general
information about the company in terms of their organization, their supply chain, the various kinds
of products they manufacture, their customers and their market companies placed globally.
Second, the domain of this study is relatively new, therefore, it was necessary to dig in depth on
the initiation and the implementation of the S&OE process at SKF, hence the unstructured
interview is used to acknowledge the process and workings of the organization. Post the
unstructured interviews, semi-structured interviews were conducted. The purpose of the semi-
structured interview was to ask more specific questions based on the unstructured interview. The
questions asked in the semi-structured interview also included follow-up questions in order to
narrow down the description of answers. Two of the three research questions i.e. research
questions one and two, are primarily constructed based on the information from the unstructured
interview. The third research question was constructed based on the purpose of this thesis. The
questions to the semi-structured interviews are listed in the appendix B.
There was only one unstructured interview conducted face to face with the S&OP owner of SKF.
This is because the interviewee was physically available at the SKF headquarters in Gothenburg,
where this thesis is conducted. This interview was done in order to determine how the S&OP for
the automotive market was mature and S&OP for the industrial market not existing.
At SKF, interviews were conducted with the Global planning and Demand management team
who are responsible for the implementation of the S&OE process. The team were considered as
subject matter experts for the S&OE process who were also consulted for decision making and
they were also part of performance management of S&OE process. The list of interviewees who
participated is shown in the Table 6. The data gathered from the interviews were used to
understand the S&OE process. Among these interviewees, some were interviewed 3-4 times while
others were interviewed more than that.
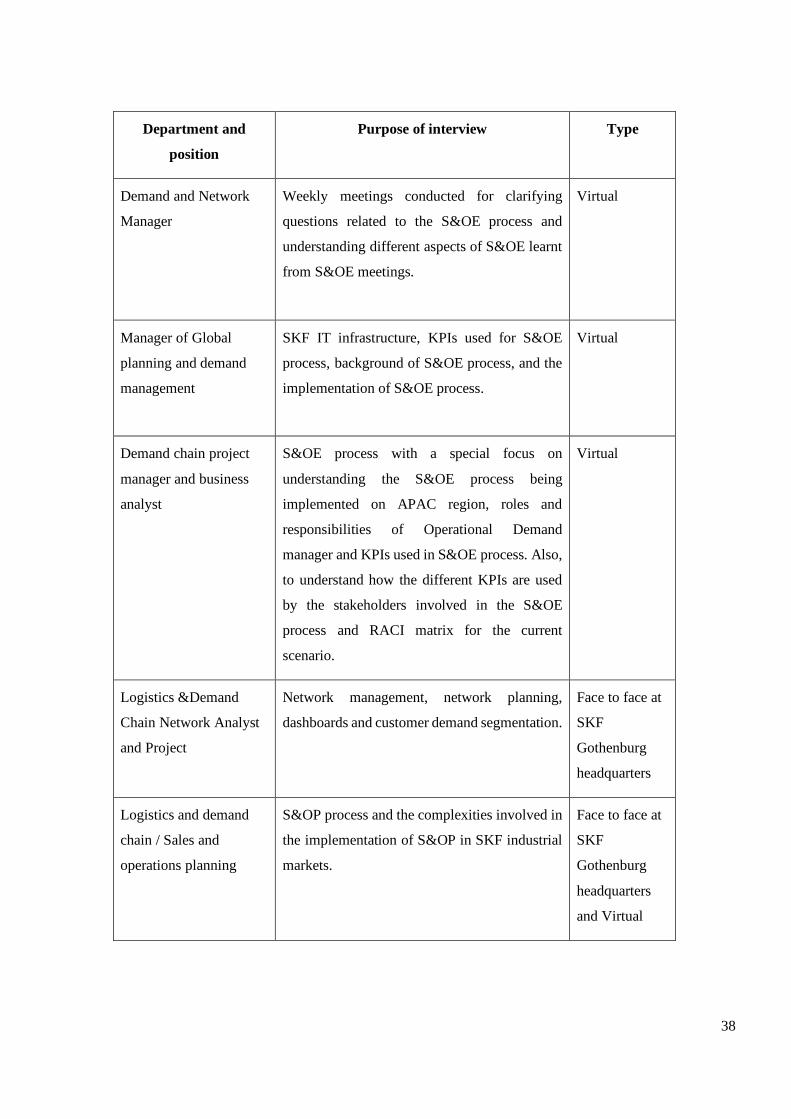
38
Department and
position
Purpose of interview Type
Demand and Network
Manager
Weekly meetings conducted for clarifying
questions related to the S&OE process and
understanding different aspects of S&OE learnt
from S&OE meetings.
Virtual
Manager of Global
planning and demand
management
SKF IT infrastructure, KPIs used for S&OE
process, background of S&OE process, and the
implementation of S&OE process.
Virtual
Demand chain project
manager and business
analyst
S&OE process with a special focus on
understanding the S&OE process being
implemented on APAC region, roles and
responsibilities of Operational Demand
manager and KPIs used in S&OE process. Also,
to understand how the different KPIs are used
by the stakeholders involved in the S&OE
process and RACI matrix for the current
scenario.
Virtual
Logistics &Demand
Chain Network Analyst
and Project
Network management, network planning,
dashboards and customer demand segmentation.
Face to face at
SKF
Gothenburg
headquarters
Logistics and demand
chain / Sales and
operations planning
S&OP process and the complexities involved in
the implementation of S&OP in SKF industrial
markets.
Face to face at
SKF
Gothenburg
headquarters
and Virtual
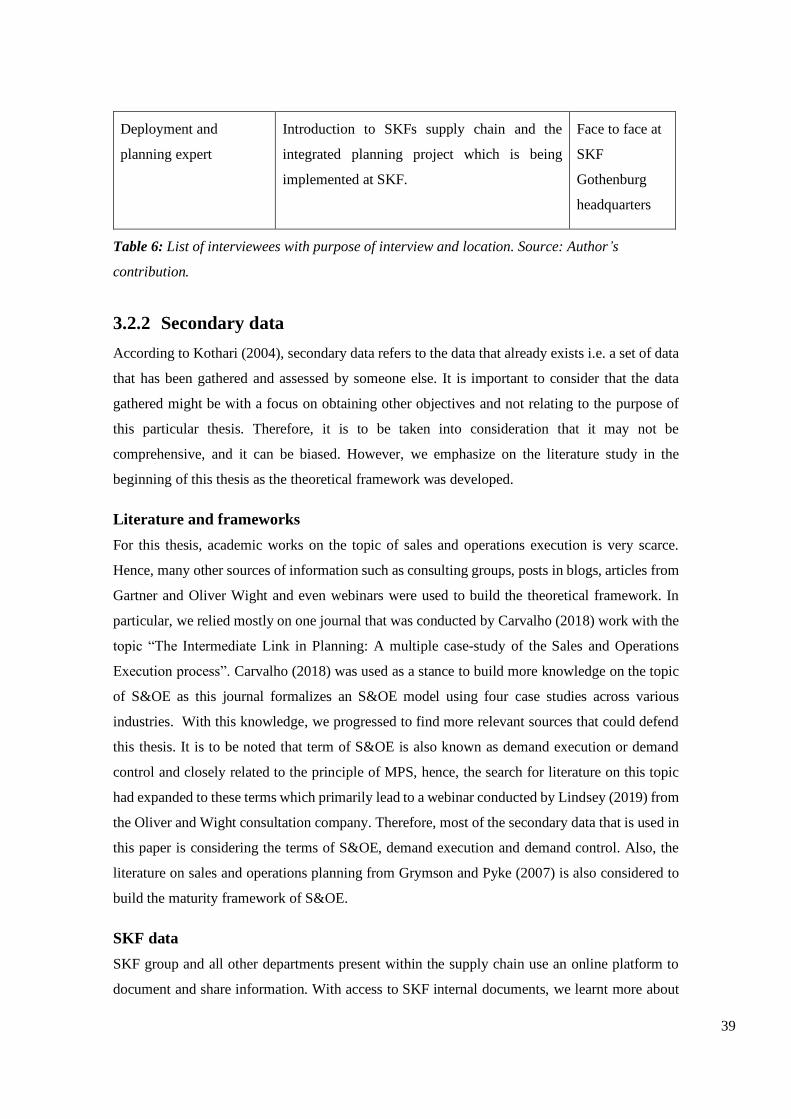
39
Deployment and
planning expert
Introduction to SKFs supply chain and the
integrated planning project which is being
implemented at SKF.
Face to face at
SKF
Gothenburg
headquarters
Table 6: List of interviewees with purpose of interview and location. Source: Author’s
contribution.
3.2.2 Secondary data
According to Kothari (2004), secondary data refers to the data that already exists i.e. a set of data
that has been gathered and assessed by someone else. It is important to consider that the data
gathered might be with a focus on obtaining other objectives and not relating to the purpose of
this particular thesis. Therefore, it is to be taken into consideration that it may not be
comprehensive, and it can be biased. However, we emphasize on the literature study in the
beginning of this thesis as the theoretical framework was developed.
Literature and frameworks
For this thesis, academic works on the topic of sales and operations execution is very scarce.
Hence, many other sources of information such as consulting groups, posts in blogs, articles from
Gartner and Oliver Wight and even webinars were used to build the theoretical framework. In
particular, we relied mostly on one journal that was conducted by Carvalho (2018) work with the
topic “The Intermediate Link in Planning: A multiple case-study of the Sales and Operations
Execution process”. Carvalho (2018) was used as a stance to build more knowledge on the topic
of S&OE as this journal formalizes an S&OE model using four case studies across various
industries. With this knowledge, we progressed to find more relevant sources that could defend
this thesis. It is to be noted that term of S&OE is also known as demand execution or demand
control and closely related to the principle of MPS, hence, the search for literature on this topic
had expanded to these terms which primarily lead to a webinar conducted by Lindsey (2019) from
the Oliver and Wight consultation company. Therefore, most of the secondary data that is used in
this paper is considering the terms of S&OE, demand execution and demand control. Also, the
literature on sales and operations planning from Grymson and Pyke (2007) is also considered to
build the maturity framework of S&OE.
SKF data
SKF group and all other departments present within the supply chain use an online platform to
document and share information. With access to SKF internal documents, we learnt more about
40
the organization structure, tools and business process used. These documents also helped us
understand how SKF portrays the purpose of S&OE within the organization of Demand
management.
3.3 Model of analysis
To be able to visualize and understand the methodology adopted to answer the research question
and how the research work was performed, a model of analysis is presented for each research
question in the next sections.
3.3.1 Research question 1
The research question 1 began by understanding the S&OE process from the existing literature
consisting of whitepapers from different consultancies, webinars, SKF’s workshop material,
master thesis papers and journals relating to the S&OE process. This was done because there was
lack of academic literature regarding the S&OE process. Hence, by reviewing all these literatures,
the characteristics were defined, and a theoretical framework was finalized to develop empirical
data of the case company. Then, the finalized characteristics of the S&OE process at SKF is
compared against the framework developed to arrive at conclusions for research question 1.
3.3.2 Research question 2
In order to answer research question two, firstly, literature on roles and responsibilities matrix
with respect to project management is reviewed which then required to understand the activities
and decisions made. Hence, workflow was developed to understand the activities done and
decisions made by each stakeholder. Keeping this in mind, both primary and secondary data were
collected from SKF to build a business process workflow which is further analyzed to develop
RACI matrix and then the role of Operational demand manager is understood. Based on the
existing theory of demand execution manager, facilitator, or responsible person for S&OE process
according to Holmes (2015) & Lindsey (2019) was explored. Then, the roles and responsibilities
of demand execution manager is explored among different companies. These are then reviewed
for how the role of demand execution manager is set, the roles and responsibilities are altered.
Once these roles and responsibilities of Operational demand manager are set, it is then reviewed
against SKF subject matter experts to get a more practical standpoint.
41
3.3.3 Research question 3
The research question 3 began with the idea of theoretical contribution towards S&OE maturity
frameworks. Here, first the maturity model was selected to adapt based on the criteria’s set for
selection of maturity model and on the number of citations of that specific framework finalized.
Once the maturity model was finalized, the context of the company was determined by
understanding different contextual factors. In the next stage, S&OE maturity model was
developed from, firstly, understanding and knowledge of SKF’s S&OE process background and
implementation along with the experience gained from participation in S&OE meetings and
interviews of subject matter experts. Secondly, knowledge of Grimson & Pyke (2007) S&OP
maturity framework and, thirdly, knowledge gained from exploration of research question 1. The
developed S&OE maturity framework is used to assess SKF’s S&OE maturity based on which
the recommendations are proposed.
3.4 Research quality criteria
According to Bell et al. (2019), reliability of the research can be segregated into external and
internal reliability. External reliability is the ability on which a study can be replicated and provide
the same or similar results when the research is conducted again. Considering this case study at
SKF the observations that were made were non structured i.e. there was no template used for
observation when attending the S&OE meetings across different regions. Moreover, the
organization at SKF is changing continuously with new technologies and processes being
implemented during the thesis period. Therefore, researchers with a similar background of supply
chain management could end up with different results than this research.
According to Bell et al. (2019), the internal reliability explains the consistency of the results
obtained. The interviews that were conducted are semi-structured interviews where follow up
questions were asked. A different pair of researchers asking the same questions could deliver
similar results, but it would also primarily depend on the follow up questions asked where answers
from participants could vary in some areas. But, we had a good understanding of the S&OE
process as there were many interviews and many observations of the S&OE meetings conducted
in various regions which provided a good discussion among us to arrive at mutual decision and
conclusion. Other researchers would also obtain similar results when attending numerous
interviews and meetings. An important factor to consider is, some regions of SKF were at the
initial phase of implementation for the S&OE process while some regions already had mature
S&OE process such as SEA (south east Asia) for the former and USA for the latter. Therefore,
observations done by us could vary when repeated by other researchers as the S&OE process
42
would have been more matured globally. Hence, questions were asked, and observations done by
us are mostly related to the implementation of the S&OE process, therefore, other researchers
who wish to repeat this research would mostly strategize to conduct this thesis considering a more
mature face of the S&OE process at SKF. However, a similar research conducted with other
researchers in the same context of the company would deliver a similar result.
Validity of research represents the extent to which the results or the conclusion drawn from the
research is accurate (Adams et al., 2014). For this research we have considered two types of
validity, namely, internal validity and external validity which are mentioned below.
Internal validity is defined as the extent to which the observed results represent the truth in the
population we are studying. The internal validity of the study can be increased by ensuring careful
study planning and adequate quality control and implementation strategies-including data
collection, data analysis, and sample size (Adams et al., 2014). Hence, the internal validity can
be related to the quality of qualitative research performed, i.e. how well the data is extracted
through inductive research from primary and secondary data. With respect to primary data, the
subject matter experts explained in Table 6 were carefully selected and interviewed which enabled
an increase in internal validity. But primary data could be improved by interviewing other
stakeholders such as sales and Operational demand manager, but we had difficulties in aligning
the meeting with them due to COVID-19.
External validity is defined as the ability of the results obtained from the study to be generalized
to other contexts (Adams et al., 2014). With respect to the final findings of the research, it is best
suited as a solution for SKFs context. Hence, the external validity of this research is low and is
inferior to internal validity. But, some of the findings of the research might be valid for companies
with similar contexts as SKF.
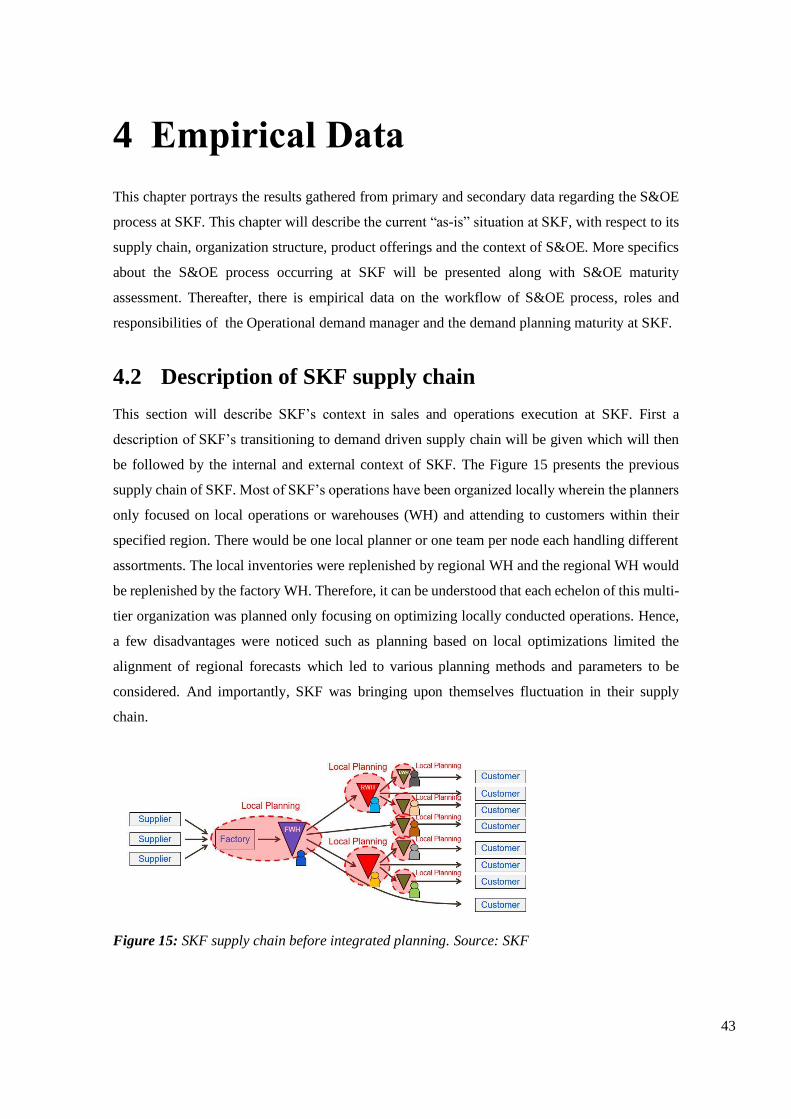
43
4 Empirical Data
This chapter portrays the results gathered from primary and secondary data regarding the S&OE
process at SKF. This chapter will describe the current “as-is” situation at SKF, with respect to its
supply chain, organization structure, product offerings and the context of S&OE. More specifics
about the S&OE process occurring at SKF will be presented along with S&OE maturity
assessment. Thereafter, there is empirical data on the workflow of S&OE process, roles and
responsibilities of the Operational demand manager and the demand planning maturity at SKF.
4.2 Description of SKF supply chain
This section will describe SKF’s context in sales and operations execution at SKF. First a
description of SKF’s transitioning to demand driven supply chain will be given which will then
be followed by the internal and external context of SKF. The Figure 15 presents the previous
supply chain of SKF. Most of SKF’s operations have been organized locally wherein the planners
only focused on local operations or warehouses (WH) and attending to customers within their
specified region. There would be one local planner or one team per node each handling different
assortments. The local inventories were replenished by regional WH and the regional WH would
be replenished by the factory WH. Therefore, it can be understood that each echelon of this multi-
tier organization was planned only focusing on optimizing locally conducted operations. Hence,
a few disadvantages were noticed such as planning based on local optimizations limited the
alignment of regional forecasts which led to various planning methods and parameters to be
considered. And importantly, SKF was bringing upon themselves fluctuation in their supply
chain.
Figure 15: SKF supply chain before integrated planning. Source: SKF
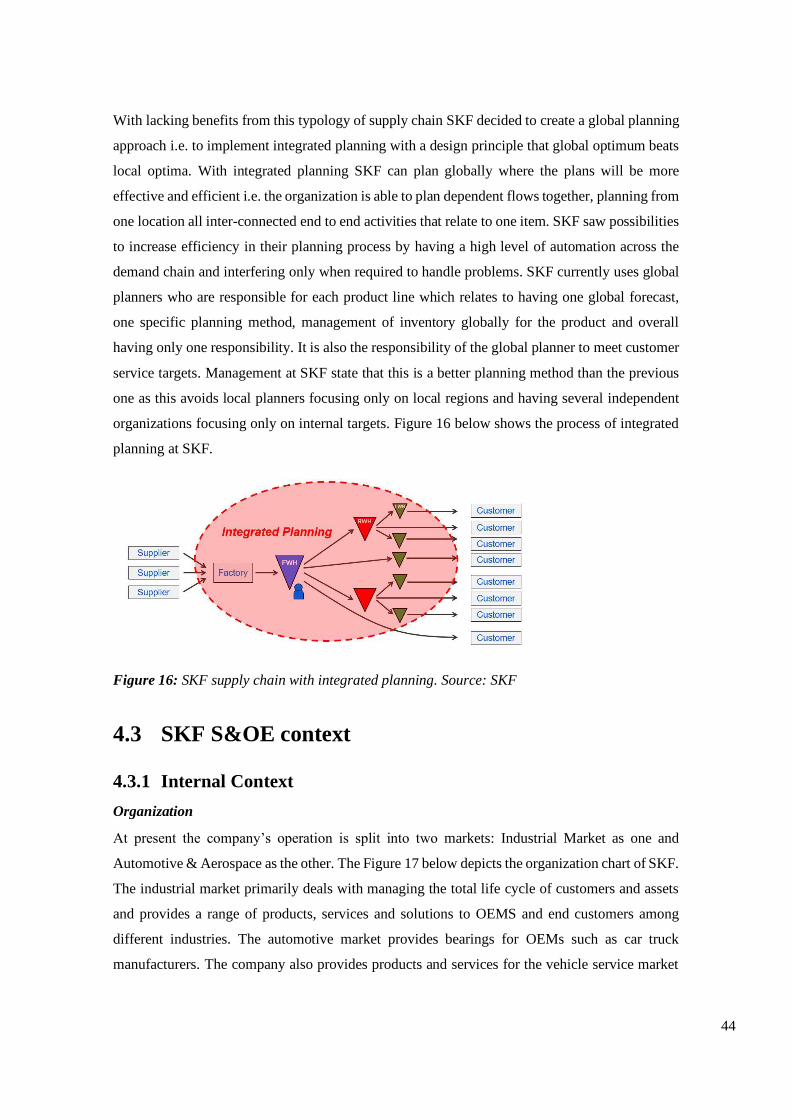
44
With lacking benefits from this typology of supply chain SKF decided to create a global planning
approach i.e. to implement integrated planning with a design principle that global optimum beats
local optima. With integrated planning SKF can plan globally where the plans will be more
effective and efficient i.e. the organization is able to plan dependent flows together, planning from
one location all inter-connected end to end activities that relate to one item. SKF saw possibilities
to increase efficiency in their planning process by having a high level of automation across the
demand chain and interfering only when required to handle problems. SKF currently uses global
planners who are responsible for each product line which relates to having one global forecast,
one specific planning method, management of inventory globally for the product and overall
having only one responsibility. It is also the responsibility of the global planner to meet customer
service targets. Management at SKF state that this is a better planning method than the previous
one as this avoids local planners focusing only on local regions and having several independent
organizations focusing only on internal targets. Figure 16 below shows the process of integrated
planning at SKF.
Figure 16: SKF supply chain with integrated planning. Source: SKF
4.3 SKF S&OE context
4.3.1 Internal Context
Organization
At present the company’s operation is split into two markets: Industrial Market as one and
Automotive & Aerospace as the other. The Figure 17 below depicts the organization chart of SKF.
The industrial market primarily deals with managing the total life cycle of customers and assets
and provides a range of products, services and solutions to OEMS and end customers among
different industries. The automotive market provides bearings for OEMs such as car truck
manufacturers. The company also provides products and services for the vehicle service market

45
i.e. aftermarket parts. It similarly delivers a range of products and services for the aviation
industry.
Figure 17: SKF Organizational chart. Source: SKF
Since this project is conducted within the industrial market, more company details will be given
about this specific market. The Industrial market is further broken down into sales and bearing
operations. With respect to sales the company has three major focus areas globally; Asia, Europe,
and America. About bearing operations, it primarily deals in the manufacturing of traditional
bearings which are still a high runner. In SKF, the factories that are producing for the industrial
market comes under bearing operations. The products manufactured in these factories can also be
a part of automotive products, but it is only considered to be a part of industrial if that specific
product results in a sale greater than 50 percent. The reason for SKF to split its industrial sectors
to three major markets is due to its large product portfolio and volume. The industrial market also
has “industrial technologies” which is related to as “special business” wherein SKF has acquired
companies in the last 10 years which has expanded the company’s product portfolio. Hence, they
not only produce traditional products but also products related to technological advancement such
as magnetic bearing, copper bearings, marine bearings etcetera.
In order to match demand and supply SKF deployed a S&OP process globally focusing on both
Automotive & aerospace and Industrial. At present the S&OP process for the automotive &
aerospace market is well-established and is at a stage four maturity level in Gartner's S&OP
model. The reason for automotive & aerospace markets to attain a high level of maturity is mainly
because it is easier to forecast demand than industrial customers as there are orders placed
SKF Group
Automotive
& Aerospace
Industrial
Automotive Automotive
aftermarket
Aerospace
Industrial
sales Asia
Divested
units
Innovation
& business
developmen
Industrial
technology
Bearing
operations
Industrial
sales EMEA
Industrial
sales
America
46
primarily from major OEM customers. Whereas the S&OP process for the industrial market,
which was initiated failed, the reason being, the demand is based from large customer groups with
varying demand in large quantities due to large number of product families and internal
organizational complexity. For e.g. there are too many products and many customer ID with
approximately 100,000 order-lines per day. Hence, it is unreliable to make sales organizations
forecast the demand. When it was difficult to synchronize demand and supply, factories developed
their own forecast and started to produce without a link to demand from sales.
Therefore, in order to bring the demand and supply closer to synchronization SKF initiated
demand management. Demand management focuses primarily on synchronization of demand and
supply where a process known as S&OE is introduced. According to the management of SKF the
S&OE process is a demand “deviation handling process”. SKF began implementing the S&OE
process which is ultimately about identifying and controlling the inflow of abnormal demand into
the SKF supply chain. At present an S&OE is in place for the organization, but, only for selected
international markets. Therefore, this thesis will focus on studying the current S&OE process,
evaluate KPIs and analyze variations in demand to determine if the roles and responsibilities
within the organization are correctly set.
Product Complexity
As it can be observed from the above Figure 18 the industrial sector serves many markets and
hence has a large product portfolio which contributes to a large part of SKFs sales. The industrial
market has 100,000 thousand order lines per day which relate to the same amount of customer
IDs generated. Due to this large product portfolios and enormous volume there is intense
complexity in dealing with manufacturing products and serving customers. Also, With SKF’s
expansion in assortments to many industries worldwide it gives the organization an advantage to
gain a large market share.
4.3.2 External context
The context in which SKF operates in the Industrial sector makes collecting customer demand
unique. As SKF serves thousands of customers globally and across various industries, the way
in which demand is obtained from customers are in a numerous way i.e. EDI’s, WEB Shop
customer links, schedule handling customers, E-mails, and CQM/P&Q quotation. Demand from
EDI’s, Web Shop customer links, emails- and phone calls are orders which are manufactured only
after the order is placed. It is important to note that demand obtained from the methods mentioned
above are inputs to the SKF’s statistical forecasting tool SO99 via customer order handling
system. This forecasting tool forecasts demand based on the shipment date of previous sales and

47
displays new forecasts for the upcoming horizon. Hence, the entire manufacturing of products
depends on the output of statistical forecasting tool. SKF also has scheduled handling customers
where for certain customers SKF consistently produces a certain quantity and item based upon
the contract signed with the customer. SKF also produces new products when requested by
customers. A separate tool is used to develop and manage new products; in this tool specific
requirements are given by the customer to produce a unique product depending on customer
demand. Therefore, with different business models that SKF produces in make to stock, make to
order and Engineer to order stocking strategies.
It is also important to note that customers do give unpredictable demand in terms of quantity and
delivery time which is not planned or forecasted by SKF. SKF calls this demand “Prompt order”
placed by customers. Prompt orders are defined as when customer requested delivery time is less
than the time required to replenish the item for delivery of that customer. Orders that are fulfilled
and delivered to customers on time are called “termed orders”. Hence, SKF serving a wide range
of customers attend to unpredicted demands daily on SKU level.
Downstream
Internal distribution network of SKF is represented from Figure 12 where it only consists of a
factory warehouse (FWH), regional warehouse and local warehouse. Almost 60 percent of the
sales that occur in the industrial sector are through distributors that are spread across the globe.
Distributors are an end-user interface of the SKF supply chain; therefore, the administration only
knows the product items that are manufactured but lack specific customer details on the
consumption of products when sold through distributors.
SKF also handles delivering products from each respective warehouse differently. For e.g., if the
order is placed by a customer who is close to the respective local warehouse, the customer is
served from the closest warehouse location. But, if an order from a customer in quantity wise is
larger than the quantity which can be delivered from a local or regional warehouse, the customer
is served directly from the factory warehouse.
SKF’s supply chain uses transportation methods of sea, road, and air, but customer requirements
are prioritized and sent accordingly using a cost-effective transportation method. In case of
backorders SKF fulfills the backorders in the next shipment to that same customer with the same
transportation method. To get accurate customer data SKF collaborates with major industrial
customers in order to gather demand information on an aggregated level to forecast and produce
for a longer horizon for that customer.
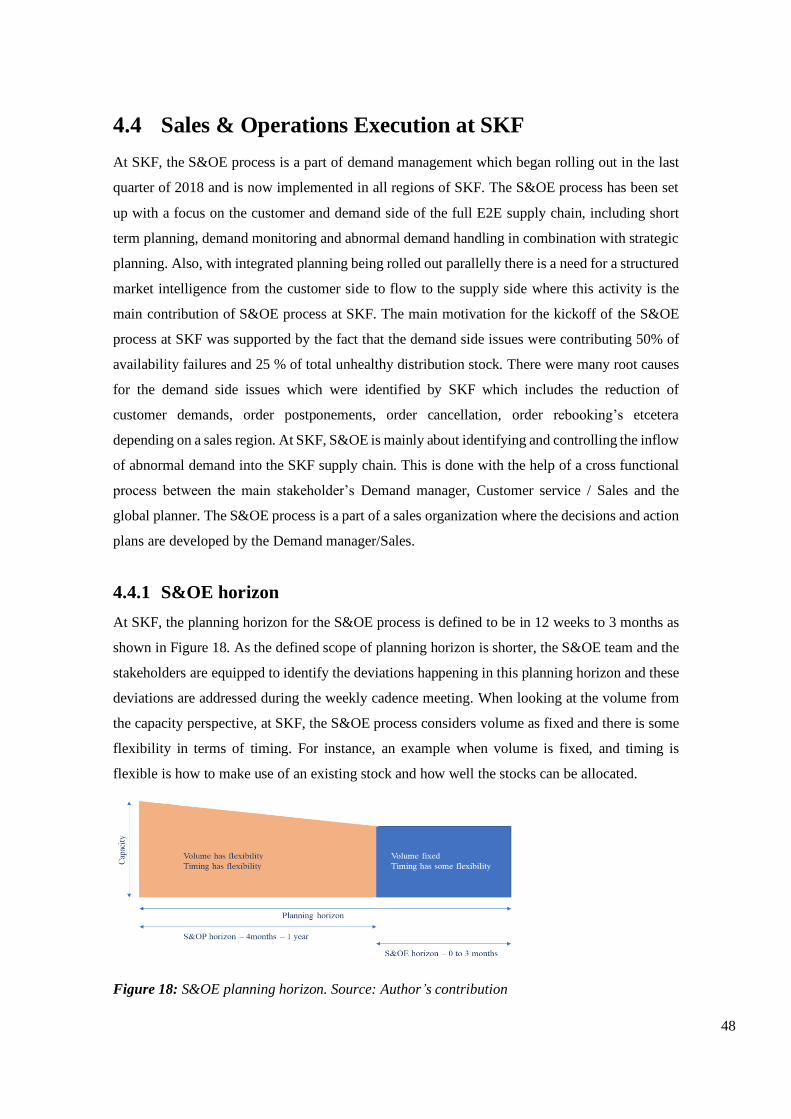
48
4.4 Sales & Operations Execution at SKF
At SKF, the S&OE process is a part of demand management which began rolling out in the last
quarter of 2018 and is now implemented in all regions of SKF. The S&OE process has been set
up with a focus on the customer and demand side of the full E2E supply chain, including short
term planning, demand monitoring and abnormal demand handling in combination with strategic
planning. Also, with integrated planning being rolled out parallelly there is a need for a structured
market intelligence from the customer side to flow to the supply side where this activity is the
main contribution of S&OE process at SKF. The main motivation for the kickoff of the S&OE
process at SKF was supported by the fact that the demand side issues were contributing 50% of
availability failures and 25 % of total unhealthy distribution stock. There were many root causes
for the demand side issues which were identified by SKF which includes the reduction of
customer demands, order postponements, order cancellation, order rebooking’s etcetera
depending on a sales region. At SKF, S&OE is mainly about identifying and controlling the inflow
of abnormal demand into the SKF supply chain. This is done with the help of a cross functional
process between the main stakeholder’s Demand manager, Customer service / Sales and the
global planner. The S&OE process is a part of a sales organization where the decisions and action
plans are developed by the Demand manager/Sales.
4.4.1 S&OE horizon
At SKF, the planning horizon for the S&OE process is defined to be in 12 weeks to 3 months as
shown in Figure 18. As the defined scope of planning horizon is shorter, the S&OE team and the
stakeholders are equipped to identify the deviations happening in this planning horizon and these
deviations are addressed during the weekly cadence meeting. When looking at the volume from
the capacity perspective, at SKF, the S&OE process considers volume as fixed and there is some
flexibility in terms of timing. For instance, an example when volume is fixed, and timing is
flexible is how to make use of an existing stock and how well the stocks can be allocated.
Figure 18: S&OE planning horizon. Source: Author’s contribution
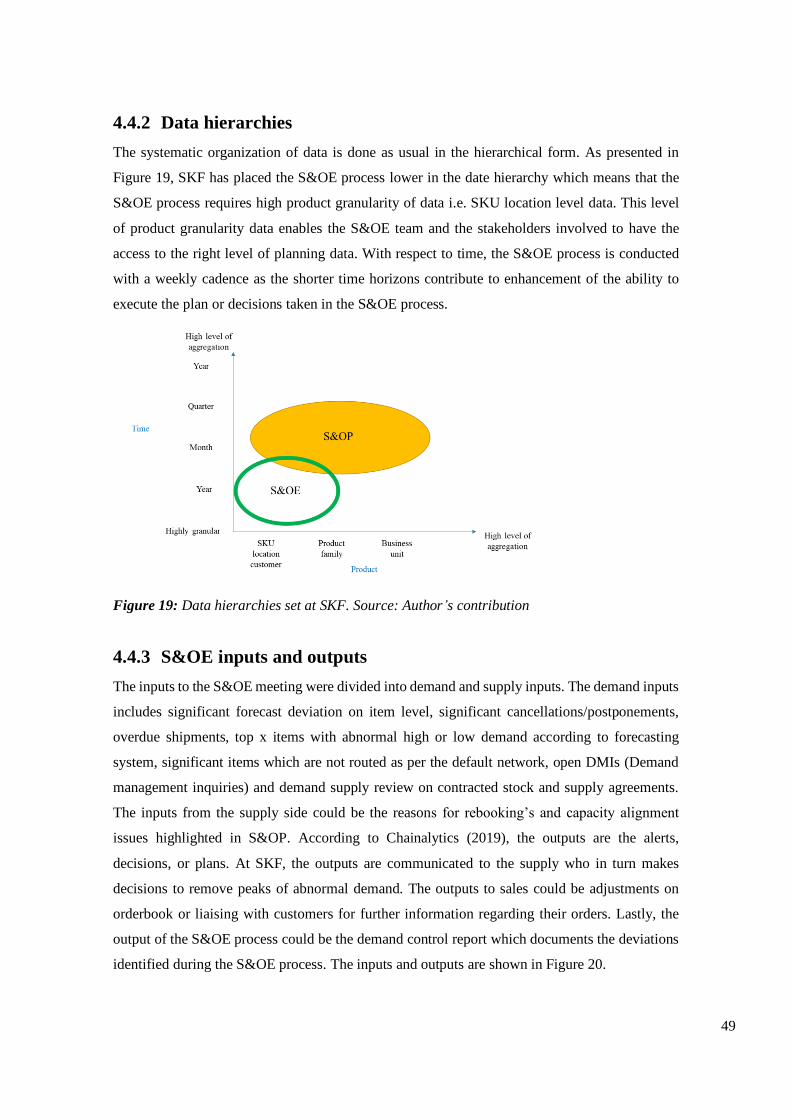
49
4.4.2 Data hierarchies
The systematic organization of data is done as usual in the hierarchical form. As presented in
Figure 19, SKF has placed the S&OE process lower in the date hierarchy which means that the
S&OE process requires high product granularity of data i.e. SKU location level data. This level
of product granularity data enables the S&OE team and the stakeholders involved to have the
access to the right level of planning data. With respect to time, the S&OE process is conducted
with a weekly cadence as the shorter time horizons contribute to enhancement of the ability to
execute the plan or decisions taken in the S&OE process.
Figure 19: Data hierarchies set at SKF. Source: Author’s contribution
4.4.3 S&OE inputs and outputs
The inputs to the S&OE meeting were divided into demand and supply inputs. The demand inputs
includes significant forecast deviation on item level, significant cancellations/postponements,
overdue shipments, top x items with abnormal high or low demand according to forecasting
system, significant items which are not routed as per the default network, open DMIs (Demand
management inquiries) and demand supply review on contracted stock and supply agreements.
The inputs from the supply side could be the reasons for rebooking’s and capacity alignment
issues highlighted in S&OP. According to Chainalytics (2019), the outputs are the alerts,
decisions, or plans. At SKF, the outputs are communicated to the supply who in turn makes
decisions to remove peaks of abnormal demand. The outputs to sales could be adjustments on
orderbook or liaising with customers for further information regarding their orders. Lastly, the
output of the S&OE process could be the demand control report which documents the deviations
identified during the S&OE process. The inputs and outputs are shown in Figure 20.
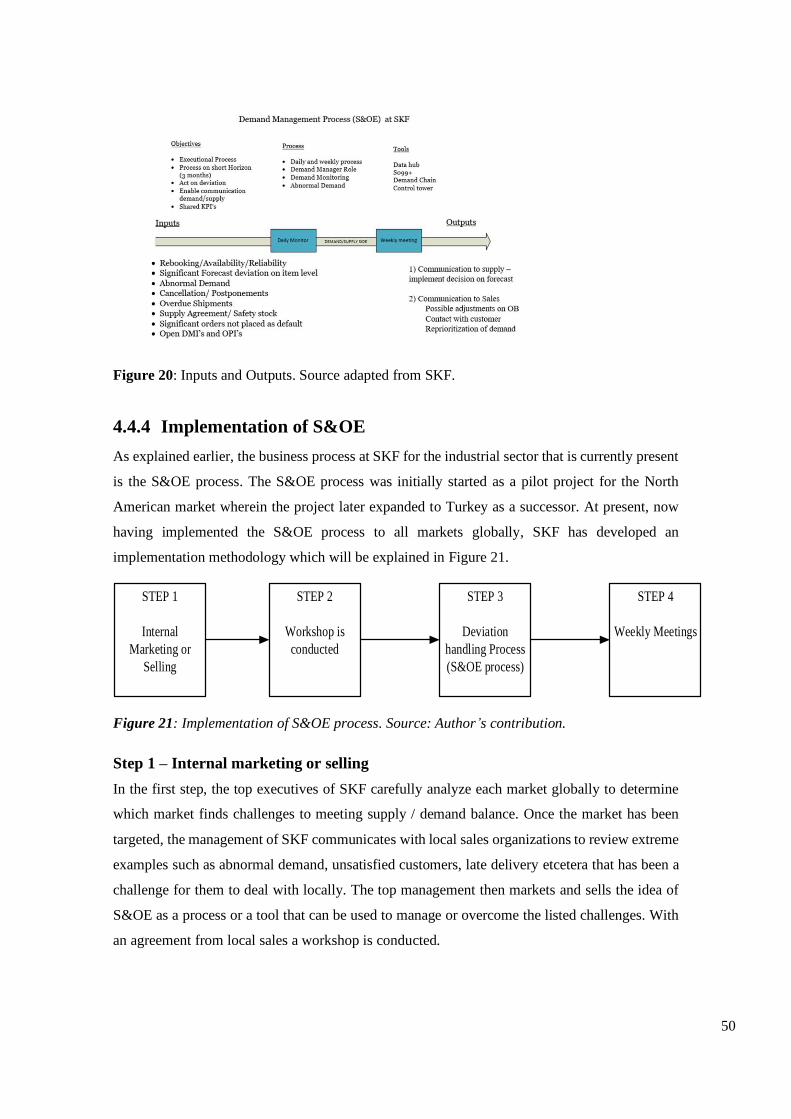
50
Figure 20: Inputs and Outputs. Source adapted from SKF.
4.4.4 Implementation of S&OE
As explained earlier, the business process at SKF for the industrial sector that is currently present
is the S&OE process. The S&OE process was initially started as a pilot project for the North
American market wherein the project later expanded to Turkey as a successor. At present, now
having implemented the S&OE process to all markets globally, SKF has developed an
implementation methodology which will be explained in Figure 21.
STEP 3
Deviation
handling Process
(S&OE process)
STEP 1
Internal
Marketing or
Selling
STEP 2
Workshop is
conducted
STEP 4
Weekly Meetings
Figure 21: Implementation of S&OE process. Source: Author’s contribution.
Step 1 – Internal marketing or selling
In the first step, the top executives of SKF carefully analyze each market globally to determine
which market finds challenges to meeting supply / demand balance. Once the market has been
targeted, the management of SKF communicates with local sales organizations to review extreme
examples such as abnormal demand, unsatisfied customers, late delivery etcetera that has been a
challenge for them to deal with locally. The top management then markets and sells the idea of
S&OE as a process or a tool that can be used to manage or overcome the listed challenges. With
an agreement from local sales a workshop is conducted.
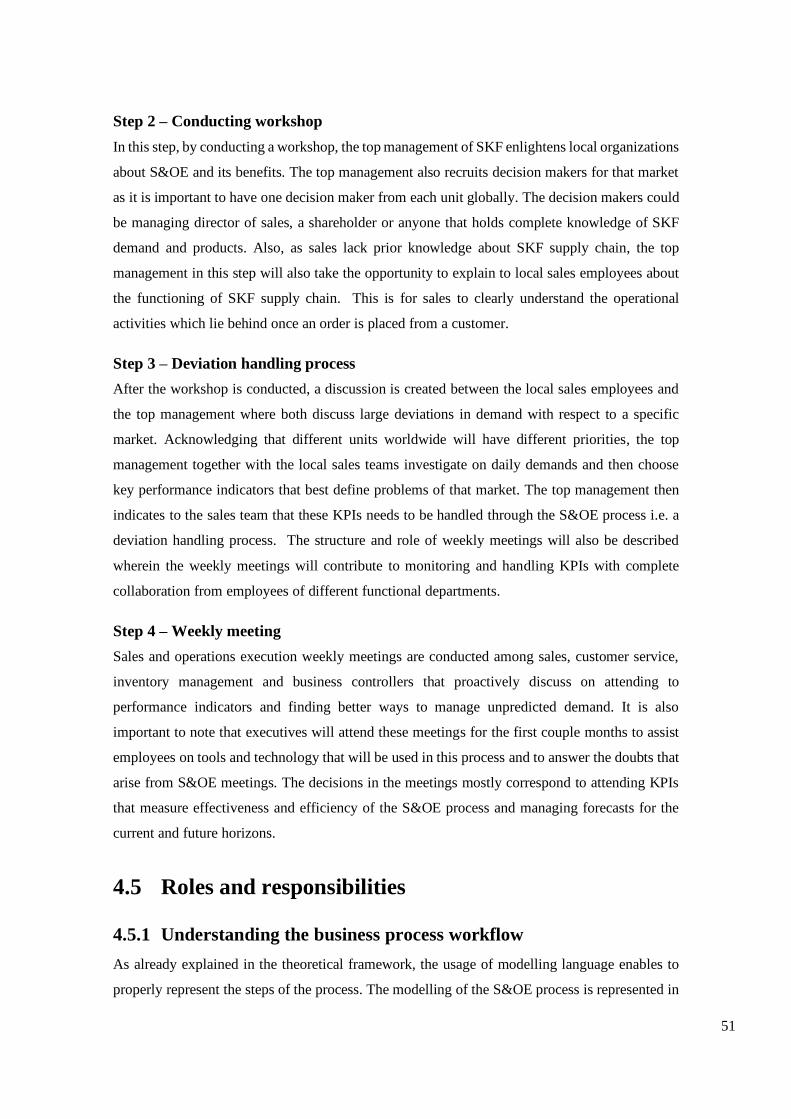
51
Step 2 – Conducting workshop
In this step, by conducting a workshop, the top management of SKF enlightens local organizations
about S&OE and its benefits. The top management also recruits decision makers for that market
as it is important to have one decision maker from each unit globally. The decision makers could
be managing director of sales, a shareholder or anyone that holds complete knowledge of SKF
demand and products. Also, as sales lack prior knowledge about SKF supply chain, the top
management in this step will also take the opportunity to explain to local sales employees about
the functioning of SKF supply chain. This is for sales to clearly understand the operational
activities which lie behind once an order is placed from a customer.
Step 3 – Deviation handling process
After the workshop is conducted, a discussion is created between the local sales employees and
the top management where both discuss large deviations in demand with respect to a specific
market. Acknowledging that different units worldwide will have different priorities, the top
management together with the local sales teams investigate on daily demands and then choose
key performance indicators that best define problems of that market. The top management then
indicates to the sales team that these KPIs needs to be handled through the S&OE process i.e. a
deviation handling process. The structure and role of weekly meetings will also be described
wherein the weekly meetings will contribute to monitoring and handling KPIs with complete
collaboration from employees of different functional departments.
Step 4 – Weekly meeting
Sales and operations execution weekly meetings are conducted among sales, customer service,
inventory management and business controllers that proactively discuss on attending to
performance indicators and finding better ways to manage unpredicted demand. It is also
important to note that executives will attend these meetings for the first couple months to assist
employees on tools and technology that will be used in this process and to answer the doubts that
arise from S&OE meetings. The decisions in the meetings mostly correspond to attending KPIs
that measure effectiveness and efficiency of the S&OE process and managing forecasts for the
current and future horizons.
4.5 Roles and responsibilities
4.5.1 Understanding the business process workflow
As already explained in the theoretical framework, the usage of modelling language enables to
properly represent the steps of the process. The modelling of the S&OE process is represented in

52
Figure 22 which will be explained below as per the swim lane diagram. Each swimlane signifies
the activities done by the S&OE team and the stakeholders involved, namely the Operational
demand manager, customer service/sales, global planner and subject matter experts. The use of
swim lane diagrams enables to clearly define the roles and responsibilities of each stakeholder
involved in the S&OE process. This also supports in development of the RACI matrix among
them stakeholders and understanding the roles and responsibilities of Operational demand
manager, the facilitator of S&OE process. The activities in S&OE is not in sequence i.e. it is non-
linear, and some activities can happen parallelly.
The BPMN diagram from Figure 22 will be explained with respect to participants of the S&OE
process enabling a clear understanding of the activities performed in the S&OE process which is
as explained below. Also, under the heading of “scenario of abnormal high demand” there is an
example of one scenario to clearly understand the activities done in S&OE when there is abnormal
high demand from the customers.
Ind
ustr
ial S
ale
sB
ea
rin
g O
pe
rati
on
s
Sa
les /
Cu
sto
mer
se
rvic
e
Op
. D
em
an
d
ma
nage
r
Glo
ba
l p
lan
ne
rS
ub
ject
matt
er
exp
ert
s
Start
End
Daily activities for
S&OE
Start
Analyze DMIs Respond to GP
Analyze abnormal
demandSend DMIs
Receive response
from CSR
Start
Change forecast /
Clean history /
Reprioritize
demand/
Do nothing
Input on market intelligence
Via DMI
DMI
S&OE meeting
End
Check
DOH
Check
BI Server
Evaluate deviations
and opportunities
Escalation
if high complexity
Give inputs and
guidance in
decision making
Make actionable
Plan and decisions
No escalation
End
Receive info
regarding Lost
sales/ Forecast
consumption
Input on
market intellligence
Is the
action urgent?No
Identify the
exceptional cases
of abnormal
demand
Add external factor
in S099+ forecast
Yes
Figure 23: SKF Current states S&OE BPMM. Source: Author’s contribution.
Operational demand manager
The S&OE process of Operational demand manager begins with daily/weekly activities
performed by the Operational demand manager. At SKF, the frequency of activities is decided to
be in daily or weekly depending on whether the integrated planning project is implemented for
53
that sales region. The daily/weekly activities relating to S&OE done by Operational demand
manager are explained in Figure 23 which consists of the following:
• Analyzing availability failure
• Analyzing reliability failure
• Analyzing the quality of inventory
• Analyzing the re-booking/cancellations/postponements made by the customer.
• Analyzing the order book to check the number of overdue orders from the customer order
book and number of orders which are on hold.
By analyzing the above mentioned KPIs, the key deviations and opportunities are identified and
is recorded for discussion during the S&OE meeting.
Global planners
Global planners check the abnormal demand received from the forecasting system or business
intelligence server or delivery order handling system and identify the exceptional high or low
abnormal demand received from the customer. This exceptional high or low abnormal demand is
inquired using DMI tool with the customer service or sales. Once the feedback is received on
abnormal demand from the sales/customer service, the global planner removes the peaks from the
forecasting system, which indeed contributes to stabilization or normalization of statistical
forecast. About deciding as to what peaks in customer demand needs to be removed from the
forecasting system is based on different factors. For instance, if a customer agrees to share the
forecast for consecutive months, then the global planner decides not to remove the peaks from the
forecasting system. It could also be a case when an onetime abnormal demand from the customer
is received and the global planner decides to remove the peak abnormal demand received.
Decision maker
The decision maker is part of a sales organization who is given authority to make decisions related
to the S&OE process. He/ she has a good knowledge of all the demand related issues and is
familiar with the daily operations related to demand side.
Sales/Customer service
The sales/customer service receive the abnormal demand inquiries through demand management
inquiry (DMI) tool. DMI is a global online workflow established to send inquiries and receive
answers between planners from all warehouses & customer service globally. Some of the
abnormal demand creating peaks in the forecast are highlighted by the global planner or
Operational demand managers to the customer service who then investigates with the customer
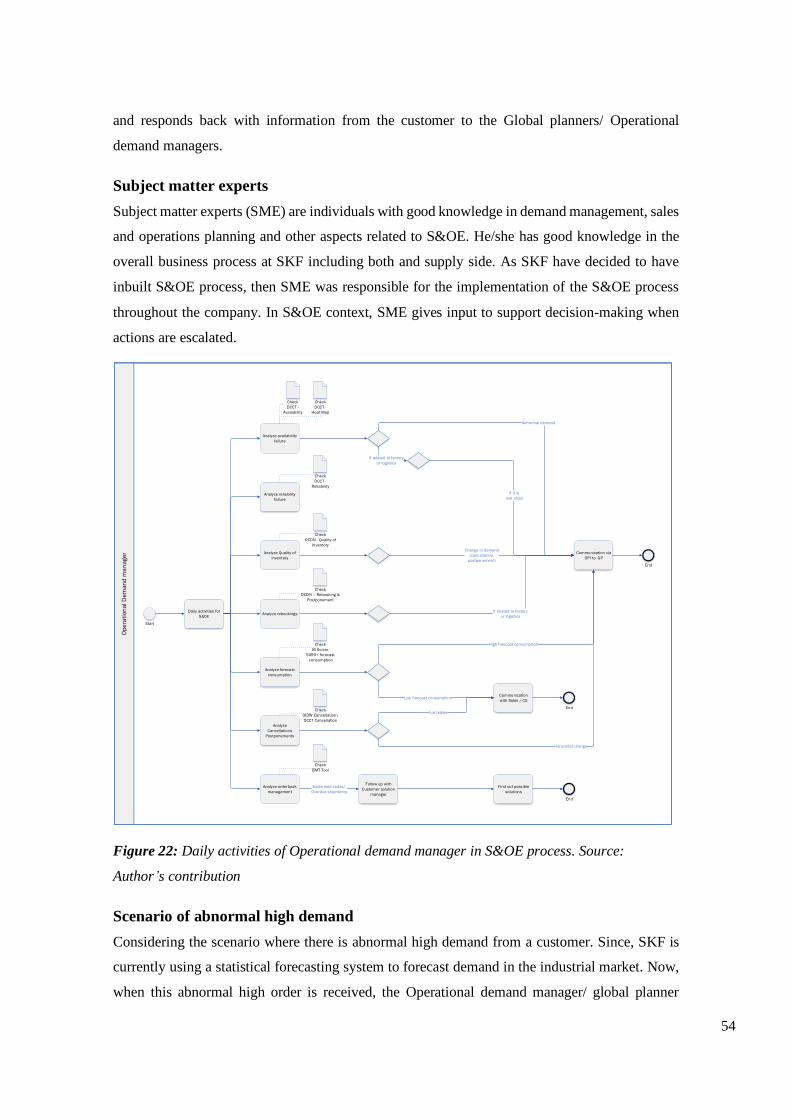
54
and responds back with information from the customer to the Global planners/ Operational
demand managers.
Subject matter experts
Subject matter experts (SME) are individuals with good knowledge in demand management, sales
and operations planning and other aspects related to S&OE. He/she has good knowledge in the
overall business process at SKF including both and supply side. As SKF have decided to have
inbuilt S&OE process, then SME was responsible for the implementation of the S&OE process
throughout the company. In S&OE context, SME gives input to support decision-making when
actions are escalated.
Op
era
tio
na
l D
em
an
d m
an
age
r
Analyze availability
failure
Analyze Quality of
inventory
Analyze rebookings
Analyze orderbook
management
Daily activities for
S&OE
Communication via
OPI to GP
Abnormal demand
If related to factory
or logistics
If it is
lost order
Change in demand
(cancellation,
postponement)
Follow up with
Customer solution
manager
Sales hold codes/
Overdue shipments
Find out possible
solutions
If related to factory
or logistics
Check
DCDN - Quality of
Inventory
Analyze reliability
failure
Check
DCCT -
Availability
Check
DCCT -
Reliability
Check
DCCT -
Heat Map
End
End
Check
DCDN – Rebooking &
Postponement
Check
BMT Tool
Start
Analyze forecast
consumption
Analyze
Cancellations
Postponements
High forecast consumption
Communication
with Sales / CSLow forecast consumption
Lost sales
Horizontal change
EndCheck
OIDW Cancellation\
DCCT Cancellation
Check
Bl Server
S099+ forecast
consumption
Figure 22: Daily activities of Operational demand manager in S&OE process. Source:
Author’s contribution
Scenario of abnormal high demand
Considering the scenario where there is abnormal high demand from a customer. Since, SKF is
currently using a statistical forecasting system to forecast demand in the industrial market. Now,
when this abnormal high order is received, the Operational demand manager/ global planner

55
highlights this abnormal demand to customer service representatives through DMI. The customer
service representative (CSR)then investigates with that specific customer as to whether there will
be any future order from that customer, or if it is a one-time order. If its one-time order, this
abnormal order is removed from the forecasting system. When considering a case where the
customer gives information related to future orders. The CSR incorporates that information in the
Demand Management Inquiry (DMI) which is then incorporated into the forecasting system by
the Global planner or Operational demand manager.
4.5.2 Roles and responsibilities of the S&OE team
At SKF, it is the Operational demand manager who is dedicated to perform the S&OE tasks and
activities. He may or may not be assisted by demand planners depending on the complexity of the
sales region. About the roles and responsibilities, firstly, Operational demand manager should
have a basic understanding of the demand and supply process which includes the understanding
of different ERP systems involved in the demand and supply process. Secondly, his/ her main
responsibility should be the management of abnormal demand which includes demand monitoring
and analysis of actual demand. Based on this analysis, Operational demand manager highlights
the key availability failures caused by the abnormal demand to customer service
representatives/sales. Thirdly, the Operational demand manager should understand the
forecasting process and forecast consumption so that he/she can provide inputs to the supply side.
As S&OE process itself is a collaboration between demand (Sales / Customer service
representative / Operational demand manager) and supply (Global planner / Local planner),
Operational demand manager should be able to facilitate common understanding among different
stakeholders. Lastly, it is also included to manage and give feedback on NAR, supply agreements
and contract stocks.
4.6 S&OE Maturity at SKF
This section of the report explains how SKF is currently working with S&OE which was initiated
within demand management. The purpose of this section is to use the dimensions of the Grimson
& Pyke (2007), maturity model and answer the research question three to provide an empirical
data which will be analyzed in the next chapter with the S&OE maturity model that is developed.
4.6.1 Meetings and collaboration
At SKF, globally S&OE meetings with a weekly cadence which involves stakeholders from
different departments who actively participate in managing current and past deviations in demand.
56
At SKF, globally S&OE meetings are conducted on a weekly basis which involves stakeholders
from different departments who actively participate in managing current and past deviations in
demand. In specific, stakeholders including customer service, Operational demand manager,
business controller and a decision maker from sales are always present in these meetings. The
meetings also consist of subject matter experts who assist in solving sophisticated problems that
may arise during these meetings. The weekly meetings are always formal and scheduled based on
the availability of stakeholders.
S&OE meetings at SKF are given one of the highest priorities and are well-planned by the
Operational demand manager. The Operational demand manager is the owner of the S&OE
meeting who takes the responsibility in gathering information on weekly status and organizing
the information and presenting it in the beginning of each meeting. This provides a brief overview
to the participants involved on what will be discussed in the meetings i.e. agenda of the meeting.
Hence, the agenda of the S&OE meetings would be to have an action review from the previous
week, discuss on SKUs that have affected the KPIs negatively, significant deviations of orders
that have been noticed from the past week and discuss on the necessary actions or decisions
required to reduce these effects. The objectives of the S&OE meetings are primarily to have a
control on the short-term abnormal demand flowing in and match it accordingly with supply,
improve demand planning, service level, stock level and communication through the whole chain
to be more efficient and effective. SKF also takes the opportunity to collaborate with strategic
external customers in order to integrate the demand data to run smoother operations in their supply
chain. While there are many aspects taken into consideration apart from what is explained above
it is observed that the S&OE meetings primarily discuss what has happened in the past and how
those deviations or failures could be rectified. Hence, the meetings at SKF are constantly on
firefighting mode that causes expedites of raw materials, higher frequency in rescheduling orders
and a raise in logistics cost to live up to customer expectations. Discussion in the meetings does
not look into the near-term future to plan ahead on how future deviation or opportunities could be
handled or obtained. The S&OE meeting session also discusses the customer orderbook and KPI
failure that has occurred for the current and the past week. Each of the KPIs are analyzed on SKU
level to determine the root cause among others involved. Forecast retrieved and analyzed by the
Operational demand managers from the statistical forecasting tool (SO99) is also very crucial,
hence, the Operational demand manager gathers input from decision maker on how to normalize
the peak of forecasts for a specific horizon when an abnormal demand flows in.
57
4.6.2 Organization
At SKF, S&OE is an important process and it is among other functions i.e. all other departments
have acknowledged the benefits of S&OE and the process has a leader who is considered to be
the owner (Carvalho, 2018). The process also has a decision maker from sales who makes the
final decisions at the end of weekly S&OE meetings. The decision maker only takes decisions for
issues that are brought up to the weekly S&OE meeting and a final call at the end of every meeting
and other decisions are made solely by the respective managers working in their department.
There is a dedicated S&OE team under demand management i.e. Operational demand manager
who is responsible for tasks under the S&OE process which is explained in detail in roles and
responsibilities section 4.3 in this report. Among the stakeholder’s business controllers take part
in the S&OE meetings in case there are any inventory adjustments to be made. Also, in some
regions, the warehouse manager of a specific sales region also participates to make any decisions
related to inventory.
By now, it is understood that SKF has taken S&OE meetings seriously and have prioritized these
meetings. Hence, these meetings are considered highly relevant to handle deviations in a
systematic manner. The significance of these meetings is acknowledged by top executives and
managers at SKF. The level of understanding regarding the S&OE process is different for the
stakeholders with respect to forecasting. For instance, forecasting which is done on item level
with respect to a specific region may be useful to supply planners but may not be that useful to
sales/customer service representatives as they would prefer forecasting done on customer level.
4.6.3 Measurements
At SKF, the S&OE process uses different KPIs to control the overall outcome of the business.
These KPIs serve the purpose in conducting the S&OE process in an efficient and an effective
manner when monitored and taken timely decisions. As aforementioned in literature review; KPIs
are used to measure the effectiveness of the business process used in the organization. For the
S&OE process at SKF the KPIs used are stock level and bad stock, availability failure, reliability
failure, forecast accuracy, rebooking, postponement and cancellation order book management
which includes order book on hold and order book on hold for more than 3 months. These KPIs
will be defined and explained on how each of them affects the S&OE process at SKF S&OE
process:
• Availability failure measures if the first requested date from the customer order is accepted
or not in terms of quantity and time. For e.g., if a customer wants the pieces delivered
tomorrow from SKF once the order is placed, SKF checks accordingly in their business
58
function of available to promise to cross verify if the requested order could be satisfied. If
not, SKF notifies the customer mentioning the requested delivery date cannot be satisfied and
hence we will promise another delivery date.
• Reliability failure is a KPI that measures the broken promises made by the organization. From
the example of availability failure, once a new date is assigned by SKF i.e. the new promised
date; the organization changes the promised date to another date.
• The KPI of rebooking, postponement and cancellation measures the number of times an order
line has been rebooked by SKF. This KPI basically looks at the number of times an order has
been either preponed or postponed to the external customers order lines. For e.g. if a factory
has reduced its production capacity due to various issues there would be an extensive amount
of rebooking’s done by SKF relating to “change in promises” to external customers.
• Forecast accuracy is defined as the difference between the actual demand and the forecasted
demand. With this KPI in place SKF can determine how well the organization is predicting
its upcoming demand. The KPI of bad stock refers to the stock the has stopped moving and
is just present at the warehouse. This reflects very low inventory turnover and buildup of
unnecessary capital.
• Orderbook management is a process of efficiently tracking and fulfilling the orders placed by
customers. This process keeps a record of customer purchase history, payment method and
quantity of each order. The KPIs that are measured in SKF under orderbook management is
backlog, postponements, cancellations and change in sales order which pertains to either
quantity change in their order line or the delivery date.
As aforementioned in the dimension of meetings and collaboration the monitoring of KPIs is very
important as these acts as a primary topic of discussion and input for the S&OE process. The KPIs
are monitored daily and the overview of the failures or issues that have occurred for the KPIs are
discussed in the S&OE meetings. The reasons for the failure and the outputs such as decisions
and actions required to manage the KPIs are also discussed in the meetings. For e.g., if there was
an availability failure for an item the Operational demand manager determines during the week
on why this KPIs has been affected. These issues are then raised in S&OE meetings to
communicate with operations in order to determine root cause analysis and possibly obtain a
review from other supervisors of the department that also affects the KPIs. Hence, in this scenario
of availability failure the discussion would determine why this KPI has failed i.e. was the order
an abnormal demand and was there sufficient stock to support in delivering to that particular
demand. Therefore, the output would lead to a decision along with relevant stakeholders such as
global planners, CSR and factory or logistics to take the necessary actions such as changing
forecast and prioritizing the demand.
59
The weekly review of KPIs is one of the main tasks in the S&OE meetings and it is observed that
although the KPIs used in this process is similar to the KPIs suggested by Lindsey (2019), Holmes
(2015) and Carvalho (2018), the process is still ineffective in terms of reducing the tied-up capital.
Only the KPI of availability failure and reliability failure is given the highest priority followed by
order book management. This is because the S&OE team at SKF is only looking at proactively
managing the abnormal demand for supply i.e. making sure that customer orders are fulfilled on
time to satisfy the SLA (service level agreements) with customers. The fulfillment of customer
orders impacts these three KPIs in a positive manner, however, the S&OE team ignores the KPIs
of forecast accuracy and stock level which has negatively impacted the inventory levels. The KPI
of bad stock + stock level and forecast accuracy is rarely monitored and discussed on the root
cause which indicates that the effectiveness of the process is not measured. It is observed that
under the KPI of bad stock the “free available non planned stock on hand” which is used to supply
for make to order (MTO) environment has the highest inventory level resulting in a high inventory
value. According to Smaros et al. (2003) in an MTO the inventory level should be relatively low;
as this production method only produces when an order is placed.
4.6.4 Information technology
When considering the stance of SKF’s information flow, SKF uses digital twin technology to
exploit data from business intelligence servers where all the information from different data
warehouses are gathered, such as from sales data warehouses consisting of sales related
information and several other data warehouses from the supply side which may consist of
inventory related information. This data from the business intelligence server is converted to an
interactive visualization with a simple interface for the stakeholders by using the business
analytics service by Microsoft. Hence, both the demand and supply related information is gathered
in a business intelligence server which clearly explains the use of centralized information at SKF.
Now for the S&OE process, these dashboards are used by the stakeholders to observe and analyze
the demand and supply inputs that affect the S&OE process and based on which the decision or
outputs are concluded. Hence, it can be said that SKF is itself in a good stance in terms of IT tools
and Analytics.
Another important aspect of the S&OE process is to establish good communication between
stakeholders at an operational level such as customer service representative, supply planners.
Hence, with regards to the information sharing mechanism, there exists a global online workflow
tool where a communication can be established globally between demand and supply side. One
example could be how these workflows are used is to gather market intelligence. Suppose if there
is an event of abnormal high demand from a customer, global planner raises an inquiry in these

60
online workflows to the customer service representative who indeed liaises with the customer to
gather more information whether this customer will order in the subsequent months or not.
4.6.5 Integration between sales and operations
This dimension of the maturity model discusses how well the S&OE plan is integrated in the SKF
E2E supply chain. In SKF the S&OE process is currently asymmetrical, i.e. the demand forecast
that the statistical tool (SO99) generates operations needed to supply it. The main goal of S&OE
at SKF is only to handle large deviations and match supply and demand. Thus, there is no clear
goal of profit optimization on the longer horizon, SKF, does not try to improvise the S&OE
process accordingly to what the process is capable of i.e. more efficient inventory deployment
which focuses on reducing stock outs, increasing average customer level, reducing expedites and
reduce inventory waste. It is observed that the operations side of the supply chain does not take
any part in S&OE meetings. This is because the S&OE process which is conducted under demand
management is focused on only attending to abnormal demand i.e. trying to clean the sales order
flowing in so that the operation team can comply and supply it. Therefore, involvement of
supervisors from logistics, procurement, production does not exist. Another reason for the lack of
involvement of from operations side is due to the reason that there is too much complexity in the
organization structure, for e.g. SKF has around approximately 30 factories producing various
product groups; hence, it is difficult to include the production team into S&OE meetings as
information and availability of supervisors could get complicated.
4.7 Demand planning maturity
According to Holmes (2015) and Lindsey (2019), the demand plan is an essential input for the
demand control or S&OE process. Hence, the readiness of demand plan as an input for S&OE
process is dependent on the maturity of the process of demand planning Vereecke et al. (2018).
This is because if the demand planning maturity is increased, the demand plan will also have an
increased accuracy. Also, as SKF’s S&OP process is in an implementation phase, it could be of
value to determine the readiness of demand plan for the first stage of S&OP process. Hence, the
integrated planning as well as manager of global planning and demand management was sent a
survey to determine the maturity of the demand planning process. Figure 24 shown displays the
results of the survey conducted.
Firstly, SKF is in a stage of low maturity where they have a detailed tailoring forecasting
technique for products with different characteristics. This could be due to the fact that the
industrial market is serving large customer groups with their wide range of product portfolios.
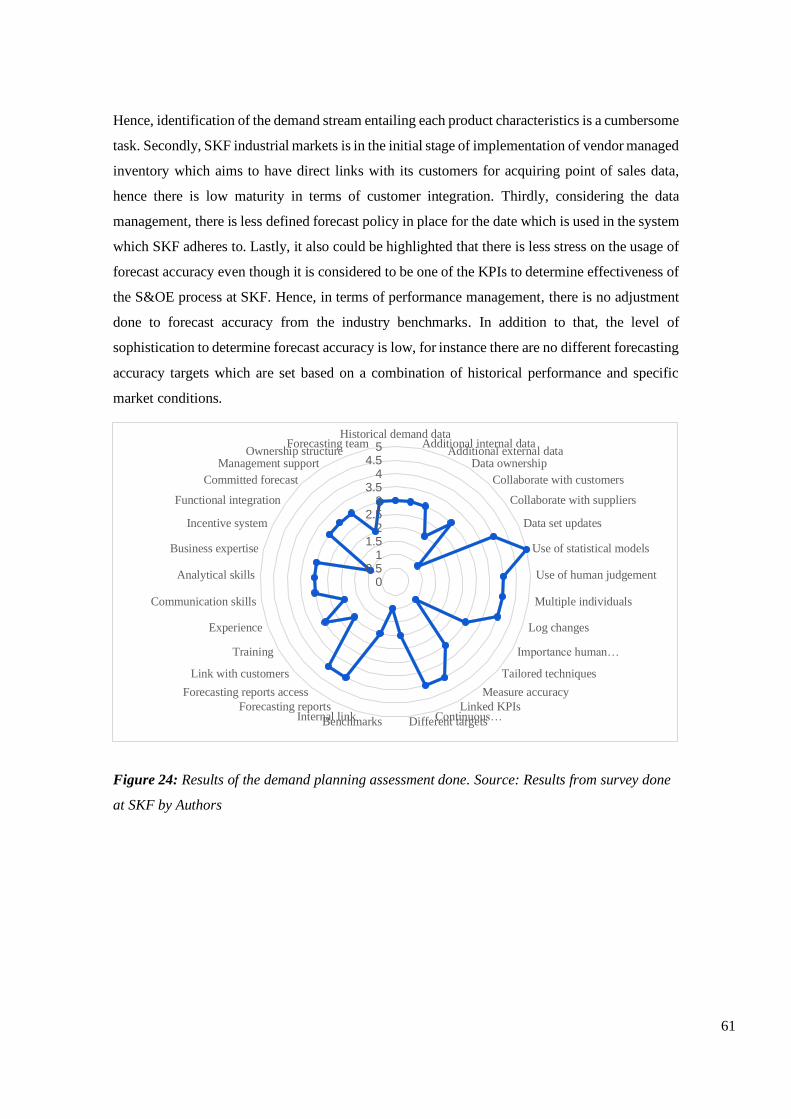
61
Hence, identification of the demand stream entailing each product characteristics is a cumbersome
task. Secondly, SKF industrial markets is in the initial stage of implementation of vendor managed
inventory which aims to have direct links with its customers for acquiring point of sales data,
hence there is low maturity in terms of customer integration. Thirdly, considering the data
management, there is less defined forecast policy in place for the date which is used in the system
which SKF adheres to. Lastly, it also could be highlighted that there is less stress on the usage of
forecast accuracy even though it is considered to be one of the KPIs to determine effectiveness of
the S&OE process at SKF. Hence, in terms of performance management, there is no adjustment
done to forecast accuracy from the industry benchmarks. In addition to that, the level of
sophistication to determine forecast accuracy is low, for instance there are no different forecasting
accuracy targets which are set based on a combination of historical performance and specific
market conditions.
Figure 24: Results of the demand planning assessment done. Source: Results from survey done
at SKF by Authors
00.5
11.5
22.5
33.5
44.5
5Historical demand data
Additional internal dataAdditional external data
Data ownership
Collaborate with customers
Collaborate with suppliers
Data set updates
Use of statistical models
Use of human judgement
Multiple individuals
Log changes
Importance human…
Tailored techniques
Measure accuracy
Linked KPIsContinuous…Different targetsBenchmarksInternal link
Forecasting reports
Forecasting reports access
Link with customers
Training
Experience
Communication skills
Analytical skills
Business expertise
Incentive system
Functional integration
Committed forecast
Management supportOwnership structure
Forecasting team
62
5 Analysis and discussion
The theoretical framework is used to make an analysis of SKF’s current S&OE process, which in
this case specifically means a comparison between the described theoretical S&OE characteristics
and descriptions of SKF’s process. Then, roles and responsibilities of the S&OE team and
stakeholders involved are assessed using the RACI matrix with a focus on roles and
responsibilities of Operational demand manager. Followed by an S&OE maturity model adapted
from Grimson & Pyke (2007). This framework is used to analyze and discuss the S&OE maturity.
The relevant gaps that are identified are then subsequently systematically prioritized according to
how viable filling of a certain gap would be and what outcome it would entail, as for enabling the
creation of a structured plan for action.
5.2 Comparison of characteristics with SKF’s current
S&OE process
In this section, the characteristics of SKF’s current S&OE process is analyzed and discussed with
existing S&OE model in literature i.e. the proposed S&OE model by Carvalho (2018). The S&OE
process is specifically conducted in SKF’s industrial market where there is wide range of product
portfolios which is distributed among large number of customers whose purchasing contribution
is very less to overall demand of the product. For example, for a product in industrial market, a
customer contributes 0.1 or 1% to the overall demand of the product. This makes the inflow of
abnormal demand from large number of customers a major factor to decrease the forecast
accuracy; in turn making it difficult for statistical forecasting when it is aggregated to higher
levels. Hence, the goal of S&OE at SKF is to control the inflow of abnormal demand on SKU
level because of product complexities.
Process Model
The S&OE process takes place over the horizon of 4 months considering product granularity
which is at SKU location level. But there is no product segregation done at SKF, i.e. SKU level
for critical products and subfamily level for non-critical products (Carvalho, 2018). In the current
context of SKF, as there is a large portfolio of products distributed among a large number of
customers, there are difficulties in segregating products with regard to receiving high variations
in demand. Since recently, abnormal demand is segregated with the aid of a large order filter in
the demand chain control tower which distinguishes an item quantity wise which has received a
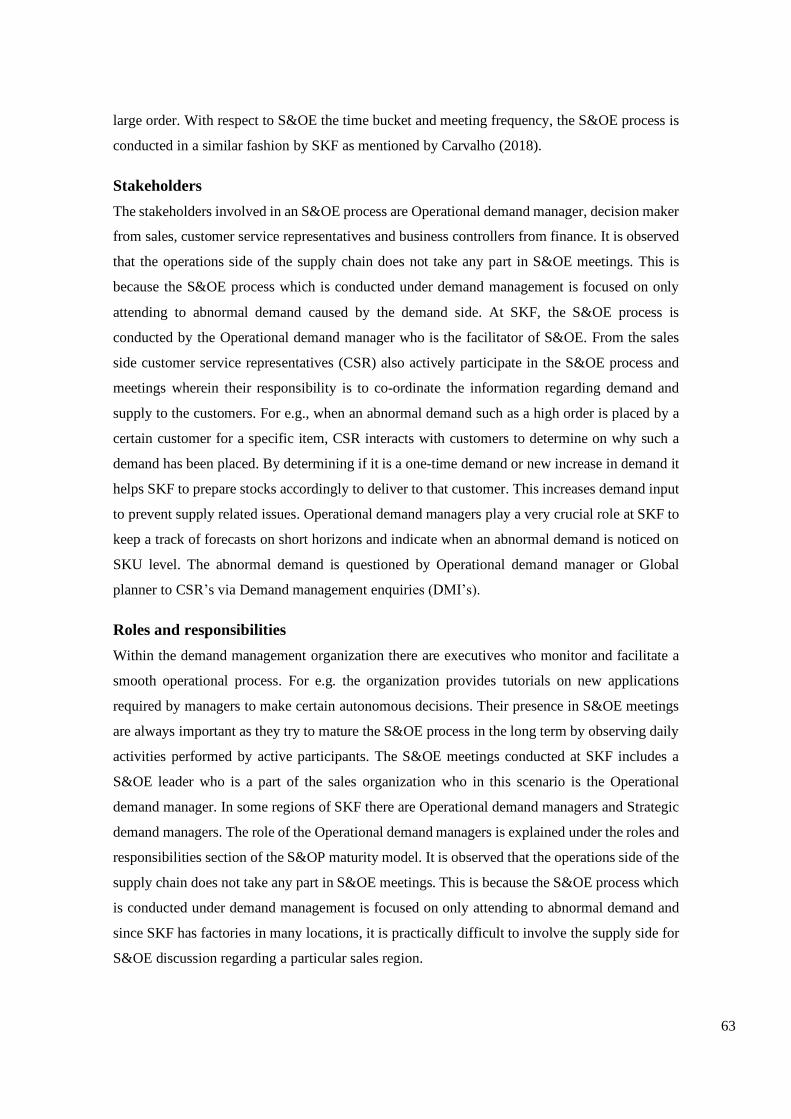
63
large order. With respect to S&OE the time bucket and meeting frequency, the S&OE process is
conducted in a similar fashion by SKF as mentioned by Carvalho (2018).
Stakeholders
The stakeholders involved in an S&OE process are Operational demand manager, decision maker
from sales, customer service representatives and business controllers from finance. It is observed
that the operations side of the supply chain does not take any part in S&OE meetings. This is
because the S&OE process which is conducted under demand management is focused on only
attending to abnormal demand caused by the demand side. At SKF, the S&OE process is
conducted by the Operational demand manager who is the facilitator of S&OE. From the sales
side customer service representatives (CSR) also actively participate in the S&OE process and
meetings wherein their responsibility is to co-ordinate the information regarding demand and
supply to the customers. For e.g., when an abnormal demand such as a high order is placed by a
certain customer for a specific item, CSR interacts with customers to determine on why such a
demand has been placed. By determining if it is a one-time demand or new increase in demand it
helps SKF to prepare stocks accordingly to deliver to that customer. This increases demand input
to prevent supply related issues. Operational demand managers play a very crucial role at SKF to
keep a track of forecasts on short horizons and indicate when an abnormal demand is noticed on
SKU level. The abnormal demand is questioned by Operational demand manager or Global
planner to CSR’s via Demand management enquiries (DMI’s).
Roles and responsibilities
Within the demand management organization there are executives who monitor and facilitate a
smooth operational process. For e.g. the organization provides tutorials on new applications
required by managers to make certain autonomous decisions. Their presence in S&OE meetings
are always important as they try to mature the S&OE process in the long term by observing daily
activities performed by active participants. The S&OE meetings conducted at SKF includes a
S&OE leader who is a part of the sales organization who in this scenario is the Operational
demand manager. In some regions of SKF there are Operational demand managers and Strategic
demand managers. The role of the Operational demand managers is explained under the roles and
responsibilities section of the S&OP maturity model. It is observed that the operations side of the
supply chain does not take any part in S&OE meetings. This is because the S&OE process which
is conducted under demand management is focused on only attending to abnormal demand and
since SKF has factories in many locations, it is practically difficult to involve the supply side for
S&OE discussion regarding a particular sales region.
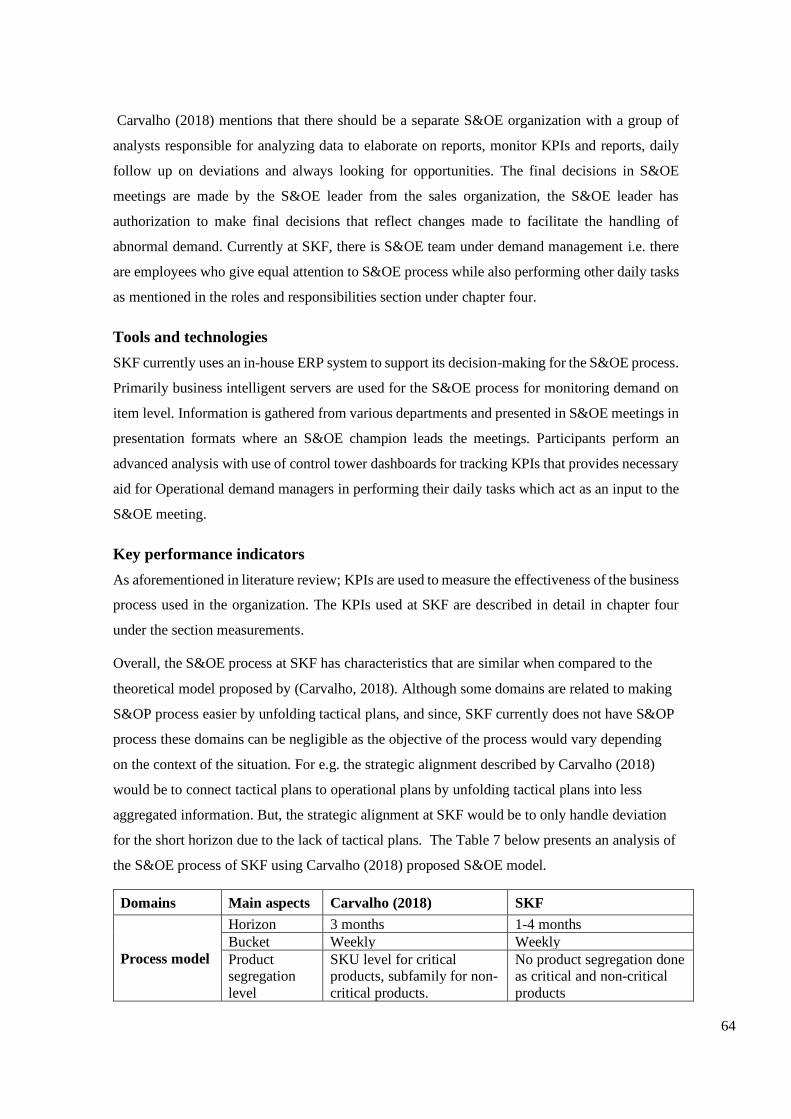
64
Carvalho (2018) mentions that there should be a separate S&OE organization with a group of
analysts responsible for analyzing data to elaborate on reports, monitor KPIs and reports, daily
follow up on deviations and always looking for opportunities. The final decisions in S&OE
meetings are made by the S&OE leader from the sales organization, the S&OE leader has
authorization to make final decisions that reflect changes made to facilitate the handling of
abnormal demand. Currently at SKF, there is S&OE team under demand management i.e. there
are employees who give equal attention to S&OE process while also performing other daily tasks
as mentioned in the roles and responsibilities section under chapter four.
Tools and technologies
SKF currently uses an in-house ERP system to support its decision-making for the S&OE process.
Primarily business intelligent servers are used for the S&OE process for monitoring demand on
item level. Information is gathered from various departments and presented in S&OE meetings in
presentation formats where an S&OE champion leads the meetings. Participants perform an
advanced analysis with use of control tower dashboards for tracking KPIs that provides necessary
aid for Operational demand managers in performing their daily tasks which act as an input to the
S&OE meeting.
Key performance indicators
As aforementioned in literature review; KPIs are used to measure the effectiveness of the business
process used in the organization. The KPIs used at SKF are described in detail in chapter four
under the section measurements.
Overall, the S&OE process at SKF has characteristics that are similar when compared to the
theoretical model proposed by (Carvalho, 2018). Although some domains are related to making
S&OP process easier by unfolding tactical plans, and since, SKF currently does not have S&OP
process these domains can be negligible as the objective of the process would vary depending
on the context of the situation. For e.g. the strategic alignment described by Carvalho (2018)
would be to connect tactical plans to operational plans by unfolding tactical plans into less
aggregated information. But, the strategic alignment at SKF would be to only handle deviation
for the short horizon due to the lack of tactical plans. The Table 7 below presents an analysis of
the S&OE process of SKF using Carvalho (2018) proposed S&OE model.
Domains Main aspects Carvalho (2018) SKF
Process model
Horizon 3 months 1-4 months
Bucket Weekly Weekly
Product segregation
level
SKU level for critical products, subfamily for non-
critical products.
No product segregation done as critical and non-critical
products
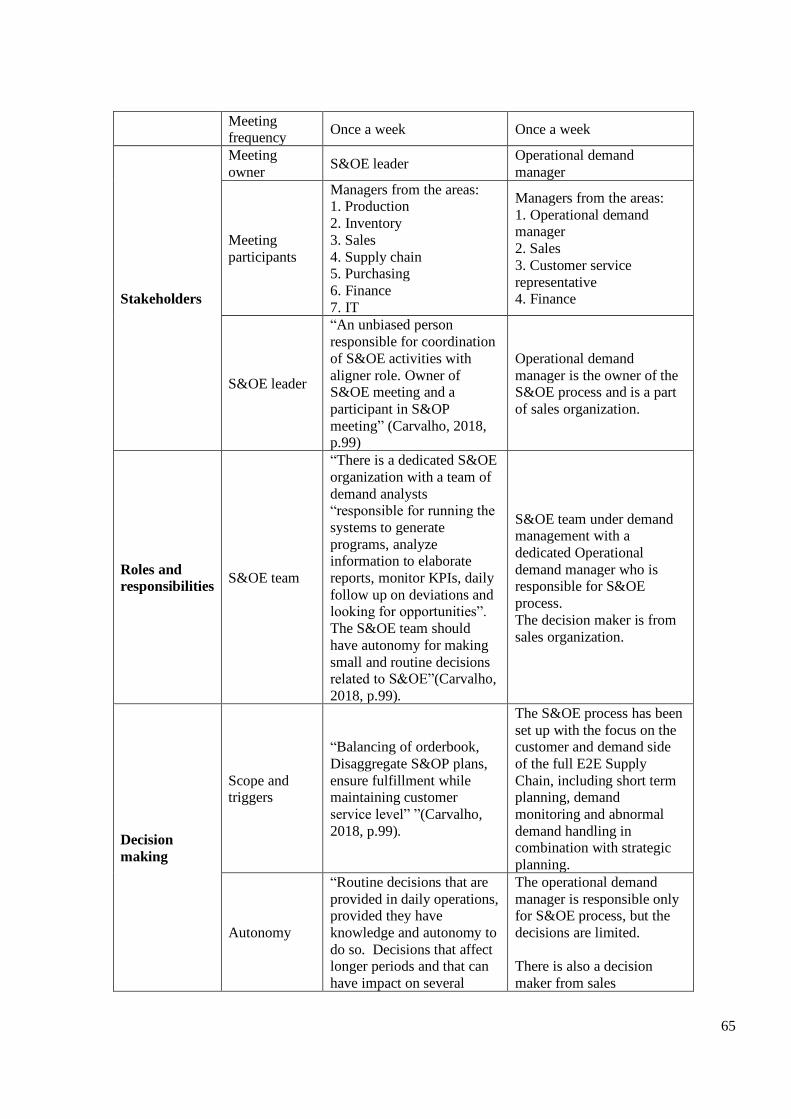
65
Meeting frequency
Once a week Once a week
Stakeholders
Meeting
owner S&OE leader
Operational demand
manager
Meeting
participants
Managers from the areas: 1. Production
2. Inventory
3. Sales
4. Supply chain 5. Purchasing
6. Finance
7. IT
Managers from the areas:
1. Operational demand manager
2. Sales
3. Customer service
representative 4. Finance
S&OE leader
“An unbiased person
responsible for coordination
of S&OE activities with
aligner role. Owner of S&OE meeting and a
participant in S&OP
meeting” (Carvalho, 2018, p.99)
Operational demand
manager is the owner of the S&OE process and is a part
of sales organization.
Roles and
responsibilities S&OE team
“There is a dedicated S&OE
organization with a team of
demand analysts “responsible for running the
systems to generate
programs, analyze information to elaborate
reports, monitor KPIs, daily
follow up on deviations and looking for opportunities”.
The S&OE team should
have autonomy for making
small and routine decisions related to S&OE”(Carvalho,
2018, p.99).
S&OE team under demand management with a
dedicated Operational
demand manager who is responsible for S&OE
process.
The decision maker is from
sales organization.
Decision
making
Scope and triggers
“Balancing of orderbook,
Disaggregate S&OP plans,
ensure fulfillment while maintaining customer
service level” ”(Carvalho,
2018, p.99).
The S&OE process has been
set up with the focus on the customer and demand side
of the full E2E Supply
Chain, including short term planning, demand
monitoring and abnormal
demand handling in combination with strategic
planning.
Autonomy
“Routine decisions that are
provided in daily operations, provided they have
knowledge and autonomy to
do so. Decisions that affect longer periods and that can
have impact on several
The operational demand
manager is responsible only for S&OE process, but the
decisions are limited.
There is also a decision
maker from sales
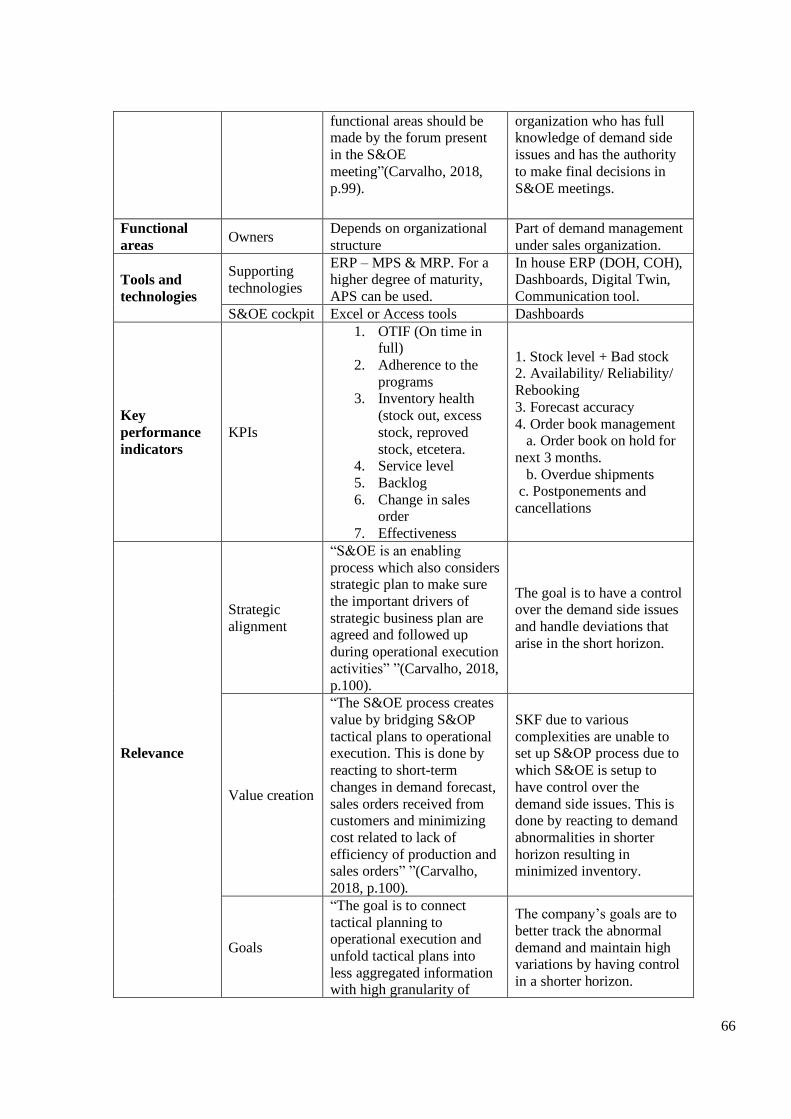
66
functional areas should be made by the forum present
in the S&OE
meeting”(Carvalho, 2018,
p.99).
organization who has full knowledge of demand side
issues and has the authority
to make final decisions in
S&OE meetings.
Functional
areas Owners
Depends on organizational
structure
Part of demand management
under sales organization.
Tools and
technologies
Supporting
technologies
ERP – MPS & MRP. For a higher degree of maturity,
APS can be used.
In house ERP (DOH, COH), Dashboards, Digital Twin,
Communication tool. S&OE cockpit Excel or Access tools Dashboards
Key
performance
indicators
KPIs
1. OTIF (On time in full)
2. Adherence to the
programs 3. Inventory health
(stock out, excess
stock, reproved
stock, etcetera. 4. Service level
5. Backlog
6. Change in sales order
7. Effectiveness
1. Stock level + Bad stock 2. Availability/ Reliability/
Rebooking
3. Forecast accuracy
4. Order book management a. Order book on hold for
next 3 months.
b. Overdue shipments c. Postponements and
cancellations
Relevance
Strategic
alignment
“S&OE is an enabling
process which also considers strategic plan to make sure
the important drivers of
strategic business plan are agreed and followed up
during operational execution
activities” ”(Carvalho, 2018,
p.100).
The goal is to have a control over the demand side issues
and handle deviations that
arise in the short horizon.
Value creation
“The S&OE process creates
value by bridging S&OP
tactical plans to operational execution. This is done by
reacting to short-term
changes in demand forecast,
sales orders received from customers and minimizing
cost related to lack of
efficiency of production and sales orders” ”(Carvalho,
2018, p.100).
SKF due to various
complexities are unable to set up S&OP process due to
which S&OE is setup to
have control over the
demand side issues. This is done by reacting to demand
abnormalities in shorter
horizon resulting in minimized inventory.
Goals
“The goal is to connect
tactical planning to operational execution and
unfold tactical plans into
less aggregated information with high granularity of
The company’s goals are to
better track the abnormal
demand and maintain high variations by having control
in a shorter horizon.

67
data” ”(Carvalho, 2018, p.100)
Table 7: Comparison of characteristics of Carvalho (2018) versus SKFs process. Source:
Author’s Contribution.
5.3 Roles and responsibilities matrix
Based on the workflow of S&OE process, from the observation in S&OE meetings, interview
with subject matter experts and understanding the current roles and responsibilities of Operational
demand manager, a responsibility matrix was developed which is self-explained in Table 8. This
Table 8 consists of main activities i.e. deviation handling and abnormal demand management,
documentation of S&OE process deviations and making actionable plans/ decisions. Also, “R”
indicates Responsible, “A” indicates accountability, “C” indicates consulted and “I” indicates
informed.
Deliverable /
Activity
Op.
demand
manager
CSR
(Sales)
Decision
maker
from
sales
Supply
planner/
Global
Planner
Subject
matter
experts
1 Evaluate deviations and opportunities from demand and supply inputs based on the set
KPIs to provide insights on abnormal demand.
1(a) Evaluate deviations and
opportunities from demand and supply inputs.
R R/A
1(b) Raise a demand management
enquiry (DMI) against abnormal demand to customer
service representative.
R A R
1(c) Evaluate KPIs such as
reliability, availability, bad stock, etcetera.
R R A R
1(d) Review the abnormal demand
and send the enquiries to
customer service representative (CSR).
R C R/A
1(e) Gather quality market
intelligence to respond to DMIs R/A I
1(f) Manage abnormal demand and
plan change requests. R C R/A
2 Prepare agenda for S&OE meeting and demand control
report consisting of
documentation of deviations
R C C C I

68
3 Make an actionable plans/ decision related to S&OE
R A
Table 8: RACI matrix for S&OE process. Source: Author’s contribution.
When compared to the available theory of demand execution manager as mentioned in Lindsey
(2019) against the roles and responsibilities of SKF’s Operational demand manager gaps were
identified. Firstly, it was analyzed that the Operational demand manager does not spend time
analyzing the S&OP plan or demand plan against the customer orders received. This is mainly
due to the reason that forecasting system can generate forecasts on item location level if high
granularity is considered, but there is no forecasting done on customer level. Hence, there is no
proactive reconciliation of customer order against the demand plan or S&OP plan received.
Secondly, there is no scenario analysis done in cases where demand materializes differently than
planned i.e. in case when demand exceeds more than supply as well when supply exceeds more
than demand. Thirdly, the demand execution manager can also participate in S&OP meetings of
the respective sales region to have a better understanding of the agreed demand plan. Lastly, the
demand execution manager should stress on the importance of forecast accuracy and effectiveness
of meeting and ensure that effectiveness is improved consistently. Based on these gaps identified,
the roles and responsibilities of demand execution manager were compared against the same roles
of different companies to arrive at a more practical solution to the case company. This
recommendation was checked with Subject matter experts (SME) to get further inputs of SKF’s
business scenario to refine the recommendations. Hence, the same is reflected in table 8.
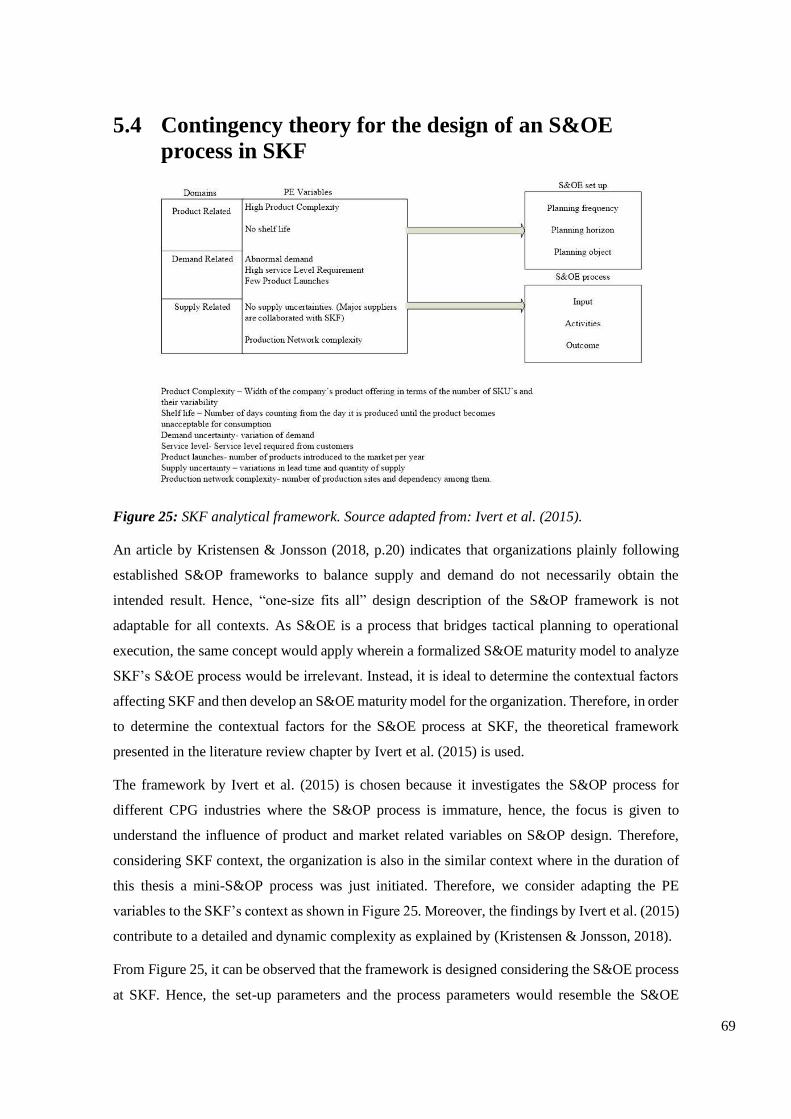
69
5.4 Contingency theory for the design of an S&OE
process in SKF
Figure 25: SKF analytical framework. Source adapted from: Ivert et al. (2015).
An article by Kristensen & Jonsson (2018, p.20) indicates that organizations plainly following
established S&OP frameworks to balance supply and demand do not necessarily obtain the
intended result. Hence, “one-size fits all” design description of the S&OP framework is not
adaptable for all contexts. As S&OE is a process that bridges tactical planning to operational
execution, the same concept would apply wherein a formalized S&OE maturity model to analyze
SKF’s S&OE process would be irrelevant. Instead, it is ideal to determine the contextual factors
affecting SKF and then develop an S&OE maturity model for the organization. Therefore, in order
to determine the contextual factors for the S&OE process at SKF, the theoretical framework
presented in the literature review chapter by Ivert et al. (2015) is used.
The framework by Ivert et al. (2015) is chosen because it investigates the S&OP process for
different CPG industries where the S&OP process is immature, hence, the focus is given to
understand the influence of product and market related variables on S&OP design. Therefore,
considering SKF context, the organization is also in the similar context where in the duration of
this thesis a mini-S&OP process was just initiated. Therefore, we consider adapting the PE
variables to the SKF’s context as shown in Figure 25. Moreover, the findings by Ivert et al. (2015)
contribute to a detailed and dynamic complexity as explained by (Kristensen & Jonsson, 2018).
From Figure 25, it can be observed that the framework is designed considering the S&OE process
at SKF. Hence, the set-up parameters and the process parameters would resemble the S&OE

70
process at SKF while the domains of the PE variables would remain the same as these variables
are used in both the S&OP and the S&OE process. The PE variables are segregated based on the
relation of product, demand, and supply. Each one of them are explained in detail below with
respect to SKF.
The PE variable that is product related is chosen to be high product complexity. There is a high
product complexity based on SKF’s product offering in the industrial market, as it contributes to
many products that are offered to end customers i.e. products such as bearing, lubrications, seals,
aftermarket parts of automotive industry and many others. Therefore, due to a wide range of
product portfolios of SKF’s industrial market there is immense complexity in the product offering
at SKF. With regard to the variable of shelf life, it is determined that this variable is irrelevant for
the SKF’s context as SKF produces non-perishable products. Hence, this variable is not
considered when developing the S&OE maturity model for SKF.
The PE variable that is demand related is chosen to be abnormal demand from customers. This is
due to the reason that SKF’s S&OE process primarily aims at managing abnormal demand placed
by customers. In the industrial sector of SKF due to many SKU’s, many customers and lack of
collaborative planning forecast it is hard to obtain a high forecast accuracy on demand of products
or items on SKU level. Hence, currently the demand obtained is only from statistical forecast tool
(S099) which forecasts the demand based on the dates of products shipped and quantities that are
shipped to the particular customer. When customers place an unexpected order in terms of
quantities and delivery date required it affects the statistical forecast in a way that considers that
the same customer will place the same order again. But, in reality, the customers would like to
have that order delivered only once. Therefore, it requires the Operational demand manager to
remove the unexpected order from the statistical forecast and distinguish it from other normal
orders. Thus, the demand management organization at SKF is continuously trying to serve the
abnormal demand from customers.
With respect to the variable of service level; as SKF is a primary supplier for many industries; it
is important that items that are ordered by customers are available in stock and delivered on time
to prevent any disruption in the customers supply chain. Despite the abnormal demand, SKF
considers all customers as important. With the S&OE process, SKF is trying to serve all the
customers to maintain their service levels agreed with their customers. Therefore, SKF has given
importance in monitoring their service levels by placing KPIs in S&OE process which reflect on
the overall performance and service level. With respect to new product launch, it is observed that
SKF’s new products that are launched are primarily related to technological advancements. This
occurs only when a specific customer orders a product based on certain specifications. But,
71
majority of the products that customers use is based on already existing products that SKF
produces regularly. Therefore, this variable is chosen to be a few product launches per year.
In the S&OE meetings conducted on a weekly basis it is observed that variables relating to supply
are hardly discussed. This is due to the reason that major suppliers are collaborated with SKF
which rules out most of the supply uncertainties i.e. variations in lead time, quality, and quantity
of supply. But, with respect to production network complexity it is observed that a few of SKF’s
products at a few production sites undergo the process of kitting, hence, there can be issues related
to production capacity which can affect delivering customers on the right time. But the variable
of production complexity is not taken as an important factor as problems related to production
complexity are not discussed at SKU level, but, rather on an aggregated product level. Another
factor to consider is, as mentioned before, the S&OE process at SKF is primarily about managing
abnormal demand according to supply. At present, SKF has make to stock environment, make to
order environment and less of engineer to order environment. Hence, based on the production
environment and on the observance of inventory levels, it is considered that SKF has sufficient
stock but, it is the priority and handling of orders placed by customers that serve the purpose of
S&OE at SKF. Hence, for the development of the S&OE maturity model supply side of the S&OE
process is not considered. The PE variable for supply is no supply uncertainties.
The setup parameters as mentioned in the theoretical framework consists of planning objects,
planning horizon and planning frequency. With regards to the planning objects, the S&OE process
at SKF deals with items on SKU level as mentioned theoretically by Carvalho (2018) and
Chainalytics (2019). Due to the immense product complexity in the industrial market and
abnormal demand from customers aggregating the demand and then drilling down to serve the
customer is a tedious task and time consuming. Therefore, to directly manage the abnormal
demand it is efficient and effective when operational demand managers look at specific items
ordered by customers to determine if the order can be delivered or not. The planning horizon at
SKF in the S&OE process is three to four months. This plan is done in order to determine on how
to serve the customer orders on specific items up to this time period. A longer planning horizon
would reflect in an S&OP process which in this case scenario it is not considered.
S&OE in other words is a deviation handling process wherein stakeholders look on how to
manage abnormal demand and monitor the major affecting KPIs. Plans that are made for three to
four-month horizon are either followed or updated on a weekly basis in terms of weekly meetings.
Also, by having weekly meetings it serves the purpose of managing abnormal demand
collaboratively among different departments frequently.
72
The process parameters described by Ivert et al. (2015) are inputs, activities, and outputs. From
the S&OE process at SKF it is observed that the input activities are creating short-term plans.
Whereas, the activities conducted in the S&OE process are monitoring and managing KPIs,
conducting weekly meetings and managing abnormal demand with internal coordination among
stakeholders. The outcome of the process is to integrate all cross-functional activities from
different departments and obtain balance in demand and supply.
Ivert et al. (2015) contributes to how the PE variable can be linked to S&OP set-up and process
parameters. Hence, considering the S&OE context of SKF a description is given below on how
the PE variables are linked to S&OE set-up and process parameters.
The PE variable of high product complexity at SKF due to a large product portfolio and abnormal
demand can be directly linked to the S&OE set-up and process parameters. As mentioned before,
there is a wide range of products offered in the industrial market at SKF, hence, the abnormal
demand from customers cannot be aggregated into product families as it would require the need
to drill down again to determine which item has a specific demand. Hence, by looking at demand
on an SKU level, which is the focus of the S&OE process, planning objects of the S&OE set-up
parameter can be linked to PE variables of product complexity and abnormal demand. The same
PE environments are also considered as an input to the S&OE process parameters which also
satisfies the conclusion made by (Carvalho, 2018).
At SKF the goal of the S&OE process is to manage abnormal demand on the short-term. When
demand materializes differently than planned the organization is prone to conduct weekly
meetings where plans can be changed or updated in order to deliver the demand. Hence, the PE
variable of abnormal demand is linked to the planning frequency of S&OE set-up parameters.
Maintaining a high service level with customers is a priority for SKF despite having abnormal
demands. By conducting weekly meetings with a focus on delivering to each demand increases
the service level of customers. Hence, the PE variable of service level requirement is also linked
to the activities and outcome of the S&OE process parameter. With respect to PE variable of few
product launches, this variable is not given much importance because only very few new products
are launched in the market depending on technological advancements. But this PE variable is
considered when developing the S&OE maturity model for SKF.
As mentioned before, shelf life is not considered due to SKF producing products that are non-
perishable and hence, this PE variable is also not considered when developing the S&OE maturity
model. PE variables related to supply are not given much importance when analyzing on linking
the supply related variable to S&OE set-up and S&OE process parameters because the S&OE
process at SKF focuses only on product related and demand related variables i.e. the process is
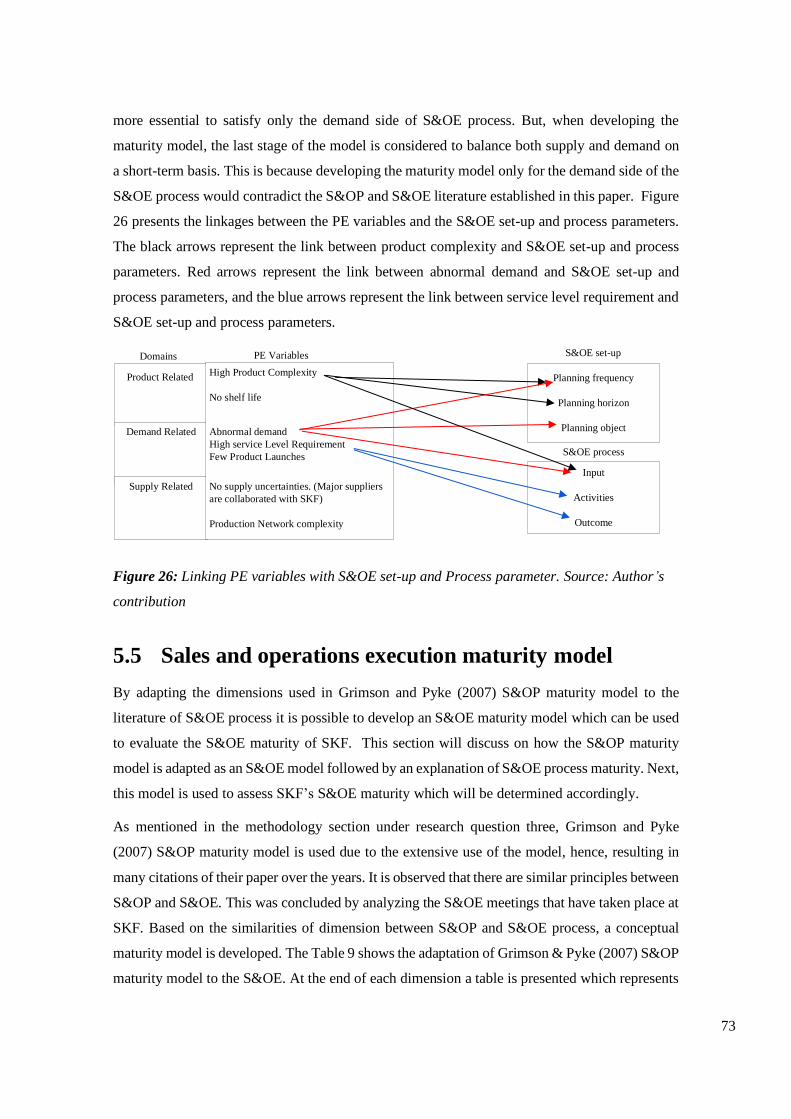
73
more essential to satisfy only the demand side of S&OE process. But, when developing the
maturity model, the last stage of the model is considered to balance both supply and demand on
a short-term basis. This is because developing the maturity model only for the demand side of the
S&OE process would contradict the S&OP and S&OE literature established in this paper. Figure
26 presents the linkages between the PE variables and the S&OE set-up and process parameters.
The black arrows represent the link between product complexity and S&OE set-up and process
parameters. Red arrows represent the link between abnormal demand and S&OE set-up and
process parameters, and the blue arrows represent the link between service level requirement and
S&OE set-up and process parameters.
Demand Related
Supply Related
Product Related High Product Complexity
No shelf life
Abnormal demand
High service Level Requirement
Few Product Launches
No supply uncertainties. (Major suppliers
are collaborated with SKF)
Production Network complexity
Planning frequency
Planning horizon
Planning object
S&OE process
Input
Activities
Outcome
PE VariablesDomains S&OE set-up
Figure 26: Linking PE variables with S&OE set-up and Process parameter. Source: Author’s
contribution
5.5 Sales and operations execution maturity model
By adapting the dimensions used in Grimson and Pyke (2007) S&OP maturity model to the
literature of S&OE process it is possible to develop an S&OE maturity model which can be used
to evaluate the S&OE maturity of SKF. This section will discuss on how the S&OP maturity
model is adapted as an S&OE model followed by an explanation of S&OE process maturity. Next,
this model is used to assess SKF’s S&OE maturity which will be determined accordingly.
As mentioned in the methodology section under research question three, Grimson and Pyke
(2007) S&OP maturity model is used due to the extensive use of the model, hence, resulting in
many citations of their paper over the years. It is observed that there are similar principles between
S&OP and S&OE. This was concluded by analyzing the S&OE meetings that have taken place at
SKF. Based on the similarities of dimension between S&OP and S&OE process, a conceptual
maturity model is developed. The Table 9 shows the adaptation of Grimson & Pyke (2007) S&OP
maturity model to the S&OE. At the end of each dimension a table is presented which represents
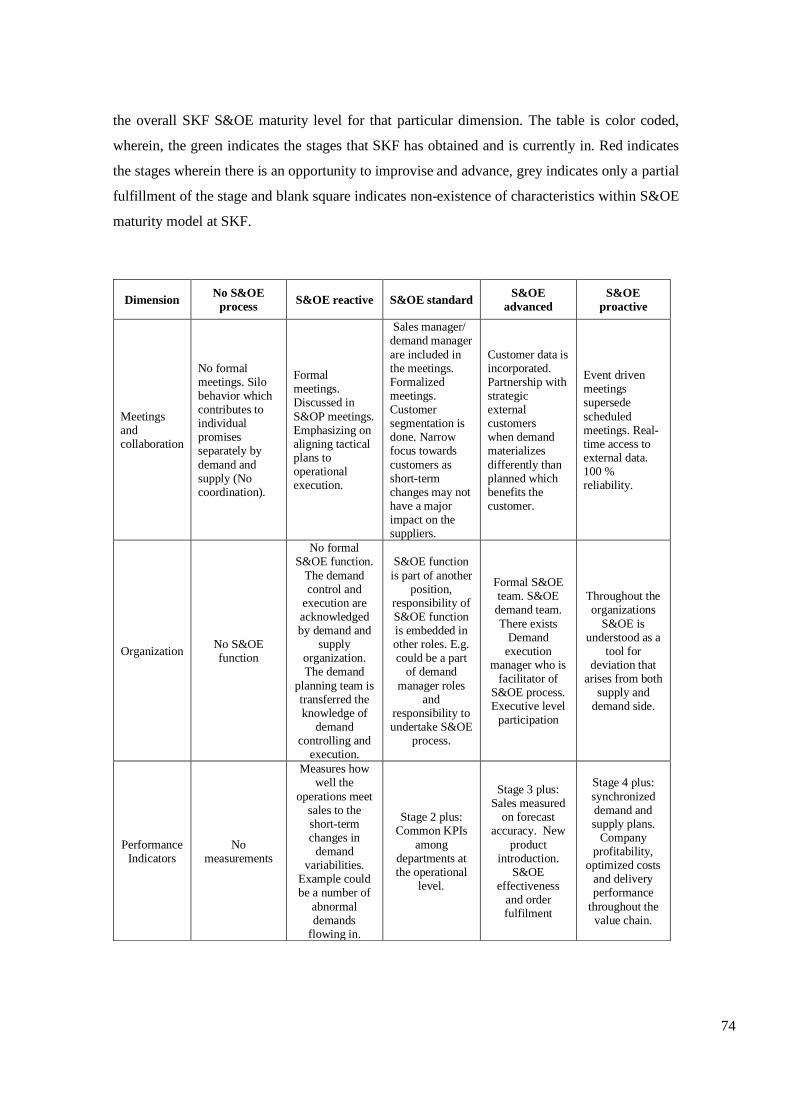
74
the overall SKF S&OE maturity level for that particular dimension. The table is color coded,
wherein, the green indicates the stages that SKF has obtained and is currently in. Red indicates
the stages wherein there is an opportunity to improvise and advance, grey indicates only a partial
fulfillment of the stage and blank square indicates non-existence of characteristics within S&OE
maturity model at SKF.
Dimension No S&OE
process S&OE reactive S&OE standard
S&OE
advanced
S&OE
proactive
Meetings and collaboration
No formal meetings. Silo behavior which contributes to individual promises separately by
demand and supply (No coordination).
Formal meetings. Discussed in
S&OP meetings. Emphasizing on aligning tactical plans to operational execution.
Sales manager/ demand manager
are included in the meetings. Formalized meetings. Customer segmentation is done. Narrow focus towards
customers as short-term changes may not have a major impact on the suppliers.
Customer data is incorporated. Partnership with strategic external customers when demand materializes
differently than planned which benefits the customer.
Event driven meetings supersede
scheduled meetings. Real- time access to external data. 100 % reliability.
Organization No S&OE function
No formal S&OE function.
The demand control and
execution are acknowledged by demand and
supply organization. The demand
planning team is transferred the knowledge of
demand controlling and
execution.
S&OE function
is part of another position,
responsibility of S&OE function is embedded in other roles. E.g. could be a part
of demand
manager roles and
responsibility to undertake S&OE
process.
Formal S&OE team. S&OE demand team.
There exists Demand
execution manager who is
facilitator of S&OE process. Executive level
participation
Throughout the organizations
S&OE is understood as a
tool for deviation that
arises from both supply and
demand side.
Performance Indicators
No measurements
Measures how well the
operations meet sales to the short-term changes in
demand variabilities.
Example could be a number of
abnormal demands
flowing in.
Stage 2 plus: Common KPIs
among departments at the operational
level.
Stage 3 plus: Sales measured
on forecast accuracy. New
product introduction.
S&OE effectiveness
and order fulfilment
Stage 4 plus:
synchronized demand and supply plans.
Company profitability,
optimized costs and delivery performance
throughout the value chain.
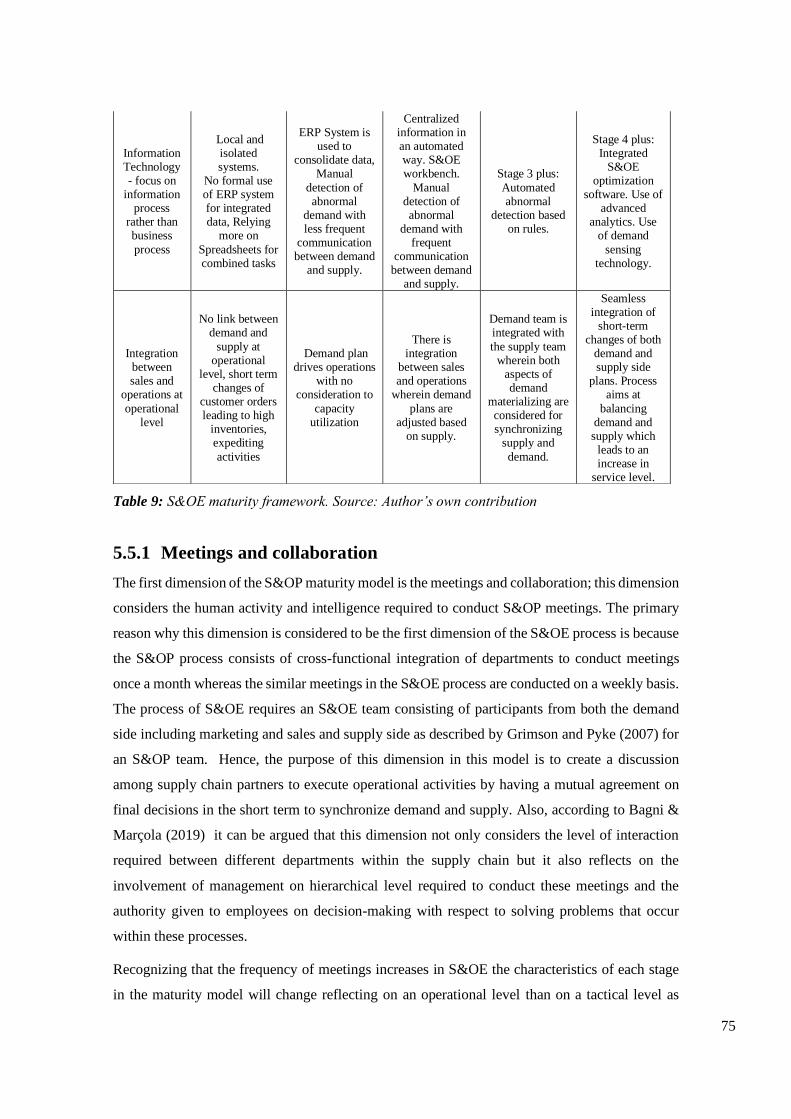
75
Table 9: S&OE maturity framework. Source: Author’s own contribution
5.5.1 Meetings and collaboration
The first dimension of the S&OP maturity model is the meetings and collaboration; this dimension
considers the human activity and intelligence required to conduct S&OP meetings. The primary
reason why this dimension is considered to be the first dimension of the S&OE process is because
the S&OP process consists of cross-functional integration of departments to conduct meetings
once a month whereas the similar meetings in the S&OE process are conducted on a weekly basis.
The process of S&OE requires an S&OE team consisting of participants from both the demand
side including marketing and sales and supply side as described by Grimson and Pyke (2007) for
an S&OP team. Hence, the purpose of this dimension in this model is to create a discussion
among supply chain partners to execute operational activities by having a mutual agreement on
final decisions in the short term to synchronize demand and supply. Also, according to Bagni &
Marçola (2019) it can be argued that this dimension not only considers the level of interaction
required between different departments within the supply chain but it also reflects on the
involvement of management on hierarchical level required to conduct these meetings and the
authority given to employees on decision-making with respect to solving problems that occur
within these processes.
Recognizing that the frequency of meetings increases in S&OE the characteristics of each stage
in the maturity model will change reflecting on an operational level than on a tactical level as
Information Technology - focus on
information process
rather than business
process
Local and isolated systems.
No formal use of ERP system for integrated data, Relying
more on
Spreadsheets for combined tasks
ERP System is used to
consolidate data, Manual
detection of abnormal
demand with less frequent
communication between demand
and supply.
Centralized information in an automated way. S&OE workbench.
Manual detection of abnormal
demand with frequent
communication between demand
and supply.
Stage 3 plus:
Automated abnormal
detection based on rules.
Stage 4 plus: Integrated
S&OE optimization
software. Use of advanced
analytics. Use of demand
sensing technology.
Integration between sales and
operations at
operational level
No link between demand and
supply at operational
level, short term changes of
customer orders leading to high
inventories, expediting
activities
Demand plan drives operations
with no consideration to
capacity utilization
There is integration
between sales and operations
wherein demand
plans are adjusted based
on supply.
Demand team is integrated with
the supply team wherein both
aspects of demand
materializing are considered for synchronizing
supply and
demand.
Seamless integration of
short-term changes of both
demand and supply side
plans. Process aims at
balancing demand and supply which
leads to an increase in
service level.

76
described in the S&OP maturity by Grimson and Pyke (2007). Each maturity stage is explained
below.
In the first stage of this dimension there are no formal meetings and collaboration among
departments. Employees are more likely to have a mentality of not sharing information between
departments within the same company which would result in uncoordinated promises to
customers. In other words, promises are made to the customer from one area of the business
without acknowledging the area of the business that is responsible for satisfying or delivering the
order to that customer (Gattorna and Walter, 1996).
In stage two, senior management is generally involved from both functional areas in creating
mutual understanding and collaboration among departments. However, the discussion in these
meetings is mainly about aligning tactical plans made in S&OP to operational execution for
S&OE process.
In stage three, there is seamless collaboration among functional areas of the supply chain. Plans
are shared from both demand and supply sides in the meeting. From the demand side, Sales and
Demand managers are involved in the meetings to increase the reliability of demand. Whereas
supply chain managers would gather input from sales and aim to minimize any potential fallouts.
Primarily in this stage, the meeting discussion consists of customer segmentation to prioritize the
customers based on service levels and proactively manage supply and demand for the essential
customers, hence, providing a narrow focus to particular customers on the short term (Inc. Oliver
Wight International, 2017).
In stage four of this dimension, the organization creates a partnership with strategic customers for
scenarios of demand materializing differently than planned. Here the customer demand data is
incorporated to some extent. According to Chase & Chase (2016), the scope of partnerships with
strategic customers guarantees that customers’ needs are understood and “embraced”. This
enables the organization to handle demand signals in a controlled manner preventing disruptions
in the organizations supply chain leading to an optimized supply chain.
In stage five, the organizations apply all characteristics of stage 4 but with an inclusion of event-
driven meetings, for e.g. only if it is necessary to conduct meetings when a sophisticated problem
arises. This stage is the most proactive stage where all internal and external data of customers and
the organization is integrated in real time. According to Grimson and Pyke (2007) the benefits for
the organization to advance to this stage would aid sales and operation managers to obtain early
warnings of disruption in the supply chain which enables them to take the corresponding actions
quickly.
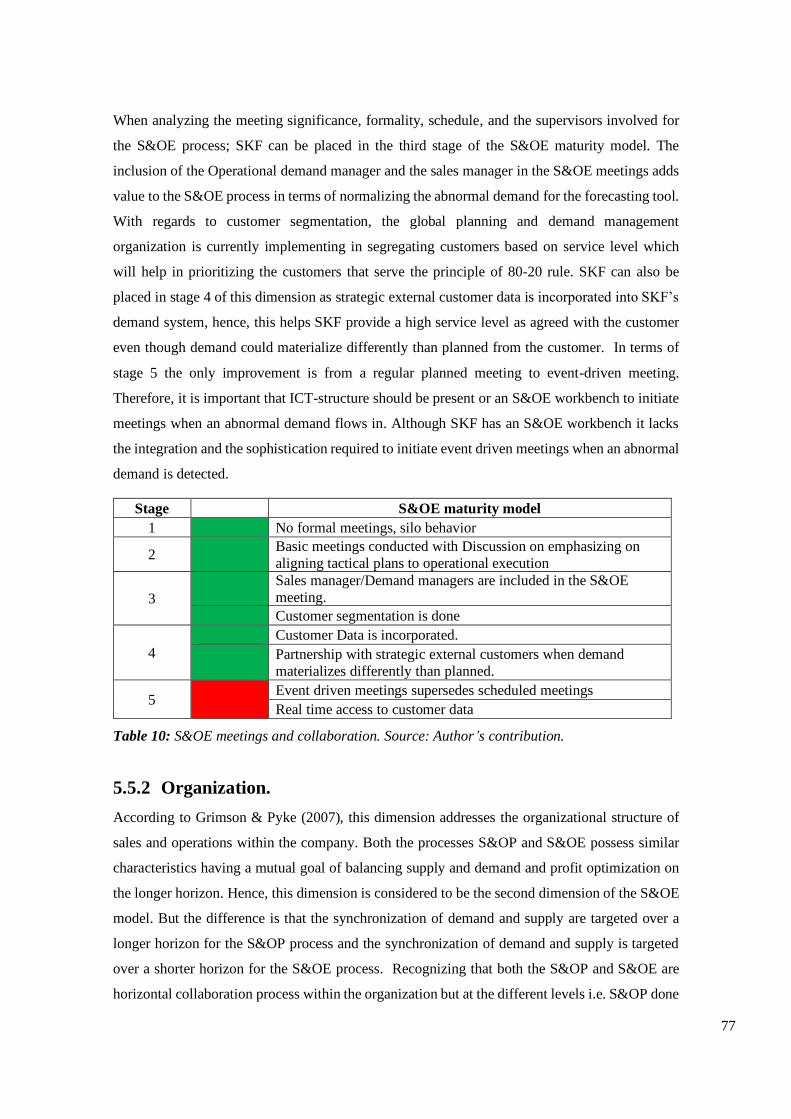
77
When analyzing the meeting significance, formality, schedule, and the supervisors involved for
the S&OE process; SKF can be placed in the third stage of the S&OE maturity model. The
inclusion of the Operational demand manager and the sales manager in the S&OE meetings adds
value to the S&OE process in terms of normalizing the abnormal demand for the forecasting tool.
With regards to customer segmentation, the global planning and demand management
organization is currently implementing in segregating customers based on service level which
will help in prioritizing the customers that serve the principle of 80-20 rule. SKF can also be
placed in stage 4 of this dimension as strategic external customer data is incorporated into SKF’s
demand system, hence, this helps SKF provide a high service level as agreed with the customer
even though demand could materialize differently than planned from the customer. In terms of
stage 5 the only improvement is from a regular planned meeting to event-driven meeting.
Therefore, it is important that ICT-structure should be present or an S&OE workbench to initiate
meetings when an abnormal demand flows in. Although SKF has an S&OE workbench it lacks
the integration and the sophistication required to initiate event driven meetings when an abnormal
demand is detected.
Stage S&OE maturity model
1 No formal meetings, silo behavior
2
Basic meetings conducted with Discussion on emphasizing on
aligning tactical plans to operational execution
3
Sales manager/Demand managers are included in the S&OE
meeting.
Customer segmentation is done
4
Customer Data is incorporated.
Partnership with strategic external customers when demand
materializes differently than planned.
5 Event driven meetings supersedes scheduled meetings
Real time access to customer data
Table 10: S&OE meetings and collaboration. Source: Author’s contribution.
5.5.2 Organization.
According to Grimson & Pyke (2007), this dimension addresses the organizational structure of
sales and operations within the company. Both the processes S&OP and S&OE possess similar
characteristics having a mutual goal of balancing supply and demand and profit optimization on
the longer horizon. Hence, this dimension is considered to be the second dimension of the S&OE
model. But the difference is that the synchronization of demand and supply are targeted over a
longer horizon for the S&OP process and the synchronization of demand and supply is targeted
over a shorter horizon for the S&OE process. Recognizing that both the S&OP and S&OE are
horizontal collaboration process within the organization but at the different levels i.e. S&OP done
78
at tactical levels and S&OE which bridges tactical level to operational level. Hence, the
characteristics of each level in the maturity model will change which is as explained maturity
stages below:
In the first stage of this maturity model, there is no S& OE function as the S&OE process / demand
control and execution is not acknowledged by the organization. There is no knowledge about the
S&OE process and the benefits of S&OE that could be delivered to the organization. This is
similar to the first stage in S&OP maturity model where there is no S&OP function and is not
even part of another function (Grimson & Pyke, 2007).
The second stage of S&OE defined as S&OE reactive is where the S&OE process is
acknowledged in organization. Here the tasks of S&OE process are fulfilled by others and again
there is no formal function dedicated to the S&OE process. In stage two the S&OE is a process
that can help in operational activities by managing demand. It is only discussed within the
organization on an executive level but there is no formal implementation procedure, the roles and
responsibility of participants are not set, the executive support is still low and the process itself is
still yet to be thought through for the benefit of the company. This is like the stage 2 organization
dimension of Grimson & Pyke (2007), where there is no formal function and the tasks are fulfilled
by others in the organization.
In the third stage of S&OE maturity model, S&OE function is a part of other position i.e. roles
and responsibilities of S&OE processes is embedded in roles of other position. For instance, the
Demand manager would work both on demand planning and S&OE process. This is as
mentioned in the roles and responsibilities of Demand manager from Palmatier & Crum (2003).
According to Palmatier & Crum (2003) where one among the duties and responsibilities is to
manage change and balance in supply and demand in order to achieve optimal balance between
the stability of supply and customer responsiveness.
The fourth stage known as S&OE advanced is where the S&OE process is recognized in the
organization. For instance, there is a dedicated position called demand execution or demand
fulfillment specialist or demand controller who is the facilitator of S&OE process and S&OE is a
formalized part of his/her job. This is as explained in the webinars by Lindsey (2019) and Holmes
(2015), where there is mention of the role of dedicated individual for fulfilling the roles and
responsibilities of the S&OE process. Another characteristic of this stage is the S&OE team that
has executive level participation for supporting the S&OE team in decision-making or giving out
suggestions to action plans.
In stage 5, S&OE process has a formal S&OE team with executive level participation and is well-
recognized and respected throughout the organization as a tool for handling variabilities from
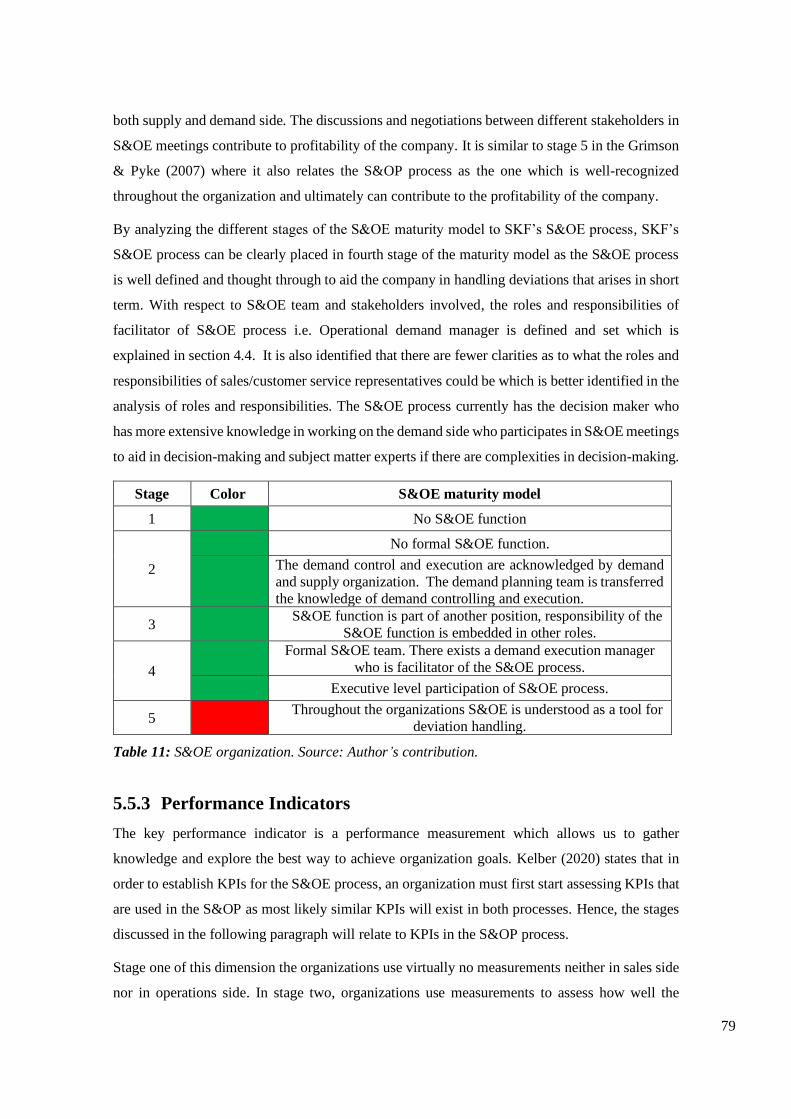
79
both supply and demand side. The discussions and negotiations between different stakeholders in
S&OE meetings contribute to profitability of the company. It is similar to stage 5 in the Grimson
& Pyke (2007) where it also relates the S&OP process as the one which is well-recognized
throughout the organization and ultimately can contribute to the profitability of the company.
By analyzing the different stages of the S&OE maturity model to SKF’s S&OE process, SKF’s
S&OE process can be clearly placed in fourth stage of the maturity model as the S&OE process
is well defined and thought through to aid the company in handling deviations that arises in short
term. With respect to S&OE team and stakeholders involved, the roles and responsibilities of
facilitator of S&OE process i.e. Operational demand manager is defined and set which is
explained in section 4.4. It is also identified that there are fewer clarities as to what the roles and
responsibilities of sales/customer service representatives could be which is better identified in the
analysis of roles and responsibilities. The S&OE process currently has the decision maker who
has more extensive knowledge in working on the demand side who participates in S&OE meetings
to aid in decision-making and subject matter experts if there are complexities in decision-making.
Stage Color S&OE maturity model
1 No S&OE function
2
No formal S&OE function.
The demand control and execution are acknowledged by demand
and supply organization. The demand planning team is transferred
the knowledge of demand controlling and execution.
3
S&OE function is part of another position, responsibility of the
S&OE function is embedded in other roles.
4
Formal S&OE team. There exists a demand execution manager
who is facilitator of the S&OE process.
Executive level participation of S&OE process.
5
Throughout the organizations S&OE is understood as a tool for
deviation handling.
Table 11: S&OE organization. Source: Author’s contribution.
5.5.3 Performance Indicators
The key performance indicator is a performance measurement which allows us to gather
knowledge and explore the best way to achieve organization goals. Kelber (2020) states that in
order to establish KPIs for the S&OE process, an organization must first start assessing KPIs that
are used in the S&OP as most likely similar KPIs will exist in both processes. Hence, the stages
discussed in the following paragraph will relate to KPIs in the S&OP process.
Stage one of this dimension the organizations use virtually no measurements neither in sales side
nor in operations side. In stage two, organizations use measurements to assess how well the
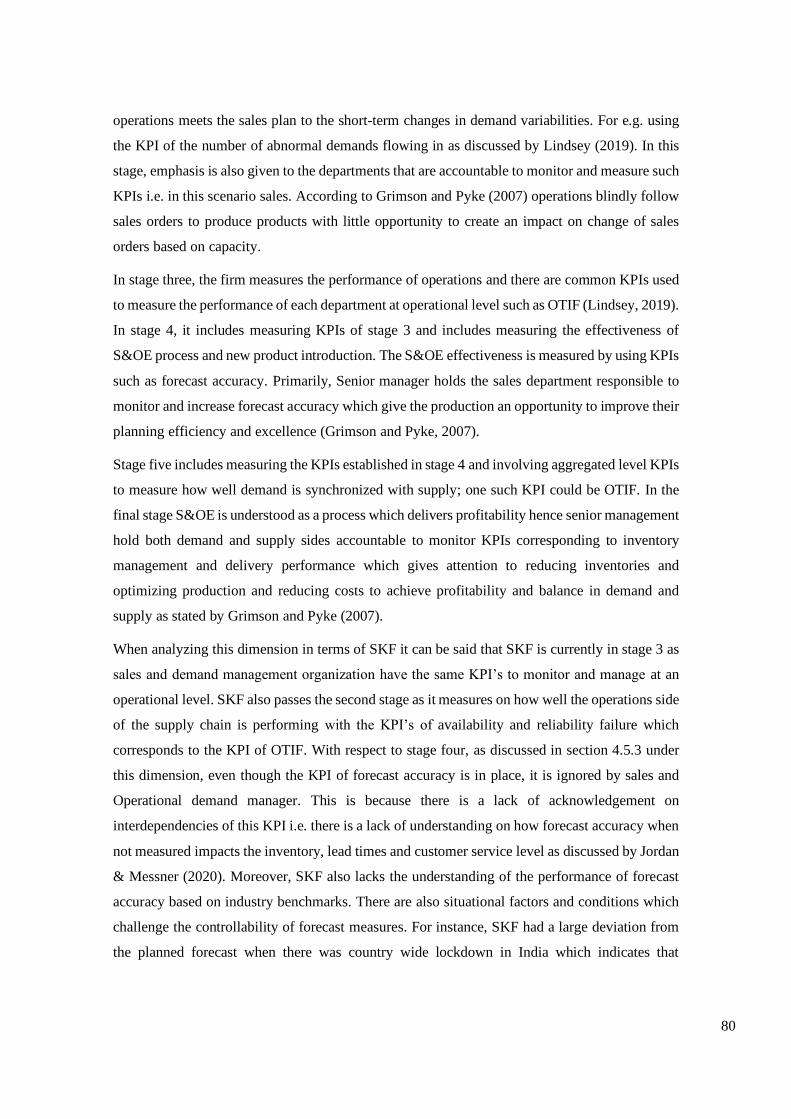
80
operations meets the sales plan to the short-term changes in demand variabilities. For e.g. using
the KPI of the number of abnormal demands flowing in as discussed by Lindsey (2019). In this
stage, emphasis is also given to the departments that are accountable to monitor and measure such
KPIs i.e. in this scenario sales. According to Grimson and Pyke (2007) operations blindly follow
sales orders to produce products with little opportunity to create an impact on change of sales
orders based on capacity.
In stage three, the firm measures the performance of operations and there are common KPIs used
to measure the performance of each department at operational level such as OTIF (Lindsey, 2019).
In stage 4, it includes measuring KPIs of stage 3 and includes measuring the effectiveness of
S&OE process and new product introduction. The S&OE effectiveness is measured by using KPIs
such as forecast accuracy. Primarily, Senior manager holds the sales department responsible to
monitor and increase forecast accuracy which give the production an opportunity to improve their
planning efficiency and excellence (Grimson and Pyke, 2007).
Stage five includes measuring the KPIs established in stage 4 and involving aggregated level KPIs
to measure how well demand is synchronized with supply; one such KPI could be OTIF. In the
final stage S&OE is understood as a process which delivers profitability hence senior management
hold both demand and supply sides accountable to monitor KPIs corresponding to inventory
management and delivery performance which gives attention to reducing inventories and
optimizing production and reducing costs to achieve profitability and balance in demand and
supply as stated by Grimson and Pyke (2007).
When analyzing this dimension in terms of SKF it can be said that SKF is currently in stage 3 as
sales and demand management organization have the same KPI’s to monitor and manage at an
operational level. SKF also passes the second stage as it measures on how well the operations side
of the supply chain is performing with the KPI’s of availability and reliability failure which
corresponds to the KPI of OTIF. With respect to stage four, as discussed in section 4.5.3 under
this dimension, even though the KPI of forecast accuracy is in place, it is ignored by sales and
Operational demand manager. This is because there is a lack of acknowledgement on
interdependencies of this KPI i.e. there is a lack of understanding on how forecast accuracy when
not measured impacts the inventory, lead times and customer service level as discussed by Jordan
& Messner (2020). Moreover, SKF also lacks the understanding of the performance of forecast
accuracy based on industry benchmarks. There are also situational factors and conditions which
challenge the controllability of forecast measures. For instance, SKF had a large deviation from
the planned forecast when there was country wide lockdown in India which indicates that
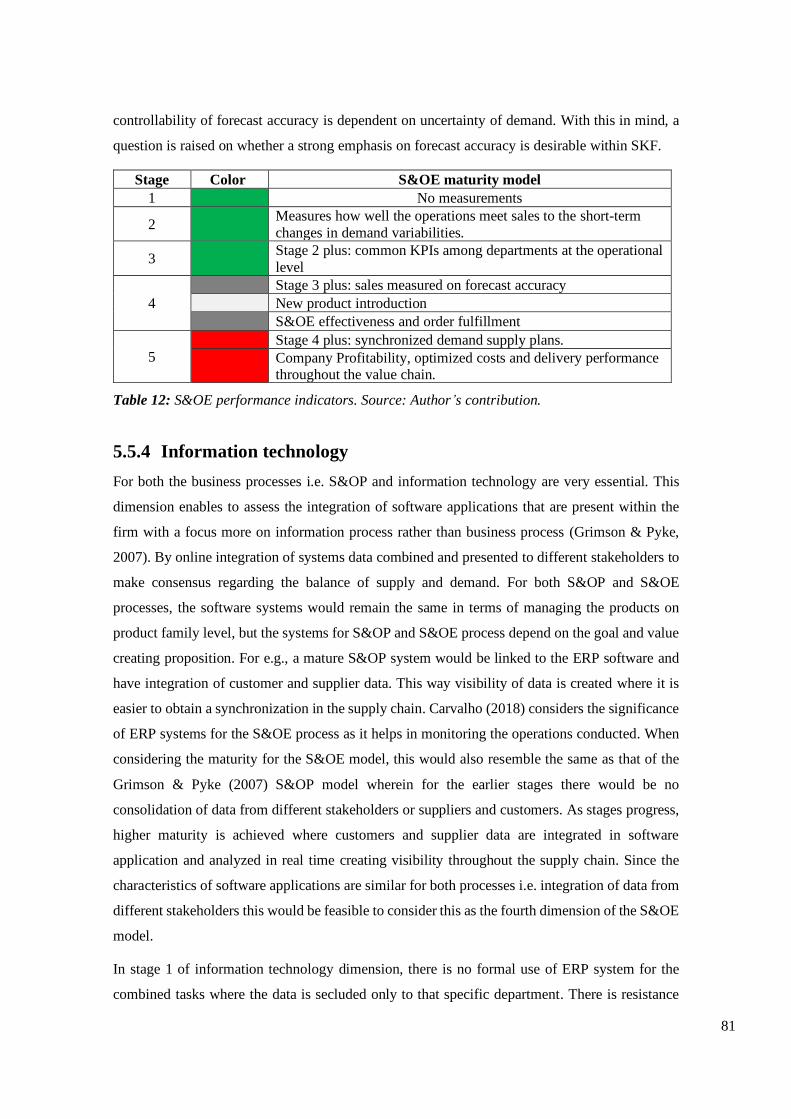
81
controllability of forecast accuracy is dependent on uncertainty of demand. With this in mind, a
question is raised on whether a strong emphasis on forecast accuracy is desirable within SKF.
Stage Color S&OE maturity model
1 No measurements
2
Measures how well the operations meet sales to the short-term
changes in demand variabilities.
3
Stage 2 plus: common KPIs among departments at the operational
level
4
Stage 3 plus: sales measured on forecast accuracy
New product introduction
S&OE effectiveness and order fulfillment
5 Stage 4 plus: synchronized demand supply plans.
Company Profitability, optimized costs and delivery performance throughout the value chain.
Table 12: S&OE performance indicators. Source: Author’s contribution.
5.5.4 Information technology
For both the business processes i.e. S&OP and information technology are very essential. This
dimension enables to assess the integration of software applications that are present within the
firm with a focus more on information process rather than business process (Grimson & Pyke,
2007). By online integration of systems data combined and presented to different stakeholders to
make consensus regarding the balance of supply and demand. For both S&OP and S&OE
processes, the software systems would remain the same in terms of managing the products on
product family level, but the systems for S&OP and S&OE process depend on the goal and value
creating proposition. For e.g., a mature S&OP system would be linked to the ERP software and
have integration of customer and supplier data. This way visibility of data is created where it is
easier to obtain a synchronization in the supply chain. Carvalho (2018) considers the significance
of ERP systems for the S&OE process as it helps in monitoring the operations conducted. When
considering the maturity for the S&OE model, this would also resemble the same as that of the
Grimson & Pyke (2007) S&OP model wherein for the earlier stages there would be no
consolidation of data from different stakeholders or suppliers and customers. As stages progress,
higher maturity is achieved where customers and supplier data are integrated in software
application and analyzed in real time creating visibility throughout the supply chain. Since the
characteristics of software applications are similar for both processes i.e. integration of data from
different stakeholders this would be feasible to consider this as the fourth dimension of the S&OE
model.
In stage 1 of information technology dimension, there is no formal use of ERP system for the
combined tasks where the data is secluded only to that specific department. There is resistance

82
between the departments to share the information for fulfilling the combined tasks as there is very
less collaboration between the supply and demand side departments at operational level. This can
be correlated to the first stage of Grimson & Pyke (2007), where there is information owned by
different departments but it’s neither shared nor merged.
In the stage 2, ERP system is used to consolidate data and there is sharing of information. Each
team uses spreadsheets and power-points for the combined tasks in the S&OE process to collect
and present the data, the spreadsheets and power-points are shared along with other departments
through an internal communication platform. This S&OE process itself is like the second stage of
Grimson & Pyke (2007) S&OP maturity model where it involves collaborating with different
stakeholders for information and is consolidated to analyze demand and supply related
information.
The stage 3 defined as S&OE standard addresses a centralized platform of data collection and
presentation. Both demand and supply related information is gathered in one business intelligence
server and dashboards can be used to portray data which can further be used in S&OE process
and decision-making. In addition to that, this centralized information is exploited to detect
abnormal demands manually. This can be compared to SKFs stance months ago where all
involved stakeholders in S&OE meetings refer to the demand chain control tower, a centralized
platform which uses digital twin technology, and the information is displayed in the form
interactive dashboards. These dashboards are used by stakeholders to observe and analyze KPIs
that affect the S&OE process. For instance, the demand chain control tower is used as a standard
platform to monitor demand on SKU level by many stakeholders and to analyze KPIs and perform
tasks accordingly are set to measure a certain customer service level for specific products for
which inventory levels are continuously monitored. Another aspect which SKF stresses is
information sharing mechanism, bringing in more transparency to both demand and supply side.
There exists also a global online workflow tool where a communication can be established
globally between demand and supply side. These supports in the abnormal demand management
where the abnormal high or low demand is captured and is manually corrected against the
forecasting system.
The stage 4 of S&OE maturity model is the addition of the stage 3 and automated abnormal
demand detection system. The reason for the stress in abnormal detection is due to the fact that,
for the current context, abnormal demand forms the major issue while the statistical forecast is
operationalized. This can be compared again with SKF stance right now, where they are in the
implementation phase of the automated abnormal demand detection system using service now
based on abnormal demand rules.
83
In the stage 5 of S&OE maturity model, is quite advanced wherein firms will retrieve real-time
information and uses integrated S&OE optimization software, where the supply and demand side
abnormalities is detected and automatically adjusted with industry 4.0 technologies such as
machine learning and artificial intelligence. In addition to this, is a capability to oversee demand
from a customer as to when, where and how much they would order. This can be done by
establishing demand visibility throughout the organization using demand sensing which in turn
can facilitate organization to have an agile response done. According to Chase & Chase (2016),
demand sensing is the technology which enables to use granular downstream data to reconcile the
demand forecasts of the short-term and inventory positioning for a forecast horizon of 0 to 3
months.
SKF’s S&OE process in terms of information technology can be placed in stage 4 of the S&OE
maturity model as shown in Table 13. In terms of S&OE at SKF, the overall goal of S&OE is to
react to changes rapidly by not overtaxing operations in the supply chain i.e. to have agile response
to short term changes received from both demand and supply side. Therefore, SKF has a
combination of software systems that facilitates a smooth S&OE process which includes
centralized information, dashboards and recently developed an automated abnormal demand
detection tool to identify the abnormal demand which is explained in detail in stage 3 and stage 4
of the maturity model.
Table 13: S&OE information technology. Source: Author’s contribution
5.5.5 S&OE Integration
This dimension measures the degree of integration of S&OP process that is incorporated in
different departments i.e. “it measures how effectively a company builds its demand plan and
Stage Color S&OE maturity model
1
Local and isolated systems.
No formal use of ERP system for integrated data.
Relying more on spreadsheets for combined tasks.
2 ERP systems are used to consolidate data.
Manual Detection of abnormal demand with less frequent
communication between demand and supply.
3 Centralized information in an automated way.
S&OE workbench. Manual detection of abnormal demand with
frequent communication between demand supply.
4
Stage 3 plus: Automated abnormal demand detection based on
rules.
5 Stage 4 plus: integrated S&OE optimization software.
Use of advanced analytics. Use of demand sensing technology.
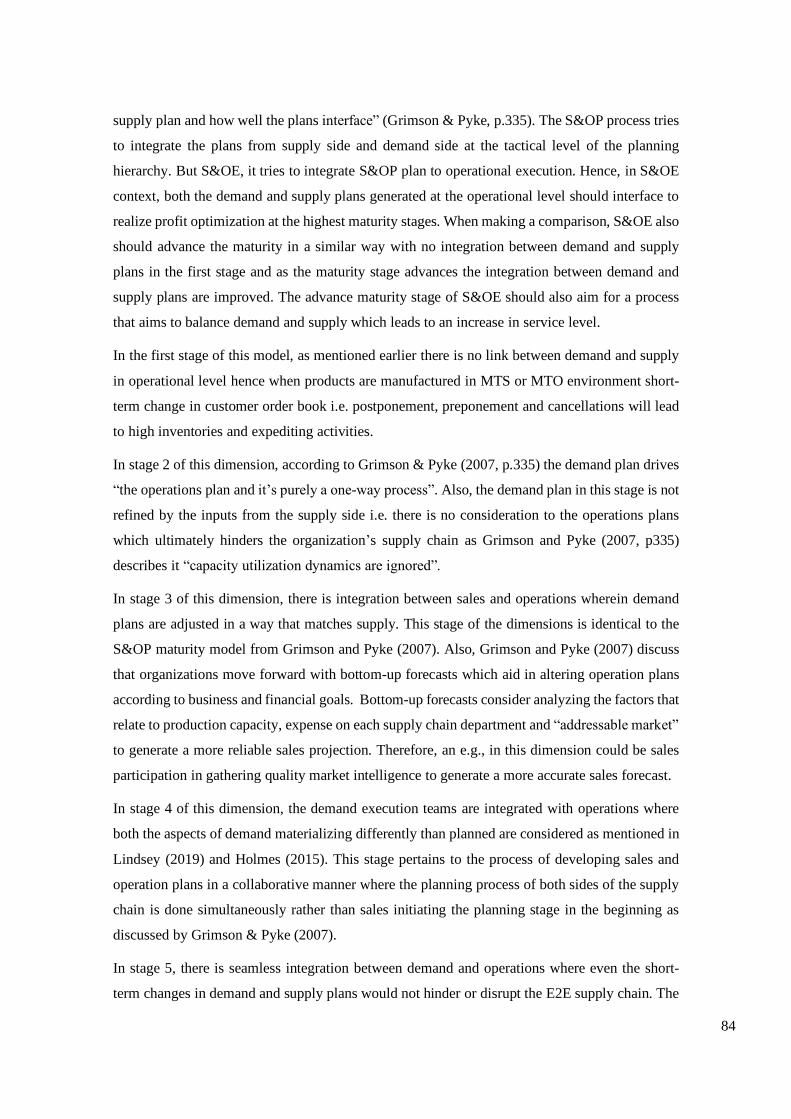
84
supply plan and how well the plans interface” (Grimson & Pyke, p.335). The S&OP process tries
to integrate the plans from supply side and demand side at the tactical level of the planning
hierarchy. But S&OE, it tries to integrate S&OP plan to operational execution. Hence, in S&OE
context, both the demand and supply plans generated at the operational level should interface to
realize profit optimization at the highest maturity stages. When making a comparison, S&OE also
should advance the maturity in a similar way with no integration between demand and supply
plans in the first stage and as the maturity stage advances the integration between demand and
supply plans are improved. The advance maturity stage of S&OE should also aim for a process
that aims to balance demand and supply which leads to an increase in service level.
In the first stage of this model, as mentioned earlier there is no link between demand and supply
in operational level hence when products are manufactured in MTS or MTO environment short-
term change in customer order book i.e. postponement, preponement and cancellations will lead
to high inventories and expediting activities.
In stage 2 of this dimension, according to Grimson & Pyke (2007, p.335) the demand plan drives
“the operations plan and it’s purely a one-way process”. Also, the demand plan in this stage is not
refined by the inputs from the supply side i.e. there is no consideration to the operations plans
which ultimately hinders the organization’s supply chain as Grimson and Pyke (2007, p335)
describes it “capacity utilization dynamics are ignored”.
In stage 3 of this dimension, there is integration between sales and operations wherein demand
plans are adjusted in a way that matches supply. This stage of the dimensions is identical to the
S&OP maturity model from Grimson and Pyke (2007). Also, Grimson and Pyke (2007) discuss
that organizations move forward with bottom-up forecasts which aid in altering operation plans
according to business and financial goals. Bottom-up forecasts consider analyzing the factors that
relate to production capacity, expense on each supply chain department and “addressable market”
to generate a more reliable sales projection. Therefore, an e.g., in this dimension could be sales
participation in gathering quality market intelligence to generate a more accurate sales forecast.
In stage 4 of this dimension, the demand execution teams are integrated with operations where
both the aspects of demand materializing differently than planned are considered as mentioned in
Lindsey (2019) and Holmes (2015). This stage pertains to the process of developing sales and
operation plans in a collaborative manner where the planning process of both sides of the supply
chain is done simultaneously rather than sales initiating the planning stage in the beginning as
discussed by Grimson & Pyke (2007).
In stage 5, there is seamless integration between demand and operations where even the short-
term changes in demand and supply plans would not hinder or disrupt the E2E supply chain. The
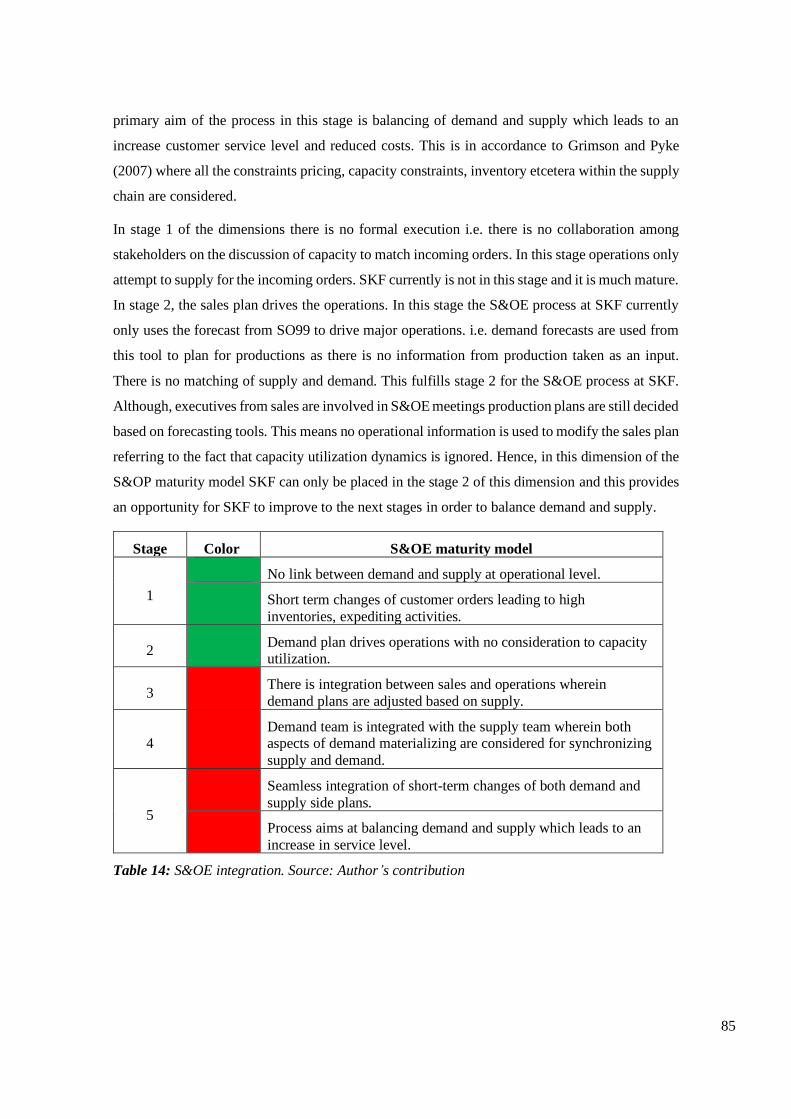
85
primary aim of the process in this stage is balancing of demand and supply which leads to an
increase customer service level and reduced costs. This is in accordance to Grimson and Pyke
(2007) where all the constraints pricing, capacity constraints, inventory etcetera within the supply
chain are considered.
In stage 1 of the dimensions there is no formal execution i.e. there is no collaboration among
stakeholders on the discussion of capacity to match incoming orders. In this stage operations only
attempt to supply for the incoming orders. SKF currently is not in this stage and it is much mature.
In stage 2, the sales plan drives the operations. In this stage the S&OE process at SKF currently
only uses the forecast from SO99 to drive major operations. i.e. demand forecasts are used from
this tool to plan for productions as there is no information from production taken as an input.
There is no matching of supply and demand. This fulfills stage 2 for the S&OE process at SKF.
Although, executives from sales are involved in S&OE meetings production plans are still decided
based on forecasting tools. This means no operational information is used to modify the sales plan
referring to the fact that capacity utilization dynamics is ignored. Hence, in this dimension of the
S&OP maturity model SKF can only be placed in the stage 2 of this dimension and this provides
an opportunity for SKF to improve to the next stages in order to balance demand and supply.
Stage Color S&OE maturity model
1
No link between demand and supply at operational level.
Short term changes of customer orders leading to high
inventories, expediting activities.
2
Demand plan drives operations with no consideration to capacity utilization.
3
There is integration between sales and operations wherein
demand plans are adjusted based on supply.
4
Demand team is integrated with the supply team wherein both aspects of demand materializing are considered for synchronizing
supply and demand.
5
Seamless integration of short-term changes of both demand and
supply side plans.
Process aims at balancing demand and supply which leads to an
increase in service level.
Table 14: S&OE integration. Source: Author’s contribution
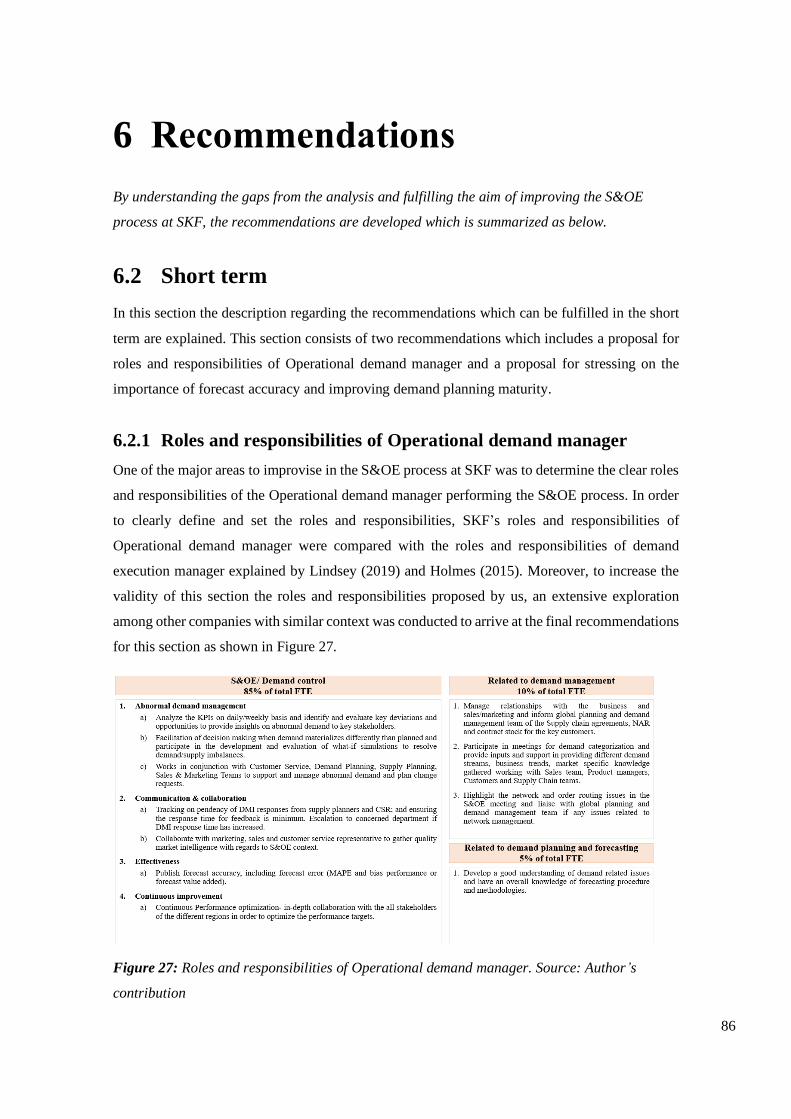
86
6 Recommendations
By understanding the gaps from the analysis and fulfilling the aim of improving the S&OE
process at SKF, the recommendations are developed which is summarized as below.
6.2 Short term
In this section the description regarding the recommendations which can be fulfilled in the short
term are explained. This section consists of two recommendations which includes a proposal for
roles and responsibilities of Operational demand manager and a proposal for stressing on the
importance of forecast accuracy and improving demand planning maturity.
6.2.1 Roles and responsibilities of Operational demand manager
One of the major areas to improvise in the S&OE process at SKF was to determine the clear roles
and responsibilities of the Operational demand manager performing the S&OE process. In order
to clearly define and set the roles and responsibilities, SKF’s roles and responsibilities of
Operational demand manager were compared with the roles and responsibilities of demand
execution manager explained by Lindsey (2019) and Holmes (2015). Moreover, to increase the
validity of this section the roles and responsibilities proposed by us, an extensive exploration
among other companies with similar context was conducted to arrive at the final recommendations
for this section as shown in Figure 27.
Figure 27: Roles and responsibilities of Operational demand manager. Source: Author’s
contribution

87
The roles and responsibilities were decided to be split into three categories, namely, related to
S&OE, related to Global planning and demand management and related to demand planning and
forecasting. First category, namely, “related to S&OE” depicts the roles and responsibilities that
needs to be undertaken to perform S&OE. Second category namely “related to Global planning
and demand management” the roles and responsibilities that need to be undertaken related to
global planning and demand management at SKF. Third category, namely, “related to demand
planning and forecasting” signifies the importance of having knowledge of related to demand
planning and forecasting.
With respect to roles and responsibilities related to S&OE, the demand manager needs to
dedicate 80 % of his time to on abnormal demand management which includes the following:
• Analyze the already set KPIs on a daily/weekly basis on which he/she needs to identify
and evaluate key deviations and opportunities to provide insights on abnormal demand to
key stakeholders.
• Facilitate decision-making when demand materializes differently than planned and
participate in the development and evaluation of what-if simulations to resolve
demand/supply imbalances.
• Operational demand manager should work in conjunction with customer Service, demand
planning, supply planning, sales & marketing teams to support and manage abnormal
demand and plan change requests.
• The Operational demand manager should focus on developing communication &
collaboration among the stakeholders participating in the S&OE process which includes
tracking on pendency of DMI responses from supply planners and CSR; and ensuring the
response time for feedback is minimum. Escalation to concerned department if DMI
response time has increased. Also, Operational demand manager should be a collaborator
with marketing, sales, and customer service representatives to gather quality market
intelligence regarding S&OE context.
• It is important to have the effectiveness of the process measured to review the
performance and understand how the process in overall can be improved. Hence, there
needs to be time allotted for understanding and publishing forecast accuracy, including
forecast errors such as MAPE, bias performance and forecast value added during the
S&OE weekly sessions.
• It is the responsibility of the Operational demand manager to work on continuous
performance optimization that requires in-depth collaboration with all stakeholders of the
different regions in order to optimize the performance targets.

88
Secondly, the Operational demand manager should work on 10% of his time on his task related
to global planning and demand management. These are the tasks which are understood by
reviewing the current responsibility and conducting interviews with SKF subject matter experts.
The tasks are formulated as follows:
• His/her responsibility should be to manage relationships with business and
sales/marketing for supply chain agreements, NAR and contract stocks of key customers
and inform global planning and demand management for further activities.
• Operational demand manager should also support in demand categorization in providing
expertise regarding market specific information.
• Also, the Operational demand manager should also highlight major issues related to
network routing to the stakeholders involved in S&OE process, to have control over the
network routing.
Lastly, the Operational demand manager should work 5% of his time to gather knowledge related
to demand planning and forecasting. As in SKF, the operational demand manager are from the
background of inventory manager, it should be stressed to develop an understanding of different
demand side related issues and forecasting procedures.
6.2.2 Importance of forecast accuracy and improving demand
planning maturity
In response to the problem on managing the KPI of forecast accuracy as mentioned in section
5.4.3 overall, there is a need for a more dynamic and more interactive way which SKF needs to
investigate so that an atmosphere is created where discussion between gaps of planned demand
and customer orders can be held. The recommendations would reflect on the need to “increase
the efforts to educate” the respective stakeholders on the importance of Forecast accuracy.
Indicating that all stakeholder although are not accountable for the performance of forecast
accuracy are in a way indirectly responsible for increasing the forecasted demand to actual
demand as their task is interdependent on the reliability of forecast accuracy. This can be done by
not just vaguely communicating the results of forecast accuracy among each other as a whole
number but a more “hands-on engagement” with people that feed the forecast upstream in order
to supply accordingly (Jordan & Messner, 2020). Therefore, it can be suggested that stakeholders
in the S&OE meetings such as inventory manager can directly interact with sales or CSR in order
to determine actions together such as reviewing demand of specific SKU’s wherein the demand
can be resubmitted based on the additional information retrieved, instead of sending across DMI
between both demand and supply where sometimes that information would not just be sufficient
89
to increase the forecast accuracy. This would help SKF shift from enacting forecast accuracy as
the responsibility of one person, group, or actor towards understanding the increase in forecast
accuracy as collaborative achievement across the organization (Jordan & Messner, 2020). With
this recommendation in place, it will offer a better understanding into the use of forecast accuracy
as a way to improve the quality of planning.
Apart from that, based on the results of the demand planning maturity assessment as one of the
major problems SKF is facing is the different demand patterns received from the larger number
of customers, which indeed can be resolved by identifying and classifying different demand
streams. SKF can invest in having a process where detailed tailored forecasting techniques are
used for different demand streams and in better understanding of the demand drivers. In addition
to that, SKF also should work on understanding the forecast accuracy based on industry
benchmarks.
6.3 Long term
In this section the description regarding the recommendations which can be fulfilled in long term
are explained. This section consists of four recommendations which includes proposals for
inclusion of the supply side, future looking S&OE process, incorporating additional technologies
to increase and considering demand sensing for forecasting in the short-term horizon.
6.3.1 Inclusion of supply side
One of the gaps identified in the S&OE integration dimension of S&OE maturity model is the
poor integration between the demand and supply side for S&OE process. Keeping this thought in
mind, recommendations are developed to include the supply side. The idea is to have a look over
the supply chain planning matrix and involve the stakeholders in a way by having a vision of
“innovative profitable & collaborative operational execution to deliver exceptional customer
service”.
Considering supply chain planning matrix from Stadtler et al. (2012) which is shown in Figure
28, S&OP is a horizontal collaboration process where the collaboration takes place at a tactical
level between the demand and supply side. Comparing S&OE with S&OP, S&OE is also a
horizontal process which tries to bridge S&OP plan by collaborating with the demand and supply
side on the operational level. Considering this framework, it is ideal to have all the stakeholders
from the supply side which includes warehouse replenishment and transport planning and material
planning which is explained in the upcoming sections.

90
Hence, there is a need for a matrix which can easily show the S&OE activities and based on this
idea, the matrix was developed as shown in Appendix A. This matrix is divided into pre-S&OE
and S&OE. Pre-S&OE includes activities that are done prior to S&OE and S&OE consists of
activities in S&OE scope. The pre-S&OE include activities done before S&OE which is not under
the responsibilities of the S&OE team. Sales & operations execution activities represent the
activities or tasks which should be included under the scope of S&OE. By considering the
important aspects of S&OE from different theoretical frameworks and experience from SKF,
important categories were developed such as daily activities, KPIs, weekly activities, S&OE
meeting, monthly review meeting, decision or plans made through S&OE, outcome of S&OE and
finally measuring the effectiveness of the S&OE process.
Figure 28: Supply chain planning matrix. Source adapted from: Stadler et al. (2012)
Vertically, this Figure 30 in appendix A is divided into activities which pertain to future looking
aspects of S&OE and the activities which contribute to understanding of current scenario. Future
looking activities are further divided into S&OP plan disaggregation, order book management
and forecast consumption report. Current scenario analysis includes supply side abnormalities and
demand side abnormalities. Demand side abnormalities includes activities which are done to
manage the abnormalities and understanding deviation caused from the demand side (sales,
marketing, etcetera). Supply side abnormalities includes activities which are done to manage
abnormalities that would appear from supply side, the supply side is further subdivided into
transport planning, warehouse management and manufacturing.

91
Transport planning & warehouse replenishment
An aspect from transport planning & warehouse replenishment can be considered for S&OE
process. From an S&OE point of view, these aspects can be segregated into weekly and monthly
activities. With respect to weekly activity, the aspects which can be discussed is the increased
transport expedites caused from the transport or warehouse replenishment side which are caused
due to fluctuations in demand. Also, the impact of the availability failures caused by transport
planning and warehouse replenishment due to delayed deliveries or any other reasons can be
discussed. In terms of monthly activity, the aspects which can be considered is the review of
monthly transport expedites and possibly have a collaborative discussion as to how the transport
expedites can be minimized. Also, as a part of S&OE activity, there could also be KPIs from the
transport planning side such as delivery performance accuracy which can be discussed. Overall,
this leads to reduced transport expedites and contributes to profitability. These reduced transports
expedite contributes to lesser environmental impact, ultimately improving the sustainability of
S&OE process. Hence, SKF can also view S&OE process which contributes to improved
sustainability throughout the organization. The structure as to how these activities need to be
aligned with S&OE is shown in Figure 29, the boxes highlighted in red indicate the proposal
which can be added in the discussion and boxes in green indicate the already existing activities.
Manufacturing
Another aspect which is proposed is to have the manufacturing also included for the S&OE
process. Currently, SKF industrial markets have both “make to order” and “make to stock” stocks
which are used to hedge against the demand uncertainties. Also, there is no time fence established
for change of plans which means that the short-term changes may not have any major impact to
the master production schedules. Hence, SKF can work on establishing the time fence to
understand the number of breaches to master production schedule due to the fluctuations of
demand in the short term. These impacts of the abnormal demands on production can be discussed
in S&OE meeting on a monthly review meeting and decisions related to rescheduling order or
adjustment to capacity can also be determined. The monthly review is suggested considering the
complexities of SKF supply chain with more than 3 factories globally. The outcome of this
activity is the increased visibility and stability to the master production scheduler. The structure
as to how these activities need to be aligned with S&OE is shown in Figure 29.
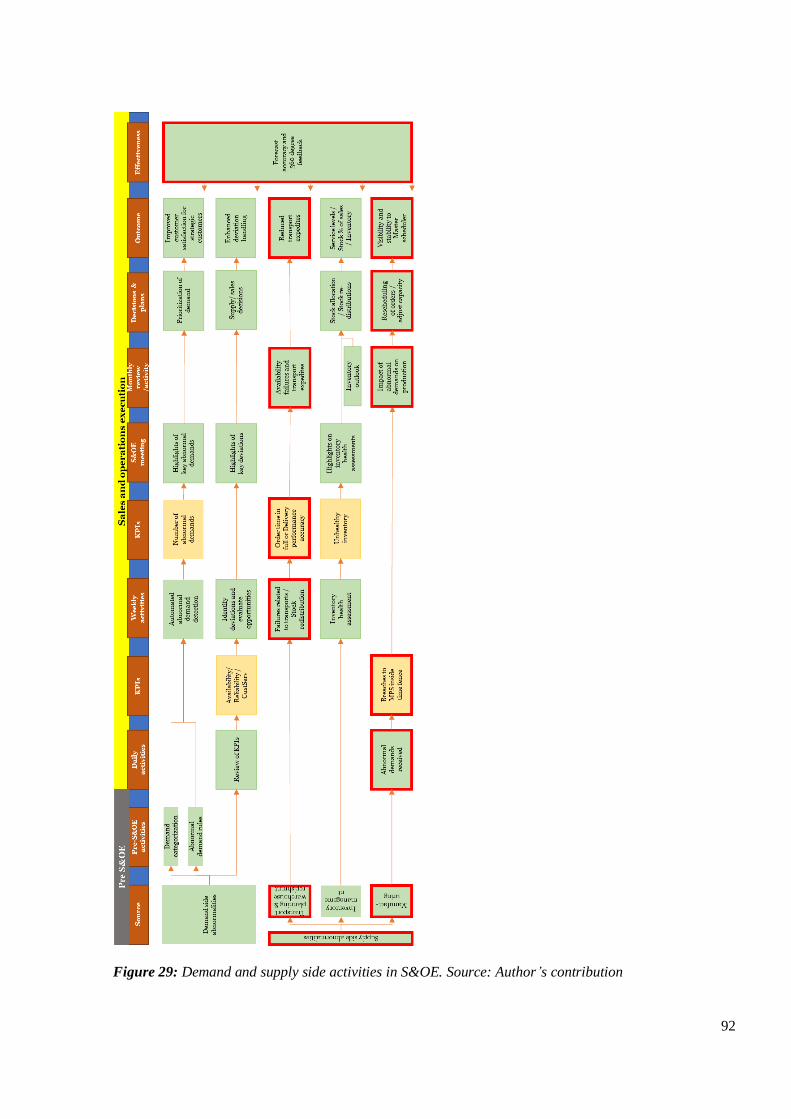
92
Figure 29: Demand and supply side activities in S&OE. Source: Author’s contribution
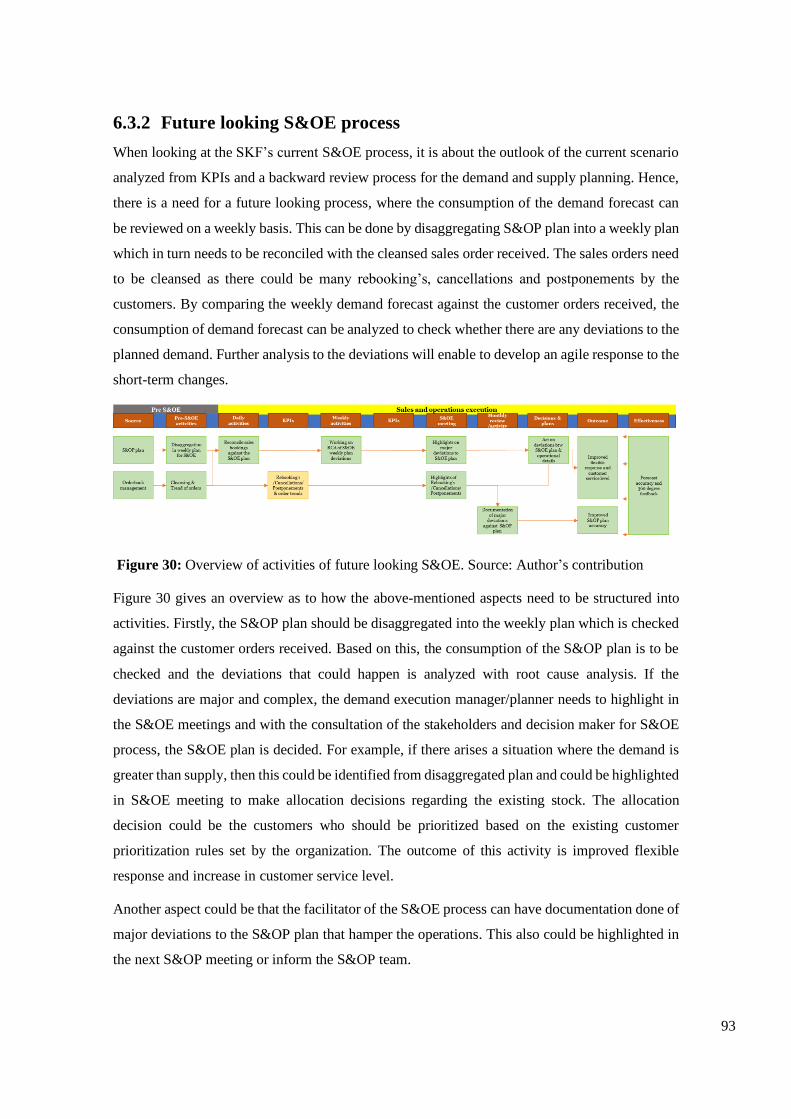
93
6.3.2 Future looking S&OE process
When looking at the SKF’s current S&OE process, it is about the outlook of the current scenario
analyzed from KPIs and a backward review process for the demand and supply planning. Hence,
there is a need for a future looking process, where the consumption of the demand forecast can
be reviewed on a weekly basis. This can be done by disaggregating S&OP plan into a weekly plan
which in turn needs to be reconciled with the cleansed sales order received. The sales orders need
to be cleansed as there could be many rebooking’s, cancellations and postponements by the
customers. By comparing the weekly demand forecast against the customer orders received, the
consumption of demand forecast can be analyzed to check whether there are any deviations to the
planned demand. Further analysis to the deviations will enable to develop an agile response to the
short-term changes.
Figure 30: Overview of activities of future looking S&OE. Source: Author’s contribution
Figure 30 gives an overview as to how the above-mentioned aspects need to be structured into
activities. Firstly, the S&OP plan should be disaggregated into the weekly plan which is checked
against the customer orders received. Based on this, the consumption of the S&OP plan is to be
checked and the deviations that could happen is analyzed with root cause analysis. If the
deviations are major and complex, the demand execution manager/planner needs to highlight in
the S&OE meetings and with the consultation of the stakeholders and decision maker for S&OE
process, the S&OE plan is decided. For example, if there arises a situation where the demand is
greater than supply, then this could be identified from disaggregated plan and could be highlighted
in S&OE meeting to make allocation decisions regarding the existing stock. The allocation
decision could be the customers who should be prioritized based on the existing customer
prioritization rules set by the organization. The outcome of this activity is improved flexible
response and increase in customer service level.
Another aspect could be that the facilitator of the S&OE process can have documentation done of
major deviations to the S&OP plan that hamper the operations. This also could be highlighted in
the next S&OP meeting or inform the S&OP team.
94
6.3.3 Incorporating additional technologies to increase S&OE
maturity
In this section, we will provide recommendations on how to move to next stage in the S&OE
maturity model for SKF with respect to first dimension of S&OE maturity model. In the first
dimension “meetings and collaboration” it is acknowledged from chapter five that SKF has
already obtained quite an advanced stage in the S&OE process where strategic customer data is
integrated within SKF’s demand chain. Although, Grimson and Pyke (2007) discusses that final
stage in the maturity model is quite hard to achieve and for some companies it will always be
something to aim for. During this thesis, we have observed and recognized the capability of SKF
to move to stage 5 in this dimension by incorporating technologies that provide real-time access
to external data which can help different stakeholders in S&OE process to make better decisions
faster. Mckinsey (2017) discusses that using machine learning methods such as supervised
learning approaches that use Bayesian networks provides access to real-time data. Bayesian
network is probabilistic graphical model which can be used to develop models from past data
and/or opinion from experts. The Bayesian network not only uses historical sales data to
improvise decisions on demand for the future, but it also uses near real-time data to enable
accurate and faster decisions among stakeholders. The Bayesian network can be used for tasks
such as “predication, anomaly detection, diagnostics, automated insight, reasoning, time series
prediction and decision-making under uncertainty” . E.g. availability of real time data enables
stakeholders to make faster and better decisions based promotional events, change in prices,
customer order patterns etcetera. According to Ostdick (2017), having the access to real time data
enables the supply chain partners to have a view of “up-to-the minute” needs of customers which
enables them to plan or firefight any bottlenecks that can occur across the supply chain efficiently
and effectively. Moreover, access to real time demand can aid supply chain planners in figuring
out trends or fluctuations in demand which can hinder production activity and planners are able
to make decisions faster on a collaborative basis among other stakeholders to generate accurate
and detailed planning for the both medium and short term. Ostdick (2017) also discusses that
with the real time information flow supply chain planners and managers will be able to analyze
the “up-to-the-minute” data just as it becomes available and then evenly distribute the data to
stakeholder in a cross-organizational way to enhance communication and collaboration.
6.3.4 Demand sensing
SKF has already established a good stance in this dimension Information technology. As
mentioned in S&OE maturity model SKF has in place an automated abnormal detection tool that
automatically detects abnormal orders placed from customers and notifies the respective
95
stakeholders. A recommendation to obtain an S&OE proactive stage would be to implement the
concept of demand sensing. According to an article by Hoey (2018), demand sensing is the
utilization of real-time data from downstream actors in the supply chain to generate a dynamic
forecast. A more detailed definition would be from Chase & Chase (2016) where demand sensing
is the transformation of downstream data with minimal latency in order to comprehend on what
item is being sold, which customer is buying the product and how is the product impacting
demand. With the concept of demand sensing in place SKF will be able to shift from forecasting
based on an old paradigm i.e. generating forecasts for the upcoming months based on previous
market behavior of the past years to a new paradigm. Hoey (2018) states that with the concept of
demand sensing, Demand planners and Demand managers have the potential to decrease the
existing gap between forecasted demand and actual demand.
Demand sensing usually deals with short term demand wherein it considers only one to six weeks
into the future. With the technology that operates demand sensing, weekly forecasts on item and
location level can be determined using the downstream data of the supply chain to improvise on
the short-term execution. It is to be noted here that the short-term operational forecast does not
replace the operational demand forecasting but instead it facilitates the operational forecast by
providing an insight into real-time consumer demands (Chase & Chase, 2016). Moreover, an
additional benefit of using demand sensing is, the short term statistical forecast that is obtained
from this concept enables companies to grow their S&OP horizon from short term execution to
longer-term operational and strategic planning providing a more rigid plan for the S&OP horizon
which SKF is currently implementing globally (Chase & Chase, 2016).
96
7 Conclusion
In this section, the conclusive comments about the result of the thesis are represented and the
research questions are answered. This section will also explain generalizability, limitations and
opportunities for future work.
7.2 Summary
From the research experience obtained during the tenure of this thesis it is acknowledged that the
process of S&OE has been commonly accepted by many industries as the quickest response to
tackle the volatile planning environments. Moreover, the organizations that are using the S&OE
process are benefiting on a larger area than anticipated, such as having the ability to look ahead
to stabilizing their supply chain. In addition, organizations have even more confidence in the
S&OP process due to the existence of S&OE in their organization. Although the industrial market
at SKF lacks the complete S&OP process; with the S&OE almost established in the organization
globally the executives have firm confidence in completely developing the S&OP process from
S&OE. Hence, with the S&OE first implemented the organization required an outside-in
perspective on how their S&OE process is working throughout the organization.
While the overall purpose of this thesis is to contribute to theory on the topic of S&OE, the case
study at SKF has greatly enhanced the study of this thesis from a practical standpoint. Hence, by
collaborating with SKF, the purpose of this thesis was narrowed down to evaluate the S&OE
process at SKF and to improve the capabilities of the S&OE process based on a qualitative study.
Through a collection of both primary and secondary data and using the abductive methodology
the S&OE process at SKF was evaluated.
To answer the first research question “What are the characteristics of S&OE process at SKF?”,
the formalized S&OE model developed by Carvalho (2018) is used to compare the characteristics
of S&OE at SKF. Table 7 under section 5.1, distinguishes the characteristics between theory and
practical implementation. The intent of answering this research question is to give a summary of
the important characteristics which SKF should consider when implementing and increasing the
maturity of the S&OE process. This would enable the case company to get an outside-in
perspective on how well the process has been set up according to theory which avoids a biased
view for the company. This question is answered in section 4.3, 4.4 and 5.1.
97
The research question two on “How is the SKFs S&OE process designed with respect to workflow
and are the roles and responsibilities correctly set for the process?” , is answered by observing the
workflow of S&OE process and using the BPMN model in section 4.4.1 to give theoretical
explanation of the process at SKF. Followed by which, the roles and responsibilities of
stakeholders are identified using the RACI matrix in section 5.2. With respect to the roles and
responsibilities of stakeholders, emphasis is given to the Operational demand manager as that
person is the facilitator of the S&OE process. Hence, the intention here was to appropriately set
the roles and responsibilities of the Operational demand manager so that the S&OE process can
be efficiently performed. Further analysis and research are done with a more practical standpoint.
The results of the final roles and responsibilities Operational demand manager is stated in section
6.1.1.
The research question three on “What are the contextual factors affecting the S&OE process at
SKF and how can the maturity of the S&OE process be assessed.?”, is answered by referring to
the S&OP and S&OE literature. First, the planning environment affecting the business is
determined by using the contingency theory from Ivert et al. (2015). The contextual factors
obtained from this theory are then used to develop a S&OE maturity model by adapting the
dimensions from the Grimson and Pyke (2007) maturity model. The contingency theory is
presented in section 5.3 and the S&OE maturity model adapted from Grimson and Pyke (2007) is
presented in section 5.4. In addition, considering the S&OE maturity model developed in this
paper, future recommendations are provided focusing on short-term and long-term described in
the previous section.
It is to be noted here that the answers provided to RQ’s one and two are primarily the analysis
itself presented in this thesis. This is because the reasons for implementing the S&OE process
varies depending on the industry, hence, previous case studies of S&OE in this industry are
unavailable which prevented us from conducting a cross-case analysis. Moreover, this paper is a
theoretical contribution to the topic of S&OE, therefore, with the analysis presented as the answers
to RQ one and two organizations in a similar context can refer to this thesis to determine their
workflow and characteristics.
7.3 Generalizability
Generalizability explains the extent to which the findings and conclusions of the study can be
applied to a larger population. The thesis is considered to contribute to both theory and
practitioners on the topic of sales and operations execution. Information on the characteristics of
S&OE is compared from a theory and a practical standpoint. This enables other organization
98
executives to easily compare and determine the right characteristics of S&OE for their
organization.
When looking at the S&OE maturity model, it was customized to SKF context. Hence, the results
of this thesis are useful for the companies under similar context as SKF. Although, it is quite rare
that some might start with an S&OE process first rather than an S&OP process, companies with
similar context can use this to initiate, evaluate and improve their S&OE process.
7.4 Limitations
In this section the limitations which were not under our control are described. Regarding
limitation, there is limited academic literature related to S&OE and most of the information
regarding S&OE process had to be referred from consultancies white papers. Secondly, the
COVID-19 pandemic had a major impact during the thesis conduction as it delayed the primary
and secondary collection required for the conduction of research. Hence, some delimitations had
to be set for the study in order to accomplish study within the stipulated time of 4 months.
7.5 Future research areas
S&OE process has a good scope in future with many companies wanting to work on an agile plan
by translating tactical plans developed into the details and forming the bridge between S&OP and
operational execution. This thesis serves an important contribution towards developing a
theoretical stance towards S&OE process. One of the future areas to work on an S&OE maturity
model developed based on exploratory research, so that a generalized S&OE maturity model can
be developed which can be used by companies under different contingencies. Another is related
to how the S&OE process could evolve with different industry 4.0 technologies.
99
References
Adams, J., Khan, H.T.A., & Raeside, R. (2014). Research Methods for Business and Social
Science Students. New Delhi: SAGE Publications.
Anthony, R. N. (1965). Planning and Control Systems: A framework for analysis. Boston:
Division of Research, Graduate school of Business administration, Harvard University.
Bagni, G., & Marçola, J. A. (2019). Evaluation of the maturity of the S&OP process for a
written materials company: a case study. Gestão & Produção, 26(1), 1-15
Bayes Server Limited (2018). Bayesian networks - an introduction. available at:
https://www.bayesserver.com/docs/introduction/bayesian-networks (accessed on May
30, 2020)
Bell, E., Bryman, A., & Harley, B. (2019). Business research methods. Oxford: Oxford
University Press.
Bower, P. (2018). S&OP, Demand Control, and Quick Response Forecasting. Journal of
Business Forecasting, 37(2), 10-13.
Carvalho, A., L., D. (2018). The intermediate link in planning: a multicase study of the Sales
and Operations Execution process. (Master's thesis, University of São Paulo, São
Paulo), available at: https://www.teses.usp.br/teses/disponiveis/18/18156/tde-16072018-
100932/publico/AnaLimadeCarvalhoDEFINITIVO.pdf
Chainalytics. (2019). Sales and operations execution: Bridging tactical S&OP and operational
execution. available at: https://www.chainalytics.com/:
https://www.chainalytics.com/wp-content/uploads/2019/09/Chainalytics-Sales-
Operations-Execution-SOE-Guide_Web.pdf (accessed on January 30,2020)
Chase, Jr. C., & Chase, C. W. (2016). Next Generation Demand Management. People, process,
analytics, and technology. John Wiley & Sons, Incorporated
De Bruin, T., Freeze, R., Kulkarni, U., & Rosemann, M. (2005). Understanding the Main Phases
of Developing a Maturity Assessment Model, In Bunker, D, Campbell, B, & Underwood,
J (Eds.) Australasian Conference on Information Systems (ACIS). Australasian Chapter
of the Association for Information Systems, CD Rom, 8-19
Esper, T., Elinger, A., Stank, T., Flint, D., & Moon, M. (2009). Demand and supply integration:
a conceptual framework of value creation through knowledge management. Journal of
the Academy of Marketing Science, 28, 5-18.
Gianesi, I. (1998). Implementing Manufacturing strategy through strategic production planning.
International Journal of Operations and Production Management, 18(3), 286- 299.
Grimson, J., & Pyke, D. F. (2007). Sales and Operations Planning: an exploratory study and
framework. The International Journal of Logistics management, 18(3), 322-346.
Hippold, S. (2019). How to set up S&OE in supply chain planning, available at:
https://www.gartner.com/smarterwithgartner/how-to-set-up-soe-in-supply-chain-
planning/ (accessed February 5,2020)
100
Hoey, B. (2018). How is S&OE Different from S&OP?, available at:
https://blog.flexis.com/how-is-soe-different-from-sop (accessed on January 30,2020)
Holmes, D. (2015). Demand Control Webcast, available at: https://www.oliverwight-
americas.com/videos/demand-control-webcast/ (accessed on February 5, 2020)
Inc. Oliver Wight International. (2017). The Oliver Wight Class a Standard for Business
Excellence. John Wiley & Sons, Incorporated.
Ivert, L. K., Popovska, I. D., Fredriksson, A., Dreyer, H., & Kaipia, R. (2015). Contingency
between S&OP design and planning environment. International Journal of Physical
Distribution and Logistics Management, 45(8), 747-773
Jonsson, P., & Mattsson, S-A. (2009). Manufacturing planning and control. McGraw-Hill
Education, London.
Jordan, S., & Messner, M. (2020). The Use of Forecast Accuracy Indicators to Improve
Planning Quality: Insights from a Case Study. European Accounting Review, 29(2),
337-359.
Kallio, H., Pietilä, A‐M., Johnson, M., & Kangasniemi, M. (2016). Systematic methodological
review: Developing a framework for a qualitative semi-structured interview guide.
Journal of Advanced Nursing, 72(12), 2954-2965.
Kantor, B. (2018). The RACI matrix: Your blueprint for project success. available at:
https://www.cio.com/article/2395825/project-management-how-to-design-a-successful-
raci-project-plan.html (accessed on May 10, 2020)
Kelber, J. (2020). How Should Planners Measure S&OE Success?, available at:
https://blog.flexis.com/planners-measure-soe-success (accessed on February 20, 2020)
Kothari, C. (2004). Research Methodology: Methods and Techniques. Jaipur, India. New Age
International Ltd.
Kovacs, G., & Spens, K. M. (2005). Abductive reasoning in logistics. International Journal of
Physical Distribution & Logistics Management. 35(2), 132-144
Kristensen, J., & Jonsson, P. (2018). Context-based sales and operations planning (S&OP)
research: A literature review and future agenda. International Journal of Physical
Distribution & Logistics Management, 48(1), 19-46.
Lapide, L. (2004). Sales & operations planning part I: the process. Journal of Business
Forecasting. 23(4), 18-20.
Lapide, L. (2005). Sales & operations planning part III: a diagnostic model. Journal of Business
Forecasting, 24(1), 13-16.
Lapide, L. (2011). S&OP: The Linchpin Planning Process. Journal of Business Forecasting,
30(3), 18-20.
Lim, L., Apan, G., & Penz, B. (2014). Reconciling sales and operations management with
distant suppliers in automotive industry. International Journal of Production
Economics, 151(1), 20-36.
101
Lindsey, P. (2019). Minimizing Chaos with Demand Control and Execution, available at:
https://www.oliverwight-americas.com/videos/minimizing-chaos-with-demand-control-
and-execution/ (accessed on January 30, 2020)
Ling, R.C., & Goddard, W.E. (1988). Orchestrating Success: Improve Control of the Business
with Sales and Operations planning. Essex Junction, VT. Oliver Wight Ltd.
Publications
McKinsey. (2017). Smartening up with artificial intelligence (AI)- what's in it for Germany and
its industrial sector? available at:
https://www.mckinsey.com/~/media/McKinsey/Industries/Semiconductors/Our%20Insi
ghts/Smartening%20up%20with%20artificial%20intelligence/Smartening-up-with-
artificial-intelligence.ashx (accessed on May 30, 2020)
Nevin, M. (2014). The strategic Alliance Handbook: A practitioner’s guide to business-to-
business collaborations. London & New York: Taylor and Francis Group.
Object Management Group (OMG). (2011). Business Process Model and Notation (BPMN),
available at: http://www.omg.org/spec/BPMN/2.0. (accessed on February 10, 2020)
Ostdick, N. (2017). The Importance of Real-time in the Supply Chain, available at
https://blog.flexis.com/the-importance-of-real-time-in-the-supply-
chain#:~:text=Demand%20insight%20and%20visibility,bottlenecks%20across%20the
%20supply%20stream (accessed on April 24, 2020)
Palmatier, G., & Crum, C. (2003). Demand Management Best Practices: Process, Principles,
and Collaboration. J. Ross Publishing. Florida
Pukkila, M. (2016). Set Up Sales and Operations Execution Process to Support the S&OP
Cycle. available at: https://www.gartner.com/en/documents/3193018/set-up-sales-and-
operations-execution-process-to-support (accessed on February 1,2020)
Shaikh, S. (2018). Supply chain times: Untangling S&OP and S&OE, available at:
https://sctimes.io/news/article/7/5232 (accessed on February 4, 2020)
SKF Group. (2019). Annual report 2019, available at:
https://investors.skf.com/sites/default/files/pr/SKF_AR19_ENG_bookmarks_.pdf
(accessed on February 1, 2020)
SKF. (2020). Products: Angular contact ball bearings, available at:
https://www.skf.com/us/products/rolling-bearings/ball-bearings/angular-contact-ball-
bearings#cid-464559 (accessed on February 26, 2020)
Smaros, J., Lehtonen, J.-M., Appelqvist, P., & Jan, H. (2003). The Impact of Increasing
Demand Visibility on Production and Inventory Control Efficiency. International
Journal of Physical Distribution & Logistics Management, 33(4), 336-354.
Stadtler, H., Fleischmann, B., Grunow, M., Meyr, H., & Sürie, C. (2012). Advanced Planning in
Supply Chains. Verlag Berlin Heidelberg: Springer.
Thome, A.M.T., Scavarda, L.F., Fernandez, N.S., Scavarda, A.J., (2012). Sales and operations
planning: : a research synthesis. International Journal of Productivity and Performance
Management, 138(1), 359-381.

102
Van Looy, A., De Backer, M., Poels, G., & Snoeck, M. (2013). Choosing the right business
process maturity model. Journal on Information & Management, 50, 466–488.
Vereecke, A., Vanderheyden, K., Baecke, P., & Van Steendam, T. (2018). Mind the Gap-
Assessing maturity of demand planning, a cornerstone of S&OP. International Journal
of Operations & Production management, 38(8), 1618-1639.
Wallace, T.F., & Stahl, R.A., (2008). Sales and operation planning: The how-to handbook. T. F.
Wallace and company
Yeung, H.W-c. (1995). Qualitative personal interviews in international business research: Some
lessons from a study of Hong Kong transnational corporations. International Business
Review, 29(1), 333-339.
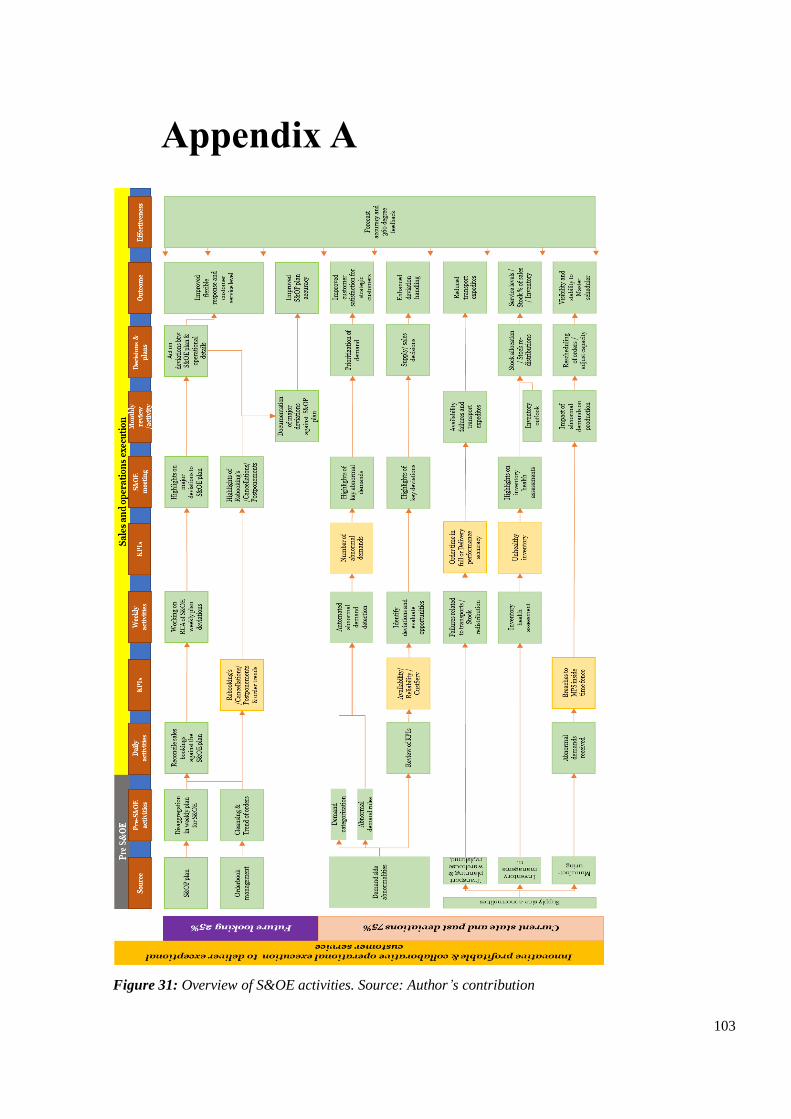
103
Appendix A
Figure 31: Overview of S&OE activities. Source: Author’s contribution

104
Appendix B
Question related to background
1. Can you explain about SKF’s current supply chain?
2. What type of markets do you serve? B2B? B2C?
3. What are the different products? Who are the main customers?
4. Can you explain why the S&OE process was initiated at SKF?
5. Can you explain me about the S&OE process implemented?
6. How is S&OE process defined by SKF?
Question related to S&OE process
1. What are the activities done in S&OE process?
2. What are the inputs and outputs for the S&OE meeting?
3. What are the tools and technologies used by companies in S&OE process?
4. What are the key performance indicators used in S&OE process?
5. How is the S&OE process effectiveness measured?
6. Is scenario analysis done in S&OE process?
7. What is the planning horizon and detail hierarchy for the S&OE process?
8. What are the decisions made in S&OE process? Who is the decision make in S&OE
process?
Question related to organization and stakeholders
1. Who are the stakeholders involved in S&OE process? Is demand side included? Is supply
side included?
2. Is there any dedicated team for S&OE process?
3. Who is the facilitator of S&OE process? What are the roles and responsibilities of S&OE
team involved in S&OE process?
4. How are the decision made? Who makes the decision?

105