Embed Size (px)
Citation preview

Today’s HR Solutions
Conducted byMidAtlantic Employers’ Association 234 Mall Blvd., Suite 200 King of Prussia, PA 19406 800.662.6238 www.meainfo.org
Salary Survey ReportExecutive
Summer 2015

TABLE OF CONTENTS
Introduction ....................................................................................................... 3-4 Participant Analysis ......................................................................................... 5-6 Using the Survey and Aging Survey Data ..................................................... 6-7 Methodology and Definitions ........................................................................ 8-10 Data Presentation Standards ............................................................................ 10 Positions Not Published Due to Insufficient Data ......................................... 11 Wage and Salary Data
A - Finance, Accounting, Billing, Credit, Payroll ...................................................................................................... 12 - 13 EX-210-X Controller ..........................................................................................12 B - Executive, Administrative, Legal, Staff, General Office, Regulatory ................................................................ 14 - 17 EX-100-X Chief Executive Officer .....................................................................14 EX-105-X Chief Operating Officer .....................................................................16 C - Info Systems, Data Processing, Systems Analysis, Software, Programming, Project Mgmt ........................ 18 - 19 EX-120-X Chief Information Officer ...................................................................18 D - Human Resources, Recruiting, Compensation, Benefits, Training, Safety, Security ....................................... 20-21 EX-305-X Human Resources Director ..............................................................20 E - Sales, Marketing, Product Mgmt, Communications, Public Relations, Customer Service, Editorial & Media..22-39 EX-500-X Chief Sales-Marketing Executive .................................................... 22 EX-505-X Chief Marketing Executive (Excludes Sales) ....................................24 EX-510-X Chief Sales Executive/Domestic Markets (Excluding Marketing) .....26 EX-515-X Chief Business Development Executive .......................................... 28 EX-530-X General Sales Manager ....................................................................30 EX-535-X District Sales Manager .................................................................... 32 EX-540-X Regional Sales Manager ................................................................. 34 EX-545-X Product Manager ............................................................................. 36 EX-615-X Top Sales Executive-Domestic-Foreign ..........................................38 L - Production, Manufacturing, Assembly, Finishing, Processing ......................................................................... 40 - 41 EX-430-X Chief Manufacturing Executive .........................................................40
2
©2015. MidAtlantic Employers’ Association. All rights reserved

INTRODUCTION The MidAtlantic Regional Salary Surveys are published biannually by the MidAtlantic Employers’ Association (MEA). The year 2015 marks the thirtieth (30th) year of publication for the survey. The continued growth and success of this survey would not be possible without the participation of MEA members. We wish to extend thanks to all participating organizations who invested their time to provide us with data. We truly appreciate your participation and welcome your comments. MEA surveys represent compensation data submitted by organizations of various sizes, geographic locations, and industries. The data include the following components:
Position description that lists duties, skills, responsibilities and supervisory levels associated with the job The number of organizations that have provided us with salary information for the position The number of employees for whom salary data are reported Base Compensation reported as simple average; weighted average; and 10th, 25th, 50th, 75th and 90th
percentiles Base Compensation data reported as total responses and broken out by geographic area, company size,
company revenue, industry, union status, profit status, and match degree Pay ranges Bonus/Incentive Payments (Variable Pay) T otal Compensation
Following is a summary of the demographics of participating organizations in the 2015 MidAtlantic Employers’ Association Regional Salary Surveys – Summer edition:
Number of Participating Organizations 115 Total Number of Employees Reported in Surveys 5945 Data Aged to: July 1, 2015 Company Size 1-99 Employees 68 100 to 249 Employees 40 250 to 499 Employees 4 500 to 999 Employees 2 1000+ 1 Geographic Area PA – Philadelphia Metro 84 New Jersey – Southern 12 PA – All Other Counties 10 PA – Lehigh Valley 3 Delaware 2 New Jersey – Northern & Central 2 Other States 2 Revenue in Millions 0 to 4.9 16 5 to 9.9 13 10 to 14.9 13 15 to 24.9 21 25 to 49.9 18 50 to 99.9 11 100 to 249.9 7 500+ 1 Not Available 15
3
©2015. MidAtlantic Employers’ Association. All rights reserved

Industry Durable Goods Manufacturing 46 Services, Not Elsewhere Classified 16 Non-Durable Goods Manufacturing 14 Professional/Business Services 13 Wholesale Trade 9 Construction 3 Social Services 3 Leisure/Hospitality Services 3 Financial Activities 3 Transportation/Warehousing 2 Health Services 2 Education Services 1 Union Status Non-Union 1 07 Union 8 Profit Status Profit 108 Non-Profit 7
4
©2015. MidAtlantic Employers’ Association. All rights reserved

PARTICIPANT ANALYSIS The 115 responding organizations in this survey come from all parts of the MEA region. The figure below shows their distribution by the region’s labor market areas: Southeastern Pennsylvania, New Jersey, Delaware, Maryland and the Lehigh Valley.
MEA surveys incorporate information from a diverse set of employers as represented by the size of the organization. This year’s survey provides data for all sizes of organizations, although there is a predominance of small and medium sized firms in our respondent group. The figure below illustrates the distribution of survey respondents by size, as determined by the number of employees at the responding organization’s location.
5
©2015. MidAtlantic Employers’ Association. All rights reserved

Additionally, organizations from a wide variety of industries responded to the survey. The figure below illustrates the distribution of survey respondents by industry category.
USING THE SURVEY The data contained in this survey represent participating organizations’ pay practices at a specific point in time. Specific pay practices are both diverse and complex; so the survey data do not yield a single correct rate for any job. Factors such as length of time in position, individual employee capability or company philosophy can significantly influence pay. Organizations which consider this survey a single solution may create a trap for themselves. It is important for each organization to develop its own compensation philosophy and take into account its attitudes and beliefs about pay, how it wants to position itself in the market in relation to its competitors, its benefits and supplemental reward philosophies, supply and demand considerations, financial situation, organizational design, and company culture when developing the philosophy. An organization’s compensation philosophy should always be unique and appropriate to its business plan. No two organizations are exactly alike, so no two organizations should have exactly the same compensation philosophy. Copying another company’s pay strategy, even in the same industry, can have disastrous results. It is also important to note that organization practices do not always coincide with their policies. This survey shows what organizations intend to pay (pay ranges) and what they actually pay (weighted average salaries). When using this survey, it is important to keep that in mind and to carefully study both figures.
6
©2015. MidAtlantic Employers’ Association. All rights reserved

AGING SURVEY DATA (Also called advancing or trending; used to bring data to a consistent point in time.)
Formula to age survey data:
Example:
To age data from the Executive Survey (effective date of July 1, 2015) to the date of October 1, 2015 use the 2015 average annual pay increase projection of 3.0%.
3 months _____________ X 3.0% = 0.75% 12 months
Multiply survey data by 1.0075 to bring data to October 1, 2015.
7
©2015. MidAtlantic Employers’ Association. All rights reserved

METHODOLOGY
MEA collected survey data online. To facilitate accurate job matching by participants, job classifications were accompanied by detailed job descriptions. In addition, MEA consultants conducted job matching workshops to assist members in completing the surveys. The submitted data were then analyzed for accuracy and completeness. Where information seemed questionable, telephone or e-mail confirmation was made with the participant. To ensure the confidentiality of individual respondents, no data are reported if fewer than three organizations were included in the variable breakdowns. A footnote is displayed for positions when one or more organizations each account for more than 33.3% of the sample. This survey was conducted using the following guidelines:
Only employees who spent at least 70% of their time on the function as described in the description were considered to be a match and were reported.
Only full-time employees (35 or more hours per week or full - time equivalent) were reported Actual base wages and salaries were reported Participants were asked to exclude:
Part-time employees (employees working less than 35 hours per week); Shift premiums; Overtime premiums; Lead differentials; Rates for unique situations, such as demotion or accommodation, where an incumbent is paid more/less than
you would normally pay for the position, and Temporary and seasonal employees.
Participants were asked to include: Additional compensation granted in equal amounts to all employees in a job (e.g., cost-of-living
accumulations), and Established rate range even if the position is vacant.
8
©2015. MidAtlantic Employers’ Association. All rights reserved
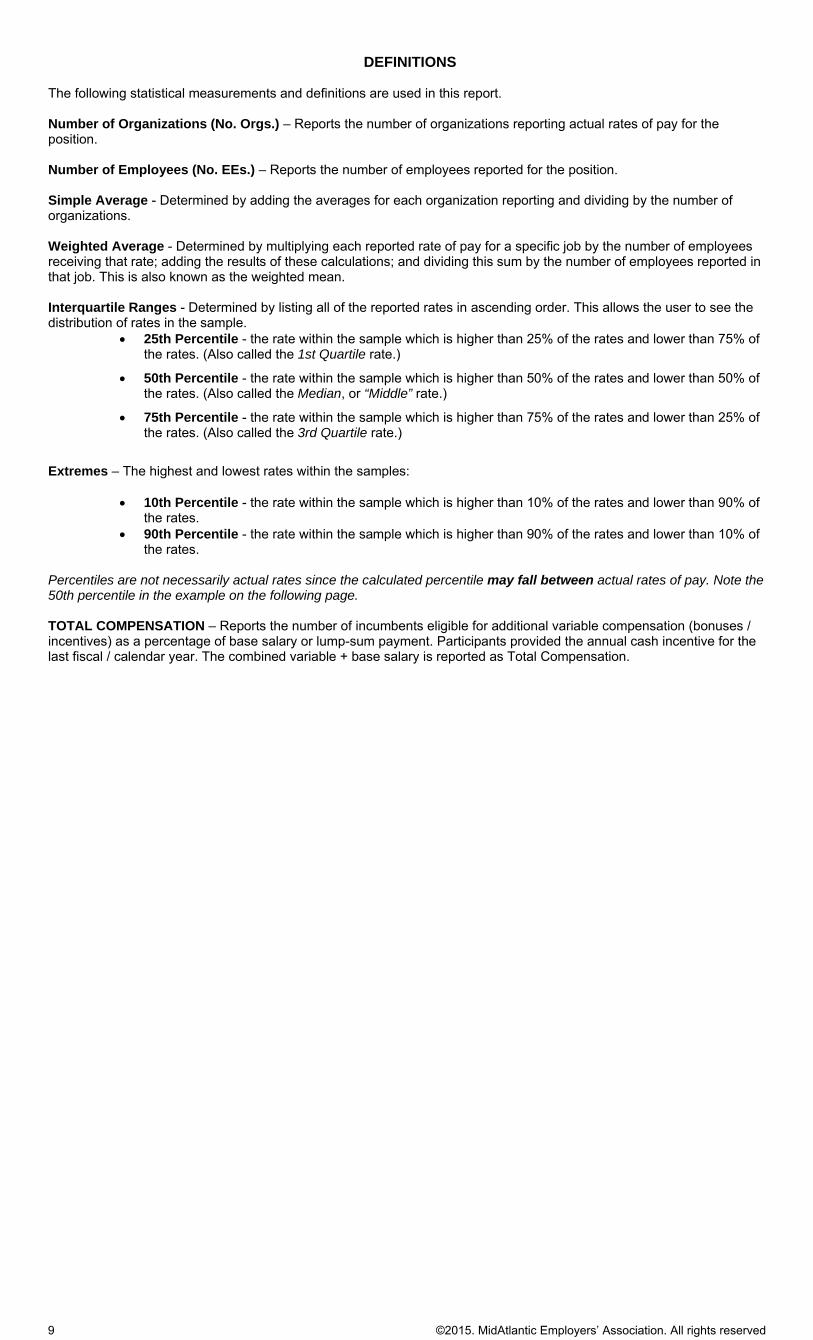
DEFINITIONS The following statistical measurements and definitions are used in this report. Number of Organizations (No. Orgs.) – Reports the number of organizations reporting actual rates of pay for the position. Number of Employees (No. EEs.) – Reports the number of employees reported for the position. Simple Average - Determined by adding the averages for each organization reporting and dividing by the number of organizations. Weighted Average - Determined by multiplying each reported rate of pay for a specific job by the number of employees receiving that rate; adding the results of these calculations; and dividing this sum by the number of employees reported in that job. This is also known as the weighted mean. Interquartile Ranges - Determined by listing all of the reported rates in ascending order. This allows the user to see the distribution of rates in the sample.
25th Percentile - the rate within the sample which is higher than 25% of the rates and lower than 75% of the rates. (Also called the 1st Quartile rate.)
50th Percentile - the rate within the sample which is higher than 50% of the rates and lower than 50% of the rates. (Also called the Median, or “Middle” rate.)
75th Percentile - the rate within the sample which is higher than 75% of the rates and lower than 25% of the rates. (Also called the 3rd Quartile rate.)
Extremes – The highest and lowest rates within the samples:
10th Percentile - the rate within the sample which is higher than 10% of the rates and lower than 90% of the rates.
90th Percentile - the rate within the sample which is higher than 90% of the rates and lower than 10% of the rates.
Percentiles are not necessarily actual rates since the calculated percentile may fall between actual rates of pay. Note the 50th percentile in the example on the following page. TOTAL COMPENSATION – Reports the number of incumbents eligible for additional variable compensation (bonuses / incentives) as a percentage of base salary or lump-sum payment. Participants provided the annual cash incentive for the last fiscal / calendar year. The combined variable + base salary is reported as Total Compensation.
9
©2015. MidAtlantic Employers’ Association. All rights reserved

DATA PRESENTATION STANDARDS Whenever necessary, data within individual job detail reports are either suppressed or adjusted (indicated by dashes, asterisks or the use of italics) to assure confidentiality of individual participant data. Please note the following in reviewing reports: Dash: Data have been suppressed because the number of responses is not sufficient to compute the statistic and safeguard individual participant data confidentiality.
1. At least three (3) responses are required to display any pay information for a job. 2. At least five (5) responses are required to display pay distribution statistics (percentiles) for a job.
Single Asterisk: Indicates that the data in that row is being dominated by one or more company's data. Double Asterisks: Data are not applicable. For example, because range of pay statistics (such as start pay) applies to responding organizations, the weighted averages (weighted by the number of employees) does not apply. Italicized Data: If the data from one or more survey respondents dominate any line of data (50% or more of the employee sample), the number of employees for the dominating organization(s) has been adjusted to reduce the influence of the dominating organization(s) below the 50% threshold. If the same rate appears multiple times (e.g., for 10th Percentile, 25th Percentile, and/or Median), this reflects the influence on the data by the dominating organization(s).
EXAMPLE OF AVERAGE, WEIGHTED AVERAGE, & PERCENTILE CALCULATIONS:
_____________________________________________________________________________________
Org. Number of Employees
Rates Actually Being Paid
Calculations For: Percentile Calculation
Weighted Average
Average Rank Order
List of Rates Paid
A 1 1
$1300 $1400
$1300 $1400
$1350 (1) $1300 10th Percentile ($1310)
(2) $1400 B 3 $1500 $4500 $1500 25th Percentile ($1475)
(1st Quartile) C 1 $1550 $1550 $1550 (3) (4) (5) $1500
$1500 $1500
D 2 1
$1600 $1750
$3200 $1750
$1650 50th Percentile ($1525) (Median)
E 1 $1800 $1800 $1800 (6) (7) (8) $1550 $1600 $1600
Totals= 10 $15,500 $7,850 75th Percentile ($1638) (3rd Quartile)
(9) $1750 90th Percentile ($1795)
(10) $1800 $15,500 / 10 (number of employees) =
Weighted Average = $1,550 (Mean)
$7,850 / 5 (number of organizations)=
Average = $1,570
10
©2015. MidAtlantic Employers’ Association. All rights reserved

Positions Not Published Due to Insufficient Data A - Finance, Accounting, Billing, Credit, Payroll EX-215-X Chief Audit Executive EX-220-X Co rporate Treasurer EX-225-X Chief Tax Executive B - Executive, Administrative, Legal, Staff, General Office, Regulatory EX-110-X Chief Executive Multi-Function Responsibility EX-115-X Chief Operations Executive Non-Manufacturing EX-315-X Chief Staff Legal Counsel EX-320-X Chief Government Relations Executive EX-620-X Top International Manufacturing Executive D - Human Resources, Recruiting, Compensation, Benefits, Training, Safety, Security EX-310-X Compensation and Benefits Manager E - Sales, Marketing, Product Mgmt, Communications, Public Relations, Customer Service, Editorial & Media EX-600-X Chief International Executive EX-610-X Top International Marketing & Sales Executive F - Engineering, Scientific, Chemical, R & D, Engineering Techs, Design, Drafting EX-410-X Indust rial Engineering Head EX-415-X Head Research Engineer EX-420-X Head Product/Development Engineer G - Maintenance, Repair, Installation, Cleaning (Facilities-Equipment), Facilities Mgmt, Mechanics EX-425-X Facility Engineer H - Purchasing, Material Sourcing and Planning, Estimating, Inventory Control EX-605-X Top Supply Chain Executive I - Material Handling, Shipping, Receiving, Packing, Warehousing, Logistics EX-450-X Material s Manager Please keep in mind that this survey report is confidential. It is intended for use by members who contribute information or by organizations that purchase the report. If you are asked to provide information or copy portions of this report, please remember that this report is confidential; reproduction violates copyright laws; and it is unfair to your company and other members who have borne the costs of this survey to allow others who have not shared in the cost to benefit from the results.
11
©2015. MidAtlantic Employers’ Association. All rights reserved
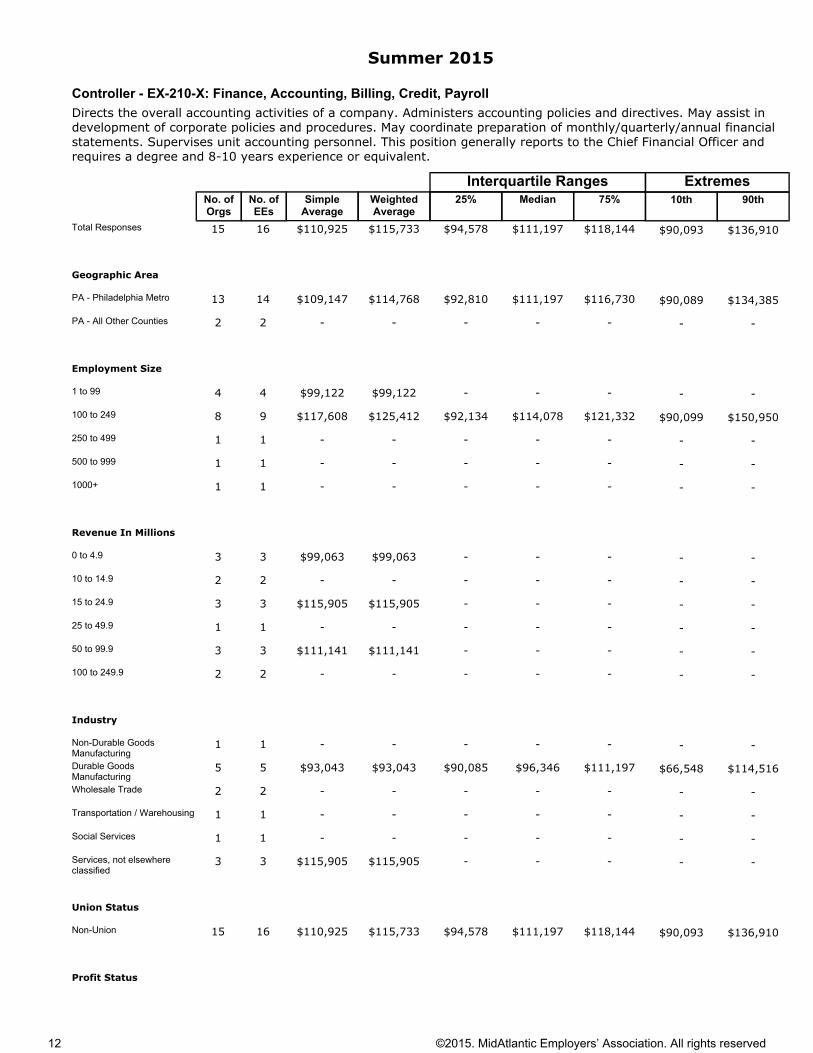
Controller - EX-210-X: Finance, Accounting, Billing, Credit, PayrollDirects the overall accounting activities of a company. Administers accounting policies and directives. May assist in development of corporate policies and procedures. May coordinate preparation of monthly/quarterly/annual financial statements. Supervises unit accounting personnel. This position generally reports to the Chief Financial Officer and requires a degree and 8-10 years experience or equivalent.
No. of Orgs
No. of EEs
Simple Average
Weighted Average
25% Median 75% 10th 90thExtremesInterquartile Ranges
$136,910$90,093$118,144$111,197$94,578$115,733$110,9251615Total Responses
Geographic Area
$134,385$90,089$116,730$111,197$92,810$114,768$109,1471413PA - Philadelphia Metro
-------22PA - All Other Counties
Employment Size
-----$99,122$99,122441 to 99
$150,950$90,099$121,332$114,078$92,134$125,412$117,60898100 to 249
-------11250 to 499
-------11500 to 999
-------111000+
Revenue In Millions
-----$99,063$99,063330 to 4.9
-------2210 to 14.9
-----$115,905$115,9053315 to 24.9
-------1125 to 49.9
-----$111,141$111,1413350 to 99.9
-------22100 to 249.9
Industry
-------11Non-Durable Goods Manufacturing
$114,516$66,548$111,197$96,346$90,085$93,043$93,04355Durable Goods Manufacturing
-------22Wholesale Trade
-------11Transportation / Warehousing
-------11Social Services
-----$115,905$115,90533Services, not elsewhere classified
Union Status
$136,910$90,093$118,144$111,197$94,578$115,733$110,9251615Non-Union
Profit Status
Summer 2015
12
©2015. MidAtlantic Employers’ Association. All rights reserved
No. of Orgs
No. of EEs
Simple Average
Weighted Average
25% Median 75% 10th 90thExtremesInterquartile Ranges
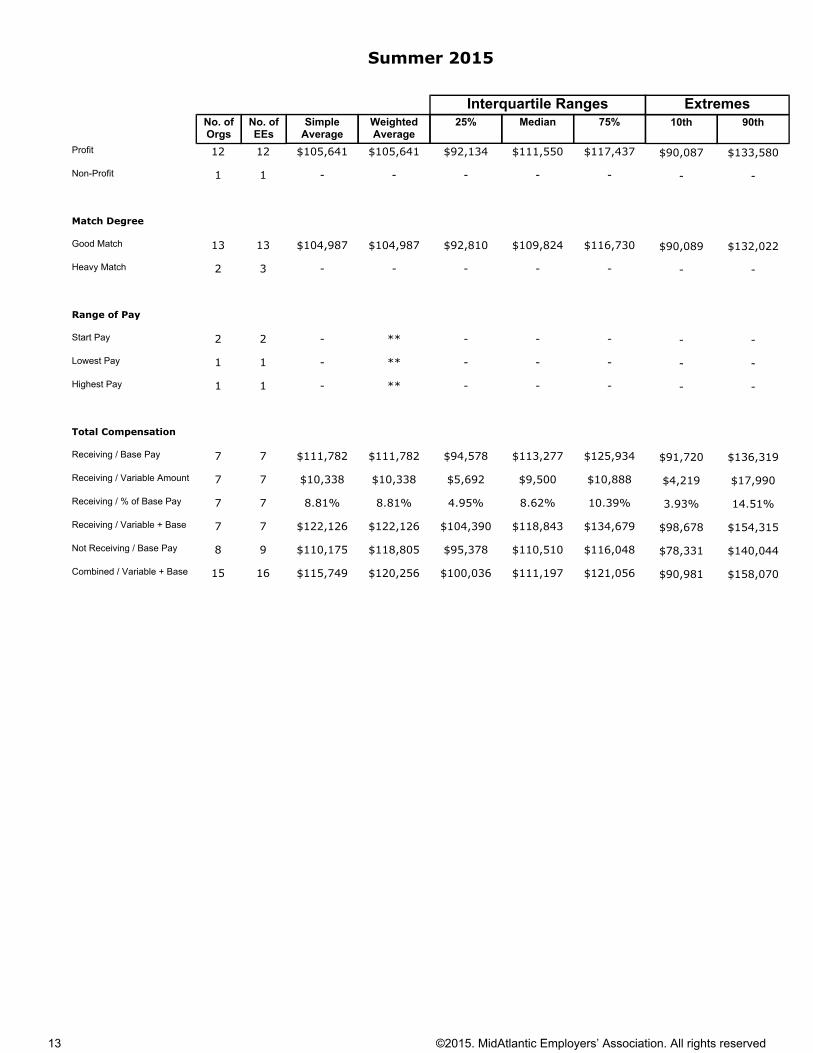
$133,580$90,087$117,437$111,550$92,134$105,641$105,6411212Profit
-------11Non-Profit
Match Degree
$132,022$90,089$116,730$109,824$92,810$104,987$104,9871313Good Match
-------32Heavy Match
Range of Pay
-----**-22Start Pay
-----**-11Lowest Pay
-----**-11Highest Pay
Total Compensation
$136,319$91,720$125,934$113,277$94,578$111,782$111,78277Receiving / Base Pay
$17,990$4,219$10,888$9,500$5,692$10,338$10,33877Receiving / Variable Amount
14.51%3.93%10.39%8.62%4.95%8.81%8.81%77Receiving / % of Base Pay
$154,315$98,678$134,679$118,843$104,390$122,126$122,12677Receiving / Variable + Base
$140,044$78,331$116,048$110,510$95,378$118,805$110,17598Not Receiving / Base Pay
$158,070$90,981$121,056$111,197$100,036$120,256$115,7491615Combined / Variable + Base
Summer 2015
13
©2015. MidAtlantic Employers’ Association. All rights reserved