Embed Size (px)
Citation preview

8/4/2019 Saim Finance)
http://slidepdf.com/reader/full/saim-finance 1/35
SECURITYANALYSIS AND
PORTFOLIOMANAGEMENT
Author : Dr. Dhanesh Khatri
Copyright © Macmillan Publishers India Ltd.

8/4/2019 Saim Finance)
http://slidepdf.com/reader/full/saim-finance 2/35
CHAPTER – 13
TECHNICAL ANALYSIS
Copyright © Macmillan Publishers India Ltd.

8/4/2019 Saim Finance)
http://slidepdf.com/reader/full/saim-finance 3/35
Technical Analysis
Technical analysis means analysis of shareprices and traded volume to predict the near
future price movement.It is 90 per cent psychological and 10 per
cent logical.
Market is driven by the psychology ofinvestors in 90 per cent of the times and for10 per cent of the times logical factors affectthe market.
8/4/2019 Saim Finance)
http://slidepdf.com/reader/full/saim-finance 4/35
Technical Analysis (Cont.)
Premises of technical analysis
Every kind of price-sensitive information is discountedinto prices.
Prices follow a particular path continuously.
Type of charts
Line Chart
Bar Chart
Point & Figure Chart
Candle Chart

8/4/2019 Saim Finance)
http://slidepdf.com/reader/full/saim-finance 5/35
Use of Technical Analysis
To Predict Overall Market Trends
To Predict for Individual Shares Trends
To predict overall market trends
Prediction about the overall market is based onthe movement of an index representing the trendof market.

8/4/2019 Saim Finance)
http://slidepdf.com/reader/full/saim-finance 6/35
Features of Index Constituents
Minimum impact cost
High value representation in marketcapitalization
Large number of trades per day
Large traded volume per day

8/4/2019 Saim Finance)
http://slidepdf.com/reader/full/saim-finance 7/35
Tools for analysis of overall market trends
Dow Jones Theory
Advance Decline Index
Client Account Position
8/4/2019 Saim Finance)
http://slidepdf.com/reader/full/saim-finance 8/35
DOW JONES THEORY
Developed by Charles Dow Jones
He was of the opinion that movement in share
prices is always supported by a definite activity – business trends, overall business transaction,fundamental factors affecting the shares, etc.
He created two averages (indices):
Dow Jones Industrial Average (DJIA) Dow Jones Transport Average (DJTA)
8/4/2019 Saim Finance)
http://slidepdf.com/reader/full/saim-finance 9/35
DOW JONES THEORY
With the help of movement of both of theseaverages following signals can be generated:
Buying signal
Selling signal
Signal of indifference
Trends According to Dow Jones TheoryUptrend
Downtrend
Horizontal Trend
8/4/2019 Saim Finance)
http://slidepdf.com/reader/full/saim-finance 10/35
UPTREND
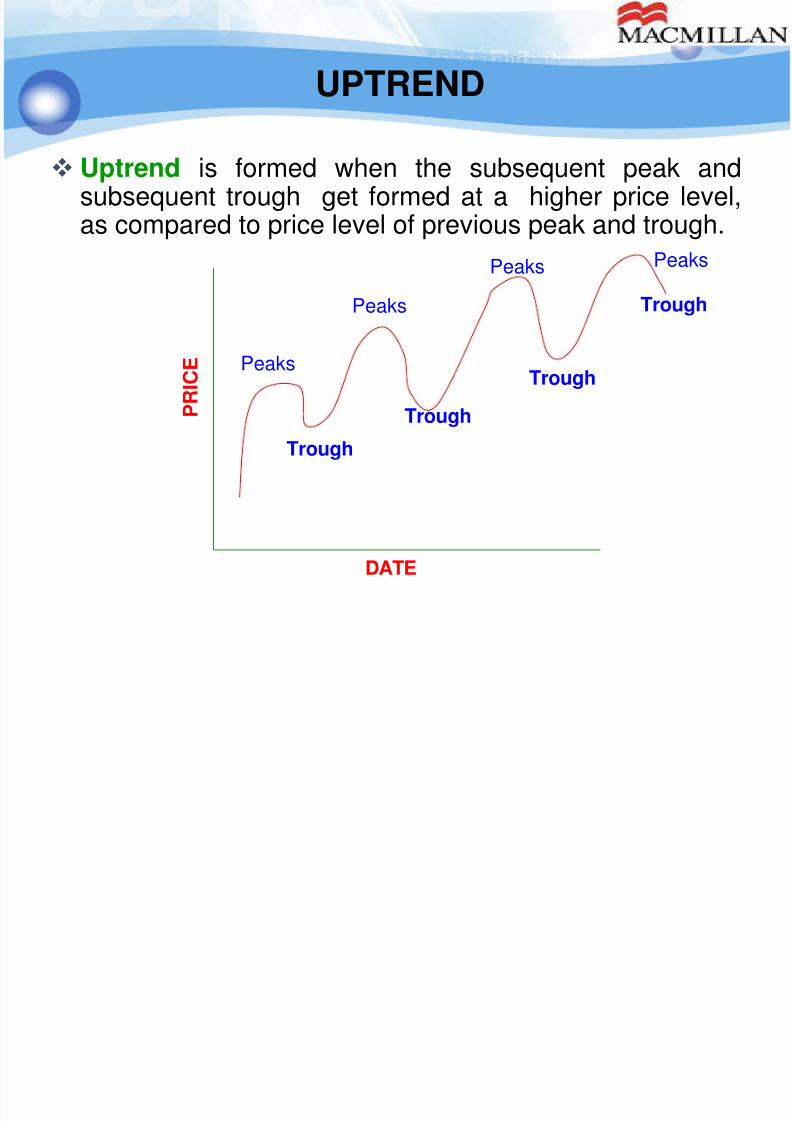
Uptrend is formed when the subsequent peak andsubsequent trough get formed at a higher price level,as compared to price level of previous peak and trough.
Peaks
PeaksPeaks
Peaks
Trough
Trough
Trough
Trough
DATE
P
R I C E
8/4/2019 Saim Finance)
http://slidepdf.com/reader/full/saim-finance 11/35
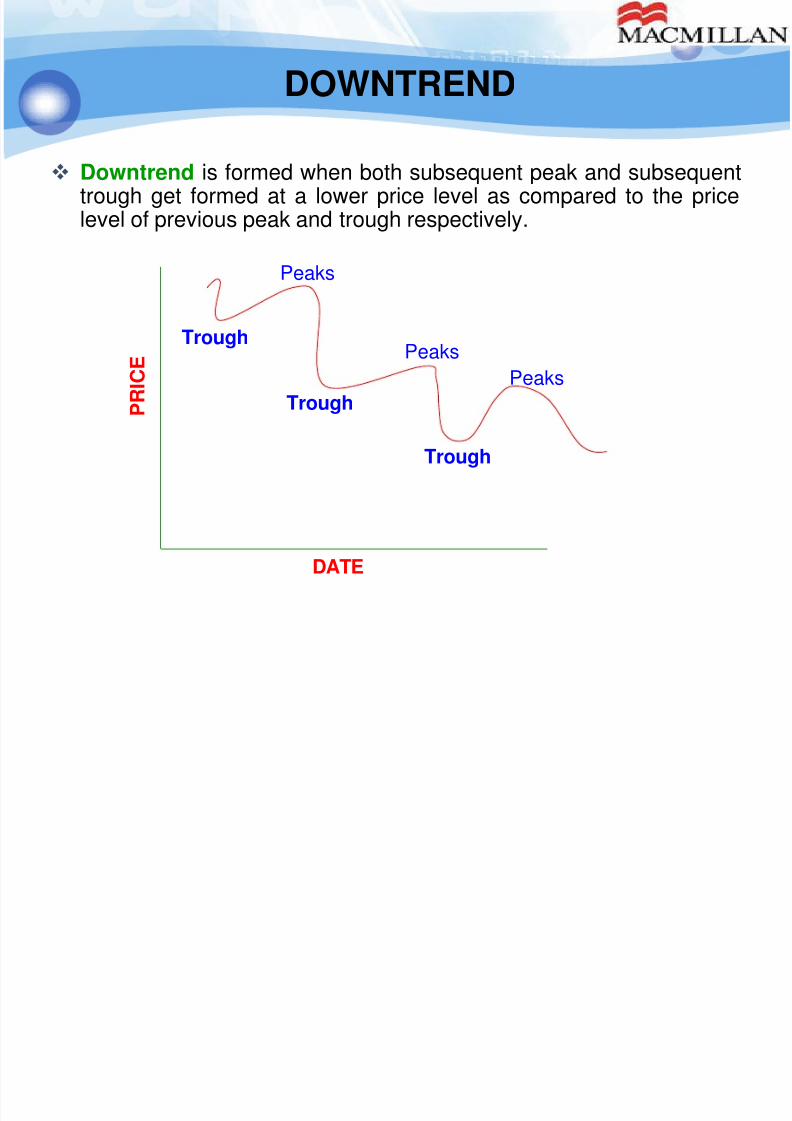
DOWNTREND
Downtrend is formed when both subsequent peak and subsequenttrough get formed at a lower price level as compared to the pricelevel of previous peak and trough respectively.
Peaks
Peaks
Peaks
Trough
Trough
Trough
DATE
P R I C E
8/4/2019 Saim Finance)
http://slidepdf.com/reader/full/saim-finance 12/35
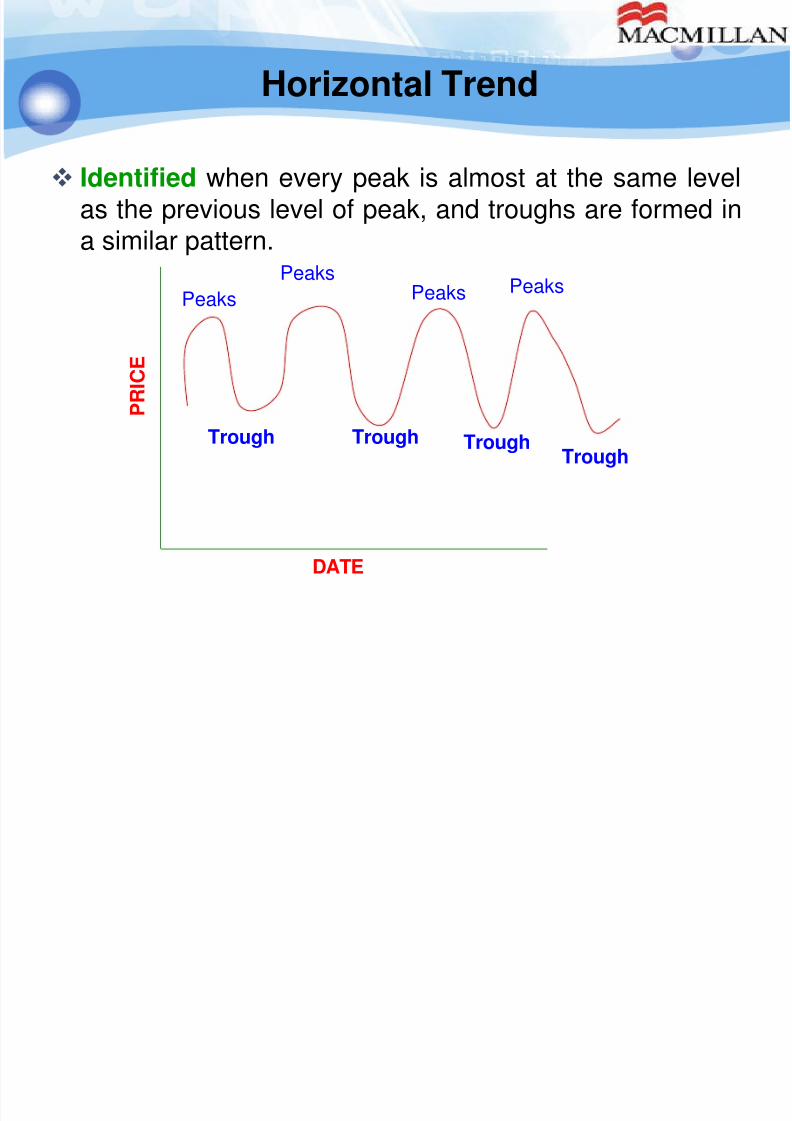
Horizontal Trend
Identified when every peak is almost at the same levelas the previous level of peak, and troughs are formed ina similar pattern.
DATE
P R I C E
PeaksPeaks Peaks Peaks
Trough Trough TroughTrough
8/4/2019 Saim Finance)
http://slidepdf.com/reader/full/saim-finance 13/35
Advance Decline Index
Advance decline index is the difference between thenumber of shares showing an advance and the numberof shares showing a decline on a particular trading day.
Signals about the market
If price index and advance decline index are rising, it indicatescontinuation of upward trend in the market
If price index and advance decline index are falling, it indicatescontinuation of down trend in the market
If price index is rising but advance decline index is falling, orvice-versa, it indicates divergence in the price trend in the nearfuture
8/4/2019 Saim Finance)
http://slidepdf.com/reader/full/saim-finance 14/35
Client Account Position
As per the requirements of market regulator,
every broker is required to maintain a separatebank account for keeping client money
The balance position of this account can be
used to indicate expected market movement.

8/4/2019 Saim Finance)
http://slidepdf.com/reader/full/saim-finance 15/35
Tools to Predict for Individual Shares Trends
Moving AverageAnalysis
Oscillators ChartPatterns
MACD ROS RSI

8/4/2019 Saim Finance)
http://slidepdf.com/reader/full/saim-finance 16/35
Moving Average Analysis
Moving average is simply the rolling average ofpast prices.
Following signals can be generated:
Buying Signals
Selling Signals

8/4/2019 Saim Finance)
http://slidepdf.com/reader/full/saim-finance 17/35
Oscillators
Oscillators are fine tools to predict futuremovements much before such movement takesplace; these leave a sufficient time gap to take
decisions. Prominent oscillators are as follows:
MACD (Moving Average Convergence &Divergence)
ROC (Rate of Change)RSI (Relative Strength Index)
8/4/2019 Saim Finance)
http://slidepdf.com/reader/full/saim-finance 18/35
MACD
MACD is the difference between short-term movingaverage and long-term moving average.
MACD = Short Period Moving Average – Long Period
Moving Average Buying signals: Whenever, MACD line is above the
moving average line of MACD; MACD line movestowards the average line and thereafter moves towardsupside. It is a buying signal.
Selling signals: Whenever MACD line is below the lineof moving average. At this point MACD moves towardsaverage line but fails to break through it, instead startsmoving towards downside; it is a sell signal.

8/4/2019 Saim Finance)
http://slidepdf.com/reader/full/saim-finance 19/35
ROC
In calculating ROC, the current days’ market price isdivided by the price that had prevailed few days ago forthe share.
ROC is an indicator, which helps in identifying ‘over brought’ and ‘over sold’ market.
Buying signals: When ROC is more than one (ROC >1)and moving upward continuously, it indicates that marketis likely to move upward.
Selling signals: When ROC line is increasing but thepace has declined, it indicates that market is about toreach the over-bought zone, after which it is likely todecline.
8/4/2019 Saim Finance)
http://slidepdf.com/reader/full/saim-finance 20/35

8/4/2019 Saim Finance)
http://slidepdf.com/reader/full/saim-finance 21/35
RSI
Under RSI, gains and losses of the prices overthe immediate previous days’ price for a certainperiod is calculated.

8/4/2019 Saim Finance)
http://slidepdf.com/reader/full/saim-finance 22/35
RSI
Buying signals:
When RSI is more than 50 and moving upwardcontinuously, it indicates that the market is likely to move
upward.
Selling signals:
When RSI line is increasing above the 50 mark but thepace of increase has declined, it indicates that market isabout to reach the over bought zone, after which, it islikely to decline.
One should take precaution at this level; or a risk averseinvestor should wait for more clear signals.

8/4/2019 Saim Finance)
http://slidepdf.com/reader/full/saim-finance 23/35
RSI Continued
Over Bought Zone : When RSI is at 70 or abovelevel it indicates over bought market which islikely to take a downward turn.
Over Sold zone : When RSI is at 30 or belowlevel it indicates over sold market which is likelyto take a upward turn.

8/4/2019 Saim Finance)
http://slidepdf.com/reader/full/saim-finance 24/35
Chart Patterns
These patterns are used to generate signalsabout the expected movement of the market
These chart patterns can be generated for theindex value as well for the prices of individualshares
These help in identifying the following:
Support Level is the lower price level at whichdemand for the shares gains momentum.
Resistance Level is the upper price level at whichsupply for the shares gains momentum.

8/4/2019 Saim Finance)
http://slidepdf.com/reader/full/saim-finance 25/35
Support & Resistance in Upward Moving Market

8/4/2019 Saim Finance)
http://slidepdf.com/reader/full/saim-finance 26/35
Support & Resistance in Downward Moving Market

8/4/2019 Saim Finance)
http://slidepdf.com/reader/full/saim-finance 27/35
Support & Resistance in Horizontal Trend

8/4/2019 Saim Finance)
http://slidepdf.com/reader/full/saim-finance 28/35
Type of Chart Patterns
Head and Shoulders
Inverse Head and Shoulders
Triangle
Flag

8/4/2019 Saim Finance)
http://slidepdf.com/reader/full/saim-finance 29/35
Head & shoulders
Head & Shoulders reflects resistance andsupport level in an upward-moving market.

8/4/2019 Saim Finance)
http://slidepdf.com/reader/full/saim-finance 30/35
Inverse Head & Shoulders
Inverse Head & Shoulders reflects resistanceand support level in downward-moving market.

8/4/2019 Saim Finance)
http://slidepdf.com/reader/full/saim-finance 31/35
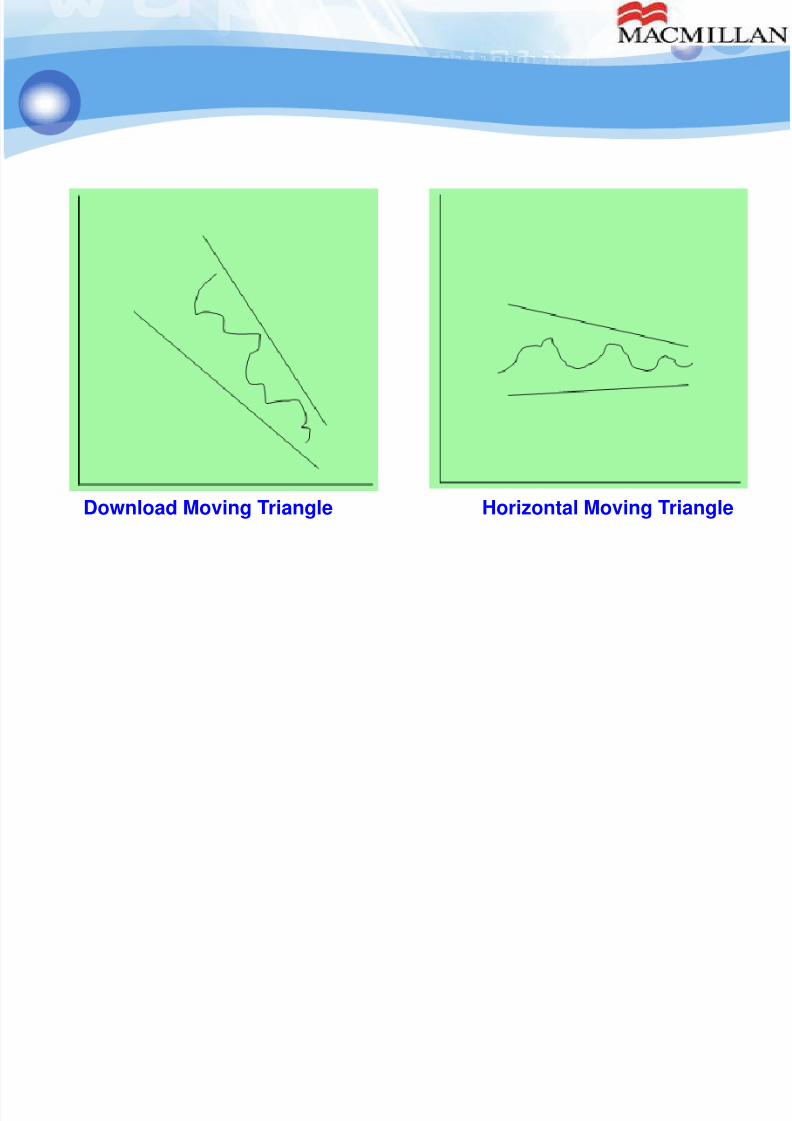
Triangles
Triangles are the price patterns, which show themovement of shifting resistance and support level.
Upward Moving Triangle
8/4/2019 Saim Finance)
http://slidepdf.com/reader/full/saim-finance 32/35
Download Moving Triangle Horizontal Moving Triangle

8/4/2019 Saim Finance)
http://slidepdf.com/reader/full/saim-finance 33/35
Flag
A flag is identified as a narrow movement of themarket either after an up trend or a down trend.
Flag Inverted Flag
8/4/2019 Saim Finance)
http://slidepdf.com/reader/full/saim-finance 34/35
Confirmation through Traded Volume
Buying and selling signals generated with thehelp of different tools like Dow Jones Theory,Moving Average, Oscillators – MACD, ROC,
RSI, and Chart Patterns need to be confirmedwith the help of traded volumes.
A thin traded volume simply indicates lack ofsupport in the indicated trend by majority of the
investorsA heavy traded volume, indicates about
association of more and more investors for theindicated trend

8/4/2019 Saim Finance)
http://slidepdf.com/reader/full/saim-finance 35/35