Embed Size (px)
Citation preview

SAGA Working Paper December 2002
Water Pricing, the New Water Law, and the Poor: An Estimation
of Demand for Improved Water Services in Madagascar
Bart Minten Cornell University
Rami Razafindralambo
LDI
Zaza Randriamiarana INSTAT
Bruce Larson
University of Connecticut
Strategies and Analysis for Growth and Access (SAGA) is a project of Cornell and Clark Atlanta Universities, funded by cooperative agreement #HFM‐A‐00‐01‐00132‐00 with the United States Agency for International Development.
Water Pricing, the New Water Law, and the Poor:
An Estimation of Demand for Improved Water Services in Madagascar
Bart Minten (Cornell University)1 Rami Razafindralambo (LDI)
Zaza Randriamiarana (INSTAT) Bruce Larson (University of Connecticut)
USAID - Ilo program - Cornell University2 Report S12
in collaboration with PAGE, PACT, and ONE
1 The surveys that this study relies on were financed under the environmental economics training program of the USAID-funded PAGE project (Projet d'Appui en Gestion Environnementale) of IRG (International Resource Group). Special thanks go to Andy Keck and Philip Decosse who managed this program and advised on the set-up and interpretation of these studies. The authors would further like to thank Solohery Rakotovao, Francis Andrianarison, Josiane Rarivoarivelomanana, Alain Locussol, Alex McPhail as well as participants at workshops in Antananarivo and Fianarantsoa for useful comments and suggestions. However, the authors are solely responsible for content. 2 This program is financed by USAID under cooperative agreement “Improved economic analysis for decision making in Madagascar” No. 687-A-00-00-00093-00.
2
Abstract
Generalized cost recovery is one of the basic principles of the new Water Law that
has recently been adopted by the Malagasy government. However, the effect of this change in policy is still poorly understood. Based on contingent valuation surveys in an urban and a rural area in southern Madagascar, this study analyzes the effect of changes in prices for water services. The results suggest that a minimum size of 90 households in a village is necessary to reach full cost recovery for well construction. Given that this is significantly above the current size of villages in the survey area, full cost recovery seems therefore impossible and subsidies are necessary to increase access to improved water services. Cost recovery for maintenance is relatively easier to achieve. In urban areas, water use practices and willingness to pay for water services depend highly on household income. To better serve the poor, it is therefore suggested that rich households, who rely on private taps, cross-subsidize poor households as a significant number of households is unwilling or unable to pay for water from a public tap. Given that public taps make up a small part of the total consumption of the national water company JIRAMA, lower income from public taps are shown to have only a marginal effect on its total income. However, as experiences in other countries as well as in Madagascar have shown, a fee on public taps is necessary as water for free leads to spoilage, does not give any incentive for the distributor to expand networks, and might therefore be a bad policy for the poor overall.
3
List of Figures Figure 1: Access to improved drinking water sources in rural areas in Sub-saharan Africa
(for countries with GNP per capita <$1,000) Figure 2: Rural well construction: % of households participating by bid level and village
income level Figure 3: Benefits and costs of well construction as a function of village size Figure 4: Water use (liters per household per month) as a function of distance to a public
tap – simulation based on regression results Figure 5: Number of customers in function of WTP per liter at public tap Figure 6: Different scenario’s with same income effects for JIRAMA
List of Tables Table 1: Access to safe water in Madagascar (% of the population) Table 2: Descriptive statistics of households in villages around National Park of Isalo Table 3: Determinants of water use (in ln(liters) per household per day); rural area Table 4: Willingness to pay regression for well construction (logit); rural area Table 5: Willingness to pay regression for well maintenance (logit); rural area Table 6: Water use and practices by income level; urban area Table 7: Descriptive statistics on socio-economic variables and water practices; urban
area Table 8: Determinants of water use (in ln(liters) per household per month); urban area Table 9: WTP for improved water quality at the public tap (logit); urban area Table 10: WTP for improved private connection; urban area Table 11: Importance and water prices by category (Fianarantsoa ville); urban area
4
1. Introduction
Water is one of the most important natural resources as access to safe water is vital for survival. However, despite significant investments in the water sector, the outlook on access to safe water remains grim at the global level (World Bank, 2001). This holds also in Madagascar. Based on a national representative survey (Enquête Permanente auprès des Ménages), it is estimated that by 1999, less than one fifth of the national population had access to sources of clean drinking water – either piped into dwelling or from public taps. Those with access to clean drinking water are by and large urban dwellers. Hence, to improve access to safe water, significant investments would be necessary, especially in rural areas.
It is estimated that 70% of all endemic illnesses in Madagascar are waterborne. Inadequate water quality and low sanitation coverage partly explain the high prevalence of diarrhea, which remains the major illness in Madagascar.3 These water and sanitation related sicknesses reduce income and welfare and put severe burdens on health services. However, major investments are planned in Madagascar to improve access to safe water (GOM, 2001). It is anticipated that investments in increased sanitation coverage and improved water quality (better water filtering, chlorinating, as well as education and hygiene targeting) could help to reduce the number of deaths and illnesses from water-borne diseases (World Bank, 2001).
Moreover, a new Water Law (the ‘Code de l’Eau’) has recently been adopted by the government. A major change with the previous policy is that water will not be considered a free good anymore and that cost recovery becomes an essential part of water distribution policy. However, the effect of this policy is still poorly understood. While numbers exist on the costs of water infrastructure investments, there are no monetary estimates of the benefits to households in Madagascar.
Hence, water utilities do not have adequate information on which to base decisions regarding tariff design. If prices are set too low, revenues will not be sufficient to cover their cost of supplying water. If prices are set too high, households will not be able to afford water.4 To provide insights in the demand for water by households, a study was done to estimate the willingness to pay and the benefits of improved water quality to households.
Two surveys - one in urban areas and one in rural areas - were organized at the
end of 2000. The objective of these surveys was to determine (1) current water use practices and attitudes; (2) whether households are willing to contribute to the operation and the maintenance costs of their water system so that it can be kept running or, 3 Also, there have been outbreaks of cholera, caused by lack of sanitation (about 10,000 cases with 550 fatalities in 1999 as reported by WHO). 4 For example, the GOM (2000) illustrates the high sensitivity to the Internal Rate of Returns (IRR) of the willingness to pay of households for an investment in piped water systems of a hypothetical small scale independent provider. A water budget of $2.50/month per household gives an IRR of 32% while $2.00/month per household would make the IRR negative. This illustrates the importance to have reliable estimates on effective water demand.
5
alternatively, whether a new infrastructure for improved water quality could be installed; (3) if users are willing to contribute and how much they can afford to pay; and (4) what the implication would be of a cost recovery system.
The structure of the study is as follows. In section 2, the overall water policy context and access to improved water services in Madagascar is discussed. The methodology for estimating the demand for improved water services is explained in section 3. In section 4 and 5, the results of the survey in rural areas (the periphery of the National Park of Isalo) and in urban areas (Fianarantsoa city) are analyzed respectively. We finish with policy conclusions in section 6.
2. Water use, water pricing and the new Water Law 2.1. Water use in Madagascar
Rainfall is highly unevenly distributed in Madagacsar: it is almost as high as 4000 mm per year in the North East compared to one tenth of this level (400 mm per year) in the most southern part of the country. This rainfall pattern relates to access to water problems. The most eminent water problems are in the South as it is necessary to dig progressively deeper to find groundwater. In the East, water is abundant but it is increasingly polluted (Rabemanambola, 1997).
Data from a recent national household survey illustrate that by 1999, less than one fifth (19 percent) of the national population had access to sources of clean drinking water – either piped into dwellings or from public taps. As Table 1 illustrates, this was a 2 percent improvement from 1993 when 17 percent had access to publicly supplied water. In addition, among those in the poorest quintile, even fewer people had access to clean water in 1999 than in 1993. The fall in the rate from 11 percent to 8 percent for this segment of the population represents a decline from 270,000 to 233,000 in the absolute number of individuals in this quintile with access to clean drinking water.
Those with publicly supplied water were by and large urban dwellers. While less than 10 percent of the rural population had water access in 1999, just under 60 percent of the urban population did. And although the percentage of urban dwellers with access fell from 64 to 59 percent, the absolute number of individuals actually rose by approximately 460,000 due to the one third increase in the urban population between 1993 and 1999. At the province level, we see that conditions in Antsiranana and Mahajanga deteriorated in terms of percentages. Even though more individuals in both regions had access to clean drinking water in 1999 and 1993, because increases in the provision of publicly supplied water did not keep up with the growth of the population, the rates of access fell by some 10 and 16 percent, respectively. In the meantime, the percentages of the populations with access to clean drinking water in the remaining four provinces rose (Razafindravonona et al., 2001).5 5 The same results show up based on a national community survey conducted in 1993. In rural areas, people have little access to modern water facilities: almost 70% of the villages get water from a river, a lake or a

6
It seems that the situation has become worse over the last five years although
access improved compared to the beginning of the decade. Comparing different national surveys, INSTAT (2000) showed that the percentage went up by the middle of the nineties and declined by the end of the decade. Access to potable water in urban areas declined. In urban areas, most of the water infrastructure was done in the sixties and this infrastructure is becoming obsolete. While new installations have been constructed, this happened at a rate that was inferior to urban sprawl.
In rural areas, water supply projects were mainly managed by the state during the ‘decennie de l’eau potable’ (1981-1990). In the nineties, water supply projects were mostly done through help of the donor community, especially UNICEF, the World Bank, Japan as well as some major NGOs such as CARE, FIKRIFAMA6, Caritas and FJKM (Rabemanambola, 1997). In the southern part of the country, AES (Alimentation en Eau dans le Sud), a public entity, supplies water to some urban and rural centers. Overall, the majority of the rural population does not have access to clean water and rather small improvements were seen over the last decade.
In comparison to other countries, access to safe water is low in Madagascar. While access to improved water in urban areas is similar to other Sub-Saharan Africa, Figure 1 shows other Sub-Saharan African countries and their level of per capita GNP with respect to the percentage of the population having access to improved drinking water sources in rural areas. Access to safe water in Madagascar is clearly below the trend, indicating the low access to potable water even given its level of GNP (World Bank, 2001).7 2.2 Water pricing and the new Water Law
Water pricing in Madagascar depends on the provider (state, NGOs, or private sector). In rural areas, NGOs that are active in this area, usually require that a village water committee is set up that contributes directly to well maintenance. For example, to receive services of FIKRIFAMA, communities must make formal demands and establish village water committees that are responsible for the maintenance of the water systems (Rabemanambola, 1997). In general, no direct payment per unit of water is asked for.
spring. In addition, almost 17% uses a well without a pump. Only 10% has access to safe drinking water. The national MICS survey, done in 2000, shows similar results (INSTAT, 2000). 6 FIKRIFAMA (Fifanampiana Kristiana ho an’ny Fanmpandrosoana eto Madagascar) is a NGO with religious affiliations that is quite active in constructing water supply facilities in rural areas. They are very active in the Highlands. 7 Note that the definition of access to safe water used here is: the share of the population with reasonable access to an adequate amount of safe water (20 liters a person a day). In rural areas the definition implies that members of the household do not have to spend a disproportionate part of the day fetching water. It is thus different from the more restrictive one used in other tables. Therefore, care should be taken in comparing these figures with those in other tables (World Bank, 2001).

7
In urban areas, most water is provided by the parastatal JIRAMA (Jiro Sy Rano Malagasy). JIRAMA is the state owned combined water and power utility and is responsible for service provision in urban areas. In August 2001, JIRAMA served a total of about 100,000 connections (JIRAMA, 2001) of which 90% were domestic. Domestic consumption represents 70% of consumption, of which 20% through public standpipes (GOM, 2000). The JIRAMA tariff is uniform across the country.8 While its tariff is perceived to be high, it is only half of the price practiced in Ghana or Ivory Coast (GOM, 2001).9 In urban areas, there are few private providers that are active yet. However, some NGOs such as CDA, CARE and ANAE operate in this area. Pricing practices differ significantly between them.
Currently, water consumed at public standpipes is billed to municipalities. The majority of these municipalities have not paid their bills since 1994 (GOM, 2000). One of the reasons seem to be that the municipalities responsible for management of local water supplies have few financial resources and are afraid of asking money for water of their poor constituents. JIRAMA estimates the value of these outstanding bills at 16 million $ in 1999 (GOM, 2000). This has led to lack of funds for investment of extensions of the network, especially in poorer areas.
A new Water Law and a new legal framework have been approved in December 1998 with the purpose to improve access to safe water in Madagascar. The parastatal JIRAMA has been managing until recently all urban water supplies as well as electricity in Madagascar. Under the new Water Law, JIRAMA will evolve from a ‘Societé Anonyme’ towards an enterprise that can rely on private funding. The new Water Law allows also that private enterprises will have the right to supply water. One of the objectives of the new water policy is to get at almost national water coverage in 2015.10
One of the principles of the new Water Law is generalized cost recovery11, including investment cost, maintenance costs as well as management costs. Cost recovery will also be required on public taps which municipalities in general did not pay for. The Water Law foresees that this will be achieved through decentralized management, i.e. municipalities will have to manage own water supplies. However, the new Water Law also specifies that, while water tariffs should reflect real costs, pricing should take into account the capacity of beneficiaries to pay for water services. It is acknowledged that in rural areas total costs can probably not be imputed. Therefore, a ‘Fond National de l’Eau
8 The prices for water charged by JIRAMA are 975 Fmg/m3 (0.15$) for small customers (private users of <1000 m3) and public standpipes and 2305 Fmg/m3 (0.35$) for the bigger ones (private users of >1000 m3; administration) (JIRAMA, 2001). 9 It should be noted that consumers have to pay on top of this price, a sanitation tax of 10%, a value added tax of 20% for consumption higher than 10m3, and a small stamp fee. 10 The new water policy aims to have 100% urban coverage and 80% rural coverage by 2015 (GOM, Document pour la Stratégie de la Reduction de la Pauvreté - Interimaire, 2001). 11 “Access to public water services, whether through standpipes or individual connections should not be free.” (Code de l’Eau, 1998)

8
et de l’Assainissement’ will be established that will try to guarantee water access to the poorest.12
It is clear that appropriate water pricing is essential in paying for the investment and maintenance cost of water infrastructure and it is crucial for the ambitious goal of trying to reach national coverage. By looking at pricing issues and by studying the demand for water services by the local population, this study tries to contribute to a better anticipation of households’ behavior. The demand for water services is elicited through the methodology of contingent valuation. Before we turn to the results, we will first briefly discuss this methodology that is commonly used in this type of studies (Briscoe et al., 1990; Whittington et al., 1990; Whittington et al., 1989; World Bank Water Demand Research Team, 1993). 3. The methodology of contingent valuation
Valuation in environmental and resource economics is done through direct or indirect approaches. In the direct approach, the researcher seeks to evaluate the values of amenities or resources using surveys or experimental techniques. People are asked directly their Willingness-To-Pay (WTP) or their Willingness-To-Accept (WTA) for a certain change. An example of the direct approach is the Contingent Valuation Method (CVM). Indirect approaches are based on techniques where values are obtained through actual market information. The value of the environmental good is revealed indirectly, when a person buys a product, with which the environmental good is related. Examples of these techniques are the hedonic pricing method, the wage differential approach, the travel cost method, and the preventive expenditures method (Pearce and Turner, 1990).
The contingent valuation method, which is used in this study, has increasingly been used for environmental valuation and has become widely accepted, both by economists and by policy-makers. The major attraction of the CVM is its ability to address a broad range of policy interventions and to take into account nonuse values. International experiences in the last decades have built up significant knowledge and has improved the technique considerably, especially to reduce different types of biases that hampered initial studies. There has been considerable analysis in the international literature on the benefits and drawbacks of alternative methods. Detailed guidelines exist now on how this type of survey should be undertaken.13
The CVM centers around the need to establish a set of hypothetical circumstances in which the respondent is able to make a valuation. The respondent is asked after the description of a scenario to reveal their willingness-to-pay for a benefit or their willingness-to-accept by way of compensation to tolerate a cost. Contingent valuation studies share well defined common elements. The questionnaires contain questions on 1)
12 “Tariff systems must include provisions allowing for access to potable water by low-income groups” (Code de l’Eau, 1998) 13 The technique has even been accepted by courts in the United States for assessment of the value of damages.

9
a scenario of a policy, project or program; 2) a mechanism so that respondents reveal values for the policy, project or program; and 3) questions on the socio-economic characteristics of the respondents. These socio-economic data help the researcher understand and validate the valuation through econometric analysis (Mitchell and Carson, 1989).
A commonly used technique in the CVM is the referendum elicitation procedure. In this method, the question is formulated as a closed yes-no question. The sample is then split into different sub-groups, which are presented with a different price ("bid" levels) for the hypothetical good or service in question. As this type of questioning resembles market behavior and reduces the problem of starting point bias, most CV practitioners favor using this methodology (Arrow et al., 1993). This method is used in both surveys that are discussed below. 4. Water use and willingness-to-pay for water in rural areas: the case of the periphery of the National Park of Isalo14 4.1. Introduction
As indicated above, access to potable water is especially problematic in rural areas in Madagascar. In the case when improved water infrastructure is available, pricing practices differ as there is no single institution or association that manages water supply in rural areas. However, rural water consumers do not pay in general for water on the basis of quantity consumed. Most projects that construct wells in Madagascar do so in communities that explicitly ask for wells and show some sort of participation, in construction as well as in maintenance. Well construction and maintenance is then usually organized by a community water committee.
While the majority of the rural population relies on local natural sources or rivers/lakes for drinking water, these are not available everywhere. In the case when sources are not available, alternative commercial water markets might develop. Rabemanambola (1997) describes some of these commercial water markets in the Southern part of Madagascar. In some cases, water is bought from cistern trucks being run by private water vendors. He reports that water is sold at very high prices by these private enterprises. However, there are no statistics available on the importance of this type of rural water supply at the national level. 4.2. Sampling frame and methodology
The survey in rural areas was conducted in villages around the National Park of Isalo, in the south of Madagascar. This site was chosen after consultation with ANGAP (Association Nationale de la Gestion des Aires Protégées) and ANAE (Association Nationale des Actions Environnementales), the institutions that have water supply 14 The results in this section are largely based on those reported in Randriamiarana (2001).

10
activities in the area and that showed interest in the results of this study. 180 households were surveyed in 8 villages. These eight villages were selected based on their location with respect to the park: 2 villages each to the north, east, west, and south of the park. Every household in the selected village was interviewed. None of these villages has a well and households rely on traditional water sources and rivers for their water needs: 38% and 60% of the population report to rely on a natural water source or on a lake/river respectively (Table 2).
The survey was administered with the chief of the household or with their spouse. The survey instrument was in Malagasy to avoid mistakes in translation from French. It consisted of three parts on: 1/ socio-economic characteristics of the household; 2/ water use and attitude towards water; and 3/ a contingent valuation question. The survey was conducted by a team of five enumerators and one supervisor during five weeks in the period October/November 2000. It took on average 45 minutes to fill out per household.
The contingent valuation used the closed question format. In a first question, households were asked if they were ready to pay a specific amount for the construction of a well in their village. An explicit reference was made to a similar well construction in villages in the area to make the scenario as plausible as possible. Second, if respondents accepted the bid, they were asked how certain they were of their answer using a polychotomous choice format.15 Third, if they accepted, they were asked how they would pay for the amount that was proposed. The second and third questions were added as consistency checks, to make sure that the respondents would give careful thought to the number that was mentioned and to minimize the problem of “yea-saying”. After pre-testing, seven bid levels were chosen. These bid levels were randomly assigned to the 180 households. It was made sure that all bid levels were present in every village. In a second Willingness-To-Pay question, households were asked about their participation for maintenance costs. The same methodology as for the first question was used: a closed format WTP question was formulated and seven bid levels were identified after pre-testing. 4.3. Current water use practices
Table 2 shows some basic descriptive statistics of the households that are living in the survey villages. Average household size is 4.6 persons. The majority of the households make their living out of agriculture. Total income is low and average monthly income per household is only as high as 2,5 million Fmg or 85$ per capita, consistent with the low per capita GNP in Madagascar and the lower income in rural areas (Razafindravonona et al., 2001). Female headed households make up 14% of the households. Education levels are very low: almost half of the chiefs of household have never attended school and almost 60% of them state they can not read or write.
15 Using 4 categories: a. Very sure; b. Relatively sure; c. Almost sure; d. Not sure. When the household answered the third or fourth category, they were changed to the refusal category to diminish the yes-saying effect.
11
Most of the households in the surveyed villages get their water from a river or from a natural source. Water collection is mostly done by women: 87 % of the people who often or always collect water are women. On average, they spend 12 minutes to get to the place where they haul water. None of the households report long distances: the time for a one-way journey varies between 1 and 60 minutes. Almost none of the households report that they have to queue for their water. Water from these sources is almost exclusively used to drink and to prepare meals. A few households use it for washing while none uses it for laundry. All households, except one, report that somebody from within the household is responsible for the hauling of water. Only one household in the eight villages relies on outside help. Households use on average 31 liters a day in the dry season. There is almost no difference between water use in the dry and wet season. Most households mention also that water supply is steady during these two periods.
A regression was run to explain variation of water use between households (Table 3). Water use at the household level is explained by different factors. An important determinant is the number of persons in the household. The elasticity is estimated at around 0.31, indicating that for a doubling of the household size, water use would go up by 31%. This seems small at first sight. However, as most households indicate that they mainly use water for cooking purposes, the water needs for one extra person might indeed not raise proportionally. A second significant determinant is income. Richer households use more water: the elasticity is evaluated at 11%.16 The type of source does not seem to matter. Households that use water from the river/lake, use as much water than those that use natural water sources. Surprisingly, the coefficient on distance to the water source was not significant.17 However, as all water sources in the eight villages are rather close to the households, lack of variation might be an explanation.
Table 2 illustrates also the perceptions on water quality. Most users give a good evaluation for taste and smell of water from the water sources they use. However, 33% reports that color looks "medium" or "bad" in the current system. A high 83% of the households report to be satisfied with the current water. As in urban areas, few rural households see a link between water use and sickness as only 8% of the households mention that water was the cause of diarrhea in the last 12 months. This is a low number especially given that interviewees mention they rarely boil water before drinking – in contrast to urban areas. Hence, at first sight, it seems that there is little demand for improved water services in these rural villages. However, when households were asked if it was important to improve water services, most households thought that it was “important” or “very important” and an important group of households state they are willing to contribute towards improved water quality. This is analyzed in the next section. 16 Given the high collinearity between income and household size, a second regression was run where water use per capita was used as dependent variable. In this case, income was a little less influential: its elasticity was estimated at 8%. 17 Unfortunately, distances and time needed to walk to the well were missing for 43 households. To allow us to use all information in the regression analysis, distances were imposed based on information on the village that the household lived in and on a self-reported far/non-far statement. Regressions were run using the imposed distances as well as with the smaller dataset. No significant changes of coefficients were noticed.
12
4.4. Willingness to pay for well construction and maintenance
Given that no improved water infrastructure was available in the villages that were surveyed, the WTP question focused on the construction and maintenance cost for a well. The proposed scenario consisted in describing the benefits of a well to the household as well as the set-up of a cost recovery system (for an exact phrasing of the WTP questions, see annex 1). In a follow-up on maintenance costs - after a well would be constructed - WTP questions were formulated for a pay-by-the-bucket system or for a fixed monthly fee.
Two separate logit regressions were run to analyze the acceptance or refusal of the households to participate in the construction and the maintenance of a well. A short version of a logit model, regressing the acceptance dummy on the logarithm of the bid, was run to evaluate median and average willingness to pay. This information is used to evaluate the overall benefit of a well (and can be compared to the cost of well construction). Then a longer version of the logit model was run to explain variability of WTP across individuals.
The results of the WTP for construction of a well are shown in Figure 2 and Table 4. Based on the WTP estimates, a demand curve can be drawn and one can evaluate at which price how much cost recovery might be possible. Using the coefficients estimated in the short model, the median WTP - 50% of the households would be willing to pay at least this amount - is estimated to be around 57,000 Fmg.
The total consumer surplus for well construction for the eight villages combined is estimated to be around 46 million Fmg or 7,000 $. This is the total benefit of the communities to have access to a well. In contrast to urban settings, better information of individual wealth of different users and higher peer pressure might allow for an easier to implement differential pricing scheme within the community. As the community is generally responsible for the well, they could set-up a system where inhabitants pay as they are able to to the benefit of the community as a whole. As long as the consumer surplus is higher than the cost of construction of the well, the community overall would benefit and should be willing to pay for such a well.
Given that there are no noticeable differences in WTP between different households with respect to income level (Table 4), WTP can simply be aggregated over households to determine what the critical size is for a village to be able to gather enough money to repay investment costs. We have two estimates on the construction costs of a well. A representative of ANGAP (Association Nationale pour la Gestion des Aires Protégées) estimates construction costs for a well in the northern province of Madagascar between 17 and 21 million Fmg. Greenmad (personal communication), a German-financed project in the north of Madagascar, estimates the costs at 5 million Fmg. It is unclear how these costs are calculated but we suspect differences due to imposed labor costs or not, differences in the level of labor costs, and different types of well. In further discussion, we will use the average of these two estimates. As we assume that the marginal construction cost for an extra user are close to zero, the bigger the village, the

13
more easier costs can be recuperated as consumer surplus increases proportionally with the size of the village.
Figure 3 shows the mechanism at work. It illustrates that when the size of the village drops below 90 households, costs are above the consumer surplus and subsidies to cover construction costs would be necessary. A village with a population above 90 households, could potentially provide sufficient funds for the construction of a new well. Some projects with activities in the area, such as ANGAP and ANAE, are willing to contribute half of the investment costs for wells.18 This would mean that the cut-off for cost recovery for the remaining 50% is 45 households in a village. Given that the average size in the survey area is 30 households, cost recovery even with a 50% subsidy for investment costs would not be possible.
In our analysis, we used the consumer surplus as benchmark. This means that internal agreements in the village can be made where one would pay to his possibilities. However, this might often be difficult in practice. If the same fixed price per household would be used, the required minimum size of the village would be significantly higher. For example, if one would apply the median WTP as the fixed price for a village of 100 households, only 2.8 million FMG could be spend for the construction of such a well as only 50 households would be willing to contribute that amount to a well. The low demand for improved water services is inherent to the high poverty level in the area.
In a second analysis, a logit regression was run on the WTP for maintenance costs. The median WTP to pay for operation and maintenance costs of the well is estimated at 40 FMG per bucket or at 9,500 FMG per household per month (Table 4). This represents around 5% of the average revenue of a household in that area. These estimates are comparable to studies done in other countries (McPhail, 1993). While we do not have estimates on maintenance costs, they are expected to be a lot lower. This relatively high number indicates then that even small villages would be able to continue operation of a well once installed. 4.5. Determinants of WTP
Econometric results on determinants of differences in WTP illustrate internal consistency of the questionnaire and prove, therefore, the validity of the use of the contingent valuation method for this type of problem in rural settings of Madagascar (Table 5). The WTP for well construction is significantly influenced by household income, the quantity of water that is used, and their satisfaction with the current system. As expected, households that are not satisfied with the current water situation, are willing to pay more. Figure 2 shows to what extent richer households are willing to contribute more for well construction. It also illustrates to what extent income growth would lead to a higher demand for improved water quality. Given the current high economic growth rates in Madagascar, it shows how, if this growth were to trickle down to this type of 18 ANGAP can do so based on revenue from entry fees to the park of Isalo. Half of this revenue is in principle used towards the benefit of the population in surrounding villages.
14
villages in rural areas, demand and willingness to pay for improved water services would increase.
Questions were also asked on the preference for the cost recovery system for maintenance. When comparing a flat monthly fee to a pay-by-the-bucket system, most rural water users (87%) prefer a monthly fee. The regressions on the WTP for the maintenance fee show few significant determinants. Bigger households are willing to contribute less to the maintenance costs. It might be that, as they have more excess labor at their disposal for water hauling and might be relatively poorer (Razafindravonona et al., 2001), they prefer to stick to the current system. While the coefficient on income shows the expected positive sign, it is not significant at conventional statistical levels. 5. Water use and willingness-to-pay for water in urban areas: the case of Fianarantsoa ville19 5.1. Introduction
Fianarantsoa is the capital of the province with the same name south of Antananarivo. It has around 100,000 inhabitants and is estimated to be the fifth biggest city of the county. The province of Fianarantsoa is considered one of the poorest of Madagascar. Moreover, it has been shown that poverty overall has increased significantly over the last decade. However, urban poverty is now lower than it was in 1993 (Randrianarison et al., 2001). The same study also shows that access to basic services in the city, i.e. electricity, sanitation, as well as drinking water - while still being low - has improved over the last decade. Most of the inhabitants of the city rely on public taps or on rivers and lakes for their water use. It is estimated that around 50% of the population is dependent on public taps, 30% on natural sources, 11% on individual connections (of which 8% in their own house and 3% in the house of somebody else), 8% on wells, and 3% on other sources (Razafindralambo, 2001).
The water supply situation for the city as a whole seems to become problematic. Three sources supply currently water to the city: Antarambiby, Vatosola, and Mandranofotsy. Water coming from the Antarambiby lake is by far the most important as 70% of the water that is distributed in the city originates from that source. Unfortunately, the lake has been drying up in recent years and it is estimated that within the next ten years, the level will be too low to further supply water for the whole city (JIRAMA, personal communication).20 The reduction of the water level is linked by local residents and policy makers to high deforestation rates in the area. However, no hydrological studies are available to prove or dispute this claim.21
19 The results in this section are largely based on those reported in Razafindralambo (2001). 20 Razafindralambo (2001) mentions that in 1957, the dam of Antarambiby got water from 34 sources. This has now been reduced to 13. 21 For a discussion on linkages between land use and water availability, see Chomitz et al., 1998; Aylward, 2000; Calder, 1999.
15
5.2. Sampling frame and methodology
In October 2000, focus group discussions on water issues were organized in Fianarantsoa. These discussions allowed to better identify the problems in water markets and to come up with a first draft of the questionnaire. This first draft was then pre-tested. The pre-testing helped in the better formulation of the survey as well as the setting of relevant prices in the contingent valuation scenario. The survey was conducted during the whole month of November 2000 by four enumerators. The average length of the survey was 45 minutes per household.
The sampling strategy was based on a stratified random sampling scheme. 19 out of 50 neighborhoods (“quartiers”) in Fianarantsoa were randomly selected.22 A census of households in this neighborhood was conducted with the main purpose of knowing the commonly used water source of the households. Three strata were constructed: 1/ users of traditional water sources (rivers, wells, etc.); 2/ users of public taps; and 3/ users that have private piped connections. Ten households were randomly selected for each strata in each neighborhood. 24 questionnaires could not be used due to inconsistent information. Thus the total number of questionnaires used for analysis was 546.
The survey instrument consisted of three parts. A first section dealt with the household’s water use practices, attitudes and perceptions about water quality and services. A second section consisted of a contingent valuation question. The third section asked for information on the respondent’s education level, age, family composition and other socio-economic variables. Two types of scenarios were proposed to the households depending on if they used traditional sources and/or public taps or if they relied for water consumption on individual connections in the house. The scenario was based on the improvement of the existing service23: 1/ the household that does not have access to an individual piping system was proposed that it would benefit from a public tap close by, accessible at all times, night and day, during 365 days a year, without having to queue, and that provides potable water in the neighborhood which does not require boiling to be safe to drink; 2/ Households that are currently privately connected to JIRAMA were proposed a scenario in which they would benefit from operational services 24 hours a day during 365 days a year with a constant flow and in which water would not have to be boiled before drinking.
After an introduction in which the set-up of the improved water services was explained, a price was offered. The closed referendum format in the case of public taps was used to avoid starting point bias. If the bid was accepted, a follow-up question was asked to determine how the household would pay for these expenditures. It was hoped that this would increase consistency in the answers. Ten bid levels – ranging from 1 to 10 FMG per liter - were used and were randomly distributed among the households that
22 For each neighborhood, the type of water service that was available was asked for. Individual piping systems exist in each neighborhood. In 1 neighborhood, there exist a system of public taps where households are required to pay; in 43 neighborhoods, public taps - as well as washing basins and shower stalls - are for free; in 6 neighborhoods, no public taps, washing basins or shower stalls were available. 23 The exact phrasing of the question is added in annex 2.

16
were surveyed. For the households with access to piped water services, an open ended question was formulated. 5.3. Descriptive statistics and current water use practices
One of the purposes of this part of the study is to look at linkages between poverty and water practices. As we do not have data on household expenditures as the preferred measure of welfare, we will use income levels as a proxy.24 Five income categories ranging from the poor - with a monetary household income lower than 100.000 Fmg/month (15$) - to the rich - with a monetary household income that is higher than 700.000 Fmg/month (100$) - are used to illustrate the differences between income groups in water use, water practices, and water expenditures. Average monthly income of the surveyed households in Fianarantsoa was estimated around 500,000 Fmg.
Water use, water expenses, and the price of water increases monotonically with income level (Table 6). Water use is seven times as high for the richest category compared to the poorest category. The poor consume on average 13 liters per capita per day. This is below the WHO norm of 20 liters a day a person. 25 Average prices paid by the richest category are five times as high as for the poorest category. Both effects combined, water expenditures are 25 times higher for the richest category compared to the poorest category.26 Unfortunately, we were only able to estimate monetary expenditures and we were not able to take into consideration the opportunity costs of water hauling.27 The importance of monetary water expenditures in total income increases from 1% for the poorest to 3% for the richest category.
The differences in water use between richer and poorer households are seen in two ways: the type of water source and the way that water is used. The source of water differs by income level: the medium income category uses more wells and public taps and the richest category relies very heavily on piped water and private connections. Almost 80% of the richest category use private connections (either their own or the one of their neighbor). In contrast, nobody in the poorest category has a private connection (while 1% of the poorest category uses the private connection of their neighbors). Table 6 further illustrates how water is used differently by income level. The poorest category uses water mainly for cooking and drinking. The richest quintile on the other hand uses
24 The use of expenditures as a measure for poverty has been shown to have considerable advantages: they are likely to fluctuate less than income over time and they are often more truthfully reported than income. 25 The WHO has established a norm of 20 liters per capita per day as necessary for basic hygienic requirements. They estimate that, on average, 10 liter is used per day for cooking. The rest is used towards bathing – particularly hand washing. When water is difficult to get to or is expensive, the poor often cut back on bathing (Bosch et al., 2000). 26 Water expenditures are calculated as all monetary expenditures, including JIRAMA bills, repair costs of public taps and payment for haulers. 27 If we had been able to correct for the opportunity cost of time, price differences would have been smaller as these costs fall disproportional on the poorest quintile as they rely significantly less on private connections. Hence, they incur extra costs for waiting in queues, walking long distances to public sources and incurring additional costs for storing water.
17
their water for additional things, especially for laundry and for personal hygiene. Households with private piped connections use 5 times as much water than those that rely on traditional sources and public taps.
Different questions with respect to water quality (color, taste, availability, etc.) were asked (Table 7). JIRAMA customers - using water from public taps or from private connections - complain of color (red or yellow) or odor (smell of ‘eau de javel’) problems. However, the most cited problem was linked to the presence of sediments on the bottom of containers. This is especially a problem in the rainy season.
While customers have little trust with respect to water quality, few water users mention links between bad water quality and disease. 7% of the sample experienced skin irritations and diarrhea if water was used without boiling. This low number of disease incidence might be explained by preventive measures as the majority of the water users mention that they often boil water before drinking (86%) and they are conscious of the fact not to drink water without boiling (60%). Other measures that are taken to improve water quality include running water until it becomes clear (17%), wait with water use until impurities have sunk and are removed (18%), and the use of “eau de javel” (5%) or Sur’Eau (15%).28
Households that do not have own private piped connections, are on average 150 meters away from their water source taking them on average 3.5 minutes for a one way trip. 65% of the households mention that they have to queue at their water source. The average queuing time in the dry and wet season differs from 5 to 16 minutes respectively. Hence, the average time for one trip ranges between 12 and 23 minutes. 8% of the households that rely on water sources external to the house pay somebody to haul water. Expenditures for this are as high as 1,700 Fmg per month. A little over one third of the households mention the existence of a water committee to which they contribute if reparations have to be done. The average amount paid last year was 1,300 Fmg (2$).
As water use differs significantly across households, a regression was run to gain insights in the importance of different determinants (Table 8). A first regression was run on the whole sample and a second on the households without private connections. The results are conform to economic expectations and most of the coefficients for the determinants are significant. Household size shows an elasticity of 0.44, significantly higher than in rural areas. This is probably related to the more divers use of water in urban settings, esp. for bathing and personal hygiene. As already shown in the descriptive statistics, income is a very important determinant. Higher education levels increase water use. Better educated people might have higher incomes and can therefore afford better water services. They might also be better aware of the importance of hygienic standards.
As expected, the further a source is located from the house and the longer one has to queue, the less water is used. The higher elasticity for the time to get to the source
28 In 1999, cholera became a serious public health threat in Madagascar. In response, an American NGO PSI collaborated with CARE and Centers for Disease Control to produce, market, and sell sodium hypochlorite under the brand name Sur'Eau for domestic treatment of drinking water.

18
compared to waiting time might be explained by the higher effort levels – carrying heavy buckets - for the journey from and back to home than for queuing. Looking only at the public tap regression, the elasticity is estimated at –0.12. Evaluated at the mean, this implies that for every extra minute (one way) that the household has to walk, it consumes 170 liter per household per month or 1 liter per capita per day less (Figure 4).29 This finding implies the necessity of the set-up of a dense network of public standpipes if the aim is to arrive at sufficient safe water use levels at the household level. 5.4. Willingness to pay for improved water quality
To arrive at the economic value for improved water quality in Fianarantsoa, two types of Willingness-To-Pay (WTP) questions were formulated depending on if households had connections to a piped water supply system or if they relied on public taps or traditional sources of water. Both scenarios describe a situation of quality improvement.
The results of the WTP question for improved services at the public tap are shown in Figure 5 (and the results of the regression are reported in Table 9). Different conclusions can be drawn from this graph. First, the area under the curve (the ‘inverse demand’ curve) gives us an estimate of the monetary benefits for the population of Fianarantsoa as a whole for the improvement of the public tap service as described in the scenario. This area – corrected for the average water use30 – is estimated at 1.8 billion Fmg per month (+/- 275,000 $). The median WTP is evaluated at around 40 FMG per bucket, implying that if the community would have to vote on a specific tariff, 50% would not accept a price that would be higher.
Second, the graph gives also an idea of how many customers one would have for each price level, an important consideration for the policy of cost recovery and price liberalization under the new Water Law. The graph illustrates that at even small price changes, a large part of the population would not be able or willing to pay for this improved water service. For example, a price increase from zero to four Fmg/liter would reduce the population who would be willing to pay for the improvement by 50%. Assuming that the current price-quantity relationship - i.e. without changes in water quality - is of the same nature, one can clearly see that price tariffs under the new Water Law have to be designed with extreme care as even small price changes would have large effects on water use for the poorest part of the population.
Currently, 25 Fmg per bucket is being applied to the public taps with a fee in Fianarantsoa. The experience on the effect of fees on these few taps shows that it has led to a significant reduction in water use. It is estimated that, after cost recovery, water use
29 The indirect method where one compares the use of certain good with the distance to that good is in environmental economics referred to as the travel cost method. It is an indirect method for the valuation of non-marketed goods. 30 Households that do not rely on private connections of JIRAMA use on average 2692 liter per month (compared to 8869 liter for private connections). The former figure is used for aggregation.
19
per public tap is reduced from 200-500 m3/month per public tap to 50 m3/month (JIRAMA, personal communication). This reduction is significantly higher than anticipated by our analysis. Based on our results, only around 25% of the population would not be willing to pay the proposed price. However, our results are based on a dichotomous choice variable use/no use for a specific price. In reality, households adjust quantity of water used, even for households that accept to pay 25 Fmg/bucket. Moreover, anecdotical evidence suggests that the reduction in water use per public tap was partly due to reduced water use of the households but largely due to more efficient management of the tap (no or less leaks because of newer and more efficient taps; people turn off the tap when they are done using it; etc.).
Third, the availability of cost information would allow us to estimate how many customers would have to be connected to the system to make total recovery possible.31 The monthly average consumer surplus per household, at current water use levels, for access to a public tap is evaluated at $2.8 (18,200 Fmg) per month or around 6.7 Fmg/liter. This compared favorably with cost estimates as JIRAMA reckons that, for cost recovery, prices of 3 to 5 FMG per liter would be necessary (JIRAMA, personal communication). However, to be able to use cost information more effectively, detailed operating and maintenance costs would be needed. They could then be compared to the potential number of households that use a public tap and their benefits of such a tap.
Fourth, the estimate of the consumer surplus serves as a benchmark for environmental investments towards maintaining water sources. Currently, two thirds of the water supply in Fianarantsoa originates from Lac d'Antarambiby. The water level in this lake has decreased dramatically over the last years, presumably partly due to increased deforestation on the hillsides surrounding the lake. Given the costs of reduced water availability for Fianarantsoa city, one can use estimates based on this price-quantity relationship to justify conservation investments around the lake based on valuation of the externality benefits, on top of pure water production costs.32
The question in the case of customers that are connected to a piped system was formulated in an open ended format.33 In this case, the median turns out to be around 25,000 Fmg/month, i.e. slightly above the amount customers currently pay (Table 10). Households are only willing to pay 1.15 Fmg/l extra on average (0.47 Fmg/l for the median). Hence, it seems that there is little demand for improved water services for households that have already a piped individual connection.
31 CDA (Conseil de Développement) mentions an investment price of 500,000 Fmg to 1,000,000 Fmg per standpipe while CARE reports a price of 4,000,000 Fmg ($665) (GOM, 2000). 32 However, a hydrology study would be needed to clearly establish the link between land use and water availability. 33 The problems of open ended questions have been discussed in debt in multiple studies. We refer the reader to some of these studies (f.ex. Arrow et al., 1993).

20
5.5. Determinants of WTP
A longer version of the logit model was run to explain variability among households in WTP for improved public tap services (Table 9). The WTP for improved water quality from public taps is significantly influenced by four factors: the bid level, the distance to the water source, income, and household size. As in the case of water use, distance turns out to be highly influential for the WTP. A 1% increase in distance from the water source, increases WTP by 1.35%. Households located further away from public taps face currently higher water costs and might therefore be willing to contribute more to get water services closer to home. These results suggest that cost recovery of investments in areas of the city where there are no public taps at all, might be easier. These estimates also give an idea of the economic benefits of bringing neighborhoods currently far away to a closer distance to a public tap.
The results for the WTP for improved services of private connections show only a few significant determinants (Table 10). The amount of water used is significant but its coefficient is only 0.5, indicating that the more water is used, the less customers are willing to pay more for the improved services. Income level shows the expected sign while people that use currently a tap in another home, are not willing to pay as much for the improved services as all the other households. Current perceived quality problems with JIRAMA water do not induce households to contribute more to improved services as this coefficient is not significant. 5.6. Simulations of different price setting systems
The challenge of water pricing in urban settings seems to be to find the right balance between equity and cost recovery. The countries most successful in expanding urban water service provision are those that charge cost-covering tariffs (Bosch et al., 2000). Full cost recovery need not conflict with pro-poor policies. The previous section shows that poor people are willing to pay for water. A pro-poor cost recovery pricing policy could be based on the following principles (DFID, 1998): a. cross-subsidy from the rich to the poor; b. easing the cost of connections for low-income users by subsidizing connection costs, or by allowing connection fees to be spread over a longer period, and included in monthly bills; c. a lifeline tariff - charging a low (often flat) rate for low-volume users.
The best pricing structure is one where richer customers cross-subsidize poorer ones. This seems actually to be the case in Madagascar as larger consumers with private connections pay three times as much per liter to JIRAMA than consumers at public taps. However, in practice they do pay the same price as public tap users also have to pay for the services of the management of the public standpipe under the new Water Law34. On the other hand, pricing practices at JIRAMA do not fulfill the second condition.
34 For example, salaries for management of the public tap increase the price per liter threefold in Fianarantsoa city.
21
Connections costs to the private network system are high35 and JIRAMA does not offer any credit or installment facility.
It has been shown in other countries that yard taps and public taps are not close substitutes (Briscoe et al., 1990). This seems to be the case in Madagascar too. If households have the means to pay for private piped connections, they do so. Low prices for public taps would then be a straightforward targeting method to reach households that are unable to pay for water services. Table 11 shows the importance of the different types of customers in Fianarantsoa ville. Figure 6 uses this information to show the impact on revenue of JIRAMA of different tariffs for yard taps and public taps. The results suggest that the price charged for using water from the public tap has little effect on the total revenue of JIRAMA. While water for free might lead to spoilage of water, water prices on public taps should be as low as possible, without jeopardizing financial viability, as water at public taps are mainly used by the poor and as they have little effect on the overall income of JIRAMA. However, not charging anything would give no incentive for JIRAMA to expand this type of service and is not a viable solution in the long term as has been shown by numerous experiences in other countries (Bosch et al., 2000). 6. Policy implications
6.1. A methodology for analysis of demand for public investments. The results of the study illustrate how an easy methodology, based on a contingent valuation survey, can be used to evaluate the demand for public infrastructure investments, such as for improved water quality, in Madagascar. This has important policy implications for water supply projects because it shows that going into a village and conducting a relatively simple household survey can yield reliable information on the population’s willingness to pay for infrastructure investments.
6.2. Cost recovery for improved water quality in urban areas. Sector policy in urban settings should first and foremost stress efficient service delivery. JIRAMA resources in Madagascar have been absorbed in inefficient operations which leave few resources with which to expand service access or improve service quality. Utilities should ideally be financially autonomous: poor people will not benefit from expansion into low-income areas unless the institution has the financial resources to do so. It is clear that a sizable proportion of the population, in the rural as well as in the urban area, are willing to pay additional money to improve water quality and that water users treat water as any other scarce resource. Hence, it seems that cost recovery is possible even in poorer rural areas if the system is well designed.
The results also suggest that a significant portion of the population will not be able to pay for even small changes in prices for water. Given that cost recovery is an essential part of the new Water Law, a differential pricing system where rich households cross-subsidize poorer households is appropriate. The JIRAMA pricing structure 35 The minimum cost of a four meter long individual connection is about $110. This cost goes up for longer distances.
22
indicates that price discrimination is currently implemented and progressive, i.e. the poor benefit proportionally more than the rich. A policy design to reach the poor can practically easily be implemented, i.e. continued, in this case as the poorest part of the population relies on other water sources than the rich. Hence, it is recommended that private connections are overcharged and that water from public taps are available at lower prices (alternatively, to satisfy the marginal pricing rule, some type of voucher system for the poor could be set up). The analysis indicates that even slight price changes might have large impacts on the poorest part of the population, as they seem to alter water sources or reduce water use if they would have to pay for water services.
6.3. Maintenance costs versus investment costs in rural areas. The analysis in rural areas indicate that income is not a very important factor in the demand for improved water services. Hence, aggregated demand can easily be obtained through the sum of identical individual demands. Thus, the size of the village is a crucial variable in determining cost recovery of investment in the construction of a well. It is estimated in the survey area that a minimum size of 90 households would be required for full cost recovery of investment. However, local institutions often subsidize investment costs. If the current 50% rate is maintained, a minimum size of 45 households per village is required. This is still higher than the average size of the village in the survey area (30 households). Hence, cost recovery on investment in these small villages with this level of income is difficult. The critical size for recovery on maintenance is significantly lower as these maintenance costs are lower and as the households’ willingness to pay for these costs is relatively high (5% of their monetary income).
6.4. Environmental costs. Water availability in different smaller cities in Madagascar is seemingly threatened by land use changes around water supply areas. This seems, for example, the case in the southern city Fort Dauphin, Diego Suarez in the north, and in our case study Fianarantsoa ville. Water supply in Fianarantsoa originates mostly from sources in Lac d’Antarambiby. The water level in this lake has declined to such a low level that it will probably not be sufficient to provide the city of Fianarantsoa with water in the near future. Two solutions are possible: preventive or remedial. The remedial solution – the development of new water supply sources – seems impossible (JIRAMA, personal communication). Hence, it seems appropriate that land use changes should be reduced and afforestation measures encouraged. While examples exist where part of water fees are used towards conservation (Quito and Cuenca in Ecuador; Colombia; Heredia province in Costa Rica), it seems that this policy - good in the longer run – has to be complemented with policies to reduce health externality implications for the poorer population as they might switch to less safe water sources. More hydrological research at the watershed level might also needed to better establish the link between forest cover and water availability.

23
References Aylward, B., Economic analysis of land-use change in a watershed context, paper presented at UNESCO
symposium, Kuala Lumpur, 2000. Aylward, B., Echeverria, J., Synergies between livestock production and hydrological function in Arenal,
Costa Rica, Economic and development economics, Vol. 6, 2001, pp. 359-381. Arrow, K., Solow, R., Schuman, H., Ragner, R., Portney, P., Report to the NOAA panel on Contingent
valuation, US Federal Register, January 15, 1993, Vol. 58, No. 10, pp. 4602-4614. Bosch, C., Hommann, K., Sadoff, C., Travers, L., Water, Sanitation and Poverty, PRSP Source Book,
World Bank, 2000. Briscoe, J., Furtado de Castro, P., Griffin, C., North, J., Olsen, O., Toward Equitable and Sustainable rural
water supplies: A contingent valuation study in Brazil, The World Bank Economic Review, Vol. 4, May 1990, No. 2, pp. 115-134.
Calder, I.R., Land use and integrated water resources management, Earthscan Publications Ltd, London,
1999. Chomitz, K.M., Kumari, K., The domestic benefits of forests: a critical review, World Bank Research
Observer, Vol. 13, No. 1, February 1998, pp. 13-15. DFID, Guidance Manual on Water and Sanitation Programmes, London. GOM (Government of Madagascar), Développement Urbain: Note de Stratégie, Document provisoire,
2001. GOM (Government of Madagascar), Urban water supply and sanitation sector review: a strategy for future
IDA assistance, 2000. Griffin, C.C., Briscoe, J., Singh, B., Ramasubban, R., Bhatia, R., Contingent valuation and actual behavior:
predicting connections to new water systems in the state of Kerala, India. INSTAT, MICS 2000 : Madagascar, February 2001. McPhail, A., The ‘Five Percent Rule’ for Improved Water Service: Can Households Afford More?, World
Development, 1993, Vol. 21, No. 6, pp. 963-973. Ministère de l’Energie et des Mines, Déclaration de politique sectorielle de l’Eau, 2000, mimeo. Mitchell, R.C., Carson, R.T., Using surveys to value public goods: the Contingent Valuation Method,
Resources for the Future, Washington DC, 1989. Pearce, D.W., Turner, R.K., Economics of natural resources and the environment, The Johns Hopkins
University Press, 1990. Rabemanambola, F., Madagascar, in Eds Dinar, A., Subramanian, A., Water Pricing Experiences: An
International Perspective, World Bank Technical Paper No. 386, October 1997, pp. 69-77. Randrianarison, J.G., Randrianjanaka, N., Razafindravonona, J., Stifel, D., Evolution de la pauvreté à
Fianarantsoa : 1993-1999, INSTAT, 2001. Razafindralambo, R., Valeur économique de l’alimentation en eau urbaine : Etude de cas sur l’alimentation
en eau de la ville de Fianarantsoa, January 2001.
24
Randriamiarana, Z.B., Valeur de l’amélioration de l’alimentation en eau dans les communautés rurales,
February 2001. Razafindravonona, J., Stifel, D., Paternostro, S., Changes in poverty in Madagascar: 1993-1999, INSTAT,
February 2001. Whittington, D., Briscoe, J., Mu, X., Barron, W., Estimating willingness to pay for water services in
developing countries: A case study of the use of contingent valuation survey in Southern Haiti, Economic Development and Cultural Change, 1990, 293-311.
Whittington, D., Mujwahuzi, M., McMahon, G., Choe, K., Willingness to pay for water in Newala district,
Tanzania: Strategies for cost recovery, WASH field report 246, 1989. Walker, I., Ordonez, F., Serrano, P., Halpern, J., Pricing, Subsidies and the Poor: Demand for Improved
Water Services in Central America, mimeo, World Bank. World Bank Water Demand Research Team, The demand for water in rural areas: Determinants and policy
implications, The World Bank Research Observer, Vol. 8, No. 1, January 1993, pp. 47-70. World Bank, Poverty and socio-economic developments: 1993-1999, Madagascar, September 2001. World Bank, World Bank development report, Washington DC, 2001.
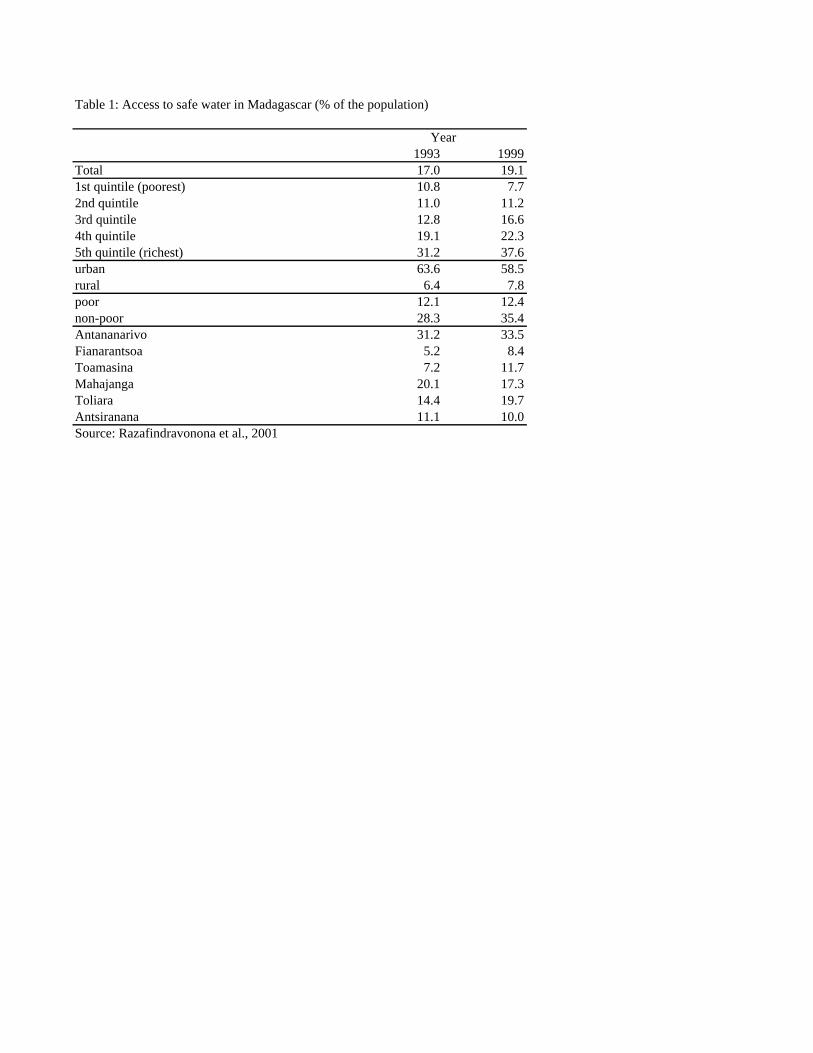
Table 1: Access to safe water in Madagascar (% of the population)
1993 1999Total 17.0 19.11st quintile (poorest) 10.8 7.72nd quintile 11.0 11.23rd quintile 12.8 16.64th quintile 19.1 22.35th quintile (richest) 31.2 37.6urban 63.6 58.5rural 6.4 7.8poor 12.1 12.4non-poor 28.3 35.4Antananarivo 31.2 33.5Fianarantsoa 5.2 8.4Toamasina 7.2 11.7Mahajanga 20.1 17.3Toliara 14.4 19.7Antsiranana 11.1 10.0Source: Razafindravonona et al., 2001
Year
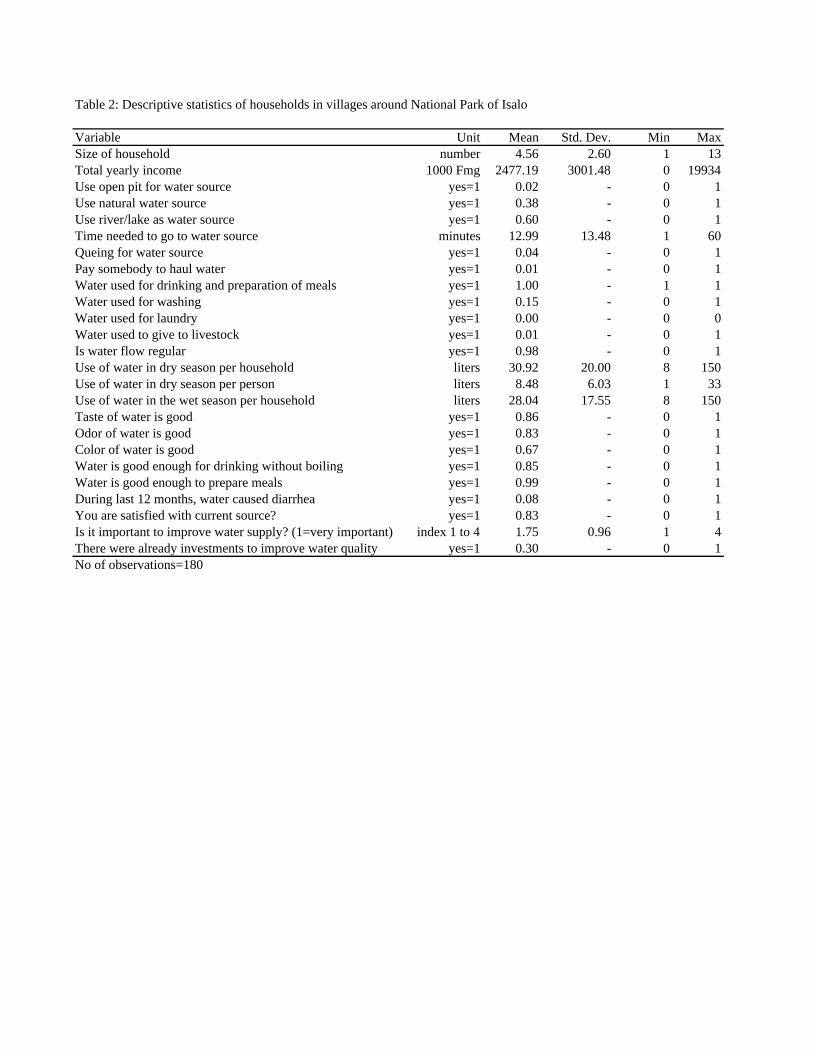
Table 2: Descriptive statistics of households in villages around National Park of Isalo
Variable Unit Mean Std. Dev. Min MaxSize of household number 4.56 2.60 1 13Total yearly income 1000 Fmg 2477.19 3001.48 0 19934Use open pit for water source yes=1 0.02 - 0 1Use natural water source yes=1 0.38 - 0 1Use river/lake as water source yes=1 0.60 - 0 1Time needed to go to water source minutes 12.99 13.48 1 60Queing for water source yes=1 0.04 - 0 1Pay somebody to haul water yes=1 0.01 - 0 1Water used for drinking and preparation of meals yes=1 1.00 - 1 1Water used for washing yes=1 0.15 - 0 1Water used for laundry yes=1 0.00 - 0 0Water used to give to livestock yes=1 0.01 - 0 1Is water flow regular yes=1 0.98 - 0 1Use of water in dry season per household liters 30.92 20.00 8 150Use of water in dry season per person liters 8.48 6.03 1 33Use of water in the wet season per household liters 28.04 17.55 8 150Taste of water is good yes=1 0.86 - 0 1Odor of water is good yes=1 0.83 - 0 1Color of water is good yes=1 0.67 - 0 1Water is good enough for drinking without boiling yes=1 0.85 - 0 1Water is good enough to prepare meals yes=1 0.99 - 0 1During last 12 months, water caused diarrhea yes=1 0.08 - 0 1You are satisfied with current source? yes=1 0.83 - 0 1Is it important to improve water supply? (1=very important) index 1 to 4 1.75 0.96 1 4There were already investments to improve water quality yes=1 0.30 - 0 1No of observations=180
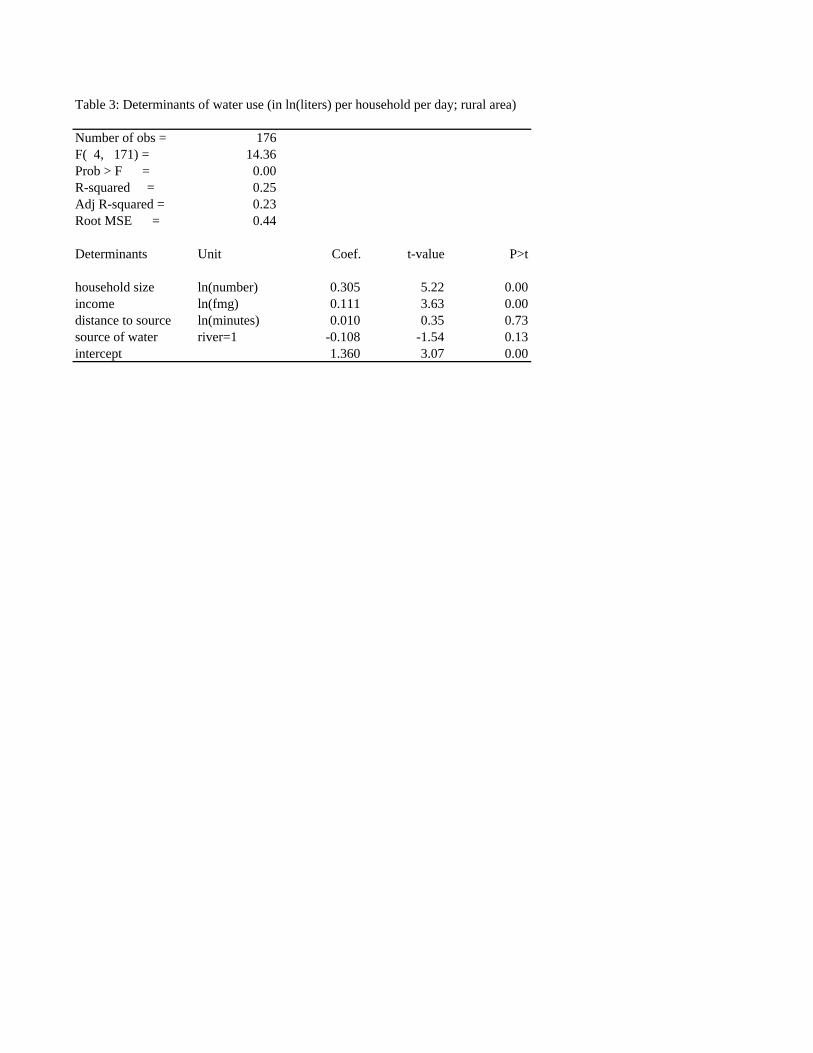
Table 3: Determinants of water use (in ln(liters) per household per day; rural area)
Number of obs = 176F( 4, 171) = 14.36Prob > F = 0.00R-squared = 0.25Adj R-squared = 0.23Root MSE = 0.44
Determinants Unit Coef. t-value P>t
household size ln(number) 0.305 5.22 0.00income ln(fmg) 0.111 3.63 0.00distance to source ln(minutes) 0.010 0.35 0.73source of water river=1 -0.108 -1.54 0.13intercept 1.360 3.07 0.00
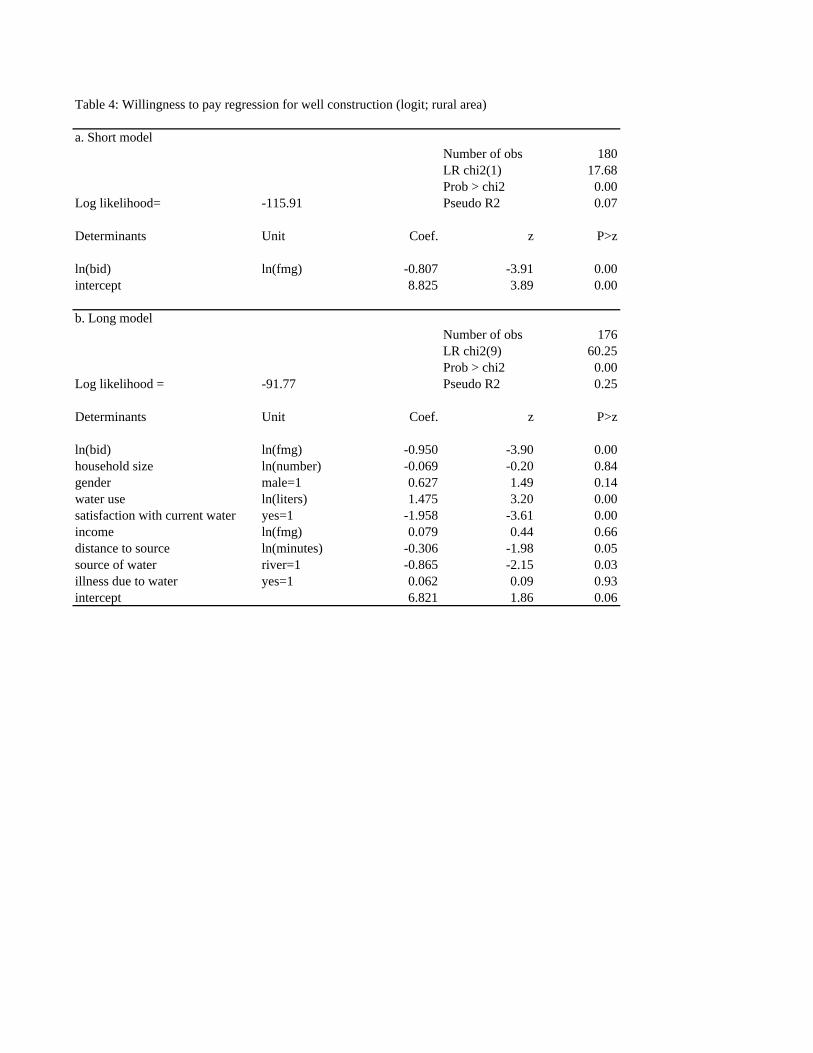
Table 4: Willingness to pay regression for well construction (logit; rural area)
a. Short modelNumber of obs 180LR chi2(1) 17.68Prob > chi2 0.00
Log likelihood= -115.91 Pseudo R2 0.07
Determinants Unit Coef. z P>z
ln(bid) ln(fmg) -0.807 -3.91 0.00intercept 8.825 3.89 0.00
b. Long model Number of obs 176
LR chi2(9) 60.25Prob > chi2 0.00
Log likelihood = -91.77 Pseudo R2 0.25
Determinants Unit Coef. z P>z
ln(bid) ln(fmg) -0.950 -3.90 0.00household size ln(number) -0.069 -0.20 0.84gender male=1 0.627 1.49 0.14water use ln(liters) 1.475 3.20 0.00satisfaction with current water yes=1 -1.958 -3.61 0.00income ln(fmg) 0.079 0.44 0.66distance to source ln(minutes) -0.306 -1.98 0.05source of water river=1 -0.865 -2.15 0.03illness due to water yes=1 0.062 0.09 0.93intercept 6.821 1.86 0.06
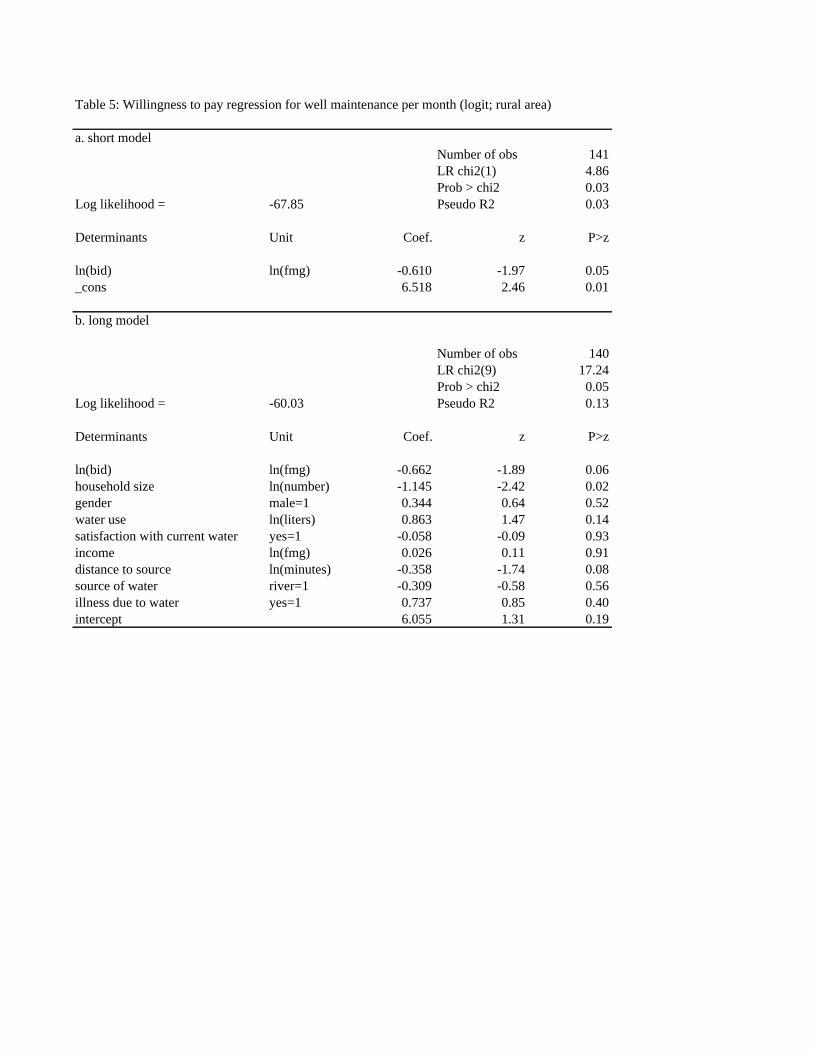
Table 5: Willingness to pay regression for well maintenance per month (logit; rural area)
a. short model Number of obs 141
LR chi2(1) 4.86Prob > chi2 0.03
Log likelihood = -67.85 Pseudo R2 0.03
Determinants Unit Coef. z P>z
ln(bid) ln(fmg) -0.610 -1.97 0.05_cons 6.518 2.46 0.01
b. long model
Number of obs 140LR chi2(9) 17.24Prob > chi2 0.05
Log likelihood = -60.03 Pseudo R2 0.13
Determinants Unit Coef. z P>z
ln(bid) ln(fmg) -0.662 -1.89 0.06household size ln(number) -1.145 -2.42 0.02gender male=1 0.344 0.64 0.52water use ln(liters) 0.863 1.47 0.14satisfaction with current water yes=1 -0.058 -0.09 0.93income ln(fmg) 0.026 0.11 0.91distance to source ln(minutes) -0.358 -1.74 0.08source of water river=1 -0.309 -0.58 0.56illness due to water yes=1 0.737 0.85 0.40intercept 6.055 1.31 0.19
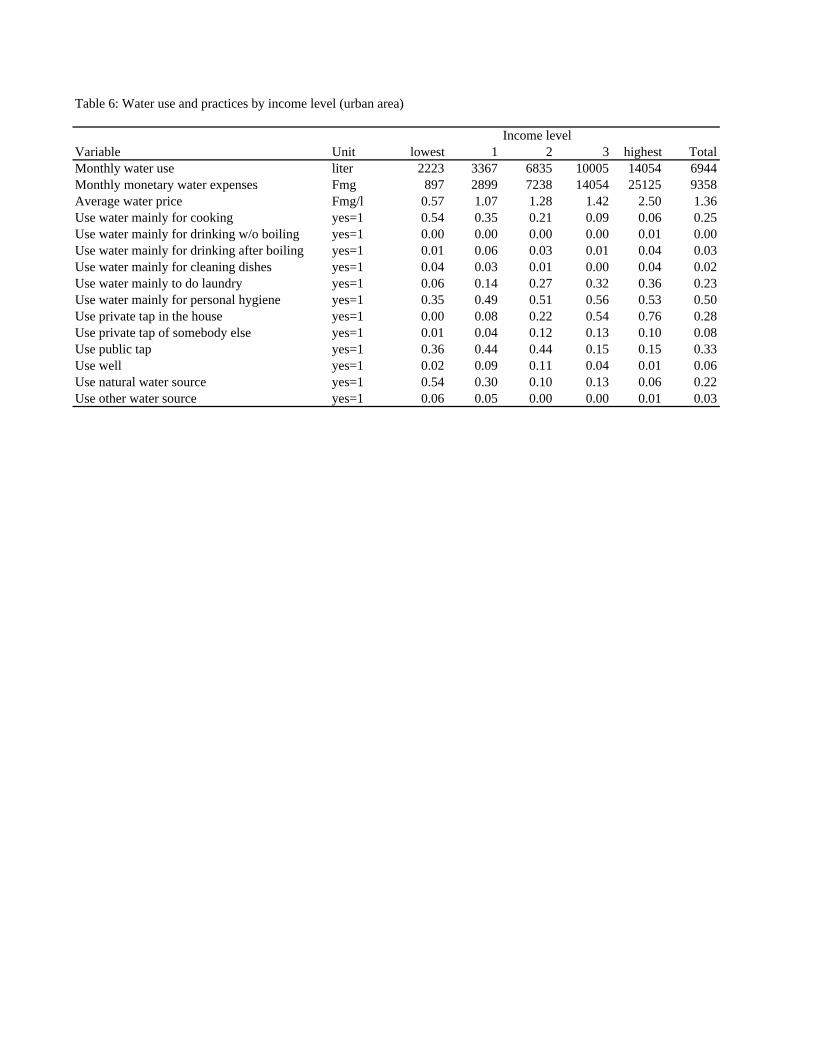
Table 6: Water use and practices by income level (urban area)
Income levelVariable Unit lowest 1 2 3 highest TotalMonthly water use liter 2223 3367 6835 10005 14054 6944Monthly monetary water expenses Fmg 897 2899 7238 14054 25125 9358Average water price Fmg/l 0.57 1.07 1.28 1.42 2.50 1.36Use water mainly for cooking yes=1 0.54 0.35 0.21 0.09 0.06 0.25Use water mainly for drinking w/o boiling yes=1 0.00 0.00 0.00 0.00 0.01 0.00Use water mainly for drinking after boiling yes=1 0.01 0.06 0.03 0.01 0.04 0.03Use water mainly for cleaning dishes yes=1 0.04 0.03 0.01 0.00 0.04 0.02Use water mainly to do laundry yes=1 0.06 0.14 0.27 0.32 0.36 0.23Use water mainly for personal hygiene yes=1 0.35 0.49 0.51 0.56 0.53 0.50Use private tap in the house yes=1 0.00 0.08 0.22 0.54 0.76 0.28Use private tap of somebody else yes=1 0.01 0.04 0.12 0.13 0.10 0.08Use public tap yes=1 0.36 0.44 0.44 0.15 0.15 0.33Use well yes=1 0.02 0.09 0.11 0.04 0.01 0.06Use natural water source yes=1 0.54 0.30 0.10 0.13 0.06 0.22Use other water source yes=1 0.06 0.05 0.00 0.00 0.01 0.03
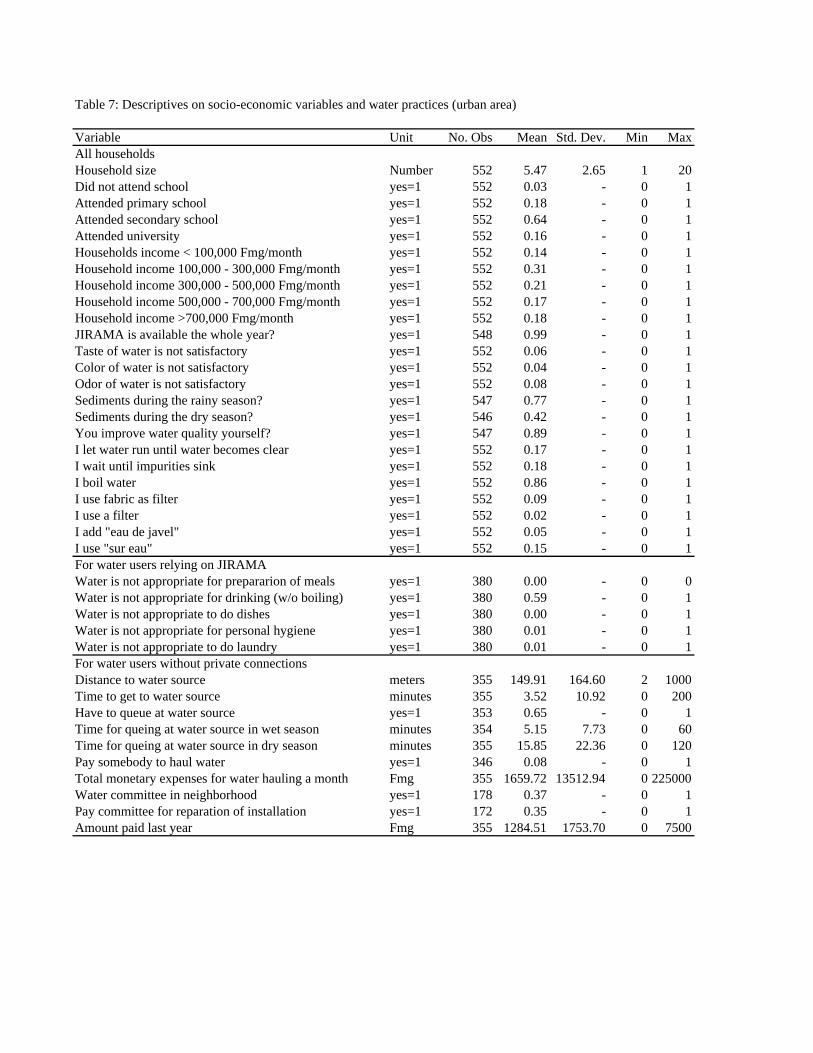
Table 7: Descriptives on socio-economic variables and water practices (urban area)
Variable Unit No. Obs Mean Std. Dev. Min MaxAll householdsHousehold size Number 552 5.47 2.65 1 20Did not attend school yes=1 552 0.03 - 0 1Attended primary school yes=1 552 0.18 - 0 1Attended secondary school yes=1 552 0.64 - 0 1Attended university yes=1 552 0.16 - 0 1Households income < 100,000 Fmg/month yes=1 552 0.14 - 0 1Household income 100,000 - 300,000 Fmg/month yes=1 552 0.31 - 0 1Household income 300,000 - 500,000 Fmg/month yes=1 552 0.21 - 0 1Household income 500,000 - 700,000 Fmg/month yes=1 552 0.17 - 0 1Household income >700,000 Fmg/month yes=1 552 0.18 - 0 1JIRAMA is available the whole year? yes=1 548 0.99 - 0 1Taste of water is not satisfactory yes=1 552 0.06 - 0 1Color of water is not satisfactory yes=1 552 0.04 - 0 1Odor of water is not satisfactory yes=1 552 0.08 - 0 1Sediments during the rainy season? yes=1 547 0.77 - 0 1Sediments during the dry season? yes=1 546 0.42 - 0 1You improve water quality yourself? yes=1 547 0.89 - 0 1I let water run until water becomes clear yes=1 552 0.17 - 0 1I wait until impurities sink yes=1 552 0.18 - 0 1I boil water yes=1 552 0.86 - 0 1I use fabric as filter yes=1 552 0.09 - 0 1I use a filter yes=1 552 0.02 - 0 1I add "eau de javel" yes=1 552 0.05 - 0 1I use "sur eau" yes=1 552 0.15 - 0 1For water users relying on JIRAMAWater is not appropriate for prepararion of meals yes=1 380 0.00 - 0 0Water is not appropriate for drinking (w/o boiling) yes=1 380 0.59 - 0 1Water is not appropriate to do dishes yes=1 380 0.00 - 0 1Water is not appropriate for personal hygiene yes=1 380 0.01 - 0 1Water is not appropriate to do laundry yes=1 380 0.01 - 0 1For water users without private connectionsDistance to water source meters 355 149.91 164.60 2 1000Time to get to water source minutes 355 3.52 10.92 0 200Have to queue at water source yes=1 353 0.65 - 0 1Time for queing at water source in wet season minutes 354 5.15 7.73 0 60Time for queing at water source in dry season minutes 355 15.85 22.36 0 120Pay somebody to haul water yes=1 346 0.08 - 0 1Total monetary expenses for water hauling a month Fmg 355 1659.72 13512.94 0 225000Water committee in neighborhood yes=1 178 0.37 - 0 1Pay committee for reparation of installation yes=1 172 0.35 - 0 1Amount paid last year Fmg 355 1284.51 1753.70 0 7500
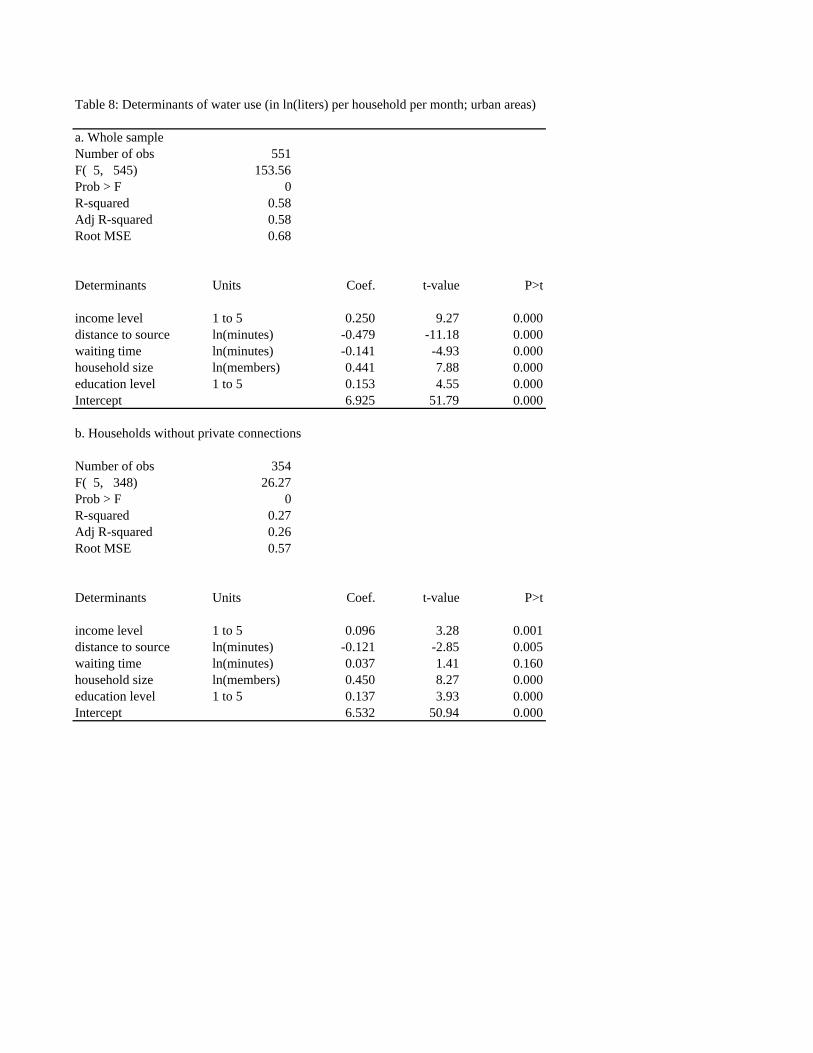
Table 8: Determinants of water use (in ln(liters) per household per month; urban areas)
a. Whole sampleNumber of obs 551F( 5, 545) 153.56Prob > F 0R-squared 0.58Adj R-squared 0.58Root MSE 0.68
Determinants Units Coef. t-value P>t
income level 1 to 5 0.250 9.27 0.000distance to source ln(minutes) -0.479 -11.18 0.000waiting time ln(minutes) -0.141 -4.93 0.000household size ln(members) 0.441 7.88 0.000education level 1 to 5 0.153 4.55 0.000Intercept 6.925 51.79 0.000
b. Households without private connections
Number of obs 354F( 5, 348) 26.27Prob > F 0R-squared 0.27Adj R-squared 0.26Root MSE 0.57
Determinants Units Coef. t-value P>t
income level 1 to 5 0.096 3.28 0.001distance to source ln(minutes) -0.121 -2.85 0.005waiting time ln(minutes) 0.037 1.41 0.160household size ln(members) 0.450 8.27 0.000education level 1 to 5 0.137 3.93 0.000Intercept 6.532 50.94 0.000
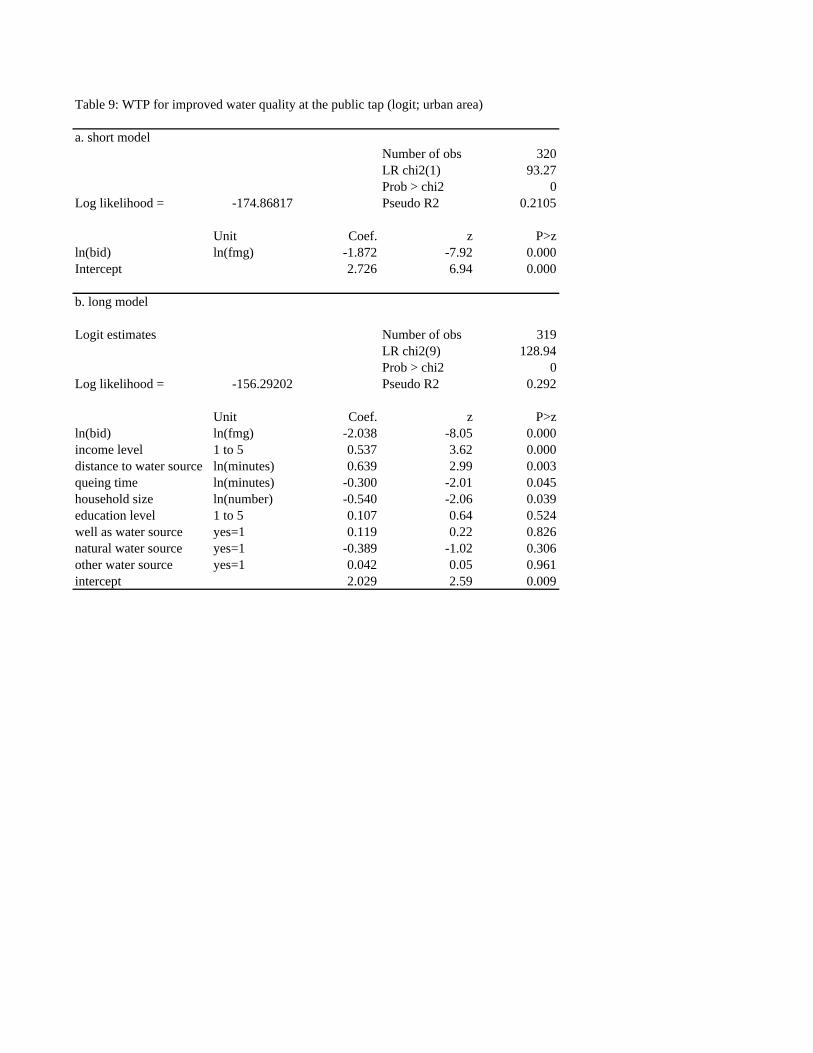
Table 9: WTP for improved water quality at the public tap (logit; urban area)
a. short model Number of obs 320
LR chi2(1) 93.27Prob > chi2 0
Log likelihood = -174.86817 Pseudo R2 0.2105
Unit Coef. z P>zln(bid) ln(fmg) -1.872 -7.92 0.000Intercept 2.726 6.94 0.000
b. long model
Logit estimates Number of obs 319LR chi2(9) 128.94Prob > chi2 0
Log likelihood = -156.29202 Pseudo R2 0.292
Unit Coef. z P>zln(bid) ln(fmg) -2.038 -8.05 0.000income level 1 to 5 0.537 3.62 0.000distance to water source ln(minutes) 0.639 2.99 0.003queing time ln(minutes) -0.300 -2.01 0.045household size ln(number) -0.540 -2.06 0.039education level 1 to 5 0.107 0.64 0.524well as water source yes=1 0.119 0.22 0.826natural water source yes=1 -0.389 -1.02 0.306other water source yes=1 0.042 0.05 0.961intercept 2.029 2.59 0.009
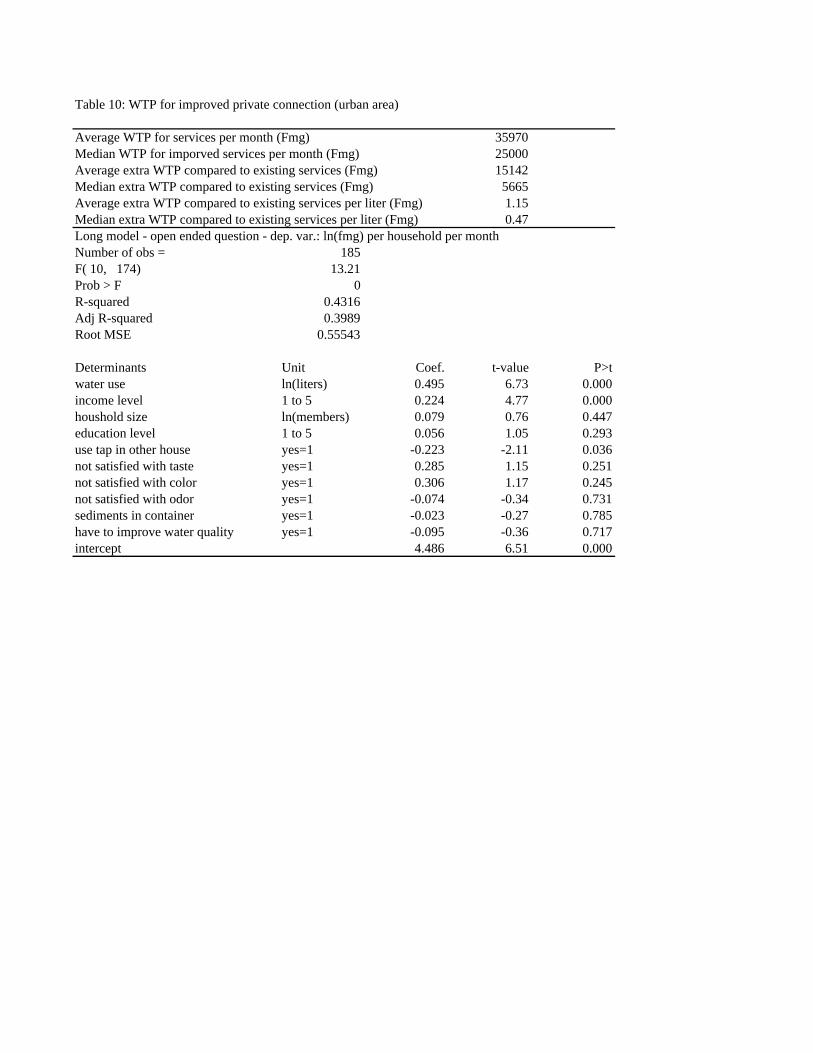
Table 10: WTP for improved private connection (urban area)
Average WTP for services per month (Fmg) 35970Median WTP for imporved services per month (Fmg) 25000Average extra WTP compared to existing services (Fmg) 15142Median extra WTP compared to existing services (Fmg) 5665Average extra WTP compared to existing services per liter (Fmg) 1.15Median extra WTP compared to existing services per liter (Fmg) 0.47Long model - open ended question - dep. var.: ln(fmg) per household per month Number of obs = 185F( 10, 174) 13.21Prob > F 0R-squared 0.4316Adj R-squared 0.3989Root MSE 0.55543
Determinants Unit Coef. t-value P>t water use ln(liters) 0.495 6.73 0.000income level 1 to 5 0.224 4.77 0.000houshold size ln(members) 0.079 0.76 0.447education level 1 to 5 0.056 1.05 0.293use tap in other house yes=1 -0.223 -2.11 0.036not satisfied with taste yes=1 0.285 1.15 0.251not satisfied with color yes=1 0.306 1.17 0.245not satisfied with odor yes=1 -0.074 -0.34 0.731sediments in container yes=1 -0.023 -0.27 0.785have to improve water quality yes=1 -0.095 -0.36 0.717intercept 4.486 6.51 0.000

Table 11: Importance and water prices by category (Fianarantsoa ville)
Category % Price (Fmg/m3)Public tap for free 13.6 0Public tap with fee 1.1 975Small consumers (<1000 m3) 47.0 1828Big consumers (>1000 m3) 3.3 2305Administration, public services 31.6 2303JIRAMA intern 3.4Source: JIRAMA, 2001
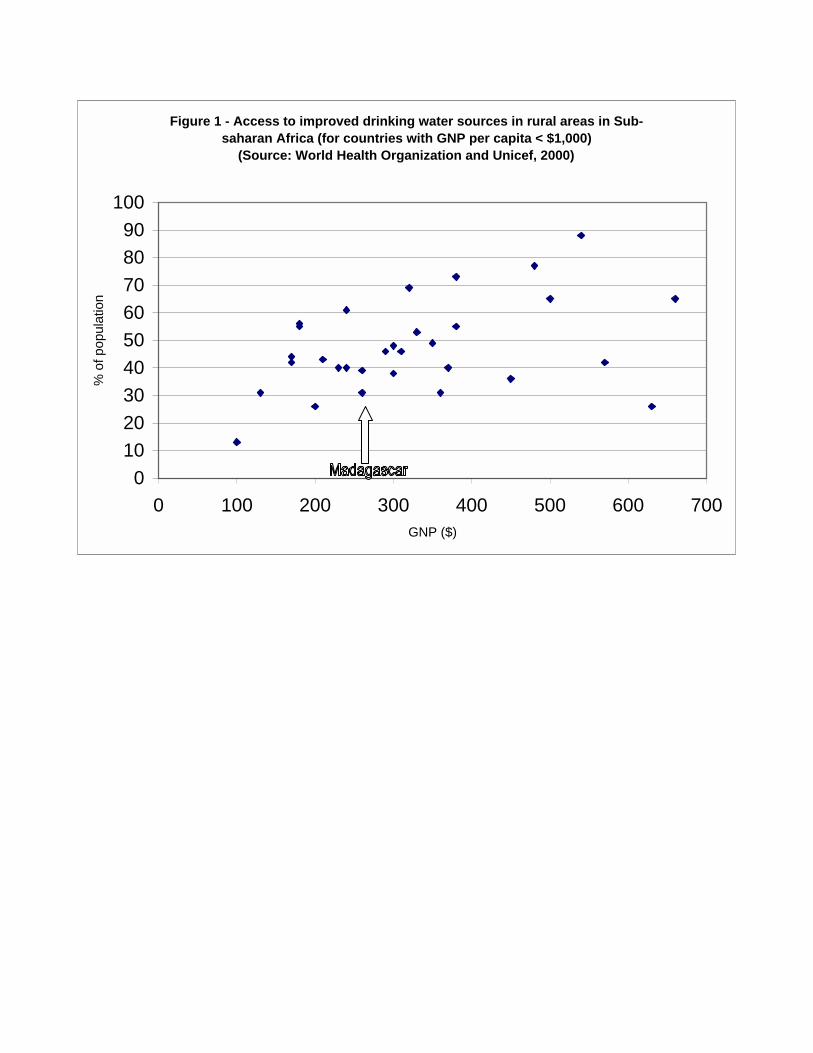
Figure 1 - Access to improved drinking water sources in rural areas in Sub-saharan Africa (for countries with GNP per capita < $1,000)
(Source: World Health Organization and Unicef, 2000)
0102030405060708090
100
0 100 200 300 400 500 600 700GNP ($)
% o
f pop
ulat
ion
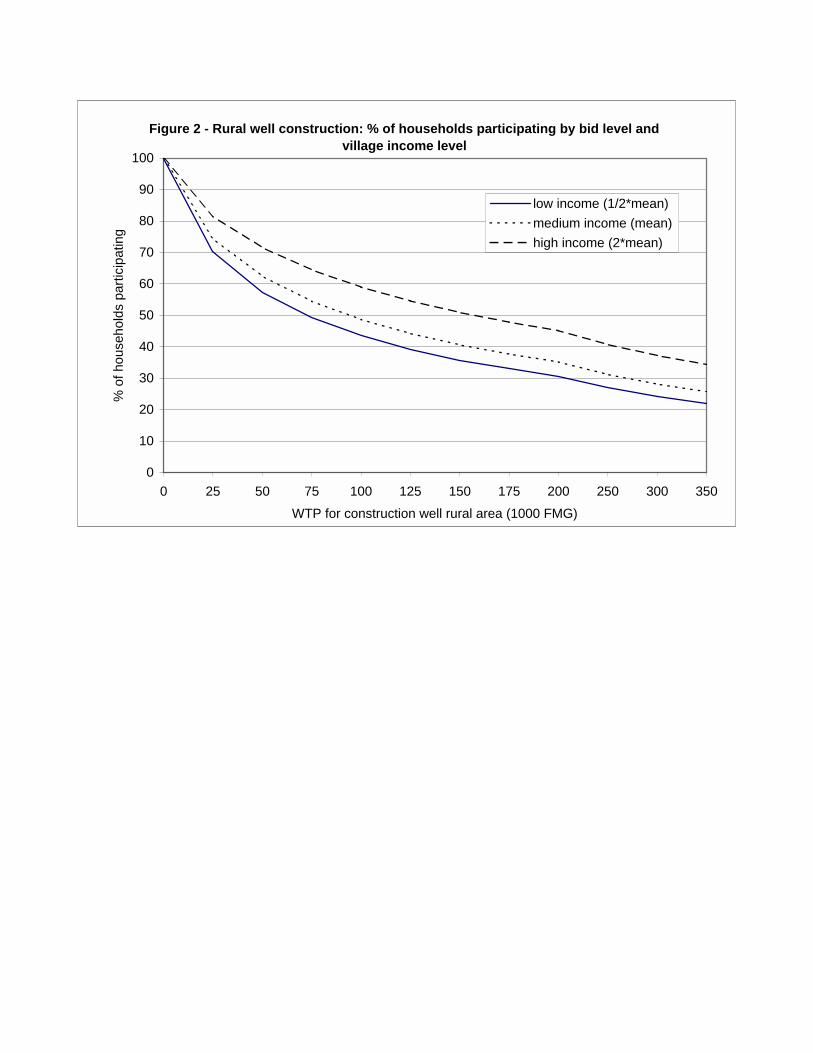
Figure 2 - Rural well construction: % of households participating by bid level and village income level
0
10
20
30
40
50
60
70
80
90
100
0 25 50 75 100 125 150 175 200 250 300 350
WTP for construction well rural area (1000 FMG)
% o
f hou
seho
lds
parti
cipa
ting
low income (1/2*mean)medium income (mean)high income (2*mean)
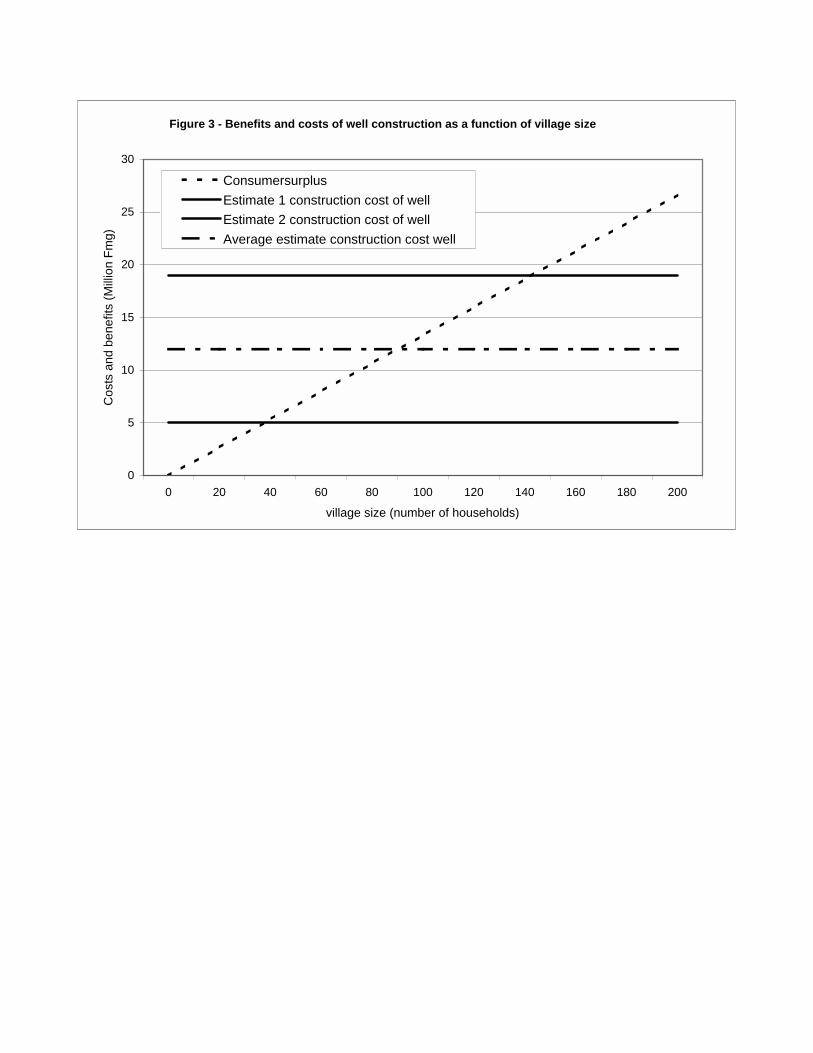
Figure 3 - Benefits and costs of well construction as a function of village size
0
5
10
15
20
25
30
0 20 40 60 80 100 120 140 160 180 200
village size (number of households)
Cos
ts a
nd b
enef
its (M
illio
n Fm
g)
ConsumersurplusEstimate 1 construction cost of wellEstimate 2 construction cost of wellAverage estimate construction cost well

Figure 4 - Water use (liters per household per month) as a function of distance to a public tap - simulation based on regression results
0
500
1000
1500
2000
2500
3000
0 1 2 3 4 5 6 7 8 9 10
Walking distance from house to tap (minutes one way)
Wat
er u
se (l
iters
per
hou
seho
ld p
er m
onth
)
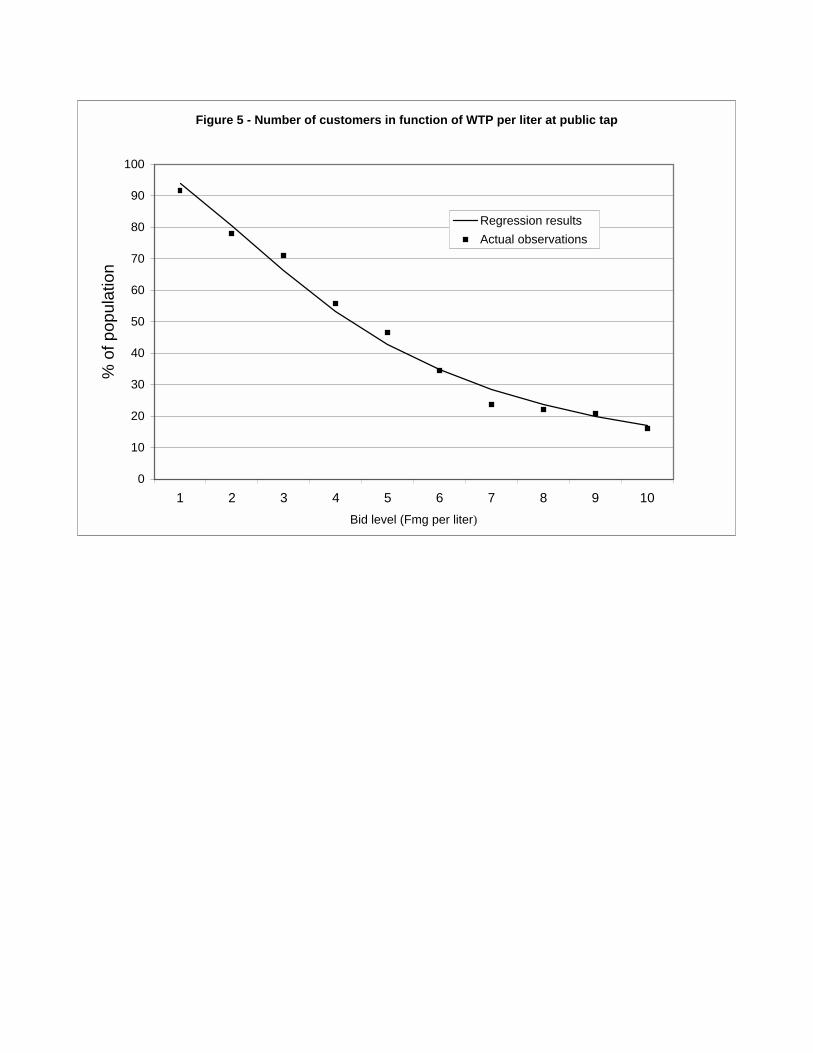
Figure 5 - Number of customers in function of WTP per liter at public tap
0
10
20
30
40
50
60
70
80
90
100
1 2 3 4 5 6 7 8 9 10Bid level (Fmg per liter)
% o
f pop
ulat
ion
Regression results Actual observations
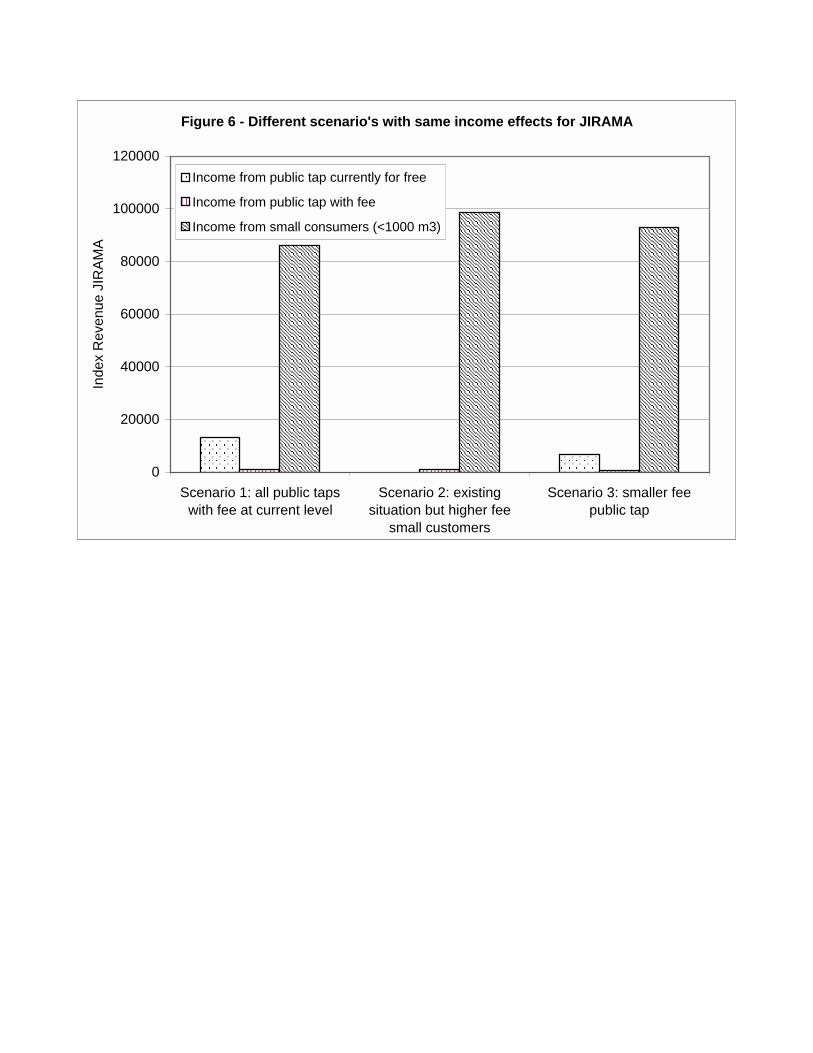
Figure 6 - Different scenario's with same income effects for JIRAMA
0
20000
40000
60000
80000
100000
120000
Scenario 1: all public tapswith fee at current level
Scenario 2: existingsituation but higher fee
small customers
Scenario 3: smaller feepublic tap
Inde
x R
even
ue J
IRA
MA
Income from public tap currently for free
Income from public tap with fee
Income from small consumers (<1000 m3)

25
Annex 1: Willingness to pay scenario for rural areas SECTION 3 : CONSENTEMENT A PAYER DES MENAGES
Ne rien écrire ici
W1a. Est-ce que la source actuelle où vous puisez de l’eau vous est satisfaisante ? 1. Oui ���� W2a 2. Non
W1b. Si Non, quelle est la principale raison ? 1. Loin 2. Source non régulière 3. Qualité de l’eau non satisfaisante 4. Autres (à préciser). . . . . . . . . . . . . . . . . . . .
W2a. Est-il important pour votre ménage d’améliorer l’alimentation en eau dans votre localité ?
1. Très important 2. Important 3. Assez important 4. Pas important
W2b. Si W2a=4, quelle est la principale raison ? 1. Proche de la maison 2. Habitude 3. Qualité de l’eau satisfaisante 4. Autres (à préciser). . . . . . . . . . . . . . . . . . . . . . . . . . .
W3a. Y avait-il déjà eu des travaux d’amélioration de la qualité de l’eau que vous puisez ?
1. Oui 2. Non ���� W4
W3b. Si oui, pouvez-vous décrire succintement ces travaux d’amélioration ? . . . . . . . . . . . . . . . . . . . . . . . . . . . . . . . . . . . . . . . . . . . . . . . . . . . . . . . . . . . . . . . . . . . . . . . . . . . . . . . . . . . . . . . . . . . . . . . . . . . . . . . . . . . . . . . . . . . . . . . . . . . . . . . . . . . . . . . . . . . . . . . . . . . . . . . .
W4. Dans certaines régions de Madagascar, comme à Andriamanero ou Beraketa, des projets de construction de puit aménagé avec poulie ont été mis sur pied, comme décrit ci-après : D’abord, la communauté villageoise a deblayé l’aire pour construire le puit. Après cela, ils ont procédé à l’excavation du sol, d’environ une dizaine de mètres, pour avoir de l'eau. Puis, des buses en béton ont été confectionnées et posées dans le puit. Ce dernier est ensuite couvert en béton. Et un système de poulie sert à monter facilement l’eau. Cela consiste à poser un support métallique sur lequel s’accroche une poulie. Un seau attaché à un bout d'une corde s’enroule autour de cette poulie pour puiser l'eau. Enfin le pourtour du puit est aménagé pour faciliter l'évacuation des eaux usées et une clôture de protection en bois y est installée. L'objectif de la construction d'un tel puit est d'améliorer l'alimentation en eau des ménages afin qu'ils boivent et utilisent de l'eau potable régulière pendant toute l'année, pour éviter les pénuries d'eau et les maladies causées par l'eau à boire. Mais pour pouvoir construire ces puits, la communauté doit supporter 50% des dépenses en plus de la main d’œuvre. Pour ce faire, chaque ménage dans le village bénéficiaire du projet contribue financièrement de façon égale à cette part de dépenses. Supposez que l’on décide de construire un puit comme décrit ci-dessus dans votre village, votre ménage consent-il à payer ________________________ Fmg comme contribution financière pour pouvoir construire ce puit ?
1. Oui 2. Non ���� W7a W5. Etes-vous très sûr / sûr / presque sûr / ou pas sûr de votre réponse ? 1. Très sûr 2. Sûr 3. Presque sûr 4. Pas sûr
W6. Comment allez-vous surtout faire pour se procurer de cette somme d’argent ? ���� W9a 1-Réduire le montant alloué aux petites dépenses quotidiennes (aliments, éclairage) 2-Vendre une partie de la récolte 3-Effectuer des activités génératrices de revenu 4-Autres (à préciser). . . . . . . . . . . . . . . . . . . . . . . . . . . . . . . . . . . . . . . . . . . . . . . . . . . . . . . .
: : : : : : :::::: : :
:
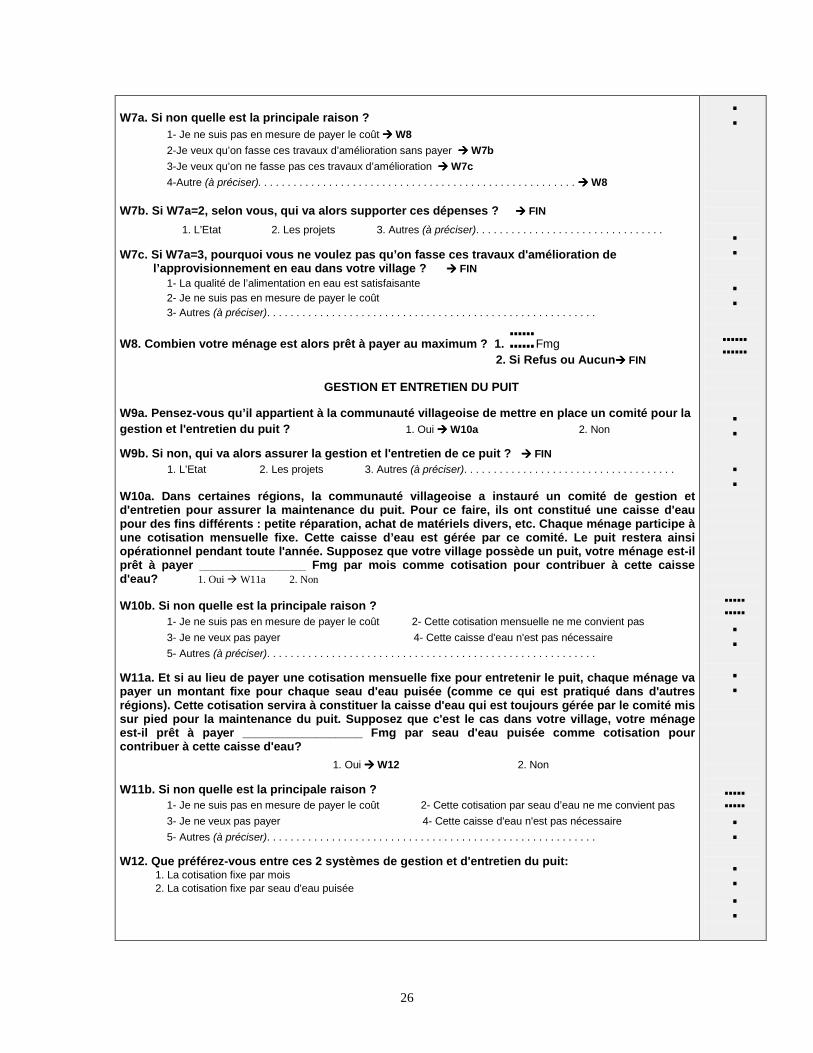
26
W7a. Si non quelle est la principale raison ?
1- Je ne suis pas en mesure de payer le coût ���� W8 2-Je veux qu’on fasse ces travaux d’amélioration sans payer ���� W7b 3-Je veux qu’on ne fasse pas ces travaux d’amélioration ���� W7c 4-Autre (à préciser). . . . . . . . . . . . . . . . . . . . . . . . . . . . . . . . . . . . . . . . . . . . . . . . . . . . . . ���� W8
W7b. Si W7a=2, selon vous, qui va alors supporter ces dépenses ? ���� FIN 1. L’Etat 2. Les projets 3. Autres (à préciser). . . . . . . . . . . . . . . . . . . . . . . . . . . . . . . .
W7c. Si W7a=3, pourquoi vous ne voulez pas qu’on fasse ces travaux d'amélioration de l’approvisionnement en eau dans votre village ? ���� FIN
1- La qualité de l’alimentation en eau est satisfaisante 2- Je ne suis pas en mesure de payer le coût 3- Autres (à préciser). . . . . . . . . . . . . . . . . . . . . . . . . . . . . . . . . . . . . . . . . . . . . . . . . . . . . . . .
W8. Combien votre ménage est alors prêt à payer au maximum ? 1. :::::: Fmg 2. Si Refus ou Aucun���� FIN
GESTION ET ENTRETIEN DU PUIT
W9a. Pensez-vous qu’il appartient à la communauté villageoise de mettre en place un comité pour la gestion et l'entretien du puit ? 1. Oui ���� W10a 2. Non
W9b. Si non, qui va alors assurer la gestion et l'entretien de ce puit ? ���� FIN 1. L’Etat 2. Les projets 3. Autres (à préciser). . . . . . . . . . . . . . . . . . . . . . . . . . . . . . . . . . . . W10a. Dans certaines régions, la communauté villageoise a instauré un comité de gestion et d'entretien pour assurer la maintenance du puit. Pour ce faire, ils ont constitué une caisse d'eau pour des fins différents : petite réparation, achat de matériels divers, etc. Chaque ménage participe à une cotisation mensuelle fixe. Cette caisse d’eau est gérée par ce comité. Le puit restera ainsi opérationnel pendant toute l'année. Supposez que votre village possède un puit, votre ménage est-il prêt à payer ________________ Fmg par mois comme cotisation pour contribuer à cette caisse d'eau? 1. Oui � W11a 2. Non W10b. Si non quelle est la principale raison ?
1- Je ne suis pas en mesure de payer le coût 2- Cette cotisation mensuelle ne me convient pas 3- Je ne veux pas payer 4- Cette caisse d'eau n'est pas nécessaire 5- Autres (à préciser). . . . . . . . . . . . . . . . . . . . . . . . . . . . . . . . . . . . . . . . . . . . . . . . . . . . . . . .
W11a. Et si au lieu de payer une cotisation mensuelle fixe pour entretenir le puit, chaque ménage va payer un montant fixe pour chaque seau d'eau puisée (comme ce qui est pratiqué dans d'autres régions). Cette cotisation servira à constituer la caisse d'eau qui est toujours gérée par le comité mis sur pied pour la maintenance du puit. Supposez que c'est le cas dans votre village, votre ménage est-il prêt à payer __________________ Fmg par seau d'eau puisée comme cotisation pour contribuer à cette caisse d'eau? 1. Oui ���� W12 2. Non
W11b. Si non quelle est la principale raison ?
1- Je ne suis pas en mesure de payer le coût 2- Cette cotisation par seau d’eau ne me convient pas 3- Je ne veux pas payer 4- Cette caisse d'eau n'est pas nécessaire 5- Autres (à préciser). . . . . . . . . . . . . . . . . . . . . . . . . . . . . . . . . . . . . . . . . . . . . . . . . . . . . . . .
W12. Que préférez-vous entre ces 2 systèmes de gestion et d'entretien du puit: 1. La cotisation fixe par mois 2. La cotisation fixe par seau d'eau puisée
: : : :::::: : : :::::
: :
::::: : : :

27
Annex 2: Willingness to pay scenario for urban areas Nous avons parlé des problèmes relatifs à l’approvisionnement en eau de votre ménage, dont les plus importants sont : (citer uniquement ceux qui intéressent le répondant, inclure les problèmes relevés par le répondant mais non listés en bas) - L’insuffisance des points d’eau - Les fréquentes pannes ou mauvais fonctionnement des pompes publiques ou à
domicile - La faiblesse du débit d’eau pendant l’année ou une certaine période de l’année - Le manque d’eau pendant une certaine période de l’année - La qualité douteuse de l’eau utilisée (a) Scénario pour les bénéficiaires des infrastructures publiques Cas 1 : Création d’une nouvelle infrastructure (borne-fontaine): Supposez que votre ménage pourrait bénéficier d’un meilleur service tel qu’une …………(Infrastructure désirée par le répondant) à chaque 100m des maisons de votre quartier fournit de l’eau de7h du matin à 7h du soir avec un débit suffisant 365 jours l’année. Vous allez pouvoir boire de l’eau du robinet sans aucun traitement préalable. Comme l’installation de cette nouvelle infrastructure va coûter de l’argent, il est probable que les habitants du quartier qui l’utilisent vont devoir payer l’eau. L’argent serait gérée par une association des usagers de l’eau dans le quartier pour payer la facture de consommation à la JIRAMA et maintenir en bon état le …………(Infrastructure désirée par le répondant). Nous aimerions savoir combien vous évaluez la possibilité d’avoir ce meilleur service. Sachez qu’il est important que vous nous donnez une réponse honnête. Si vous nous donnez un montant plus faible que ce que vous pouvez payer réellement, un service d’approvisionnement serait fourni mais pas vraiment selon vos besoins. D’autre part, si vous nous donnez un prix plus élevé que vous pensiez pouvoir payer, un système d’approvisionnement serait conçu mais trop cher pour être opérationnel. 1. Supposez que l’installation de …………(Infrastructure désirée par le répondant)
vous coûterait : _________ Fmg par seau _________ Fmg par mois supplémentaire de ce que vous dépensez déjà actuellement pour l’eau, voudriez-vous payer ce________ Fmg additionnel pour que la construction de ce …..…………..… (Infrastructure désirée par le répondant) ait lieu dans votre quartier ?
1. Oui, je voudrais payer 2. Non, je ne voudrais pas payer, je continuerais à utiliser les sources existantes actuelles 3. Je ne sais pas, je ne suis pas sure
2. Combien serait le maximum que vous consentiriez à payer (max CAP) pour pouvoir
bénéficier des avantages du nouveau service cite plus haut? (Répétez au répondant les avantages cites dans l’introduction du scénario si nécessaire)
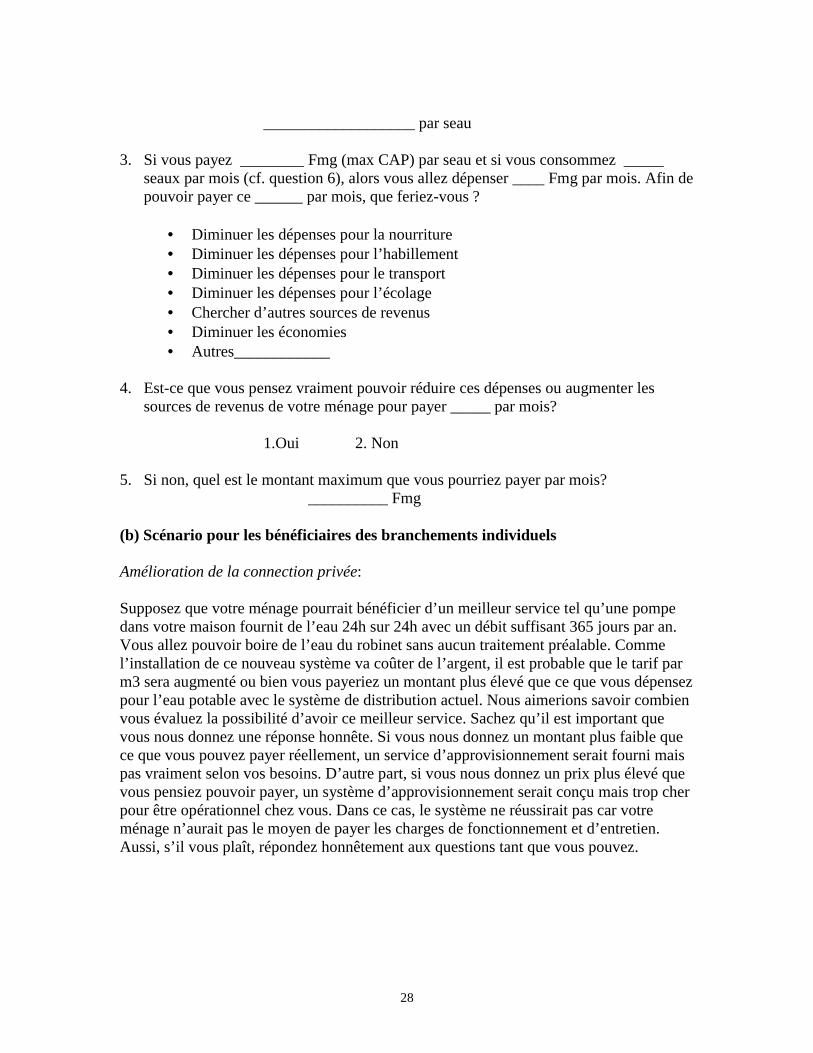
28
___________________ par seau
3. Si vous payez ________ Fmg (max CAP) par seau et si vous consommez _____
seaux par mois (cf. question 6), alors vous allez dépenser ____ Fmg par mois. Afin de pouvoir payer ce ______ par mois, que feriez-vous ?
• Diminuer les dépenses pour la nourriture • Diminuer les dépenses pour l’habillement • Diminuer les dépenses pour le transport • Diminuer les dépenses pour l’écolage • Chercher d’autres sources de revenus • Diminuer les économies • Autres____________
4. Est-ce que vous pensez vraiment pouvoir réduire ces dépenses ou augmenter les
sources de revenus de votre ménage pour payer _____ par mois?
1.Oui 2. Non
5. Si non, quel est le montant maximum que vous pourriez payer par mois? __________ Fmg
(b) Scénario pour les bénéficiaires des branchements individuels Amélioration de la connection privée: Supposez que votre ménage pourrait bénéficier d’un meilleur service tel qu’une pompe dans votre maison fournit de l’eau 24h sur 24h avec un débit suffisant 365 jours par an. Vous allez pouvoir boire de l’eau du robinet sans aucun traitement préalable. Comme l’installation de ce nouveau système va coûter de l’argent, il est probable que le tarif par m3 sera augmenté ou bien vous payeriez un montant plus élevé que ce que vous dépensez pour l’eau potable avec le système de distribution actuel. Nous aimerions savoir combien vous évaluez la possibilité d’avoir ce meilleur service. Sachez qu’il est important que vous nous donnez une réponse honnête. Si vous nous donnez un montant plus faible que ce que vous pouvez payer réellement, un service d’approvisionnement serait fourni mais pas vraiment selon vos besoins. D’autre part, si vous nous donnez un prix plus élevé que vous pensiez pouvoir payer, un système d’approvisionnement serait conçu mais trop cher pour être opérationnel chez vous. Dans ce cas, le système ne réussirait pas car votre ménage n’aurait pas le moyen de payer les charges de fonctionnement et d’entretien. Aussi, s’il vous plaît, répondez honnêtement aux questions tant que vous pouvez.
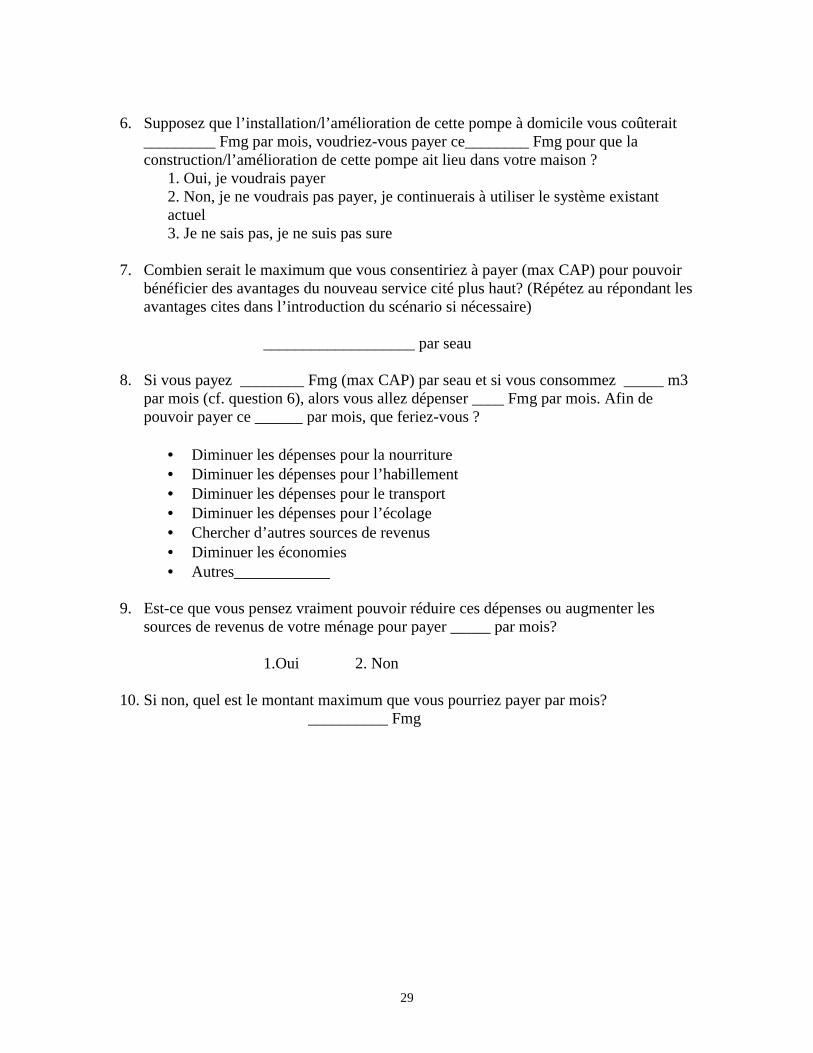
29
6. Supposez que l’installation/l’amélioration de cette pompe à domicile vous coûterait
_________ Fmg par mois, voudriez-vous payer ce________ Fmg pour que la construction/l’amélioration de cette pompe ait lieu dans votre maison ?
1. Oui, je voudrais payer 2. Non, je ne voudrais pas payer, je continuerais à utiliser le système existant actuel 3. Je ne sais pas, je ne suis pas sure
7. Combien serait le maximum que vous consentiriez à payer (max CAP) pour pouvoir
bénéficier des avantages du nouveau service cité plus haut? (Répétez au répondant les avantages cites dans l’introduction du scénario si nécessaire)
___________________ par seau
8. Si vous payez ________ Fmg (max CAP) par seau et si vous consommez _____ m3
par mois (cf. question 6), alors vous allez dépenser ____ Fmg par mois. Afin de pouvoir payer ce ______ par mois, que feriez-vous ?
• Diminuer les dépenses pour la nourriture • Diminuer les dépenses pour l’habillement • Diminuer les dépenses pour le transport • Diminuer les dépenses pour l’écolage • Chercher d’autres sources de revenus • Diminuer les économies • Autres____________
9. Est-ce que vous pensez vraiment pouvoir réduire ces dépenses ou augmenter les
sources de revenus de votre ménage pour payer _____ par mois?
1.Oui 2. Non
10. Si non, quel est le montant maximum que vous pourriez payer par mois? __________ Fmg