Embed Size (px)
Citation preview

1Saga plc preliminary results for the 12 months ended 31 January 2018
Results presentation
Preliminary results for the 12 months ended 31 January 2018

2Saga plc preliminary results for the 12 months ended 31 January 2018
Lance BatchelorChief Executive Officer

3Saga plc preliminary results for the 12 months ended 31 January 2018
Today’s Agenda
Lance BatchelorChief Executive Officer
Overview
Jonathan HillChief Financial Officer
Financials
Gary DugganCEO, Retail Insurance Broking
Retail Insurance Broking
Lance BatchelorChief Executive Officer
Summary
Q&A

4Saga plc preliminary results for the 12 months ended 31 January 2018
• Our 2017/18 results are inline with revised guidance
• Our highly cash generative model and capital structure supports both capital investments and dividends
• The Saga model is increasingly efficient and supports targeted customer growth
• Early signs of customer growth from targeted investments
Key highlights

5Saga plc preliminary results for the 12 months ended 31 January 2018
Full year numbers
2017/18
Underlying PBT(1) £190.1m +1.4%
Retail broking Underlying PBT(1) £130.2m (5.7%)
Travel Underlying PBT(1) £20.4m +36.9%
Available operating cash flow £175.5m (19.3%)
Debt ratio 1.7x (0.2x)
Full year dividend 9.0p +5.9%
(1) Profit before tax from continuing operations excluding derivatives, debt write-off costs, one-off restructuring costs and Ogden rate changes.

6Saga plc preliminary results for the 12 months ended 31 January 2018
• Grow Underlying PBT by mid single digit %
• Cash generation to reduce debt• Growing our broking business
supported by an expanded motor footprint
• Growing travel through a renewed fleet and growth in tour passengers
• Invest in systems and capabilities
Our strategyExpected profit contribution at IPO mid single digit % growth
Actual earned profit contribution after £10m of investments
Strategic priorities
15/16 16/17 17/18 18/19
15/16 16/17 17/18 18/19Underwriting Travel Home & Other Motor

7Saga plc preliminary results for the 12 months ended 31 January 2018
What has gone right?
• Launch of the motor panel in 2015 with four external underwriters
• Driven third-party panel share to approximately 30% of the renewal book within two years of launch
• High levels of cross-sell between insurance products
• Investment in IT platforms: Adobe Marketing Cloud, Guidewire
• Motor premium inflation supported a 37% increase in 2017/18 written motor profit, partially offsetting the WTE headwind
What hasn’t?
• Limited investment in growing customers
• Panel not fully optimised
• Product differentiation limited by old platforms
Motor broking – a review

8Saga plc preliminary results for the 12 months ended 31 January 2018
Motor broking – our plans
Strategic priorities
• Drive customer acquisition and retention
• Expansion of our motor footprint
• Take advantage of our increasingly efficient operating model
Gary Duggan, CEO Retail Broking
• Joined in September 2017
• Previously Managing Director of Junction, BGL’s broking business

9Saga plc preliminary results for the 12 months ended 31 January 2018
Retail broking• Home broking trading continued to be challenging
– Limited premium inflation
– Flexible panel of underwriters continue to offer margin protection
• Other broking was robust
Insurance in 2017/18
Underwriting• Excellent results driven by prior year
claims experience
• New quota share arrangement demonstrates the high quality and stability of our underwriting business

10Saga plc preliminary results for the 12 months ended 31 January 2018
Tour Operations• Growth in profits of 20%
• A challenging period for our teams during the Monarch insolvency and hurricane season
Cruise• Growth in profits of 94% from increased capacity days
Travel in 2017/18
• Spirit of Adventure ordered for delivery in August 2020
Current trading update• Reservation IT platform development
underway
• Spirit of Discovery first 19 cruises now over 50% sold at rates that meet our expectations

11Saga plc preliminary results for the 12 months ended 31 January 2018
• Underlying profits are up and inline with revised guidance
• Cash generation strong and a further reduction in debt
• Travel business continues to grow
• Other broking was robust but motor and home underdelivered
Summary

12Saga plc preliminary results for the 12 months ended 31 January 2018
Jonathan HillChief Financial Officer

13Saga plc preliminary results for the 12 months ended 31 January 2018
• Free cash flow before financing activities of £145.2m giving a dividend coverage of 1.4x
• Net Debt of £432.0m (FY 2017: £464.9m)
• Dividend supported by stability of our highly cash generative model
Growth in Underlying PBT of 1.4%
FY 2018 FY 2017
Customer spend
£1,209m £1,182m +2.3%
Revenue £860.1m £871.3m (1.3%)
Underlying PBT(1)
£190.1m £187.4m +1.4%
Profit before tax
£178.7m £193.3m (7.6%)
Debt ratio 1.7x 1.9x (10.5%)
Dividend 9.0p 8.5p 5.9%
(1) Profit before tax from continuing operations excluding derivatives, debt write-off costs, one-off restructuring costs and Ogden rate changes.

14Saga plc preliminary results for the 12 months ended 31 January 2018
£133.0m£143.6m
FY 2017 FY 2018
Written profits from broking and travel of £143.6m
Written UPBT(1) FY 2018 FY 2017
Motor broking £39.0m £28.4m +37.3%
Earned £42.4m £45.2m (6.2%)
Home broking £53.0m £58.1m (8.8%)
Earned £56.6m £61.2m (7.5%)
Other broking £31.2m £31.6m (1.3%)
Underwriting £79.2m £77.1m +2.7%
Travel £20.4m £14.9m +36.9%
(1) Written profit before tax excluding derivatives, debt write-off costs, one-off restructuring costs and Ogden rate changes.
Written retail broking and travel PBT growth
+8.0%

15Saga plc preliminary results for the 12 months ended 31 January 2018
Retail broking
FY 2018 (Written) Motor broking Home broking Other broking Total retail broking
Revenue £117.8m £81.4m £76.2m £275.4m
Underlying PBT £39.0m £53.0m £31.2m £123.2m
Profit per core policy £30.4 £44.7 £99.4 £44.3
Core policies sold 1,281k 1,186k 314k 2,781k
FY 2017
Revenue £112.0m £86.7m £80.4m £279.1m
Underlying PBT £28.4m £58.1m £31.6m £118.1m
Profit per core policy £20.8 £46.3 £82.9 £39.4
Core policies sold 1,366k 1,254k 381k 3,001k
• Written broking performance driven by motor
• On an earned basis, profitability of the broking business declined 5.7% due to a reduction in the motor written to earned adjustment

16Saga plc preliminary results for the 12 months ended 31 January 2018
Written to earned adjustment
£m FY 2018 FY 2017 FY 2016
Motor £3.4m £16.8m £7.4m
Home £3.6m £3.1m -
Total £7.0m £19.9m £7.4m
• Decline in WTE in FY 2018 driven by:
– Reduction in policies and ancillary products underwritten by AICL; and
– the introduction of the arrangement fee in 2015
• WTE expected to reduce

17Saga plc preliminary results for the 12 months ended 31 January 2018
99.6%
71.4%
97.7%
71.1%
102.3%
Pure COR COR
Continued strength in underwriting performance
FY 2017
FY 2017 FY 2018
FY 2018
• Increase in Underlying PBT driven by an improved Pure COR, offset by marginally lower underlying reserve releases of £60m (FY 2017: £63m)
• Reserve releases are driven by favourable small and large PI claims
£223.5m
£77.1m
£225.4m
£79.2m
Underlying revenue Underlying PBT
Reduction in underwritten policies and lower reserve releases
FY 2017 FY 2018
FY 2017 FY 2018
Comparable Expense and Combined Operating Ratios*
UK Market**
* Figures exclude the impact of the quota share arrangement and Ogden impacts** ABI Statistics to the end of December 2016

18Saga plc preliminary results for the 12 months ended 31 January 2018
• YOY decrease in number of earned policies driven by improvement in share of external panel
• New quota share arrangement to cover 80% of underwriting risk of motor policies, effective 1 February 2019 on a rolling three years
• Adds Hannover Re to our current reinsurance partner NewRe, and replaces our existing quota share arrangement which is due to expire on 31 January 2019
Quota share – reduces risk and volatility
Underwriting P&L
ReportedFY2018
Quota share
UnderlyingFY 2018
Growth UnderlyingFY 2017
Revenue £98.8m (£126.6m) £225.4m +0.9% £223.5m
Underlying PBT £79.2m - £79.2m +2.7% £77.1m
Reported COR 30.4% 71.1% (0.3%) 71.4%
Pure COR 91.1% 97.7% (1.9%) 99.6%
No of earned policies
916k 955k

19Saga plc preliminary results for the 12 months ended 31 January 2018
Strong Solvency II position
143%
171%
31 January 2017 31 January 2018
Solvency II coverage Surplus £57.1m
• SCR reduced to £79.9m from £102.9m at 31 January 2017
• The Solvency II coverage increased to 171% after payment of a dividend from AICL of £70m (FY 2017: £115m)
£79.9m
£137.0m
SCR Solvency II Capital

20Saga plc preliminary results for the 12 months ended 31 January 2018
Cruise• Underlying PBT +94% to £6.6m (FY 2017: £3.4m) because of fewer maintenance
days
• Includes investment in marketing initiatives for Spirit of Discovery
• Spirit of Adventure financing was confirmed in December at 3.3%
Travel – continued growth
FY 2018 FY 2017
Revenue £448.8m £432.0m +3.9%
Gross profit £92.6m £88.0m +5.2%
Underlying PBT £20.4m £14.9m 36.9%
No. of holiday passengers 184k 190k (3.2%)
No. of cruise passengers 24k 21k +14.3%
Tour Operating • Underlying PBT +20% to £13.8m
(FY 2017: £11.5m)
• Increase in revenue of 2.9% driven by FX and continued shift in mix
• Decrease in passenger numbers primarily due to the cancellation impact of the collapse of Monarch Airlines

21Saga plc preliminary results for the 12 months ended 31 January 2018
Emerging businesses
• Continue to develop some opportunities within Saga Money
• Saga Healthcare pilot continues to develop
Central costs
• IAS19R current service cost is not expected to repeat next year
• Lower level of net debt driving down finance costs
Emerging business and central costs
FY 2018 FY 2017
Revenue £29.9m £29.3m +1.7%
PBIT (EB) £0.7m £0.8m (12.5%)
Central Costs (£22.4m) (£25.2m) +11.1%
PBIT (£21.7m) (£24.4m) +11.1%
IAS19R (£5.5m) (£1.5m)
Finance cost (£12.5m) (£16.7m) +25.1%
Underlying loss before tax
(£39.7m) (£42.6m) +6.8%

22Saga plc preliminary results for the 12 months ended 31 January 2018
Group leverage excluding Travel expected to fall to approximately 1x
(1) Group net debt excluding Travel segment
• Reduction in Group debt since IPO from £700m to £445m. Driven by:
– Strong cash generation; and
– Reduction in capital requirement in AICL with the introduction of the quota share
• Continued reduction of Group net debt is expected over time
• Group leverage excluding both the debt and EBITDA from the Travel segment is expected to fall to approximately 1x by FY23
3.1x
2.3x
1.9x1.7x
IPO FY16 FY17 FY18 FY19 FY20 FY21 FY22 FY23
Group net debt(1) Net Debt / EBITDA

23Saga plc preliminary results for the 12 months ended 31 January 2018
Ship financing is asset backed
• Asset backed financing for each new ship with a 12 year amortising ECA backed loan:
– SofD: £245m, interest rate 4.4%
– SofA: c.£280m, interest rate 3.3%
• Covenants apply at the Travel sub-group first, and then Plc
• All covenants have significant headroom
• Pre-sales of over 50% of the first 19 cruises provide confidence in the cash generation of each ship
FY20 FY21 FY22 FY23
SoD SoA

24Saga plc preliminary results for the 12 months ended 31 January 2018
Capital structure supports a temporary increase in leverage
• The Group’s leverage will peak at the first reporting date following delivery of each ship
• Peak leverage is expected to remain below 3.0x
• Peak leverage is driven by part year delivery of the ships
• Proforma leverage, adjusting for the expected full year EBITDA contribution from each ship, would remain below 2.5x at the peaks
(1) Group net debt excluding Travel segment
3.1x
2.3x
1.9x1.7x
IPO FY16 FY17 FY18 FY19 FY20 FY21 FY22 FY23
Group net debt(1) SoD SoA Net Debt / EBITDA

25Saga plc preliminary results for the 12 months ended 31 January 2018
• Dividend from AICL has normalised as the capital release from the quota share reduces
• Capex has increased to support the Guidewire program
• Within the Travel business we continue to retain profits to fund stage payments for our two new ships
Strong operating cash conversion of 70%
FY 2018 FY 2017
Trading EBITDA £250.1m £247.1m
Less: restricted businesses (£117.4m) (£109.9m)
Intra-group dividends paid by restricted businesses £70.0m £115.0m
Working capital and non-cash items (£0.9m) (£14.6m)
Capex funded with available cash (£26.3m) (£20.0m)
Available operating cash flow £175.5m £217.6m
Available operating cash flow % 70.2% 88.1%

26Saga plc preliminary results for the 12 months ended 31 January 2018
Capital structure and cash generation supports the dividend
Strong cash generation provides 1.4x coverage for the dividend
8.5p 9.0p
15.1p
12.2p
FY 2017 FY 2018
Dividend per share Operating cash flow per share

27Saga plc preliminary results for the 12 months ended 31 January 2018
£10m
£10-15m
£(10)m £(10)m
£(10-15)m£190.1m
FY 2018 Written toearned
Cost savings Targetedinvestments
Reservereleases
Underlyinggrowth
FY 2019
• Costs savings of £10m have been delivered and are being invested in customer growth
• Underlying growth of between £10-15m, driven by:
– some growth across all our operating businesses; and
– a limited IAS19R pension charge
• Available operating cash conversion to be between 70% and 80%
Financial outlook and guidance
c.5% reduction in Underlying PBT

28Saga plc preliminary results for the 12 months ended 31 January 2018
Gary DugganCEO, Retail Insurance Broking

29Saga plc preliminary results for the 12 months ended 31 January 2018
First impressions
Strengths Weaknesses
• Focus on a growing demographic with a great brand
• Strong customer relationships drive industry leading retention
• Flexible supply of underwriting from panels, with a high quality in-house underwriter
• A limited footprint within the large over 50s insurance market
• Immature motor panel
• Limited product innovations
• A complex organisational structure with legacy systems

30Saga plc preliminary results for the 12 months ended 31 January 2018
Opportunities for Saga to grow its broking business
Customer acquisition and
retention
An increasingly efficient operating
model
Expansion of the footprint
• Maximise our use of data to help expand our footprint with existing underwriters
• Seek to add incremental underwriters to the motor panel to support additional footprint expansion
• Simplify and standardise across the business• Continuing to drive efficiencies in customer operations to
create capacity for growth
• Investment in new business pricing (skewed to HACs and pHACs)
• Optimising our marketing approach• Improved propositions through Guidewire and Possibilities
driving higher retention

31Saga plc preliminary results for the 12 months ended 31 January 2018
Lance BatchelorChief Executive Officer

32Saga plc preliminary results for the 12 months ended 31 January 2018
Growing our customer base
• Significant growth in both Underlying PBT and dividends since IPO
• Rapid deleveraging and reduction in debt from £700m at IPO to £445m
• Achieved with a loyal and stable customer base
Efficient platform with 80% of IT
systems replaced
Investment in customer insight capabilities and
tools
New shipping fleet
Launch of Possibilities
Significant investment in IT to
become a more efficient and flexible
company
Decision to make £10m of targeted
investments to grow our customer base

33Saga plc preliminary results for the 12 months ended 31 January 2018
Encouraging signs of growth from targeted investments
• Our targeted investments are starting to drive volume• We are confident they will lead to a larger customer base and a return to
sustainable profit growth in the future
+17.7%+9.2%
Broking new business volumes Travel new business revenue
+0.7%
+26.7%
Motor Home
YTD FY 2018 YTD FY 2019
Tour Cruise
YTD FY 2018 YTD FY 2019

34Saga plc preliminary results for the 12 months ended 31 January 2018
• Since launch Possibilities has over 500,000 members, with sign up rates greater than 80%.
• High levels of customer engagement– 40 ballots which have garnered over
107,000 entries from members– 35,000 partner offers redeemed– Open rates on communications
>50%
Possibilities – driving customer engagement
vs. FY 2017
Number of members 536,000 as at 31 March 2018
Products held by HACs 1,143k +1.2%
Number of members since launch
0k
100k
200k
300k
400k
500k
600k
Sept Oct Nov Dec Jan Feb Mar

35Saga plc preliminary results for the 12 months ended 31 January 2018
Transition to higher quality earnings
• Growth in Travel replaces the lower quality earnings from our underwriter.
Continued high cash generation
• Growth from capital light retail broking will continue to support high levels of cash generation.
What could the future look like?
Moving towards higher quality earnings and more balanced
2018/19

36Saga plc preliminary results for the 12 months ended 31 January 2018
• The Saga model is increasingly efficient and supports investment for customer growth
• Early signs of growth from targeted investments with new business volumes in retail broking and tour increasing
• Deepening engagement with Possibilities
• The model is highly cash generative and will see an increasing quality of earnings over time
Summary

37Saga plc preliminary results for the 12 months ended 31 January 2018
Q&A

38Saga plc preliminary results for the 12 months ended 31 January 2018
Appendix

39Saga plc preliminary results for the 12 months ended 31 January 2018
Reserve releases
FY2018 Total Group Reserve Releases by Accident Year
• YOY reserve releases flat driven by favourable claims development experience
• No deterioration in underlying reserve margin
• Reserve releases are expected to reduce in FY19/20 by c.£10.0-15.0m
3.35.6 6.4
10.2 9.811.1
15.1
(1.5)
-4
-2
0
2
4
6
8
10
12
14
16
2010 2011 2012 2013 2014 2015 2016 2017
Res
erve
rel
ease
s (£
’m)
Accident Year

40Saga plc preliminary results for the 12 months ended 31 January 2018
Saga Plc consolidated income statementFY 2018 Growth FY 2017
Revenue £860.1m (1.3%) £871.3m
Trading Profit (1) £216.2m 1.0% £214.0m
Non-trading items (£3.4m) (£1.9m)
Amortisation of acquired intangibles (£4.7m) (£6.5m)
Pension charge IAS19R (£5.5m) (£1.5m)
Net finance costs(2) (£12.5m) (£16.7m)
Underlying Profit Before Tax £190.1m 1.4% £187.4m
Net fair value (losses)/gains on derivatives (£2.3m) £9.9m
Debt issue costs (£4.3m) -
Restructuring costs (£4.8m) -
Ogden rate change impact - (£4.0m)
Profit before tax from continuing operations £178.7m (7.6%) £193.3m
Tax expense (£33.6m) (6.7%) (£36.0m)
Loss after tax for the year from discontinued operations (£7.6m) -
Profit after tax £137.5m (12.6%) £157.3m
Basic earnings per share:
Underlying Earnings per share from continuing operations 13.8p 0.7% 13.7p
(1) This measure excludes the impact of IAS19R current service costs, as this is a non-cash accounting adjustment that has increased notably in the year and so has been separately identified in the table above.
(2) Restated to exclude IAS19R pension costs

41Saga plc preliminary results for the 12 months ended 31 January 2018
Insurance underwriting income statement
12m to Jan 2018
Quota Share
Underlying GrowthUnderlying12m to Jan
2017
Revenue A £98.8m (£126.6m) £225.4m 0.9% £223.5m
Claims costs B (£79.0m) £114.3m (£193.3m) 1.3% (£195.9m)Reserve releases C £60.0m - £60.0m (4.8%) £63.0m
Other cost of sales D (£8.7m) £12.8m (£21.5m) (1.4%) (£21.2m)Total cost of sales E (£27.7m) £127.1m (£154.8m) (0.5%) (£154.1m)
Gross profit £71.1m £0.5m £70.6m 1.7% £69.4m
Operating expenses F (£2.3m) £3.2m (£5.5m) (1.9%) (£5.4m)Investment return £10.4m (£5.8m) £16.2m 10.2% £14.7mQuota share net cost - £2.1m (£2.1m) (31.3%) (£1.6m)
Underlying profit before tax £79.2m - £79.2m 2.7% £77.1m
Reported loss ratio (B+C)/A 19.2% 59.1% (0.4%) 59.5%Expense ratio (D+F)/A 11.1% 12.0% 0.1% 11.9%Reported COR (E+F)/A 30.4% 71.1% (0.3%) 71.4%Pure COR (E+F-C)/A 91.1% 97.7% (1.9%) 99.6%
Number of earned policies 916k 955k

42Saga plc preliminary results for the 12 months ended 31 January 2018
Travel income statement
12m to Jan 2018Growth
12m to Jan 2017Tour
OperatingCruising Total
TravelTour
OperatingCruising Total
TravelRevenue £360.4m £88.4m £448.8m 3.9% £350.1m £81.9m £432.0mGross profit £69.5m £23.1m £92.6m 5.2% £71.5m £16.5m £88.0mMarketing expenses (£18.4m) (£7.8m) (£26.2m) 1.5% (£19.6m) (£7.0m) (£26.6m)Other operating expenses (£37.4m) (£8.8m) (£46.2m) 1.1% (£40.6m) (£6.1m) (£46.7m)Investment return £0.1m £0.1m £0.2m 0.0% £0.2m - £0.2m
Underlying profit before tax £13.8m £6.6m £20.4m 36.9% £11.5m £3.4m £14.9mNumber of holidays passengers 184k n/a 184k (3.2%) 190k n/a 190kNumber of cruise passengers n/a 24k 24k 14.3% n/a 21k 21kNumber of cruise passenger days n/a 323k 323k 7.3% n/a 301k 301k

43Saga plc preliminary results for the 12 months ended 31 January 2018
Emerging businesses and central costs income statement
12m to Jan 2018Growth
12m to Jan 2017Emerging
BusinessesCentral Costs
Total EmergingBusinesses
CentralCosts
Total
Revenue £28.0m £1.9m £29.9m 2.0% £27.2m £2.1m £29.3mProfit before interest, tax and the IAS19R pension charge £0.7m (£22.4m) (£21.7m) 11.1% £0.8m (£25.2m) (£24.4m)IAS19R pension charge - (£5.5m) (£5.5m) (266.7%) - (£1.5m) (£1.5m)Finance costs - (£12.5m) (£12.5m) 25.1% - (£16.7m) (£16.7m)Underlying profit /(loss) before tax £0.7m (£40.4m) (£39.7m) 6.8% £0.8m (£43.4m) (£42.6m)
44Saga plc preliminary results for the 12 months ended 31 January 2018
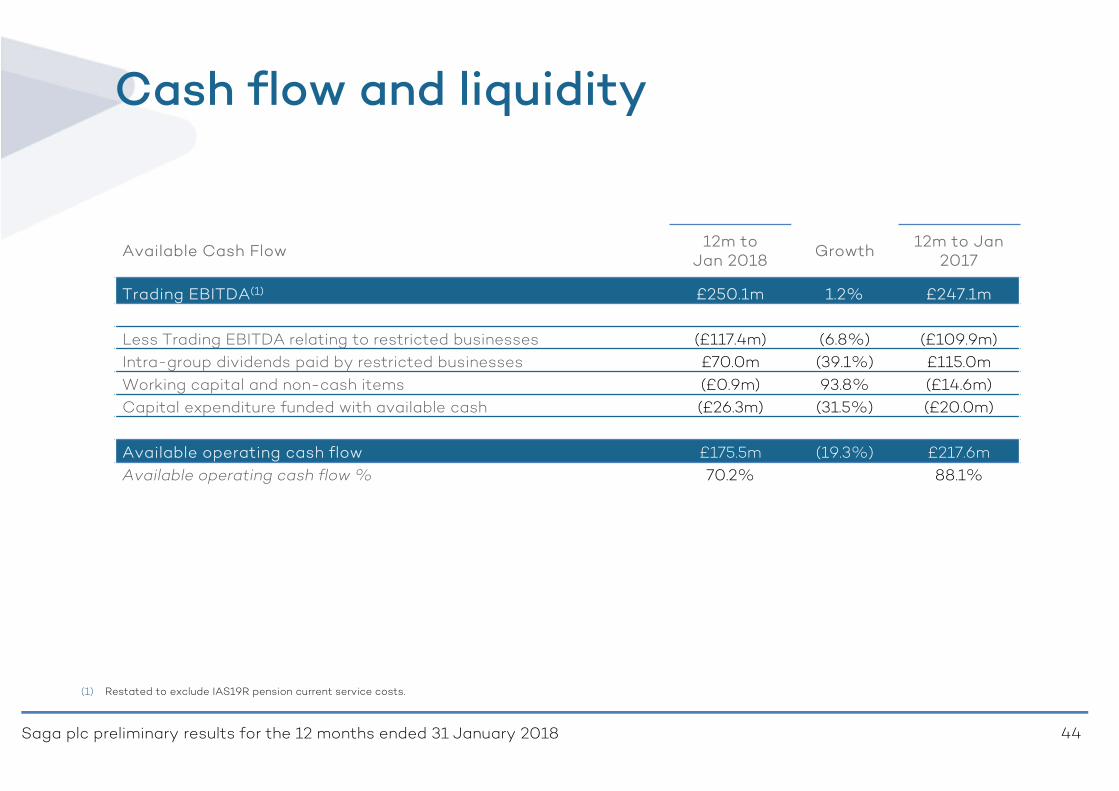
Cash flow and liquidity
Available Cash Flow12m to
Jan 2018Growth
12m to Jan 2017
Trading EBITDA(1) £250.1m 1.2% £247.1m
Less Trading EBITDA relating to restricted businesses (£117.4m) (6.8%) (£109.9m)Intra-group dividends paid by restricted businesses £70.0m (39.1%) £115.0mWorking capital and non-cash items (£0.9m) 93.8% (£14.6m)Capital expenditure funded with available cash (£26.3m) (31.5%) (£20.0m)
Available operating cash flow £175.5m (19.3%) £217.6mAvailable operating cash flow % 70.2% 88.1%
(1) Restated to exclude IAS19R pension current service costs.

45Saga plc preliminary results for the 12 months ended 31 January 2018
Customer metrics
FY 2018 FY 2017
Products held by HACs 1,143k 1,129k +1.2%
Number of members 376,400 Nil n/a
Average HAC product holding 2.4 2.3 +4.3%
HACs 471k 483k (2.5%)
pHACs 469k 467k +0.4%