Embed Size (px)
Citation preview

Vol 23 no 2 2007 pages 232ndash239
doi101093bioinformaticsbtl571BIOINFORMATICS ORIGINAL PAPER
Data and text mining
SAGA a subgraph matching tool for biological graphsYuanyuan Tian1 Richard C McEachin2 Carlos Santos3 David J States3 andJignesh M Patel11Department of Electrical Engineering and Computer Science 2National Center for Integrative BiomedicalInformatics and 3Department of Human Genetics and Bioinformatics Program University of MichiganAnn Arbor MI 48109 USA
Received on August 22 2006 revised on November 7 2006 accepted on November 8 2006
Advance Access publication November 16 2006
Associate Editor Martin Bishop
ABSTRACT
MotivationWith the rapid increase in theavailability of biological graph
datasets there is a growing need for effective and efficient graphquery-
ing methods Due to the noisy and incomplete characteristics of these
datasets exact graphmatchingmethods have limited use and approxi-
mate graph matching methods are required Unfortunately existing
graph matching methods are too restrictive as they only allow exact
or near exact graphmatching This paper presents a novel approximate
graphmatching techniquecalledSAGAThis techniqueemploysa flexi-
ble model for computing graph similarity which allows for node gaps
node mismatches and graph structural differences SAGA employs an
indexing technique that allows it to efficiently evaluate queries even
against large graph datasets
ResultsSAGA has been used to query biological pathways and litera-
ture datasets which has revealed interesting similarities between
distinct pathways that cannot be found by existing methods These
matches associate seemingly unrelated biological processes connect
studies in different sub-areas of biomedical research and thus pose
hypotheses for new discoveries SAGA is also orders of magnitude
faster than existing methods
Availability SAGA can be accessed freely via the web at httpwww
eecsumichedusaga Binaries are also freely available at this website
Contact jignesheecsumichedu
Supplementary material Supplementary material is available at
httpwwweecsumicheduperiscopepublsaga-supplpdf
1 INTRODUCTION
Graphs provide a powerful primitive for modeling biological data
such as pathways and protein interaction networks Naturally the
biomedical community has created many graph databases For
example PathGuide (httpwwwpathguideorg) lists more than
200 pathway databases Many of these databases are large and
rapidly growing in size To fully exploit the wealth of information
in these graph databases effective and efficient graph querying tools
are critical
Previous graph querying tools have largely focused on relatively
simple graph operations such as retrieving matches based on the
node attributes or finding linear paths However in practice more
sophisticated approximate graph matching methods are often
needed Note that the emphasis here is on approximate matching
as biological graphs are often noisy and incomplete which makes
approximate matching much more useful than exact matching This
paper presents a tool called the Substructure Index-based Approxi-
mate Graph Alignment (SAGA) which addresses this need
More formally the problem that we address is approximate
subgraph matching Given a query graph and a database of graphs
we want to find subgraphs in the database that are similar to the
query allowing for node mismatches node gaps (node insertions or
deletions) as well as graph structural differences Node mismatches
model the behavior that two nodes representing different cellular
entities can exhibit similar functionality For example two different
proteins may be in the same protein orthologous group which
indicates similar functionality Node gaps represent the situation
where a certain node in one graph cannot be mapped to any node in
the other graph Graph structural differences allow for differences in
node connectivity relationships For example two nodes may be
directly connected in one graph whereas the corresponding match-
ing nodes in the other graphs may be indirectly related through one
or more additional nodes
As a motivating example for the approximate subgraph operation
consider the following scenario a scientist working on a certain
disease has constructed a small portion of a pathway based on
analysis of various experimental data This pathway fragment
which is modeled as a graph contains nodes that represent cellular
entities (proteins genes mRNA etc) and edges that represent
interactions The scientist is interested in finding the biological
processes that may be affected by the disease This task can be
expressed as a query that searches a database of known pathways
using the query graph Furthermore the search can identify similar
subcomponents shared between the query and graphs in the
database which may reveal clues about what information might
be missing or spurious in the query graph and provide a way of
generating additional hypotheses
While there is a long history of research on graph matching most
of this work has focused on exact subgraph matching ie the
subgraph isomorphism problem which is known to be NP-
complete GraphGrep (Shasha et al 2002) and GIndex (Yan
et al 2004) are index-based filtering methods for exact subgraphTo whom correspondence should be addressed
2006 The Author(s)This is an Open Access article distributed under the terms of the Creative Commons Attribution Non-Commercial License (httpcreativecommonsorglicensesby-nc20uk) which permits unrestricted non-commercial use distribution and reproduction in any medium provided the original work is properly cited
at University of W
aikato Library on July 10 2014
httpbioinformaticsoxfordjournalsorg
Dow
nloaded from
matching Grafil (Yan et al 2005) PIS (Yan et al 2006) and
Closure-Tree (He and Singh 2006) introduce some approximation
for subgraph isomorphism However these approximate models are
very limited None of these tools allow node gaps in their models
PathAligner (Chen and Hofestaedt 2004) is a tool for aligning
pathways However it assumes that all pathways are linear
paths The tools most closely related to our work are PathBlast
(Kelley et al 2004) and the successive NetworkBlast (Sharan
et al 2005) which are designed for aligning protein interaction
networks Their graph similarity model allows node mismatches
and node gaps but graph structural differences are largely confined
to short paths As shown in Section 35 our graph similarity model
tolerates more general structural differences and can find biologi-
cally relevant matches when both PathBlast and NetworkBlast fail
Another related method (Koyuturk et al 2005) has been proposed
for aligning protein interaction networks However the match tech-
nique used in this method largely focuses on capturing the penalty
associated with gene duplication Finally PathBlast NetworkBlast
and the method proposed in Koyuturk et al (2005) can only performone graph comparison at a time To match a query against a database
of graphs the matching algorithms must be run for each graph in the
database As a result these methods are not computationally
efficient when querying large graph databases
In this paper we present a novel approximate subgraph matching
technique called SAGA At the heart of SAGA is a flexible model
for computing graph similarity which permits node gaps node
mismatches and graph structural differences To speed up the
execution of queries with this powerful matching model we employ
an indexing method for efficient query evaluation Through experi-
mental evaluation we demonstrate that SAGA is more flexible and
powerful than existing models SAGA allows additional informa-
tion derived from the relationships between entities in pathways to
be incorporated into comparative analysis Our experimental results
show that SAGA finds expected associations like Insulin signaling
in Type 2 Diabetes Mellitus (T2DM) SAGA also finds less well
studied associations like the Toll-like receptor T-cell receptor
and Apoptosis pathways in Helicobacter pylori (H pylori) infection
as well as Calcium Wnt and Hedgehog signaling in Bipolar Dis-
order In addition SAGA provides a powerful tool for biomedical
text comparison
2 SYSTEM AND METHODS
21 Graph model
In our model a graph G is a 3-tuple G frac14 (VEf) V is the set of nodes and
E V middot V is the set of (directed or undirected) edges Nodes in the graphs
have labels specified by the mapping f V L where L is the set of node
labels This model captures the features that are commonly present in most
biological graph datasets in which nodes represent moleculescomplexes
labels denote moleculecomplex names and edges indicate relationships
between nodes We assume that each node in the graph has a unique ID
This ID is used to establish a total order among the nodes
In the example graph in Figure 1(a) vi is used to represent the unique nodeID and Lk is the node label Note that two different nodes in a graph can have
the same label
Our distance model and matching algorithm (discussed below) support
both directed and undirected graphs We present our method using
undirected graphs adaptations of the distance measure and the matching
algorithm for directed graphs are straightforward and omitted here
22 Distance measure for subgraph matching
Our model measures similarity by a distance value so graphs that are more
similar have a smaller distance Formally the subgraph matching is defined
as follows Let G1 frac14 (V1E1f1) and G2 frac14 (V2E2f2) be two graphs An
approximate matching from G1(the query) to G2(the target) is a bijection
mapping function lVV1 $ VV2 where VV1 j V1 and VV2 j V2
An example match is shown in Figure 1 The dashed lines indicate the
matched nodes in the two graphs Note that nodes can be mapped even if they
have different labels Also note that not all nodes are required to be mapped
eg v5 in G1 has no mapping in G2 and is a gap node
The subgraph distance (SGD) with respect to l is defined as
SGDlethG1sbquoG2THORN frac14 we middot StructDistl
thorn wn middot NodeMismatchesl
thorn wg middot NodeGapsl
eth1THORN
where
StructDistl frac14X
usbquo v2V1sbquoultv
j dG1ethusbquovTHORN dG2
ethlusbquolvTHORN j eth2THORN
NodeMismatchesl frac14X
u2V1
mismatchethf1ethuTHORNsbquof2ethluTHORNTHORN eth3THORN
NodeGapsl frac14X
u2V1V1
gapG1ethuTHORN eth4THORN
The distance model contains three components The StructDist compo-
nent measures the structural differences of the match the NodeMismatches
component is the penalty associated with matching two nodes with different
labels and the NodeGaps component is used to measure the penalty for the
gap nodes (Gap nodes are nodes in the query that cannot be mapped to any
nodes in the target graph) Each of these components is described in more
detail in subsections 221 through 223
In Equation (1) we wn and wg are the weights for each component in this
matching model and can be used to change the emphasis on the different
parts of the similarity model While Equation (1) computes the subgraph
distance for a specific matching l the actual subgraph distance from a query
to its target is the minimum distance over all possible matchings namely
SGDethG1sbquoG2THORN frac14 minl
SGDlethG1sbquoG2THORN eth5THORN
221 The StructDist component The StructDist component mea-
sures the structural differences for the matching node pairs in the two graphs
In Equation 2 the dGi(uv) function measures the lsquodistancersquo between node
u and node v in graph Gi and is defined as the length of the shortest path
between u and v The StructDist component compares the distance between
each pair of matched nodes in one graph to the distance between the
corresponding nodes in the other graph and accumulates the differences
222 The NodeMismatches component The NodeMismatches com-
ponent in Equation (3) is the sum of the penalties (quantified by themismatchfunction) associated with matching nodes with different labels
A common and biologically intuitive mismatch penalty model is to
implicitly group node labels based on similarity allowing for a node
Fig 1 (a) An example graph (b) An example subgraph match
SAGA a subgraph matching tool
233
at University of W
aikato Library on July 10 2014
httpbioinformaticsoxfordjournalsorg
Dow
nloaded from
label to be associated with more than one group Nodes can then be
compared based on the group labels This model of node comparison is
quite general and practical for many biological applications For example
the functional similarity between two enzymes can be determined based on
the length of the common prefix of the corresponding Enzyme Commission
(EC) numbers For general proteins one can use databases like KEGG
(Kanehisa et al 2006) and COG (Tatusov et al 1997) which organize
proteins into orthologous groups and consider two proteins to be function-
ally similar only if they are in the same group This mismatch model can also
be generalized to other settings such as comparing nodes belonging to
different classes based on the positions of the two classes in a classification
hierarchy such as Gene Ontology (httpwwwgeneontologyorg)
Weutilize the concept of orthologous groups for our nodemismatchmodel
Themapping from a node label to a set of orthologous groups allowing a node
to belong to more than one orthologous group is defined as r L P(GL)
where L is the set of node labels GL is the set of group labels and
P(GL) is the power set of GL Under this model mismatch(Li Lj) frac14 1if r(Li) r (Lj) frac14 and mismatch(Li Lj) lt 1 otherwise
223 The NodeGaps component The NodeGaps component in
Equation (4) measures the penalties associated with the gap nodes in the
query graph thereby favoring matches that have fewer gap nodes In our
model different nodes in the query graph can have different penalty values
and nodes with the same label can have different penalties as well
The model also gives users the freedom to choose between gapped
matches (matches that allow gap nodes) and ungapped matches If
gapG(u) is set to 1 for every node then the model only supports ungapped
matches otherwise it allows gapped matches
For simplicity for the rest of the discussion we will assume that all nodes
have the same gap penalty value denoted as SingleGapCost
224 Characteristics of the subgraph distance model Our sub-
graph matching model is very flexible and allows for incorporation of
domain knowledge into the scoring criteria The only restriction is
that the gap penalty must be positive and the mismatch penalty must be
non-negative These restrictions ensure that the subgraph distance is a non-
negative value With these restrictions if the query graph is subgraph-
isomorphic to the target graph the subgraph distance is 0 and vice versa
23 The index-based matching algorithm
A naıve technique for evaluating subgraph matching queries is to compare
the query with every graph in the database and report the matches which
is prohibitively expensive We propose a novel index-based heuristic
algorithm that allows for a much faster evaluation of the approximate
subgraph matching operation
First an index is built on small substructures of graphs in the database
This index is then used to match fragments of the query with fragments in the
database Finally the matching fragments are assembled into larger matches
The actual method is described in detail below
231 The index structures The index on small substructures of
graphs in the database is called the FragmentIndex It is probed by the
matching algorithm to produce hits for substructures in the query
The indexing unit is a set of k nodes from the graphs in the database We
call each such set a fragment Here k is a user specified parameter and is
usually a small number like 2 3 or 4 However simply enumerating all
possible k-node sets is expensive in terms of both time and space At
the same time if any pair of nodes in a fragment is too far apart by the
pairwise distance measure (refer to Section 221) this fragment does not
correspond to a meaningful substructure thus is not worth indexing
Therefore a parameter dmax is specified to control whether a fragment is
to be indexed For a given k-node set v1v2 vk if any two nodes vi and vjsatisfy d(vi vj) dmax we connect the two nodes by a pseudo edge Then we
index this fragment only if the k nodes form a connected graph by the pseudo
edges Using this heuristic we can dramatically reduce the size of the
FragmentIndex
Note that in contrast to existing methods which index connected
subgraphs the fragments in SAGA do not always correspond to connected
subgraphs The reason for using the more general definition of fragments is
to allow node gaps in the match model For example in Figure 1(b) nodes
3 and 4 in G1 can be matched to nodes 3 and 4 in G2 respectively
Although 3 and 4 do not form a connected subgraph inG2 they correspond
to a fragment that needs to be indexed so that this match can be detected
An entry in the FragmentIndex has the following format nodeSeq
groupSeq distSeq sumDist gid where nodeSeq is the sequence of
node IDs for the nodes in the fragment groupSeq is the sequence of
group labels associated with the nodes distSeq is the sequence of pairwise
distances between the nodes in the fragment sumDist is the sum of these
pairwise distances and gid is a unique graph ID Recall that a node label can
be associated with multiple group labels In this case we generate all
possible group label sequences for a fragment and index each one An
example showing the FragmentIndex on a sample database is presented
in Section 1 of the supplemental material
To efficiently evaluate the subgraph distance between a query graph and
a database graph an additional index called DistanceIndex is also main-
tained This index is used to look up the precomputed distance between any
pair of nodes in a graph (Section 221)
232 The matching algorithm The matching algorithm proceeds
as follows First the query is broken into small fragments and the
FragmentIndex is probed Then the hits from the index probes are combined
to produce larger candidate matches Finally each candidate is examined to
produce the actual results Each of these three steps is described in detail
below
Step 1 finding small hits In this step the query is broken into small
fragments and the FragmentIndex is probed to find database fragments that
are similar to the query fragments
Given the query fragments (k-node sets) are enumerated in the same way
as we did for the database graphs Next for each query fragment the
groupSeq nodeSeq sumDist and distSeq values are computed Then the
FragmentIndex is probed with each of these query fragments
The actual index probe uses the following multi-level filtering strategy
First the groupSeq and sumDist values are used to filter out fragments that
cannot match Next additional false positives are removed using the distSeq
values
In the first level of filtering database fragments are fetched only if they
have the same groupSeq as the query fragment and their sumDist values are
within the safe bounds that we have developed Formally the probe criteria is
ft j t 2 FragmentIndexsbquo tgroupSeq frac14 f qgroupSeqsbquo f qsumDist kethk 1THORN2
middotMaxPairDist
we tsumDist f qsumDist + kethk 1THORN
2middot MaxPairDist
wegsbquo where fq is the
query fragment and k is the fragment size MaxPairDist is a user-defined
parameter which restricts the weighted pairwise distance difference between
the query and the database fragments as we middot j dG1ethusbquovTHORN dG2
ethlusbquolvTHORN j MaxPairDist (See Section 2 of the supplemental material for details)
After the first level of filtering we get a list of candidate database frag-
ments for every query fragment This list can be further refined by using the
distSeq information (which contains the pairwise distances) to check that all
pairwise distances satisfy the MaxPairDist criterion defined above
Step 2 assembling small hits Step 1 produces a set of small fragment
hits These smaller hits are assembled into bigger matches as follows First
the hits are grouped by the database graph IDs Then a hit-compatible graph
is built for each matching graph Each node in a hit-compatible graph
corresponds to a pair of matching query and database fragments An
edge is drawn between two nodes in the hit-compatible graph if and only
if two query fragments share 0 or more nodes and the corresponding data-
base fragments in the hit-compatible graph also share the same correspond-
ing nodes An edge between two nodes tells us that the corresponding two
YTian et al
234
at University of W
aikato Library on July 10 2014
httpbioinformaticsoxfordjournalsorg
Dow
nloaded from
hits can be merged to form a larger match since they have no conflicts in the
union Therefore a clique in the hit-compatible graph represents a set of hits
that can be merged without any conflicts
After forming the hit-compatible graph the hits assembling problem
reduces to the maximal clique detection problem which can be solved
using existing efficient implementations such as (Born and Kerbosch
1973) or approximate methods such as (Hochbaum 1997) The set of
hits in each maximal clique is a candidate match A detailed example of
this second step for a sample query is illustrated in Section 1 of the
supplemental material
Step 3 examining candidates This step examines each candidate
match and produces a set of real matches Here we allow users to specify
a threshold Pg to control the percentage of gap nodes in the subgraph match
With a given Pg value the desired matches are those with at most Pg
percentage of gap nodes in the query
For each candidate match obtained from Step 2 we first check whether the
percentage of the gap nodes exceeds the threshold Pg If so we ignore the
candidate Otherwise we probe the DistanceIndex and calculate the real
subgraph matching distance as defined in Section 22 Recall that the
required subgraph matching is the one that minimizes the matching distance
(cf Equation 5) We also further examine the submatches of the candidate
A submatch can be obtained by removing one or more node mappings from
the original match This introduces more gap nodes to the query and thus
increases the subgraph distance by additional gap penalties However at the
same time the StructDist and NodeMismatches may be reduced according to
its definition in Equations (2) and (3) Therefore if the decreased amount
exceeds the increased amount the overall matching distance will be lower
than the original one which also means that a better match is found for the
query If twomatches have the samematching distance and one is a submatch
of the other only the supermatch is considered
24 Fragment size parameter
The fragment size parameter (k in Section 231) controls the size of
fragments in the FragmentIndex This parameter affects the size of the
index query performance and sensitivity of search results A larger fragment
size results in a larger FragmentIndex which increases the index probe cost
However a large fragment size may also results in fewer false positives in
the hit detection phase (and lower query sensitivity) which reduces the cost
of the remaining steps A practical way of picking a fragment size is based on
the selectivity of the queries If queries are expected to have manymatches in
the database then a smaller fragment size is preferred as it may not introduce
many false positives and also potentially lead to smaller sizes of hit-
compatible graphs However when queries tend to have very few matches
a large fragment size may be favored to prune false positives in the early
stages of the matching algorithm
25 Statistical significance of matching results
The Monte Carlo simulation approach is employed to assess the statistical
significance of the matches A P-value is computed for each match based on
the frequency of obtaining such a match or a better match when applying
SAGA with randomized data Random graphs are generated by random
shuffling of edges of the graphs preserving the node degrees and random-
izing the orthologous groups of each node preserving the number of ortholo-
gous groups that each node belongs to For a given query in addition to
querying the real database we run SAGA on a large number of random
graphs and estimate the P-value of a match from the real database as the
fraction of matches from the random graphs with the same or a larger size
(in number of nodes) and the same or a smaller distance value
3 IMPLEMENTATION AND RESULTS
In this section we describe the implementation of SAGA and
present results demonstrating its effectiveness and efficiency
The well-known KEGG pathway database (Kanehisa et al
2006) is used for the experiments In addition we use a dataset
called bioNLP which contains parsed PubMed documents repre-
sented as graphs In these graphs nodes represent genes and edges
denote that two genes were discussed in the same sentence some-
where in the document With bioNLP graph similarity can be used
to identify related documents
31 Implementation
We have implemented SAGA using C++ on top of PostgreSQL
(httpwwwpostgresqlorg) For detecting maximal cliques we
use the version 2 algorithm described in (Born and Kerbosch
1973) The DistanceIndex and FragmentIndex are implemented
as clustered B+-tree indices The fragment size was set to three
The execution times reported correspond to the running time of the
C++ program (which includes reading the query specifications and
issuing SQL queries to the DBMS to fetch index entries and related
database tuples) All experiments were run on a 28 GHz Pentium 4
Fedora 2 machine equipped with a 250 GB SATA disk We used
PostgreSQL version 813 and set the buffer pool size to 512 MB
For all the experiments with KEGG the values for the SAGA
parameters are we frac14 wg frac14 wn frac14 1 SingleGapCost frac14 3 dmax frac143 and MaxPairDist frac14 3 The Pg value is set for every query so that
each match contains at least four node mappings For the node
mismatch penalty we use a simple model if two nodes belong
to the same KEGG orthologous group or they have the same EC
number then the mismatch penalty is 0 and 1 otherwise For the
significance test we generate 100 random graphs for each graph in
the database so there are totally n middot 100 random graphs if n is the
number of graphs in the database We only retain matches with
001 significance level or better When a query graph is also
included in the database we always exclude the self-match
(the query graph matching itself) from the results For the experi-
ment with the bioNLP dataset the SAGA parameter settings are
wefrac14wgfrac14wnfrac141SingleGapCostfrac1405dmaxfrac143andMaxPairDistfrac143 For the node mismatch model nodes with the same label have
0 penalty otherwise the mismatch penalty is 1
32 Finding conserved components across pathways
Two experiments are used to investigate components that are shared
across different pathways
321 Querying disease-associated pathways This experiment is
an exploratory analysis to find biological processes that are involved
in or are affected by a particular disease We use all 162 KEGG
human pathways (downloaded on July 4 2006) as the database and
chose the 10 disease-associated human pathways as queries This
query set is a subset of the 162 human pathways and it includes three
metabolic disorder pathways six neuro-degenerative disorder path-
ways and one infectious disease pathway Of these pathways only
two query pathways produced significant hits (P-value 001) the
T2DM pathway (hsa04930) and the lsquoEpithelial cell signaling in
H pylori infectionrsquo pathway (hsa05120) Results for these two
pathways are presented in Table 1 The full list of the database
and query pathways can be found in the supplemental material
Table 1 shows both the P-values and the number of PubMed
references for the matches as a measure of how well the disease as-
sociation has been studied in previous literature We are particularly
interested in disease-associated pathwaymatches that are significant
but are not yet well studied
SAGA a subgraph matching tool
235
at University of W
aikato Library on July 10 2014
httpbioinformaticsoxfordjournalsorg
Dow
nloaded from
As can be seen in Table 1 SAGA finds that the T2DM pathway
(hsa04930) is significantly associated with both Insulin signaling
(hsa04910) and Adipocytokine signaling (hsa04920) In the case of
Insulin signaling we find a match of eight nodes of Insulin signaling
in the T2DM pathway The number of PubMed references for
lsquoType II diabetes mellitus AND Insulinrsquo is 21 326 consistent
with the well-studied nature of Insulin signaling in T2DM This
result demonstrates that SAGA finds pathway matches that would
be expected by researchers experienced in disease-related pathways
research In the case of Adipocytokine signaling in T2DM we find
a match of five nodes and the number of references is 37 in agree-
ment with the less well-studied nature of Adipocytokine signaling
in T2DM
The H pylori pathway (hsa05120) demonstrated significant
matches to the Toll-like receptor T-cell receptor and Apoptosis
pathways The association between H pylori infection and Apop-
tosis is relatively well studied (130 PubMed references) while the
association with Toll-like receptor signaling is less well studied
(12 references) and the association with T-cell receptor signaling
shows only two references This result suggests that T-cell receptor
signaling is potentially a significant but relatively unstudied avenue
for research into the etiology of H pylori infection
322 Querying signal transduction pathways In this experi-
ment we use the same database of pathways as in section 321
(162 KEGG human pathways) but we choose all the 12 signal
transduction pathways (KEGG IDs hsa04010 hsa04020
hsa04070 hsa04150 hsa04310 hsa04330 hsa04340 hsa04350
hsa04370 hsa04630 hsa04910 and hsa04920) as the query set to
demonstrate additional benefits to be derived from identifying path-
ways matches Many of the matches are intuitive for researchers
familiar with specific cellular tissue or disease phenomena (as
expected) However pairs of pathways between which the similari-
ties are not intuitive can be useful in both pathway annotation and
disease association research In the following discussion we present
two examples of such matches
In the first example Figure 2 shows components that are shared
by the Hedgehog (hsa04340) and Wnt (hsa04310) signaling
pathways (P-value 0005) Note that nodes are matched based on
functionality For example Slimb is matched with B-TrCp as both
are SCF complex F-box proteins (KEGG Orthology KOK03362)
While SAGA can find this orthologous match the difference in
terminology seen in the KEGG pathways database might make
it difficult for many researchers to find the match These similarities
between Hedgehog and Wnt signaling are consistent with http
wwwstanfordedurnussepathwaysWntHHhtml as well as
Kalderon (2002) and Nusse (2003)
In the second example the Wnt and Calcium signaling pathways
share four enzymes (Fig 3 P-value 0007) However the Calciumsignaling pathway has two additional components (CALM and
IP3R) that arguably belong to the Wnt pathway By identifying
the common components we can provide information to improve
the annotation of the Wnt pathway
Based on the significant similarities between the WntHedgehog
andWntCalcium pathways we hypothesize that the three pathways
(Wnt Calcium and Hedgehog signaling) could share disease asso-
ciations Calcium signaling has been investigated in relation to
Bipolar Disorder (BD) for more than 40 years (Coppen 1967)
After examining the WntCalcium and WntHedgehog matches
we conducted a literature search and found 335 PubMed references
investigating Calcium signaling in BD as well as 15 PubMed ref-
erences for Wnt signaling in BD consistent with our hypothesis
However when looking for BD association with Hedgehog signal-
ing we found zero PubMed reference which suggests that the
Hedgehog signaling pathway has been largely overlooked in BD
research although it uses BD-associated components This result
poses new hypotheses for exploring the relationship between BD
and Hedgehog signaling and shows how SAGA can be useful in
disease research
33 Reactome pathways vs KEGG pathways
SAGA can also be used to compare pathways in different databases
(eg as a precursor to integrating data from different pathway
databases) In this experiment we compare two well-known path-
way databases Reactome (Joshi-Tope et al 2005) and KEGG
We use the same 162 KEGG human pathways as the database
The queries are the eight newly updated pathways in Reactome
version 17 The query set includes TGF-b (Reactome ID
170834) RIG-I (168928) Toll-like receptors 3 (168164) and
4 (166016) the conjugation phase of xenobiotic metabolism
(156580) aspects of the metabolism of lipoproteins (174824)
cell cycle regulation by the anaphase-promoting complex (APC)
(174143) and ATR activation in response to replication stress
(176187)
Table 1 Significant matches for the T2DM and H pylori disease associated
KEGG pathways
Query Match No of nodes
matched
P-value Refs
T2DM
(hsa04930)
Insulin (hsa04910) 8 00009 21 326
Adipocytokine
(hsa04920)
5 00009 37
Hpylori(hsa05120)
Toll-like receptor
(hsa04620)
7 0001 12
T-cell receptor
(hsa04660)
4 0001 2
Apoptosis (hsa04210) 4 0006 130
The number of PubMed references is simply produced by querying PubMed with the
keywords in the pathway names
GSK-3β GSK-3β
β-catenin
β-TrCP
Fig 2 Hedgehog pathway matched the Wnt pathway
YTian et al
236
at University of W
aikato Library on July 10 2014
httpbioinformaticsoxfordjournalsorg
Dow
nloaded from
Naturally the TGF-b pathway (with 23 nodes and 25 edges) in
Reactome matches the TGF-b (hsa04350) pathway (with 65 nodes
and 45 edges) in KEGG However pathways in the two databases
are not perfectly matched (graph distance gt0) Each of the pathwayscontains some details missing in the other Also as shown in
Figure 4 there are some differences even in the shared similar
components between the two pathways By identifying the similar
subcomponents using SAGA researchers can combine the two
databases and produce more complete data
The two databases also organize pathways in different ways
Reactome represents pathways in a hierarchy (ie a pathway
consists of several subpathways and subpathways again can be
made of subpathways) On the contrary KEGG stores pathways
in a flat fashion As examples of the organizational difference
the Toll-like receptors 3 and 4 pathways in Reactome match the
Toll-like receptor (hsa04620) pathways in KEGG and both cell
cycle regulation by the Anaphase-promoting complex (APC) and
ATR activation in response to replication stress pathways in Reac-
tome hit the cell cycle pathway in KEGG Thus SAGA can be used
for graph data integration even if databases organize the same
information in different ways
34 SAGA for querying parsed literature graphs
This experiment examines how SAGA can be applied within an
information retrieval setting While traditional IR methods employ
term-based comparisons and the cosine similarity measure (Salton
and McGill 1983) for comparing documents we look at the docu-
ment comparison problem specifically in the biomedical domain
and address it using a graph matching method Each PubMed docu-
ment is represented by a graph in which a node indicates a gene
studied in that document A link is drawn between two genes if they
are discussed in the same sentence (indicating there is potentially
association between the two genes) The graph presentation sum-
marizes the genes and gene associations derived from a document
By querying the graph representation of a document against those of
other documents documents that address the same topics as the
query document can be identified even if they are published in
different areas of research For example we queried the publication
(Tourigny et al 2002) (five nodes and six edges) against 48 444
PubMed documents using the cut-off value Pg frac14 50 (This dataset
has an average of 50 nodes and 188 edges per graph and the
list of documents in this set can be accessed at http
enigmaeecsumichedudoctxt) Among the 11 matches found by
SAGA the top hit is (Luedde et al 2003) which does not have
a citation to (Toruigny et al 2002) The shared components
between the two graphs are three genes CDK inhibitor
p18(INK4c) 0610007C21Rik and Stmn1 as well as their three
pairwise associations The query publication (Toruigny et al2002) explored p18(INK4c) in the generation of functional plasma
cells while (Luedde et al 2003) investigated the role of this gene inthe regenerating liver Thus SAGA can be used to connect related
studies even in different sub-areas of biomedical research
35 Comparison with existing tools
GraphGrep (Shasha et al 2002) and Gindex (Yan et al 2004) aredesigned to match one graph against a collection of graphs How-
ever they only support exact subgraph isomorphism Given the
noisy and incomplete characteristics of biological graphs exact
matching cannot help much in our target applications Grafil
(Yan et al 2005) PIS (Yan et al 2006) and Closure-Tree (He
and Singh 2006) disallow gap nodes in their match models which
prohibits them from getting results that SAGA can find For exam-
ple none of the 12 signal transduction pathways queries produce
any matches (excluding self-matches) in the KEGG human pathway
database using these three tools
As discussed in Section 1 NetworkBlast is a tool for aligning
large protein interaction networks On the other hand SAGA is
designed for matching relatively small graph queries (sparse graphs
with less than 100 nodes) against a large set of (large or small)
graphs Although NetworkBlast and SAGA have different charac-
teristics it is interesting to consider applying NetworkBlast to path-
way matching To query the set of pathways in KEGG (cf Section
322) we have to run NetworkBlast once for each pathway in the
database In other words for the experiment in Section 322 for
each query we need to invoke 162 calls to NetworkBlast For the
Wnt signaling pathway (hsa04310) with 73 nodes and 92 edges the
162 runs of NetworkBlast takes more than 20 hours while SAGA
only takes about 8 minutes Besides the more than two orders of
magnitude speedup SAGA produces results with higher quality
First SAGAnevermisses anymatching pathways thatNetworkBlast
PLCβ
Fig 3 Wnt pathway matched the Calcium pathway
Fig 4 The shared components between KEGG and Reactome TGF-b
pathway
SAGA a subgraph matching tool
237
at University of W
aikato Library on July 10 2014
httpbioinformaticsoxfordjournalsorg
Dow
nloaded from
can find Second SAGA can find matches that NetworkBlast
cannot find The reason is that graph structural differences in
NetworkBlast are largely confined to short paths while SAGA
tolerates more general structure differences For example neither
of the two matches shown in Figures 2 and 3 can be found by
NetworkBlast
36 Efficiency evaluation
This experiment evaluates the efficiency of SAGA To measure the
raw performance we only measure the time it takes for SAGA to
produce matches and do not include the time for generating the
P-value statistics
We choose as queries the 10 disease associated KEGG pathways
(mirroring the experiment in Section 321) To vary the database
sizes we add pathways for other species to the database The details
of the databases are described in Table 2
The query execution times for the 10 queries with increasing
database sizes are shown in Table 3 Even for the largest database
the query execution times using SAGA are less than 1 second
Besides the database sizes the query execution times also depend
on the number of nodes and edges in the query the actual query
graph structure and the number of hits in the database Almost all
the 10 human disease pathways have matches in the human mouse
and rat pathways but no matches exist for them in the worm and
yeast pathways This explains why the execution times for the
queries on the databases d4 and d5 are similar to the execution
times against the database d3 For the databases d1 through d3
even though the database sizes roughly doubles at each step the
query execution times grow at a slower rate since the index match-
ing components grow at at rate that is slower than the database
growth rate
Another observation is that a larger query does not necessarily
result in a larger execution time For example hsa05040 is a single
connected graph with more matches in the databases than hsa04950
which is a graph with several connected components The execution
times with hsa05040 are more than hsa04950 although hsa04950
has more nodes and edges than hsa05040
4 DISCUSSION
This paper discusses SAGA a powerful method for approximate
subgraph matching SAGA employs a match model that can be used
to accurately incorporate domain knowledge for capturing the
domain-specific notion of graph similarity An index-based algo-
rithm makes approximate subgraph matching queries very efficient
Our evaluations using a number of actual biomedical applications
show that SAGA can produce biologically relevant matches on
actual examples whereas existing tools fail In addition we have
demonstrated the efficiency of the SAGA approach
SAGA is very effective and efficient for querying relatively small
graphs (ideally sparse graphs with less than 100 nodes) against very
large databases and there are many compelling applications in this
setting (cf Section 3) However we do not recommend using the
existing tool when the query graph is very dense andor has a large
number of nodes For such large query graphs the performance of
the existing SAGA method degrades since potentially a large num-
ber of small hits can be produced by Step 1 of the matching algo-
rithm (cf Section 232) Assembling these hits is computationally
expensive with the existing SAGA algorithm To improve the
performance of SAGA for large query graphs one can leverage
the observation that biological graphs have very strong modular
structures (Tornow and Mewes 2003) In other words these graphs
can be naturally divided into groups with dense intra-group
connections and very sparse inter-group connections As part of
future work we plan on making use of the modular property and
employ a divide-and-conquer strategy to handle large queries More
specifically we can divide the queries into several sub-queries (the
union of the sub-queries should cover the original query) then use
SAGA to match each sub-query Finally we can assemble the
results for the sub-queries to produce the final matches
In the current version of SAGA the Monte Carlo simulation
approach is employed to evaluate the statistical significance of
the matching results As the simulation is applied to a large number
of random graphs the cost of computing this statistical significance
can be much higher than the query execution cost itself However
due to the efficiency of the SAGA indexing and matching mecha-
nism in many cases the significance test can still be computed
quickly For example we generated 654 middot 100 frac14 65 400 random
graphs for our largest database d5 The P-value evaluation for the
10 disease associated queries on these random graphs ranges from
1 millisecond for query hsa04940 to 19 seconds for query hsa04930
However as the number of random graphs used for significance test
increases the overhead will become more significant In the future
we plan on developing efficient analytical methods for assessing
significance of the SAGA matching results
Table 3 Execution time (in milliseconds) for the 10 disease-associated
pathways in KEGG when querying the databases listed in Table 2
Query No of
nodes
No of
edges
d1 d2 d3 d4 d5
hsa05050 8 10 256 286 371 373 374
hsa05060 11 15 454 536 620 621 621
hsa05020 19 10 268 369 537 537 537
hsa04940 22 2 02 02 02 02 02
hsa05010 23 17 452 580 619 621 621
hsa05030 24 13 423 424 529 529 531
hsa05040 24 28 3472 4313 4574 4591 4624
hsa04930 33 36 2436 4117 5406 5414 5462
hsa04950 34 33 296 296 296 297 297
hsa05120 57 26 1165 1606 1828 1831 1837
Table 2 Characteristics of various databases used for the scalability
experiment
Dataset Pathways No of
graphs
Avg no
of nodes
Avg no
of edges
FragmentIndexSize
(no of entries)
d1 human 162 860 353 138 middot 107
d2 d1 + mouse 320 863 348 294 middot 107
d3 d2 + rat 470 866 317 407 middot 107
d4 d3 + worm 567 890 285 534 middot 107
d5 d4 + yeast 654 913 273 608 middot 107
This table shows the number of graphs in each database the average number of nodes and
edges per graph in the databases and the number of entries in the FragmentIndex
YTian et al
238
at University of W
aikato Library on July 10 2014
httpbioinformaticsoxfordjournalsorg
Dow
nloaded from
ACKNOWLEDGEMENTS
The authors thankYou Jung Kim for providing valuable feedback on
this work This research was primarily supported by the National
Institutes of Health under grant 1-U54-DA021519-01A1 by the
National Science Foundation under grant DBI-0543272 and by
an unrestricted research gift from Microsoft Corp Additional
funding was provided by grant GR687 from the Michigan
Economic Development Corporation and grant R01-LM008106
from the National Library of Medicine Funding to pay the Open
Access publication charges for this article was provided by the
National Institutes of Health under grant 1-U54-DA021519-01A1
Conflict of Interest none declared
REFERENCES
BronC and KerboschJ (1973) Algorithm 457 finding all cliques of an undirected
graph CACM 16 575ndash577
CoppenA (1967) The biochemistry of affective disorders Br J Psychiatr 113
1237ndash1264
ChenM and HofestaedtR (2004) PathAligner metabolic pathway retrieval and align-
ment Appl Bioinformatics 3 241ndash252
HeH and SinghAK (2006) Closure-tree an index structure for graph queries In
Proceedings ICDE 2006 pp 38ndash49
HochbaumDS (1997) Approximation Algorithms for NP-Hard Problems PWS
Publishing Co Boston MA USA
Joshi-TopeG et al (2005) Reactome a knowledgebase of biological pathways
Nucleic Acids Res 33 D428ndashD432
KalderonD (2002) Similarities between the hedgehog and wnt signaling pathways
Trends Cell Biol 12 523ndash531
KanehisaM et al (2006) From genomics to chemical genomics new developments in
KEGG Nucleic Acids Res 34 D354ndashD357
KelleyBP et al (2004) Pathblast a tool for alignment of protein interaction networks
Nucleic Acids Res 32 W83ndashW88
KoyuturkM et al (2005) Pairwise local alignment of protein interaction
networks guided by models of evolution In Proceedings of RECOMB 2005
48ndash65
LueddeT et al (2003) p18(INK4c) collaborates with other CDK-inhibitory proteins in
the regenerating liver Hepatology 37 833ndash841
NusseR (2003) Wnts and hedgehogs lipid-modified proteins and similarities in sig-
naling mechanisms at the cell surface Development 130 5297ndash5305
SaltonG and McGillM (1983) Introduction to Modern Information Retrieval
McGraw-Hill New York
SharanR et al (2005) Conserved patterns of protein interaction in multiple species
Proc Natl Acad Sci USA 102 1974ndash1979
ShashaD et al (2002) Algorithmics and applications of tree and graph searching In
Proceedings of PODS 2002 pp 39ndash52
TatusovRL et al (1997) A genomic perspective on protein families Science 278
631ndash637
TornowS and MewesHW (2003) Functional modules by relating protein interaction
networks and gene expression Nucleic Acids Res 31 6283ndash6289
TourignyM et al (2002) CDK inhibitor p18INK4c is required for the generation of
functional plasma cells Immunity 17 179ndash189
YanX et al (2004) Graph indexing a frequent structure-based approach In Proceed-
ings of SIGMOD 2004 pp 335ndash346
YanX et al (2005) Substructure similarity search in graph databases In Proceedings
of SIGMOD 2005 pp 766ndash777
YanX et al (2006) Searching substructures with superimposed distance In Proceed-
ings of ICDE 2006 pp 88ndash99
SAGA a subgraph matching tool
239
at University of W
aikato Library on July 10 2014
httpbioinformaticsoxfordjournalsorg
Dow
nloaded from
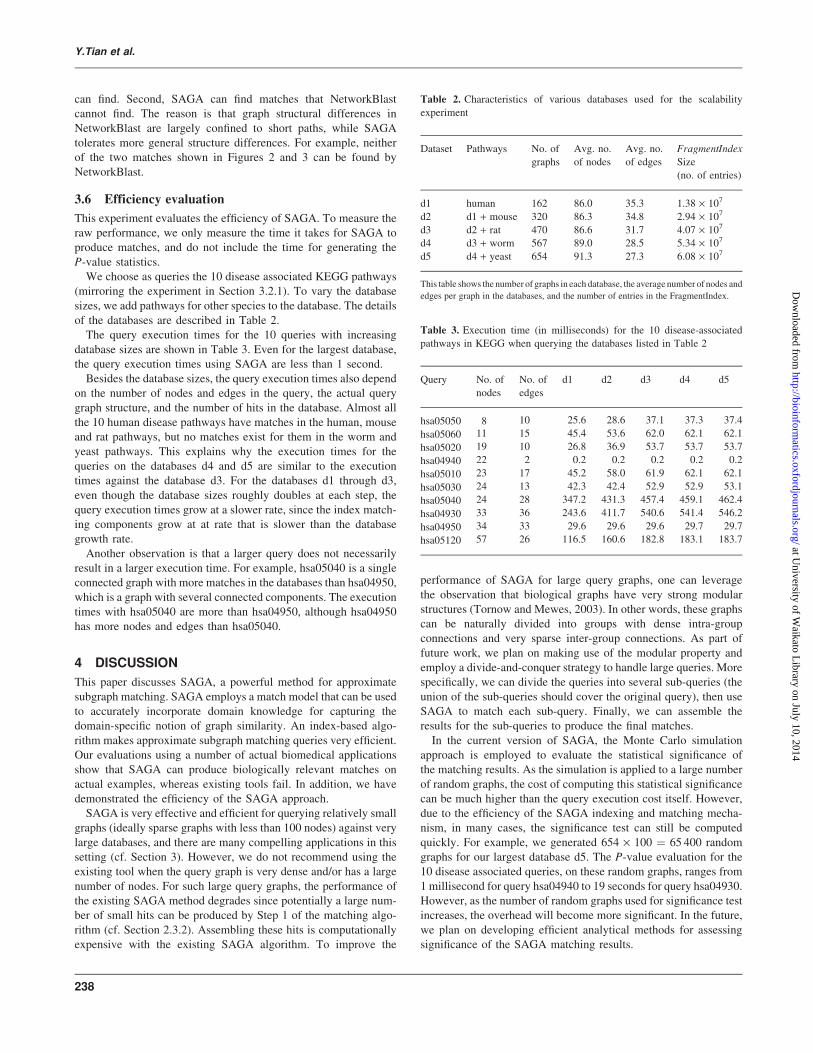


![VISAGE: Interactive Visual Graph Querying · process is formally called graph querying (or subgraph matching) [29, 28]. Many graph databases now support pattern matching and over-come](https://img.dokumen.tips/doc/110x75/5f8b4d897b929c29e26a8e16/visage-interactive-visual-graph-querying-process-is-formally-called-graph-querying.jpg)