Embed Size (px)
Citation preview

1
Summary of IHRA Pedestrian Safety WG Activities
Yoshiyuki MIZUNOOn behalf of IHRA Pedestrian Safety
WG

2
Contents• 1.Assignments task to PS/WG• 2.IHRA PS/WG Members• 3.IHRA PS/WG Meetings• 4.Basic Decisions• 5.IHRA Pedestrian Accidents Data-set• 6.Study on Passenger Car Front Shape• 7.Test Procedures• 8.Future Tasks
3
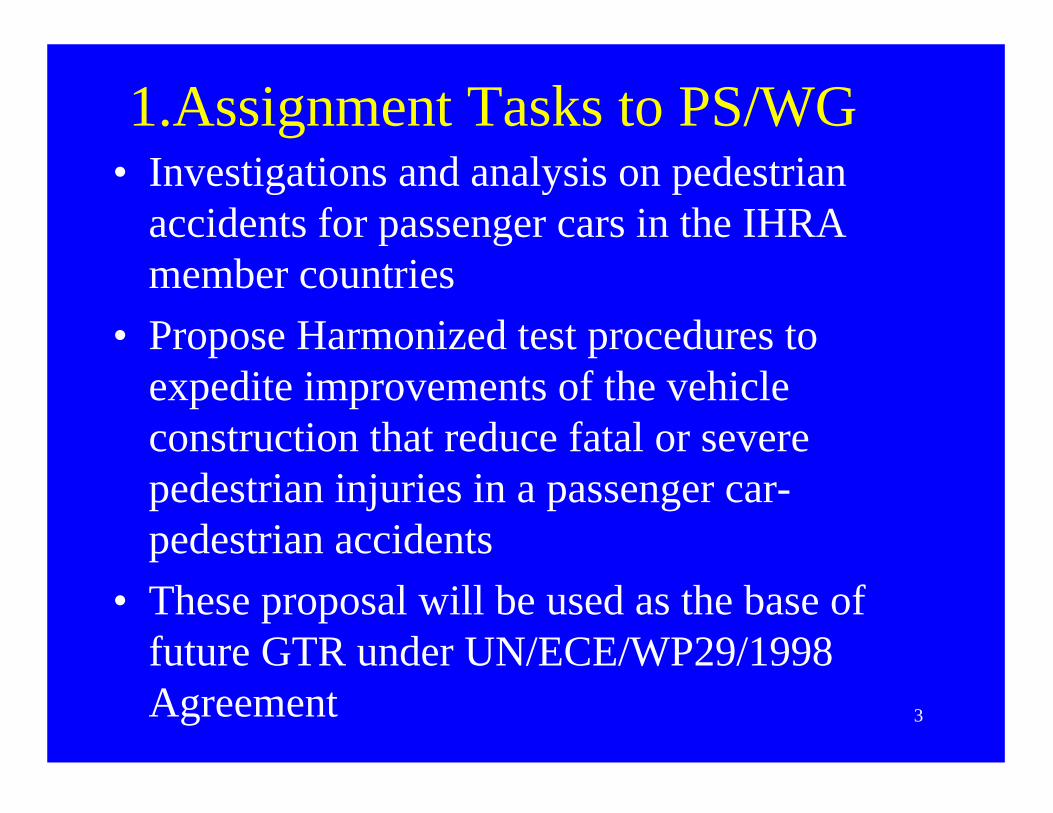
1.Assignment Tasks to PS/WG• Investigations and analysis on pedestrian
accidents for passenger cars in the IHRA member countries
• Propose Harmonized test procedures to expedite improvements of the vehicle construction that reduce fatal or severe pedestrian injuries in a passenger car-pedestrian accidents
• These proposal will be used as the base of future GTR under UN/ECE/WP29/1998 Agreement
4
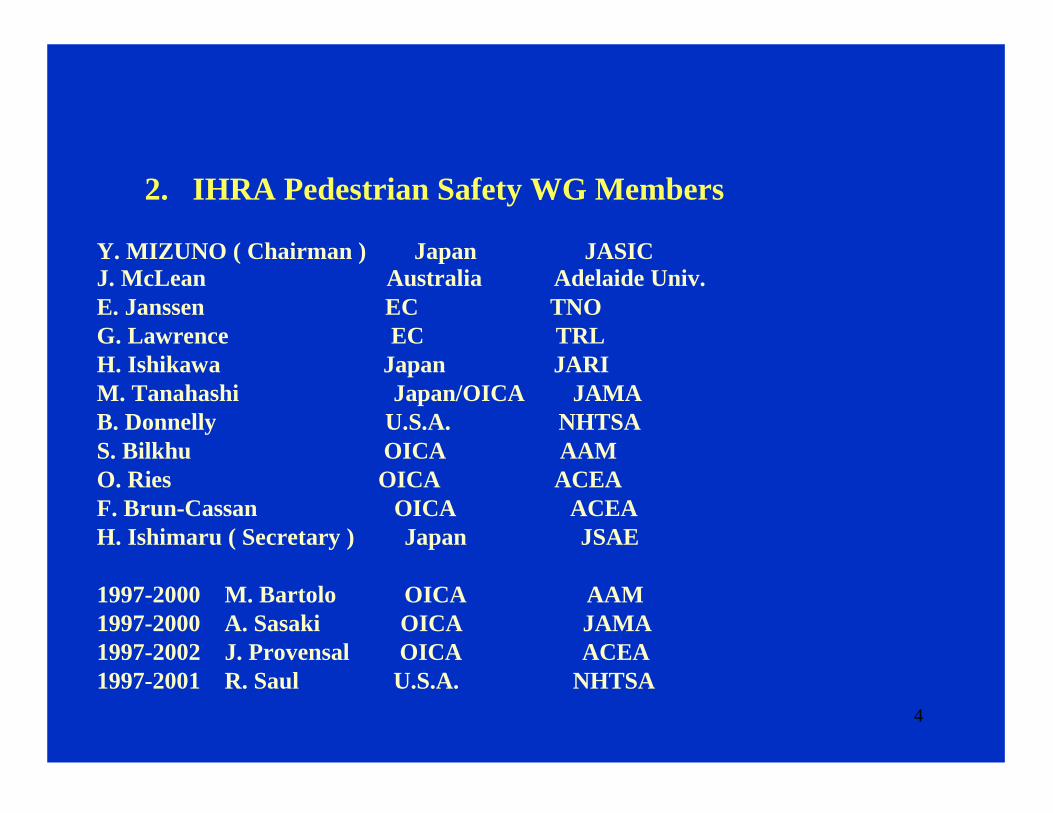
2. IHRA Pedestrian Safety WG Members
Y. MIZUNO ( Chairman ) Japan JASICJ. McLean ��� Australia Adelaide Univ.E. Janssen ��� EC TNOG. Lawrence ��� EC TRLH. Ishikawa ��� Japan JARIM. Tanahashi �� Japan/OICA JAMAB. Donnelly ���U.S.A. NHTSAS. Bilkhu ��� OICA AAMO. Ries ���� OICA ACEAF. Brun-Cassan �� OICA ACEAH. Ishimaru ( Secretary ) �Japan JSAE
1997-2000 M. Bartolo � OICA AAM1997-2000 A. Sasaki � OICA JAMA1997-2002 J. Provensal � OICA ACEA1997-2001 R. Saul ��U.S.A. NHTSA
5
3. IHRA PS/WG Experts Meeting
1st PS/WG Experts Meeting July, 1997 Tokyo,Japan2nd PS/WG March, 1998 Washington D.C.,U.S.A3rd PS/WG September, 1998 Brussels,EC4th PS/WG February 1999 Adelaide,Australia5th PS/WG September 1999 Tokyo,Japan6th PS/WG March 2000 Washington D.C.,U.S.A.7thPS/WG September 2000 Paris ,EC8th PS/WG February 2001 Adelaide, Australia9th PS/WG May 2001 Gotemba, Japan
10th PS/WG February 2002 Brussels, EC11th PS/WG June 2002 Washington D.C.,U.S.A.

6
4. Basic Decisions
* Because it was difficult to develop a pedestrian dummy and because many advantages were confirmed in component tests, it was decided that component tests be adopted.
* Based on the results of detail accident data analysis, the following priorities were given in the development of various component tests: (1) Adult/child head test (head vs bonnet/windshield)(2) Adult leg test (leg vs bumper)(3) Adult chest, abdomen, pelvis/femur tests
Child chest, abdomen, pelvis tests*Develop test methods on the basis of (a) existing information and expert know-
how and (b) the additional studies which will be conducted by volunteers.*Hold WG meetings about two times a year, each meeting lasting for 3 to 4 days.
At the WG meetings, the members will discuss the research results brought by assigned experts and then decide test methods.

7
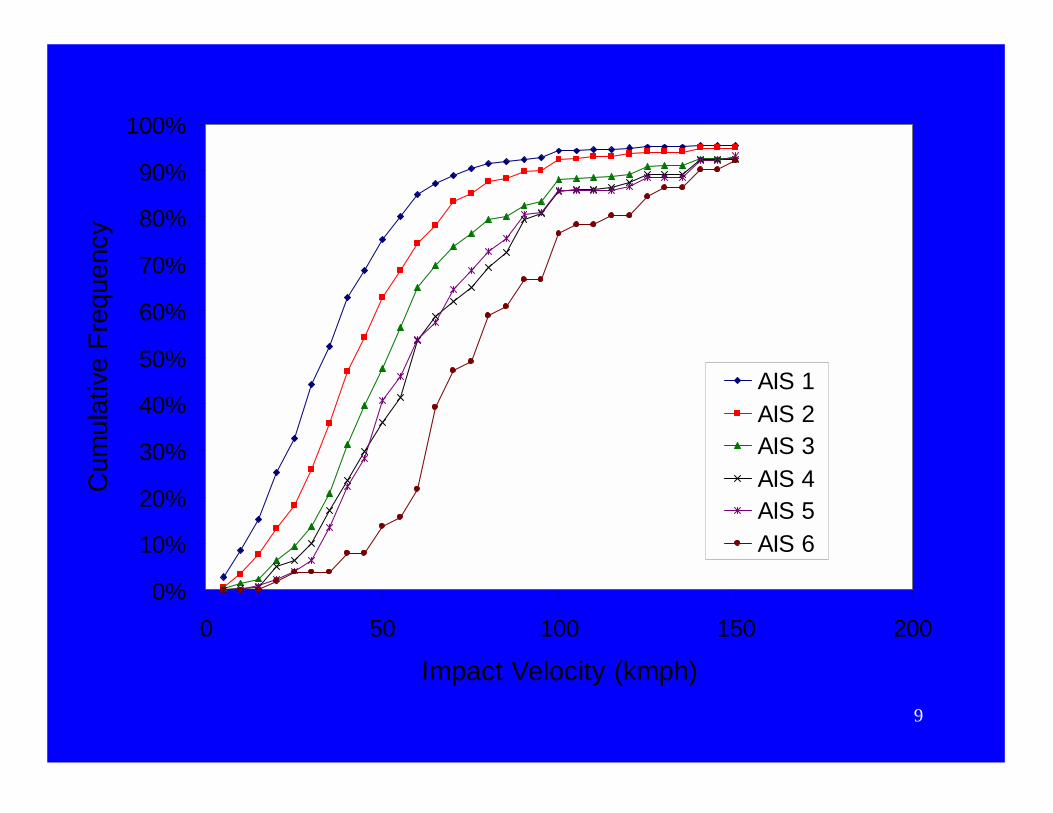
5. IHRA Pedestrian Accidents Data-set
Age, Impact velocity, Vehicle / Pedestrian interaction, AIS/ Impact velocity relationship for major injury locations are studied.Result are shown below

8
0%
10%
20%
30%
40%
50%
60%
70%
80%
90%
100%
0 20 40 60 80 100
Impact Velocity (kmph)
Cum
ulat
ive
Freq
uenc
y
US (N=444)Japan (N=231)Europe (N=763)Australia (N=52)IHRA (N=1490)
9
0%
10%
20%
30%
40%
50%
60%
70%
80%
90%
100%
0 50 100 150 200
Impact Velocity (kmph)
Cum
ulat
ive
Freq
uenc
y
AIS 1AIS 2AIS 3AIS 4AIS 5AIS 6

10
IHRA (Combined Australia, Europe, Japan, US) VelocityDistribution for Pedestrian Accidents (n=1549)
0
50
100
150
200
250
5 10 15 20 25 30 35 40 45 50 55 60 65 70 75 80 85 90 95 100
Unk
now
n
Velocity (kmph)
Freq
uenc
y
.00%
20.00%
40.00%
60.00%
80.00%
100.00%
120.00%
FrequencyCumulative %

11
Body Region Head Face Neck Chest Abdomen Pelvis Arms Legs Unknown
Contact Overall Femur Knee Lower Leg FootFront Bumper 24 2 3 5 2 6 50 58 71 458 30 1
Top surface of bonnet/wing 224 16 2 139 46 44 86 23 3 1 1 2 1Part Leading edge of bonnet/wing 15 2 3 42 79 83 35 58 40 5 28 1 1
of the Windscreen glass 347 57 12 30 5 12 23 2 1 1 1Vehicle Windscreen frame/A pillars 180 30 4 40 11 19 35 8 1 2
Front Panel 5 1 9 14 8 6 9 14 11 35 3Others 42 7 37 11 12 14 17 7 5 37 18
Sub-Total 837 115 21 300 171 180 205 167 123 93 560 55 6Indirect Contact Injury 13 18 2 1 7 1 3 1 2Road Surface Contact 176 25 2 22 2 9 44 6 4 3 5 15 2
Unknown 28 4 3 20 14 16 24 2 7 9 32 3 8Total 1054 144 44 344 188 212 274 175 137 105 598 75 16
Figure 31b. Number of pedestrian injuries related to contact location and body region for Australia, Europe, Japan and the USA (Ages < 16, AIS 2-6)
Body Region Head Face Neck Chest Abdomen Pelvis Arms Legs UnknownContactLocation
Overall Femur Knee Lower Leg Foot
Front Bumper 5 1 3 3 27 19 5 45 1 1Top surface of bonnet/wing 78 9 1 12 6 2 15 1 1
Part Leading edge of bonnet/wing 11 1 2 3 11 5 8 3 11 1 6 1of the Windscreen glass 40 2 1 1 2 1
Vehicle Windscreen frame/A pillars 13 1 3 1 1 4 4Front Panel 5 1 1 1 5 1 1
Others 9 4 1 2 4 4 13 5Sub-Total 161 13 4 25 22 9 35 39 40 7 65 6 3
Indirect Contact Injury 1 1 1 1Road Surface Contact 48 8 1 1 1 1 16 6 1
Unknown 6 1 2 5 3 4 1Total 216 21 6 27 26 10 57 45 43 7 69 7 4
Figure 31c. Number of pedestrian injuries related to contact location and body region for Australia, Europe, Japan and the USA (Ages > 15, AIS 2-6)
Body Region Head Face Neck Chest Abdomen Pelvis Arms Legs UnknownContactLocation
Overall Femur Knee Lower Leg Foot
Front Bumper 19 2 2 2 2 3 23 39 66 413 29Top surface of bonnet/wing 146 7 1 127 40 42 71 22 2 1 1 2 1
Part Leading edge of bonnet/wing 4 1 1 39 68 78 27 55 29 4 22 1of the Windscreen glass 307 55 11 29 5 12 21 2 1 1
Vehicle Windscreen frame/A pillars 167 29 4 37 10 18 31 4 1 2Front Panel 1 8 14 7 5 9 9 10 34 3
Others 33 7 33 10 12 12 13 3 5 24 13Sub-Total 676 102 17 275 149 171 170 128 83 86 495 49 3
Indirect Contact Injury 12 17 2 7 3 1 2Road Surface Contact 128 17 1 21 1 8 28 0 4 3 5 14 2
Unknown 22 4 3 19 12 16 19 2 4 9 28 3 7Total 838 123 38 317 162 202 217 130 94 98 529 68 12
Figure 31a. Number of pedestrian injuries related to contact location and body region for Australia, Europe, Japan and the USA (All Age Groups, AIS 2-6)

12
6. Study on Passenger Car Front Shape
US, European and Japanese passenger car front shapes are collected from OICA members
Front Shape of Sedans, SUVs, One Boxes will be shown in this Chapter

13
Study on Car Front ShapeStudy on Car Front Shape
•• Car front shapes in Car front shapes in IHRA member countriesIHRA member countries
•• Corridors for computer Corridors for computer simulationsimulation
0
1000
2000
3000
0 1000 2000 3000 4000 5000Length (mm)
Hei
ght (
mm
)
Sedan + Light vehicle + Sports type (n=33)
0
1000
2000
3000
0 1000 2000 3000 4000 5000Length (mm)
Hei
ght (
mm
)
SUV (n=16)
0
1000
2000
3000
0 1000 2000 3000 4000 5000Length (mm)
Hei
ght (
mm
)
1Box (n=8)
SedanSedan
SUVSUV One BoxOne Box

14
7. Test Procedures7-1 Adult/Child Head Test Procedures for Bonnet and Windshield* Adopt component tests.* Scope
The collisions of the adult's and the child's heads with the bonnet and windshield of a passenger car.
* ImpactorsSelect the head of a 6-year-old as impactor model, since child-car accidents peak with 6-year-olds.Use a AM50 percentile head for adults.Development of hemispherical impactors underway on the basis of:Child 3.5 kg 165 mm diameterAdult 4.5 kg 165 mm diameter
Follow up with examination into impactor specification details and calibration/certification test methods.
* Categorization of applicable vehiclesDomestic information of member countries supported by OICA members collected on three categories of passenger cars (sedans, SUVs, one-boxes).

15
*Impact speedPropose feasible test methods assuming a pedestrian-passenger car impact speed within a 30-50 km/h range.
*Impact zones of adult/child impactorsFrom the accident data of IHRA member countries, the impact zone is set at WAD 900-1,700 mm for the child impactor and WAD 1,400-2,400 mm for the adult impactor; the adult/child overlap area is 1,400-1,700 mm. While discussion is underway for adoption of the overlap test method, JARI'sstudy indicates there is no big difference in the life saving rate between overlap and boundary test methods.
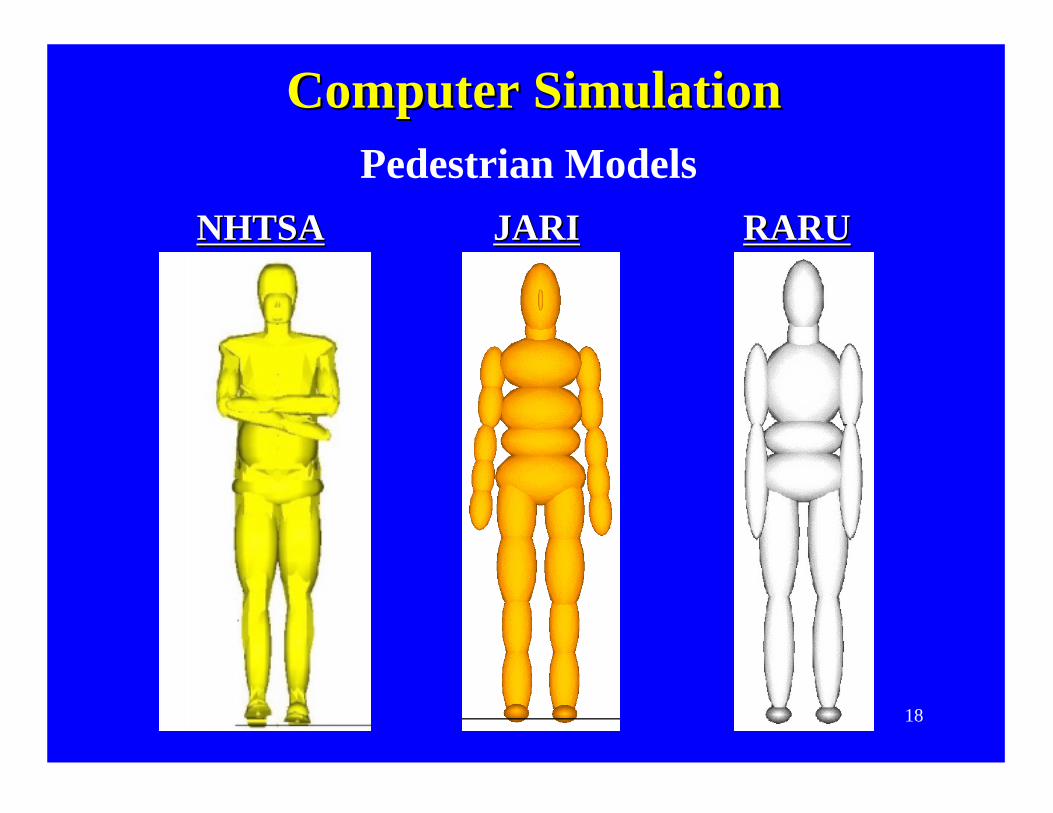
*Computer simulationUsing their respective mathematical models for the analysis of pedestrian-passenger car collisions, NHTSA (U.S.), JARI (Japan) and RARU (Australia) conducted computer simulations on the basis of vehicle shape and other agreed basic parameters. Parameters are pedestrian size (2), walking position (3), vehicle shape (3X3), vehicle stiffness (2), vehicle crash speed (3), braking (1) and others.But the simulation results diverged widely among the three institutes’analysis. The basic specifications were therefore modified, and the second simulation is now underway.

16
7-2 Leg Test Procedures*Discussion on this subject was started recently.*Efforts are being made to collect existing information and expert know-how regarding the following matters:Detailed accident informationBiomechanical data (injury mechanism and its tolerance)Information on leg impactors and pedestrian dummies concerning their shortcomings and necessary improvementsEvaluation of component/full testsOn the basis of the above information collected, the research tasks, work assignments and time schedule will be finalized.
*Impact speedAssume a pedestrian-passenger car impact speed between 30 and 50 km/h in conformity with the head component test.
*All tasks will be completed by the end of 2005.

17
•• Head Impact Speed / Vehicle Impact Head Impact Speed / Vehicle Impact SpeedSpeed
•• Head Impact AngleHead Impact Angle
•• Head Effective Mass / Head MassHead Effective Mass / Head Mass
•• WAD / Pedestrian HeightWAD / Pedestrian Height
Computer SimulationComputer Simulation
18
Pedestrian Models NHTSANHTSA JARIJARI RARURARU
Computer SimulationComputer Simulation

190ms0ms 2020msms 4040msms 6060msms 8080msms 100100msms
NHTSANHTSA
JARIJARI
RARURARU
Validation Validation -- Car A Car A -- 40km/h (Kinematics 040km/h (Kinematics 0--100ms)100ms)
PMHSPMHS

20
LowerLower MiddleMiddle UpperUpper
SedanSedan
SUVSUV
1Box1Box
WindscreenWindscreen
Windscreen/Bonnet
Bonnet Bonnet/No contact
Head Contact Locations with Car Front Shape Head Contact Locations with Car Front Shape
WindscreenWindscreen WindscreenWindscreen
WindscreenWindscreen WindscreenWindscreen WindscreenWindscreen

21
Computer Simulation ResultsComputer Simulation Results
Bonnet WindscreenSedan (0.81±0.17) (1.06±0.13)SUV (0.71±0.21) (0.96±0.07)
One-Box no contact (0.68±0.21)
Bonnet WindscreenSedan (60.6±14.4) (43.5±7.9)SUV (77.9±19.3) (68.5±7.5)
One-Box no contact (45.1±9.5)
Bonnet WindscreenSedan (1.01±0.13) ((0.79±0.23)SUV (0.99±0.35) (0.84±0.20)
One-Box no contact (0.76±0.30)
Head Impact Speed/Impact Speed
Head Impact Angle (with horizontal)
Head Effective Mass/Actual Mass
Adult: 4.5 kgAdult: 4.5 kg

22
8.Future Tasks (New Terms of Reference)8-1 Pedestrian Head Impact Test Methods (Adult, Child)[ by mid of 2003 ]� The main portions of the test methods are scheduled to be decided by June
2001 excluded impact conditions. The remaining details need to be finalized in the following months.
� Specifically,- Test will be performed to evaluate the biofidelity, durability, reproducibility,
inertia moment, etc. of the new head-form impactors- Through actual testing, the details of certification test procedures will be
verified.- Conduct technical feasibility study and reflect such result to the test
procedures.� Computer simulation and validation [ by mid of 2003 ]- Obtain improved PMHS data and additional accident data, and improve
model/validation, for example, sensitivity study ( car stiffness, stance, statue, etc ) , simulation other statues ( small, large child ; small, large adult )

23
8-2 Adult Leg Test Method [ by mid of 2005 ]� WG will be considered not only subsystem test method but also other test
method [ by end of 2003 ]� Biomechanical data will be collected and analyzed concerning the pedestrian
injury mechanism, human tolerance, etc. in the speed range of 30-50 Km/h. [ by end of 2002 ]
� From such biomechanical data, measurement items and levels will be determined for the test procedure. [ by end of 2002 ]
� Judgement will be made on the existence of an impactor satisfying the specified measurement items and levels [ by mid of 2003 ]
� If an appropriate impactor does not exist, an existing one will be improved or a new one will be developed.
� In this case, a volunteer country(s) will be selected and the schedule for suchimpactor improvement or development will be set [by mid of 2003 ]
� In the development of a new test method, the portions of the existing component test which are adaptable or not adaptable to the new test method will be identified, and the development effort will be focused on the unacceptable portions.
� Conduct technical feasibility study and reflect such result to the test procedures [ by mid of 2005 ]

24
8-3 Establishment of Test Methods for Other Important Body Regions [ ? ]
�The previous priority ranking will be checked, and about one or two body regions will be selected and establish work plan [ by mid of 2003 ]
�Volunteer countries, their work assignments, deadlines, etc. will be decided and the development work will be initiated
8-4 Computer simulation [ by mid of 2005 ]�Study how far we can use computer simulation study for test
procedure, also check the limitation of computer simulation study.