Embed Size (px)
Citation preview

Safety at Work: A Meta-Analytic Investigation of the Link Between JobDemands, Job Resources, Burnout, Engagement, and Safety Outcomes
Jennifer D. NahrgangArizona State University
Frederick P. MorgesonMichigan State University
David A. HofmannUniversity of North Carolina
In this article, we develop and meta-analytically test the relationship between job demands and resourcesand burnout, engagement, and safety outcomes in the workplace. In a meta-analysis of 203 independentsamples (N � 186,440), we found support for a health impairment process and for a motivational processas mechanisms through which job demands and resources relate to safety outcomes. In particular, wefound that job demands such as risks and hazards and complexity impair employees’ health andpositively relate to burnout. Likewise, we found support for job resources such as knowledge, autonomy,and a supportive environment motivating employees and positively relating to engagement. Job demandswere found to hinder an employee with a negative relationship to engagement, whereas job resourceswere found to negatively relate to burnout. Finally, we found that burnout was negatively related toworking safely but that engagement motivated employees and was positively related to working safely.Across industries, risks and hazards was the most consistent job demand and a supportive environmentwas the most consistent job resource in terms of explaining variance in burnout, engagement, and safetyoutcomes. The type of job demand that explained the most variance differed by industry, whereas asupportive environment remained consistent in explaining the most variance in all industries.
Keywords: workplace safety, safety climate, meta-analysis, job demands, job resources
Each day individuals are exposed to a variety of workplacedemands. Job demands, whether they are administrative hassles,emotional conflict, or role overload, require sustained physical andpsychological effort, which can have significant physiological andpsychological costs (Crawford, LePine, & Rich, 2010; Demerouti,Bakker, Nachreiner, & Schaufeli, 2001; Schaufeli, Bakker, & vanRhenen, 2009). The presence of job demands has been linked toincreased employee burnout and absenteeism and decreased per-formance (e.g., Bakker & Demerouti, 2007). In high-risk environ-ments, other job demands—including exposure to hazardous ma-terials, cognitively challenging work, or physically demandingwork—are also present, and these job demands may lead to anentirely different set of outcomes for employees, such as work-place accidents, injuries, and fatalities.
The cost of these safety-related outcomes is substantial, as it isestimated that workplace fatalities, injuries, and illnesses result ineconomic losses amounting to 4 to 5% of gross domestic product(World Health Organization, 2008). In 2007, this amounted toeconomic losses in the United States of over $550 billion (Bureau
of Economic Analysis, 2008). In 2000, there were approximatelytwo million work-related deaths (World Health Organization,2008). Beyond the impact to individual workers themselves, oc-cupational safety also poses a risk to others, as it is estimated thatas many as 98,000 Americans die in hospitals due to errors madeby medical workers (Institute of Medicine, 1999).
Given these high human and financial costs, it is important tounderstand how various workplace demands influence workplacesafety. Fortunately, the workplace environment also provides var-ious resources to working individuals, including job autonomy, apositive workplace climate, and coworker support (Crawford et al.,2010). These resources reduce job demands and their associatedphysiological and psychological costs and stimulate personalgrowth, learning, and development (Demerouti et al., 2001;Schaufeli et al., 2009). They have been shown to increase em-ployee engagement, performance, and commitment (Bakker &Demerouti, 2007; Rich, LePine, & Crawford, 2010). In terms ofsafety outcomes, resources that may curb job demands and moti-vate employees include autonomy, knowledge of safety, and asupportive environment.
Although there has been considerable research on job demandsand resources, we know relatively little about the implications ofthese demands and resources for contexts in which there aresignificant health and safety risks. As such, there are at least fourkey issues deserving additional research attention. First, we need abetter understanding of which job demands and resources influ-ence workplace safety. Although job demands and resources havebeen linked to organizational outcomes such as job performance,
Jennifer D. Nahrgang, W.P. Carey School of Business, Arizona StateUniversity; Frederick P. Morgeson, Eli Broad Graduate School of Man-agement, Michigan State University; David A. Hofmann, Kenan-FlaglerBusiness School, University of North Carolina.
Correspondence concerning this article should be addressed to Jennifer D.Nahrgang, W.P. Carey School of Business, Arizona State University, P.O. Box874006, Tempe, AZ 85287-4006. E-mail: [email protected]
Journal of Applied Psychology © 2010 American Psychological Association2010, Vol. ●●, No. ●, 000–000 0021-9010/10/$12.00 DOI: 10.1037/a0021484
1

organizational commitment, and absenteeism (e.g., Bakker & De-merouti, 2007; Rich et al., 2010), it is equally important fororganizations to understand how job demands and resources relateto safety outcomes such as accidents and injuries, adverse events,and unsafe behavior.
Second, greater understanding of the mechanisms throughwhich job demands and resources relate to safety outcomes isneeded. The job demand–resources (JD-R) model (Bakker &Demerouti, 2007; Demerouti et al., 2001) offers a potentiallyuseful conceptual model for understanding the mechanismsthrough which job demands and resources relate to safety out-comes. This includes a health impairment process in which jobdemands exhaust an employee’s mental and physical resources andthus lead to employee burnout. Alternatively, job resources createa motivational process in which the resources motivate employeestoward higher engagement (Bakker & Demerouti, 2007; Demer-outi et al., 2001). Because most models of workplace safety focuson motivational processes (Christian, Bradley, Wallace, & Burke,2009; Neal & Griffin, 2004), they are incomplete in that they donot recognize the role the health impairment process might play inworkplace safety.
Third, it is important to uncover which job demands and re-sources contribute the most to burnout, engagement, and safetyoutcomes. There are many job demands and resources present inthe working environment, and it is important to understand whichjob demands deplete mental and physical resources the most andwhich job resources are the most motivating. This information isuseful because it allows managers and organizations to adjust jobs,training, and the environment based on the factors that contributethe most to workplace safety.
Fourth, the extent to which the JD-R model generalizes acrossindustry is unclear. Although workplace safety is a priority inmany industries, workers and managers do, however, face differenttypes of job demands and resources as well as different safetypriorities, ranging from the reduction of errors in the health-careindustry to the reduction of driving accidents in the transportationindustry. In the current study, we explore whether job demandsand job resources have the same impact across industry contexts.
Our goal was to examine the above-mentioned issues by devel-oping and meta-analytically testing a theoretical framework ofworkplace safety based on the JD-R model (Bakker & Demerouti,
2007; Demerouti et al., 2001). We utilize the JD-R model toorganize the various working conditions relevant for workplacesafety and to explain the mechanisms through which job demandsand resources relate to safety outcomes. Our theoretical model isillustrated in Figure 1, where we specify the various job demandsand resources relevant for workplace safety and how they relate toburnout, engagement, and safety outcomes.
Although there have been recent meta-analyses of workplacesafety (Christian et al., 2009; Clarke, 2006a; Clarke & Robertson,2005), the current meta-analysis is the first to utilize the JD-Rmodel. This has enabled us to connect various job demands andresources to their potential impact on safety outcomes. Moreimportant, we were able to investigate both the health impairmentprocess and the motivational process through which job demandsand resources relate to workplace safety, which is a more completeconceptualization than presented in past research. In addition, thecurrent meta-analysis is the most comprehensive quantitative sum-mary of the safety literature to date. Compared to other recentsafety meta-analyses, this study includes over twice as manyindependent samples (for a total of 203 independent samples),incorporating both published and unpublished studies and abroader set of industries than previously investigated.
Theory and Hypotheses
Job Demands–Job Resources
The JD-R model (Bakker & Demerouti, 2007; Demerouti et al.,2001) proposes that job demands and resources are two sets ofworking conditions that can be found in every organizationalcontext (Schaufeli et al., 2009). In the JD-R model, job demandsinclude the physical, psychological, social, or organizational as-pects of the job that require sustained physical, cognitive, oremotional effort or skills and are therefore associated with phys-iological and/or psychological costs. Examples of job demandsinclude high work pressure, an unfavorable physical environment,and emotionally demanding interactions (Bakker & Demerouti,2007; Demerouti et al., 2001). Job demands may be inherentlynegative, or they may turn into job stressors when meeting thedemands requires high effort on the part of the employee from
Safety Outcomes • Accidents & Injuries • Adverse Events • Unsafe Behavior
Job Demands
• Risks & Hazards • Physical Demands • Complexity
Job Resources • Knowledge • Autonomy • Supportive Environment o Social Support o Leadership o Safety Climate
Burnout
Engagement • Engagement • Compliance • Satisfaction
+
+
+
–
–
–
Figure 1. Job demands–job resources model of workplace safety.
2 NAHRGANG, MORGESON, AND HOFMANN

which the employee may not adequately recover (Bakker &Demerouti, 2007; Meijman & Mulder, 1998).
The second set of working conditions is job resources, which notonly help employees deal with job demands but also have thepotential to motivate employees. Job resources include physical,psychological, social, or organizational aspects of the job that helpemployees achieve work goals, reduce job demands and the asso-ciated physiological and psychological costs, and/or stimulate per-sonal growth and development. Examples of job resources includeautonomy, coworker support, and feedback. Thus, job resourcescan be derived from the organization (e.g., pay, job security),interpersonal and social relations (e.g., supervisor and coworkersupport), organization of work (e.g., participation in decision mak-ing), and the task (e.g., autonomy, feedback; Bakker & Demerouti,2007; Demerouti et al., 2001).
In the context of workplace safety, working conditions can alsobe categorized as job demands and resources (see Figure 1). Thus,working conditions categorized as job demands in the context ofsafety include risks and hazards present in the workplace, physicaldemands associated with the work, as well as the complexity of thework. Previous research utilizing the JD-R model has identifiedaspects of the physical environment, such as noise and materials,as job demands (Demerouti et al., 2001). In the context of safety,risks and hazards constitute the environmental and workplaceconditions or exposures, which include possible loss of life, injury,or chance of danger. Examples include noise, heat, dust, chemi-cals, and hazardous tools and equipment (DeJoy, Schaffer, Wilson,Vandenberg, & Butts, 2004). Although some risks and hazardsmay be avoided by employees, the mere presence of risks andhazards is likely to increase employees’ perceptions of danger inthe workplace and to be associated with psychological costs.Furthermore, employees may expend increased effort not only tohandle risks and hazards but to circumvent risks and hazards.
The two remaining job demands include physical demands andcomplexity of the work. According to the JD-R model, physicaldemands and complexity of the work constitute job demandsbecause both require sustained physical or cognitive effort andskill (Bakker & Demerouti, 2007; Demerouti et al., 2001). In thecontext of safety, the physical demands of the work reflect phys-ical aspects of the job or the surrounding context that requiresustained physical effort. Examples include the condition in whichthe work is performed, scheduling and workload, and physicaldemands of the work. Finally, the overall complexity of the workis another job demand that includes aspects of the job that requiremental effort, such as cognitive demands, task complexity, andambiguity in the work.
Working conditions categorized as job resources include knowl-edge of safety, autonomy, and a supportive environment. Knowl-edge may be categorized as a job resource because it providesemployees with the resources to achieve their work goals as wellas to reduce job demands (Bakker & Demerouti, 2007; Demeroutiet al., 2001). Thus, in the context of safety, knowledge of safetyprovides employees with the resource of knowing what to doregarding safety (i.e., employee understanding of safety policiesand procedures) and how to perform safely (i.e., training on safety;Campbell, 1990). Knowledge includes such things as knowinghow to use personal protective equipment, engaging in workpractices to reduce risk, and understanding general health andsafety (Burke, Sarpy, Tesluk, & Smith-Crowe, 2002).
Autonomy is a working condition that has long been acknowl-edged as a valuable resource for employees (e.g., Karasek, 1979).Autonomy represents the freedom individuals have in carrying outtheir work, including freedom regarding scheduling work, decisionmaking, and work methods (Hackman & Oldham, 1976; Morgeson& Humphrey, 2006). Research utilizing the JD-R model has pre-viously classified autonomy as a job resource (Demerouti et al.,2001; Schaufeli et al., 2009). In the context of safety, the freedomto carry out their work allows employees to achieve their workgoals in terms of both productivity and safety outcomes as well asto reduce job demands. It thus constitutes a job resource.
The final job resource includes a supportive environment, whichcan be further delineated in terms of the source of the support.Previous research on the JD-R model has consistently classifiedsupervisor support (i.e., leadership), social support, and workplaceclimate as job resources (Crawford et al., 2010; Demerouti et al.,2001; Schaufeli et al., 2009). Thus, in the context of safety,employees may receive leadership support by way of leaderscommunicating the value of safety to their employees, helpingemployees develop new ways to achieve safety, and having aconcern about employee safety (Zacharatos, Barling & Iverson,2005; Zohar, 2002a, 2002b). Employees may also receive socialsupport, which includes the degree of advice and assistance fromothers, support regarding safety, and an emphasis on teamwork(Morgeson & Humphrey, 2006). The final source of support comesfrom the organization in the form of safety climate. In general,climate can be defined as the perceptions of the events, practices,and procedures as well as the kind of behaviors that are rewarded,supported, and expected in a particular organizational setting(Schneider, 1990). Thus, safety climate encompasses perceptionsof safety-related events, practices, and procedures as well as thetypes of safety-oriented behaviors that are rewarded, supported,and expected (Zohar, 1980). The three sources of a supportiveenvironment constitute job resources because they may help em-ployees achieve work goals through the advice and assistancereceived from others, reduce job demands by helping them developnew ways to achieve safety, and motivate the development ofsafety behaviors rewarded by the environment.
Job Demands–Job Resources Relationship WithBurnout and Engagement
Beyond the premise that job demands and resources representtwo sets of working conditions found in every organizationalcontext, the JD-R model proposes that job demands and resourcesplay a role in the development of burnout and engagement (Bakker& Demerouti, 2007; Crawford et al., 2010; Demerouti et al., 2001).Burnout is traditionally characterized as a syndrome of exhaustion,cynicism, and lack of efficacy experienced by employees (Maslach& Leiter, 1997, 2008). In contrast to burnout, engagement wasoriginally defined as the harnessing of organization members’selves to the work roles by which the organization membersemploy and express themselves physically, cognitively, and emo-tionally (Kahn, 1990, p. 694). More recently, Schaufeli, Salanova,Gonzalez-Roma, and Bakker (2002) have defined engagement as apositive, fulfilling, work-related state of mind characterized byvigor, dedication, and absorption (p. 74).
In the context of workplace safety, burnout is reflected innegative employee well-being, which includes worker anxiety,
3SAFETY AT WORK

health, and depression, and work-related stress. Employee engage-ment represents the extent of involvement, participation, and com-munication in safety-related activities (Hofmann & Morgeson,1999; Neal & Griffin, 2006; Parker, Axtell, & Turner, 2001) andcompliance, or the extent to which employees conform or submitto safety expectations, rules, and procedures. The positive state ofemployee satisfaction and commitment to the organization canalso be characterized as engagement.
According to the JD-R model, job demands evoke a healthimpairment process that exhausts employees’ mental and physicalresources and therefore leads to burnout. Thus, job demands arepredicted to have a direct positive relationship with burnout (Bak-ker & Demerouti, 2007; Crawford et al., 2010; Demerouti et al.,2001). With high job demands, it is likely that workers will havelimited capacity to handle the physical and cognitive demands ofthe work and safety performance. Thus, exposure to risks andhazards, high physical demands, and complexity will deplete em-ployees’ mental and physical resources and ultimately result inburnout. Empirical research has found that hazards and high work-load are positively related to depression and somatic symptoms(Frone, 1998). We expect that job demands such as risks andhazards, physical demands, and complexity will have a positiverelationship with burnout.
Hypothesis 1: Job demands are positively related to burnout.
Empirical evidence on the relationship of job demands to en-gagement has been mixed (Bakker, van Emmerik, & Euwema,2006; Schaufeli & Bakker, 2004; Schaufeli, Taris, & van Rhenen,2008), although recent meta-analytic work suggests the relation-ship between job demands and engagement depends on whetherthe demand is a challenge or a hindrance demand (Crawford et al.,2010). Challenge demands promote mastery, personal growth, orfuture gains, and employees view these demands as opportunitiesto learn, achieve, and demonstrate competence. Hindrance de-mands impede personal growth, learning, and goal attainment andare generally seen by employees as constraints, barriers, or road-blocks that hinder progress toward goals and effective perfor-mance (Cavanaugh, Boswell, Roehling, & Boudreau, 2000). Ex-amples of challenge demands include time pressure and high levelsof responsibility, whereas hindrance demands include role conflict,role ambiguity, and role overload. Challenge demands have beenfound to be positively related to engagement, whereas hindrancedemands have been found to be negatively related to engagement(Crawford et al., 2010).
Risks and hazards, physical demands, and complexity are hin-drance demands because they have the potential to hinder safety.Risks and hazards impede progress toward working safely,whereas physical demands and complexity constrain an employ-ee’s progress toward working safely. Due to these barriers andconstraints, workers are less likely to engage in safety activities,comply with safety procedures, or be satisfied. Empirical researchhas found risks and hazards are negatively related to employeeinvolvement in safety activities, compliance, and job satisfaction(DeJoy et al., 2004; Frone, 1998; Goldenhar, Williams, & Swan-son, 2003). Research has also found negative relationships be-tween role overload and safety compliance and working safely(Hofmann & Stetzer, 1996; Wallace & Chen, 2005). Finally, workdesign research has found that increased physical demands are
negatively related to job satisfaction (Humphrey, Nahrgang, &Morgeson, 2007). Thus, we expect risks and hazards, physicaldemands, and complexity will be negatively related to engage-ment, compliance, and satisfaction.
Hypothesis 2: Job demands are negatively related to engage-ment.
The JD-R model also proposes that job resources evoke a motiva-tional process that leads to higher work engagement. Job resourcesmay be intrinsically motivating by fostering employee growth andlearning, or they may be extrinsically motivating because they allowemployees to achieve their goals. Thus, job resources are predicted tohave a direct positive relationship with engagement (Bakker & De-merouti, 2007; Crawford et al., 2010; Demerouti et al., 2001). Weexpect that knowledge, autonomy, and a supportive environment willbe positively related to employee engagement in safety activities,compliance, and satisfaction. Knowledge of safety fosters employeegrowth and learning in using personal protective equipment, safetywork practices, and general health and safety (Burke et al., 2002).Research has found a positive relationship between training related topersonal protective equipment and compliance in wearing personalprotective equipment (Smith-Crowe, Burke, & Landis, 2003). Like-wise, autonomy fulfills a basic need for freedom and provides em-ployees with discretion in their work, thus enabling them to achievetheir goals. Autonomy has been found to be positively related tosafety communication and commitment (Parker et al., 2001) and hasalso been found to be positively related to job satisfaction (Humphreyet al., 2007).
Finally, a supportive environment will also motivate employeestoward higher engagement. A supportive environment sends asignal that workers are valued and that the organization is com-mitted to them (Eisenberger, Fasolo, & Davis-LaMastro, 1990;Eisenberger, Huntington, Hutchison, & Sowa, 1986; Hofmann &Morgeson, 1999). Therefore, workers will be motivated to partic-ipate in safety prevention activities such as compliance, engage inhigher levels of safety communication and involvement in safetyactivities, and be more satisfied with their work. Research hasfound that a supportive environment is positively related to safetycommunication and worker involvement (Hofmann & Morgeson,1999; Mohamed, 2002), safety compliance (Goldenhar et al.,2003), and job satisfaction (Humphrey et al., 2007). The safetyclimate in an organization also communicates the types of safety-oriented behaviors that are rewarded, supported, and expected andthus motivates employees to achieve safety goals. Research hasfound a positive relationship between safety climate and partici-pation in safety activities, compliance with safety, and work sat-isfaction (Hofmann & Stetzer, 1998; Morrow & Crum, 1998; Neal& Griffin, 2006). Thus, we expect knowledge, autonomy, and asupportive environment will be positively related to engagement,compliance, and satisfaction.
Hypothesis 3: Job resources are positively related to engage-ment.
Empirical evidence also suggests that job resources have a directnegative relationship with burnout because larger pools of re-sources enable employees to meet demands and protect themselvesfrom strain. In contrast, with limited resources employees are
4 NAHRGANG, MORGESON, AND HOFMANN
unable to meet demands and thus accrue strain over time, resultingin burnout (Bakker, Demerouti, & Euwema, 2005; Bakker,Demerouti, & Schaufeli, 2003; Hobfoll & Freedy, 1993; Lee &Ashforth, 1996; Schaufeli & Bakker, 2004). We also expect thatknowledge, autonomy, and a supportive environment will be neg-atively related to burnout. Knowledge of safety procedures ortraining in safety provides a resource for employees to draw fromin order to mitigate demands and thus reduce strain. Indeed,research has found safety-related training to be negatively relatedto stress (Fogarty, 2005). Autonomy also provides employees withanother resource in order to meet job demands. Jobs high inautonomy provide employees with the freedom to decide how tomeet job demands and thus reduce the potential for strain(Karasek, 1979). Research with nurses has found that autonomy isnegatively related to stress (Hemingway & Smith, 1999).
Finally, a supportive environment enables employees to copewith the negative influences of job demands (Demerouti et al.,2001). Support at work is one of the most important determinantsof well-being (Myers, 1999) and helps to reduce stress by buffer-ing workers against negative job events (Karasek, 1979; Karasek,Triantis, & Chaudhry, 1982). Likewise, support for safety mayhelp to buffer employees from the anxiety, stress, and burnout thatcome from dealing with safety issues or risks and hazards (Hal-besleben, 2006). Thus, we expect that a supportive environmentwill also be negatively related to employee burnout. Meta-analyticevidence has shown that social support is negatively related toanxiety, stress, and burnout and exhaustion (Halbesleben, 2006).Likewise, strong leadership in a hospital was found to be nega-tively related to the burnout and exhaustion of nurses (Laschinger& Leiter, 2006). Among construction workers, safety climate wasfound to be negatively related to psychological and physical symp-toms such as anger, insomnia, and pain (Goldenhar et al., 2003).Thus, we expect that knowledge, autonomy, and a supportiveenvironment will be negatively related to burnout.
Hypothesis 4: Job resources are negatively related to burnout.
Relationship of Burnout and Engagement to SafetyOutcomes
Recent work has expanded the JD-R model to assess the extentto which burnout and engagement predict outcomes such as per-formance, citizenship behaviors, and absenteeism (e.g., Rich et al.,2010; Schaufeli et al., 2009). In general, the JD-R model proposesthat exhaustion, cynicism, and lack of efficacy on the part ofemployees will be detrimental to performance and lead to higherabsenteeism (Bakker & Demerouti, 2007). In contrast, engagedemployees will focus their physical, cognitive, and emotionalefforts toward goal attainment, thus leading to higher performanceand citizenship behaviors (Rich et al., 2010). In the context ofworkplace safety, our primary interest is the relationship of burn-out and engagement to outcomes such as accidents and injuries,adverse events, and unsafe behavior (Neal & Griffin, 2004).
We expect that burnout will be positively related to accidentsand injuries, adverse events, and unsafe behavior. With burnout, anemployee’s mental and physical energy is depleted. Thus, employ-ees are more likely to commit mistakes and injure themselves.Likewise, employees are unlikely to have the mental or physicalenergy to perform safe behaviors. Indeed, research on construction
workers has found that psychological distress is positively relatedto accidents and injuries (Siu, Phillips, & Leung, 2004). Burnoutamong nurses has also been found to be positively related toadverse events (Laschinger & Leiter, 2006). Thus, we expectburnout will be positively related to accidents and injuries, adverseevents, and unsafe behavior.
In contrast, we expect that engagement will be negatively re-lated to accidents and injuries, adverse events, and unsafe behav-ior. Through increased engagement activities workers have morecontrol over the situation and thus are able to limit the number ofaccidents, injuries, and adverse events. Research has found anegative relationship between safety communication and accidents(Hofmann & Morgeson, 1999). Likewise, we also expect thatengagement in complying with safety procedures and activitieswill be negatively related to accidents and injuries and adverseevents. Research has found that compliance was negatively relatedto near misses (Goldenhar et al., 2003). We expect that engage-ment, compliance, and satisfaction will be negatively related toaccidents and injuries, adverse events, and unsafe behavior.
Hypothesis 5: Burnout is positively related to safety out-comes.
Hypothesis 6: Engagement is negatively related to safetyoutcomes.
Mediating Role of Burnout and Engagement
We proposed, following the JD-R model, that job demands andresources would be related to burnout and engagement. In summary,job demands will exhaust an employee’s mental and physical re-sources, thereby increasing burnout and hindering engagement insafety activities. In contrast, job resources motivate employees towardhigher engagement as well as replenish an employee’s resources andoffset the degree of burnout. We then hypothesized that employeeswho experience burnout are more likely to commit mistakes andinjure themselves, whereas engaged employees are more likely tofocus their efforts toward working safely and thus be less likely toinjure themselves or others. Thus, a remaining question concerns howjob demands and resources are translated into safety outcomes such asaccidents, injuries, and adverse events.
Previous research supports the direct relationship between jobdemands and resources and safety outcomes in that higher work-load and risks have been associated with more work injuries andnegative safety-related events (Evans, Michael, Wiedenbeck, &Ray, 2005; Frone, 1998). Knowledge of safety and a supportiveenvironment have also been found to negatively relate to safetyerrors and accidents and injuries (Hofmann & Stetzer, 1996; Katz-Navon, Naveh, & Stern, 2007; Zohar & Luria, 2004). Thus, thehypotheses advanced earlier suggest that burnout and engagementmediate the relationship between job demands and resources andsafety outcomes in two ways. First, to avoid accidents, injuries,and adverse events, employees must be able to utilize their fullmental and physical capacities. In addition, in order to performtheir jobs productively as well as safely, employees must extend alarge amount of effort. Unfortunately, in the effort to meet in-creased job demands, such as risks and hazards, complexity, andphysical demands, an employee’s mental and physical capacitiesare depleted, which results in burnout for the employee. Having to
5SAFETY AT WORK

extend effort to meet the increased job demands also decreaseseffort toward engaging in safety activities. Thus, employees be-come mentally and physically exhausted as well as unwilling toengage in activities that will keep them safe from harm. In thisstate, employees are more likely to injure themselves, commitmistakes, or experience other adverse safety outcomes.
Second, employees need to be motivated to perform safely aswell as to have ways to replenish their mental and physicalcapacities. Increased job resources, such as knowledge, autonomy,and a supportive environment foster employee growth and learningand allow employees to achieve their goals. In addition, these jobresources help employees to offset the negative influences ofdemands in the workplace. Thus, employees are motivated toengage in safety activities and are less likely to suffer from burnoutbecause job resources will replenish their mental and physicalcapacities. In this motivated and healthy state, employees are lesslikely to experience adverse safety outcomes. Research has indeedfound that psychological strain mediates the relationship betweensafety climate and safety outcomes such as errors and accidentrates (Fogarty, 2005; Siu et al., 2004). Thus, we propose thatburnout and engagement will mediate the relationship between jobdemands and resources and safety outcomes.
Hypothesis 7: Burnout mediates the relationship between (a)job demands and (b) job resources and safety outcomes.
Hypothesis 8: Engagement mediates the relationship between(a) job demands and (b) job resources and safety outcomes.
Generalization Within and Across Industries
The JD-R model posits that job demands and resources can befound in every organizational context (Schaufeli et al., 2009). Yetindustries differ with respect to the types of job demands inherent inthe work. For example, in the construction industry, workers areexposed to hazards such as asbestos, chemicals, and lead (Goldenharet al., 2003), whereas in the health-care industry, nurses face inherentrole conflict and role ambiguity based on opposing demands made bymedical and administrative staff (Hemingway & Smith, 1999). Inaddition, industries differ with the types of risks in the workplace andwhether or not those risks pose a risk to the self versus others. Forexample, unsafe performance in the manufacturing industry primarilyposes a risk to the self, or individual employee, whereas unsafeperformance in the health-care industry can pose a risk to others, orpatients. Likewise, industries differ in the types of safety outcomes,ranging from falls in the construction industry, driving accidents in thetransportation industry, and medication errors in the health-care in-dustry. Thus, the current study explores the extent to which therelationship of job demands and resources to burnout, compliance,and safety outcomes generalize across industry.
Method
Literature Search and Coding Procedures
A literature search was conducted to identify published articles,conference papers, doctoral dissertations, and unpublished manu-scripts related to safety climate. The articles were identifiedthrough computer-based searches of the PsycINFO (1887–2009),
ISI Web of Science (1970–2009), and Medline (1950–2009) da-tabases in order to identify safety research that has been publishedin the psychology, management, and medical literatures. Searchesincluded the terms workplace safety, safe behavior, safe behavior,safety performance, safety climate, and safety culture. Results ofthis search identified 2,134 articles. The electronic search wassupplemented with a manual search of reference lists of keyempirical and theoretical articles on safety, conference programs,and personal communication with safety researchers. The abstractsobtained as result of these searches were reviewed, and theoreticalwork, literature reviews, and studies outside of the context of workwere eliminated for inclusion in the meta-analysis. We then ex-amined the remaining empirical articles (960 studies) for appro-priate content. If the study had sufficient information (e.g., effectsizes, description of variables, and description of sample) to codethe study, it was included in the meta-analysis. Our final setincludes 179 studies, with 20 articles reporting more than oneindependent sample for a total of 203 independent samples (N �186,440). The samples were considered independent if participantsin one sample were not participants in the other sample.
All three authors participated in the coding of the studies. Eachauthor coded approximately one third of the studies. Interrateragreement was assessed on a random sample of 20 studies (�10%of the 179 studies). Initial agreement was 79%, which is similar tothat for other published meta-analyses (Heidemeier & Moser,2009). After independently coding each manuscript, the authorsmet together weekly to discuss the manuscripts coded that week.During the meetings, the authors clarified any ambiguous codingsituations (e.g., whether a variable represented construct A orconstruct B), discussed whether an article’s dataset was unique,and worked to achieve consensus on any issues among the authors.
Coded Variables
Job demands. Risks and hazards includes perceived risk,level of risk, number of hazards, and perceptions of safety. Per-ceptions of safety was reverse coded so that the construct repre-sents high levels of risks and hazards. Physical demands includesphysical demands, workload, and work pressure or high workpace. Complexity includes cognitive demands, task complexity,and ambiguity.
Job resources. Knowledge includes employee understanding ofsafety, policies, rules and procedures, as well as safety training. Socialsupport includes involvement and support from coworkers, team-work, and coworker support for safety. Leadership includes styles ofleadership (i.e., transformational), relationships between leaders andworkers (i.e., leader–member exchange), trust, and supervisor supportfor safety. Variables were coded so that the construct representspositive leadership. Safety climate includes the overall perceptions ofthe safety climate, the perceptions of management’s involvement insafety, and proactive management of safety.
Burnout. Burnout includes worker anxiety, health, and de-pression, and work- related stress.
Engagement. Engagement includes worker participation insafety as well as safety communication and information sharingwith workers. Compliance includes compliance with safety andpreventative measures such as personal protection equipment andhousekeeping. Satisfaction includes job and organizational satis-faction and organizational commitment.
6 NAHRGANG, MORGESON, AND HOFMANN

Safety outcomes. Accidents and injuries includes accidentand injury rates and injury severity. Adverse events includes nearmisses, safety events, and errors. Unsafe behavior includes unsafebehaviors, absence of safety citizenship behaviors, and negativehealth and safety. Safety outcomes were coded such that a higherscore on the variable represents increased frequency of occurrence.
Industry. Based on the sample description, the industry sectorthe sample was drawn from was coded (with Standard IndustrialClassification codes). The four primary industries represented wereconstruction, health care, manufacturing/processing, and transporta-tion.
Meta-Analytic Procedures and Analyses
We utilized the Hunter–Schmidt psychometric meta-analysismethod (Hunter & Schmidt, 2004) to conduct the meta-analyticreview. The observed correlations were corrected for sampling errorand for measurement unreliability. We corrected the correlations fromindividual samples for measurement error in both the predictor andthe criterion scores using Cronbach’s alpha coefficient. The majorityof studies provided Cronbach’s alpha coefficient for the measuredvariables. For the studies missing this reliability coefficient, we usedthe average value from the other studies (Hunter & Schmidt, 2004).We did not correct for measurement error when objective measureswere used in the study (i.e., accident rates from archival records). Forstudies that provided multiple estimates of the same relationship, wecombined these estimates into a single correlation using the compos-ites formula when possible or averaging the estimates. This preventeda study being “double-counted” in the meta-analysis. In contrast,studies that included multiple independent samples were separatelycoded.
We present several pieces of information about the populationcorrelation estimates. First, we include both the uncorrected (r) andcorrected (rc) estimates. Second, we include the 90% confidenceinterval (CI) and 80% credibility interval (CV) for each correctedpopulation correlation. Confidence intervals provide an estimate ofthe variability around the estimated mean correlation; a 90% CI(around a positive value) excluding zero indicates that one can be95% confident that the average true score correlation is larger thanzero (for positive correlations, less than 5% are zero or less and amaximum of 5% are larger than the upper bound of the interval).Credibility intervals provide an estimate of the variability of individ-ual correlations across studies; a 80% CV excluding zero indicatesthat at least 90% of the individual correlations in the meta-analysiswere greater than zero (for positive correlations, less than 10% arezero or less and a maximum of 10% lie beyond the upper bound of theinterval). Thus, confidence intervals estimate variability in the meta-analytic correlation, whereas credibility intervals estimate variabilityin the individual (primary) correlations across the samples included inthe respective analysis. Finally, we present the number of studiesincluded in determining the correlation (k) and the total number ofparticipants in the studies (N). In the following discussion of thecorrelation results, correlations were interpreted as significant at p �.05 if the confidence interval did not include zero.
In our analyses of relative importance and mediation, we uti-lized matrices of the relevant estimated true score correlations thatwere derived with the procedures outlined above. For example,when analyzing the relative importance of job demands to burnout,we used a meta-analytic correlation matrix that included the true
score correlations of risks and hazards, complexity, physical de-mands, and burnout. We also utilized the harmonic means of thecell sample sizes according to procedures outlined by Viswesvaranand Ones (1995). Research investigating the use of meta-analyticcorrelation matrices in several simulation studies has found thatparameter estimates remain accurate and that goodness-of-fit in-dices such as the comparative fit index (CFI) and standardized rootmean square residual (SRMR) function well (Beretvas & Furlow,2006; Cheung & Chan, 2005; Furlow & Beretvas, 2005). Anotherconcern in using a meta-analytic correlation matrix is that differentstudies contribute to different cells in the matrix (i.e., sample sizevaries across cells). Research has found parameter estimates andchi-square tests to be biased when data in a meta-analytic matrixare missing not at random (Furlow & Beretvas, 2005; Naragon-Gainey, 2010). Potential limitations of meta-analytic correlationmatrices are noted in the current study.
Results
Job Demands–Job Resources Relationship WithBurnout and Engagement
Table 1 presents the correlation results for the relationship of jobdemands and job resources. Table 2 presents the correlation resultsfor the relationship of job demands and resources to burnout,engagement, and safety outcomes. Hypothesis 1 predicted that jobdemands would be positively related to burnout. Results showedthat both risks and hazards and complexity were significantlyrelated to burnout (rc � .28, rc � .24, respectively). Physicaldemands did not demonstrate a meaningful relationship with burn-out. Two of the three job demands were significantly related toburnout, thus partially supporting Hypothesis 1. Hypothesis 2predicted job demands would be negatively related to engagement.Risks and hazards and complexity were both significantly relatedto engagement (rc � �.67, rc � �.52, respectively), whereasphysical demands was not. Risks and hazards, physical demands,and complexity were also found to be significantly related tocompliance (rc � �.75, rc � �.24, rc � �.41, respectively).Physical demands and complexity were found to be significantlyrelated to satisfaction (rc � �.44, rc � �.36, respectively),whereas risks and hazards was not. In total, seven of the ninehypothesized relationships were significant, thus largely support-ing Hypothesis 2. The above pattern of results suggests support forthe JD-R model in that the majority of job demands were posi-tively related to burnout and negatively related to engagement.
Hypothesis 3 predicted that job resources would be positivelyrelated to engagement. There was strong support for this hypoth-esis in that knowledge, social support, leadership, and safetyclimate were all significantly related to engagement, compliance,and satisfaction (ranges from rc � .30 for autonomy–engagementto rc � .87 for social support–satisfaction). Hypothesis 4 predictedthat job resources would be negatively related to burnout. Again,the results provided strong support for this hypothesis in thatknowledge, autonomy, social support, leadership, and safety cli-mate all demonstrated significant relationships with burnout (rc ��.24, rc � �.39, rc � �.26, rc � �.36, rc � �.37, respectively).The above pattern of results again suggests support for the JD-Rmodel in that all of the job resources were positively related toengagement and negatively related to burnout.
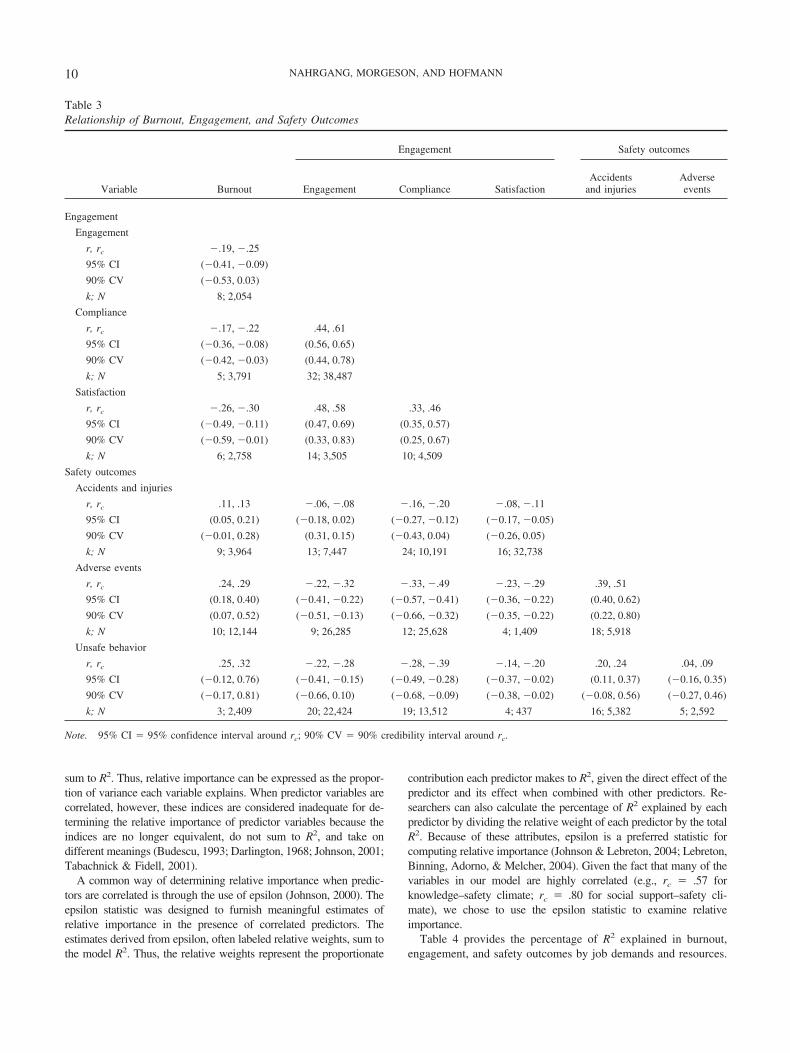
7SAFETY AT WORK

Relationship of Burnout and Engagementto Safety Outcomes
Table 3 presents the correlation results for the relationship ofburnout, engagement, and safety outcomes. Hypothesis 5 predictedthat burnout would be positively related to safety outcomes. Re-sults indicate that burnout was significantly related to accidentsand injuries (rc � .13) and adverse events (rc � .29) but was notsignificantly related to unsafe behavior. Thus, there was partialsupport for Hypothesis 5. Hypothesis 6 predicted that engagementwould be negatively related to safety outcomes. Engagement wasfound to be significantly related to adverse events and unsafebehavior (rc � �.32, rc � �.28, respectively), but was notsignificantly related to accidents and injuries. Compliance andsatisfaction were both significantly related to all three safetyoutcomes (ranges from rc � �.11 for satisfaction–accidents andinjuries to rc � �.49 for compliance–adverse events). In total,eight of the nine hypothesized relationships were significant, thuslargely supporting Hypothesis 6. This set of results also suggests
support for the JD-R model in that burnout was positively relatedto the majority of safety outcomes and engagement was negativelyrelated to the majority of safety outcomes.
Examining Relative Importance of Job Demands–JobResources, Burnout, and Engagement
We also sought to understand which job demands and resourcescontribute the most to burnout, engagement, and safety outcomes, aswell as whether burnout or engagement contributes the most to safetyoutcomes, by examining their relative importance. Relative impor-tance is defined as “the proportionate contribution each predictormakes to R2, considering both its direct effect (i.e., its correlation withthe criterion) and its effect when combined with the other variables inthe regression equation” (Johnson & Lebreton, 2004, p. 240). Relativeimportance of predictors is often examined through regression coef-ficients or zero-order correlations with the criterion. When predictorsare uncorrelated, these indices are appropriate for determining relativeimportance because they are equivalent and the squares of the indices
Table 1Relationship of Job Demands and Job Resources
Variable
Job demands Job resources
Risks and hazards Physical demands Complexity Knowledge Autonomy Social support Leadership
Job demands
Physical demandsr, rc .22, .3095% CI (0.12, 0.49)90% CV (�0.11, 0.71)k; N 12; 8,554
Complexityr, rc .15, .19 .15, .2095% CI (0.13, 0.26) (0.10, 0.29)90% CV (0.19, 0.19) (0.00, 0.39)k; N 2; 681 10; 20,396
Job resources
Knowledger, rc �.29, �.37 �.01, �.01 �.11, �.1495% CI (�0.44, �0.30) (�0.13, 0.11) (�0.30, 0.02)90% CV (�0.55, �0.18) (�0.39, 0.37) (�0.40, 0.12)k; N 17; 25,047 23; 13,013 7; 2,347
Autonomyr, rc �.12, �.16 �.13, �.17 �.31, �.40 .31, .4295% CI (�0.26, �0.05) (�0.34, �0.00) (�0.58, �0.23) (0.24, 0.61)90% CV (�0.21, �0.11) (�0.45, 0.11) (�0.67, �0.14) (0.12, 0.73)k; N 2; 770 7; 2,470 6; 1,671 7; 1,186
Social supportr, rc �.53, �.71 �.52, �.68 .28, .37 .33, .4095% CI (�0.80, �0.62) (�1.00, �0.36) (0.27, 0.48) (0.27, 0.53)90% CV (�0.92, �0.49) (�1.00, 0.04) (0.18, 0.57) (0.24, 0.55)k; N 14; 30,123 12; 18,391 9; 9,186 4; 1,638
Leadershipr, rc �.34, �.43 �.50, �.63 �.24, �.30 .36, .46 .33, .40 .58, .7495% CI (�0.52, �0.35) (�0.85, �0.41) (�0.45, �0.15) (0.37, 0.56) (0.33, 0.47) (0.68, 0.81)90% CV (�0.71, �0.16) (�1.00, 0.03) (�0.50, �0.10) (0.17, 0.75) (0.29, 0.50) (0.56, 0.93)k; N 24; 15,582 22; 20,730 5; 1,935 22; 9,528 6; 7,656 20; 25,863
Safety climater, rc �.47, �.60 �.38, �.48 �.33, �.42 .44, .57 .40, .51 .66, .80 .57, .6995% CI (�0.68, �0.51) (�0.65, �0.32) (�0.56, �0.29) (0.50, 0.64) (0.37, 0.65) (0.72, 0.89) (0.63, 0.76)90% CV (�0.95, �0.24) (�1.00, 0.22) (�0.66, �0.18) (0.23, 0.91) (0.25, 0.77) (0.50, 1.00) (0.38, 1.00)k; N 43; 51,823 44; 31,924 8; 3,384 55; 31,359 9; 2,430 31; 61,034 53; 29,114
Note. 95% CI � 95% confidence interval around rc; 90% CV � 90% credibility interval around rc.
8 NAHRGANG, MORGESON, AND HOFMANN

Tab
le2
Rel
atio
nshi
pof
Job
Dem
ands
–Job
Res
ourc
esto
Bur
nout
,E
ngag
emen
t,an
dSa
fety
Out
com
es
Var
iabl
eB
urno
ut
Eng
agem
ent
Safe
tyou
tcom
es
Eng
agem
ent
Com
plia
nce
Satis
fact
ion
Acc
iden
tsan
din
juri
esA
dver
seev
ents
Uns
afe
beha
vior
Job
dem
ands
Ris
ksan
dha
zard
sr,
r c.2
4,.2
8�
.48,
�.6
7�
.49,
�.7
5�
.08,
�.1
0.1
1,.1
3.2
9,.4
3.0
9,.1
295
%C
I(0
.18,
0.39
)(�
0.76
,�0.
59)
(�0.
90,�
0.59
)(�
0.25
,0.0
6)(0
.06,
0.20
)(0
.31,
0.55
)(0
.01,
0.23
)90
%C
V(0
.10,
0.46
)(�
0.92
,�0.
43)
(�.1
.00,
�0.
37)
(�0.
43,0
.23)
(�0.
09,0
.35)
(0.1
8,0.
68)
(�0.
17,0
.41)
k;N
8;3,
007
18;3
1,99
614
;27,
766
11;6
,757
21;2
8,31
510
;27,
807
16;6
,232
Phys
ical
dem
ands
r,r c
.01,
.01
�.1
2,�
.28
�.1
6,�
.24
�.3
4,�
.44
.07,
.09
.10,
.13
.19,
.28
95%
CI
(�0.
22,0
.24)
(�0.
49,0
.08)
(�0.
35,�
0.12
)(�
0.74
,�0.
15)
(0.0
5,0.
13)
(�0.
02,0
.29)
(0.1
3,0.
42)
90%
CV
(�0.
49,0
.51)
(�0.
89,0
.33)
(�0.
62,0
.14)
(�1.
00,0
.13)
(�0.
02,0
.20)
(�0.
22,0
.49)
(�0.
16,0
.72)
k;N
11;4
,890
21;1
1,28
424
;11,
668
9;29
,367
18;2
4,10
413
;5,6
8022
;9,7
77C
ompl
exity
r,r c
.19,
.24
�.3
9,�
.52
�.3
1,�
.41
�.2
8,�
.36
.08,
.11
.15,
.19
.30,
.43
95%
CI
(0.0
3,0.
44)
(0.7
1,�
0.33
)(�
0.66
,�0.
16)
(�0.
46,�
0.26
)(0
.02,
0.21
)(0
.13,
0.25
)(0
.22,
0.63
)90
%C
V(�
0.05
,0.5
2)(�
0.82
,�0.
22)
(�0.
77,�
0.06
)(�
0.46
,�0.
25)
(0.0
0,0.
23)
(0.1
9,0.
19)
(0.0
7,0.
78)
k;N
5;1,
467
6;2,
441
5;2,
071
5;75
65;
1,19
03;
1,05
47;
3,62
0Jo
bre
sour
ces
Kno
wle
dge
r,r c
�.1
9,�
.24
.35,
.47
.37,
.48
.28,
.37
�.0
7,�
.08
�.1
2,�
.16
.�.2
0,�
.25
95%
CI
(�0.
45,�
0.03
)(0
.42,
0.53
)(0
.41,
0.55
)(0
.22,
0.53
)(�
0.14
,�0.
03)
(�0.
26,�
0.07
)(�
0.39
,�0.
12)
90%
CV
(�0.
64,0
.15)
(0.2
6,0.
68)
(0.2
1,0.
75)
(0.0
1,0.
73)
(�0.
27,0
.09)
(�0.
38,0
.05)
(�0.
67,0
.17)
k;N
8;3,
467
33;1
9,75
036
;18,
154
13;4
,457
28;3
1,49
113
;4,3
4723
;13,
121
Aut
onom
yr,
r c�
.30,
�.3
9.2
4,.3
0.2
8,.3
7�
.07,
�.0
9�
.23,
�.3
5�
.14,
�.1
895
%C
I(�
0.44
,�0.
35)
(0.1
3,0.
48)
—(0
.32,
0.42
)(�
0.17
,�0.
01)
(�0.
59,�
0.11
)(�
0.28
,�0.
07)
90%
CV
(�0.
39,�
0.39
)(0
.08,
0.53
)(0
.29,
0.46
)(�
0.23
,0.0
4)(�
0.61
,�0.
08)
(�0.
29,�
0.06
)k;
N5;
1,55
65;
616
8;23
,169
6;23
,767
3;82
24;
1,01
7So
cial
supp
ort
r,r c
�.2
2,�
.26
.51,
.69
.50,
.67
.68,
.87
�.3
7,�
.44
�.2
8,�
.38
�.2
5,�
.35
95%
CI
(�0.
36,�
0.15
)(0
.63,
0.75
)(0
.60,
0.74
)(0
.64,
1.00
)(�
0.74
,�0.
14)
(�0.
51,�
0.25
)(�
0.47
,�0.
24)
90%
CV
(�0.
40,�
0.11
)(0
.53,
0.84
)(0
.56,
0.78
)(0
.57,
1.00
)(�
0.99
,0.1
1)(�
0.63
,�0.
14)
(�0.
56,�
0.14
)k;
N6;
2,16
817
;43,
935
6;27
,518
4;13
,367
8;3,
218
8;26
,332
8;16
,480
Lea
ders
hip
r,r c
�.3
2,�
.36
.48,
.63
.44,
.59
.70,
.86
�.1
2,�
.14
�.1
8,�
.22
�.2
3,�
.32
95%
CI
(�0.
45,�
0.28
)(0
.55,
0.71
)(0
.50,
0.68
)(0
.73,
0.99
)(�
0.23
,�0.
05)
(�0.
28,�
0.15
)(�
0.42
,�0.
23)
90%
CV
(�0.
53,�
0.20
)(0
.34,
0.92
)(0
.31,
0.87
)(0
.61,
1.00
)(�
0.45
,0.1
7)(�
0.39
,�0.
05)
(�0.
55,�
0.10
)k;
N9;
14,4
6132
;17,
157
22;1
3,95
49;
20,6
6328
;17,
849
17;1
5,88
014
;9,2
75Sa
fety
clim
ate
r,r c
�.1
8,�
.37
.54,
.80
.53,
.71
.57,
.70
�.1
9,�
.24
�.2
9,�
.38
�.3
0,�
.45
95%
CI
(�0.
62,�
0.11
)(0
.56,
1.00
)(0
.64,
0.78
)(0
.59,
0.81
)(�
0.30
,�0.
17)
(�0.
45,�
0.31
)(�
0.54
,�0.
35)
90%
CV
(�1.
00,0
.33)
(�0.
39,1
.00)
(0.4
0,1.
00)
(0.3
5,1.
00)
(�0.
49,0
.02)
(�0.
59,�
0.17
)(�
0.81
,�0.
08)
k;N
18;1
0,04
958
;58,
118
47;4
6,71
523
;22,
367
45;1
9,29
523
;31,
484
34;2
8,30
7
Not
e.95
%C
I�
95%
conf
iden
cein
terv
alar
ound
r c;
90%
CV
�90
%cr
edib
ility
inte
rval
arou
ndr c
.
9SAFETY AT WORK
sum to R2. Thus, relative importance can be expressed as the propor-tion of variance each variable explains. When predictor variables arecorrelated, however, these indices are considered inadequate for de-termining the relative importance of predictor variables because theindices are no longer equivalent, do not sum to R2, and take ondifferent meanings (Budescu, 1993; Darlington, 1968; Johnson, 2001;Tabachnick & Fidell, 2001).
A common way of determining relative importance when predic-tors are correlated is through the use of epsilon (Johnson, 2000). Theepsilon statistic was designed to furnish meaningful estimates ofrelative importance in the presence of correlated predictors. Theestimates derived from epsilon, often labeled relative weights, sum tothe model R2. Thus, the relative weights represent the proportionate
contribution each predictor makes to R2, given the direct effect of thepredictor and its effect when combined with other predictors. Re-searchers can also calculate the percentage of R2 explained by eachpredictor by dividing the relative weight of each predictor by the totalR2. Because of these attributes, epsilon is a preferred statistic forcomputing relative importance (Johnson & Lebreton, 2004; Lebreton,Binning, Adorno, & Melcher, 2004). Given the fact that many of thevariables in our model are highly correlated (e.g., rc � .57 forknowledge–safety climate; rc � .80 for social support–safety cli-mate), we chose to use the epsilon statistic to examine relativeimportance.
Table 4 provides the percentage of R2 explained in burnout,engagement, and safety outcomes by job demands and resources.
Table 3Relationship of Burnout, Engagement, and Safety Outcomes
Variable Burnout
Engagement Safety outcomes
Engagement Compliance SatisfactionAccidents
and injuriesAdverseevents
Engagement
Engagement
r, rc �.19, �.25
95% CI (�0.41, �0.09)
90% CV (�0.53, 0.03)
k; N 8; 2,054
Compliance
r, rc �.17, �.22 .44, .61
95% CI (�0.36, �0.08) (0.56, 0.65)
90% CV (�0.42, �0.03) (0.44, 0.78)
k; N 5; 3,791 32; 38,487
Satisfaction
r, rc �.26, �.30 .48, .58 .33, .46
95% CI (�0.49, �0.11) (0.47, 0.69) (0.35, 0.57)
90% CV (�0.59, �0.01) (0.33, 0.83) (0.25, 0.67)
k; N 6; 2,758 14; 3,505 10; 4,509
Safety outcomes
Accidents and injuries
r, rc .11, .13 �.06, �.08 �.16, �.20 �.08, �.11
95% CI (0.05, 0.21) (�0.18, 0.02) (�0.27, �0.12) (�0.17, �0.05)
90% CV (�0.01, 0.28) (0.31, 0.15) (�0.43, 0.04) (�0.26, 0.05)
k; N 9; 3,964 13; 7,447 24; 10,191 16; 32,738
Adverse events
r, rc .24, .29 �.22, �.32 �.33, �.49 �.23, �.29 .39, .51
95% CI (0.18, 0.40) (�0.41, �0.22) (�0.57, �0.41) (�0.36, �0.22) (0.40, 0.62)
90% CV (0.07, 0.52) (�0.51, �0.13) (�0.66, �0.32) (�0.35, �0.22) (0.22, 0.80)
k; N 10; 12,144 9; 26,285 12; 25,628 4; 1,409 18; 5,918
Unsafe behavior
r, rc .25, .32 �.22, �.28 �.28, �.39 �.14, �.20 .20, .24 .04, .09
95% CI (�0.12, 0.76) (�0.41, �0.15) (�0.49, �0.28) (�0.37, �0.02) (0.11, 0.37) (�0.16, 0.35)
90% CV (�0.17, 0.81) (�0.66, 0.10) (�0.68, �0.09) (�0.38, �0.02) (�0.08, 0.56) (�0.27, 0.46)
k; N 3; 2,409 20; 22,424 19; 13,512 4; 437 16; 5,382 5; 2,592
Note. 95% CI � 95% confidence interval around rc; 90% CV � 90% credibility interval around rc.
10 NAHRGANG, MORGESON, AND HOFMANN

Results indicate that largest percentage of variance in burnout wasexplained by risks and hazards (57.1%), followed by complexity(38.9%). The largest percentage of variance for engagement andcompliance was explained by risk and hazards (60.9% and 78.0%,respectively), whereas the largest percentage of variance in satis-faction was explained by physical demands (60.5%). Risks andhazards explained the largest percentage of variance for accidentsand injuries and for adverse events (50.0% and 84.8%, respec-tively), whereas complexity explained the largest percentage ofvariance in unsafe behavior (72.8%). The results of the relativeimportance analysis indicate that risks and hazards was the jobdemand that contributed the most to burnout, engagement, andsafety outcomes.
In terms of job resources, results in Table 4 indicate that safetyclimate explained the largest percentage of variance in engagement(42.0%) and compliance (34.0%), followed closely by social sup-port, which explained 24.9% of the variance in engagement and29.1% of the variance in compliance. For satisfaction, leadershipexplained the largest percentage of variance (37.9%), followedclosely by social support (37.3%). Results also demonstrated thatthe largest percentage of variance in burnout was explained byautonomy (36.6%), followed by leadership (25.0%) and safetyclimate (22.8%). For accidents and injuries, the largest percentageof variance was explained by social support (65.5%), followed byleadership and safety climate (15.5% for both). The largest per-centage of variance in adverse events also was explained by socialsupport (31.6%), followed closely by autonomy (30.7%) andsafety climate (26.2%). For unsafe behavior, safety climate ex-plained the largest percentage of variance (49.8%). The results ofthe relative importance analysis for job resources indicate thatsocial support and safety climate are key job resources that con-tribute the most to burnout, engagement, and safety outcomes.Given the high correlation (rc � .80) of social support and safetyclimate, it is perhaps difficult to discriminate between the two;thus, they may be best thought of as two facets of a supportiveenvironment.
The results of the relative importance analysis of burnout andengagement in explaining variance in safety outcomes can be seenin Table 5. In all three categories of safety outcomes, burnout and
compliance explained the largest percentage of variance. For ac-cidents and injuries, compliance explained 62.3% and burnoutexplained 20.8% of variance. For adverse events, complianceexplained 59.1% and burnout explained 18.1% of variance. Fi-nally, for unsafe behavior, compliance explained 46.5% and burn-out explained 34.3% of variance. Overall, the results indicate thatcompliance contributes the most to safety outcomes, but burnoutalso accounts for a substantial amount of variance in safety out-comes. Table 6 summarizes results of the correlation and relativeimportance analyses.
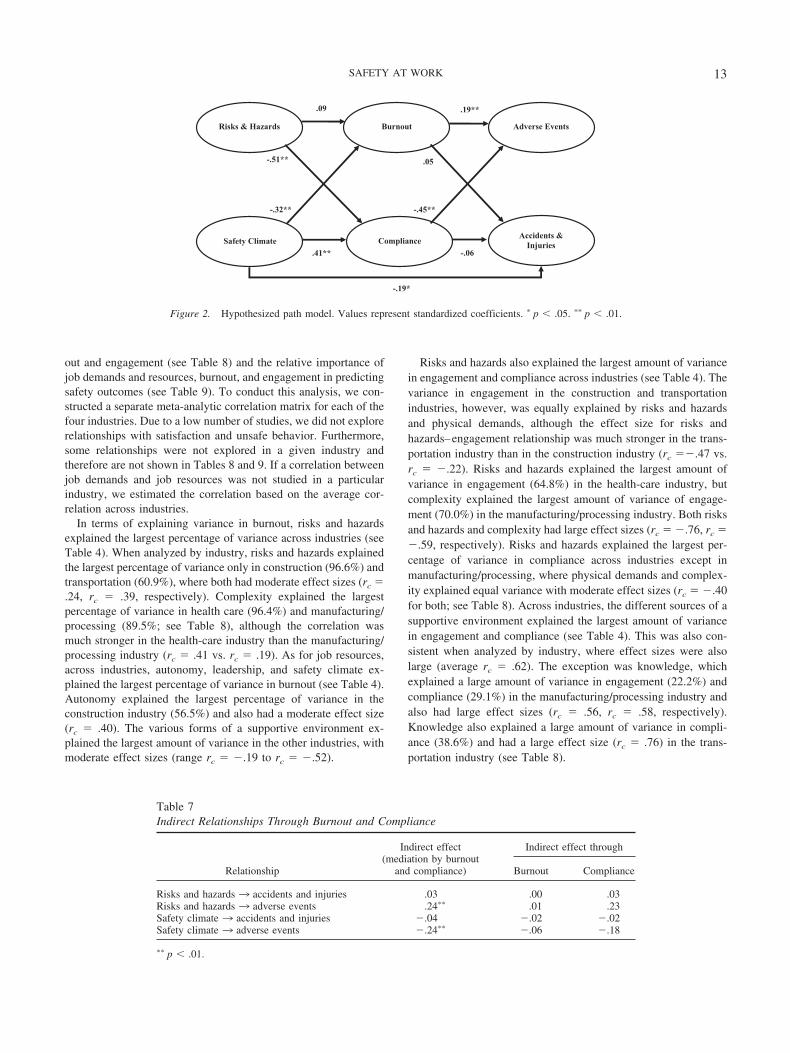
Mediation
Hypotheses 7a and 7b predicted that burnout would mediate therelationship between job demands and resources and safety out-comes, respectively. Hypothesis 8a and 8b predicted that engage-ment would mediate the relationship between job demands andresources and safety outcomes, respectively. In order to formallytest these hypotheses, we estimated a meta-analytic path modelincluding the job demand (i.e., risks and hazards), job resource(i.e., safety climate), and engagement (i.e., compliance) that ex-plained the largest amount of variance in the mediators and/or
Table 4Relative Importance of Job Demands–Job Resources in Predicting Burnout, Engagement, and Safety Outcomes
Variable Burnout
Engagement Safety outcomes
Engagement Compliance Satisfaction Accidents and injuries Adverse events Unsafe behavior
Job demandsRisks and hazards 57.1� 60.9� 78.0� 1.8 50.0� 84.8� 2.2�
Physical demands 4.0 5.1 3.6� 60.5� 15.4� 3.6 25.0�
Complexity 38.9� 34.0� 18.4� 37.7� 34.6� 11.7� 72.8�
Job demands total R2 .13 .61 .64 .28 .03 .20 .22Job resources
Knowledge 6.0� 10.9� 15.3� 3.9� 1.6� 3.3� 10.1�
Autonomy 36.6� 3.6� 3.3�† 3.9� 1.9� 30.7� 4.3�
Social support 9.5� 24.9� 29.1� 37.3� 65.5� 31.6� 15.5�
Leadership 25.0� 18.8� 18.3� 37.9� 15.5� 8.1� 20.3�
Safety climate 22.8� 42.0� 34.0� 17.0� 15.5� 26.2� 49.8�
Job resources total R2 .23 .67 .58 .85 .32 .22 .21
Note. Values are %R2, unless otherwise specified. An asterisk indicates that the 95% confidence interval does not cross zero; a dagger indicates thatpercentage is based on k � 1.
Table 5Relative Importance of Burnout and Engagement in PredictingSafety Outcomes
Variable
Safety outcomes
Accidents andinjuries Adverse events Unsafe behavior
Burnout 20.8� 18.1� 34.3Engagement
Engagement 7.5 12.7� 14.1�
Compliance 62.3� 59.1� 46.5�
Satisfaction 9.4� 10.1� 5.2�
Total R2 .05 .28 .21
Note. Values are %R2, unless otherwise specified. An asterisk indicatesthat the 95% confidence interval does not cross zero.
11SAFETY AT WORK

outcomes (see Figure 2). In the case of job resources, we chose touse safety climate versus social support, given that their correlationwas high and that the larger number of studies included in safetyclimate would produce a more stable estimate. We input matricesof the relevant estimated true score correlations into LISREL 8.72(Jöreskog & Sörbom, 2002).
We specified a model, consistent with the JD-R model, in whichrisks and hazards and safety climate related to burnout and com-pliance, which in turn related to accidents and injuries and adverseevents (see Figure 2). In order to test mediation, we simultaneouslytested the direct and indirect paths of the independent variableson the dependent variables. Mediation can be inferred from the testif the indirect path is significant. We also allowed the disturbanceterms on accidents and injuries and adverse events to correlate,given that theoretically they represent a broader safety outcomeconstruct and empirically they are highly correlated (rc � .51).
Results of the structural model fit the data relatively well,�2(1) � 3.59, CFI � .99, SRMR � .02, root mean square error ofapproximation (RMSEA) � .12. The relationship between safetyclimate and accidents and injuries was the only direct relationshipbetween the independent and dependent variables that approachedsignificance (� � �.18, p � .10). Therefore, we specified asecond structural model, nested within the first, in which weeliminated the three other direct effects of the independent vari-ables on the dependent variables but kept the direct path fromsafety climate to accidents and injuries. Results of this modelshowed a good fit, �2(4) � 7.07, CFI � .99, SRMR � .02,RMSEA � .06. The fit of this model to the data is not significantlydifferent from that of the first model, ��2(3) � 3.48, p � .10, andthus the second structural model is superior because it is moreparsimonious and fits the data equally well.
The standardized path estimates from the model are depicted inFigure 2. Risks and hazards were significantly related to compli-ance (� � �.51). Safety climate was significantly related tocompliance (� � .41), burnout (� � �.32), and accidents andinjuries (� � �.19). Burnout was significantly related to adverseevents (� � .19), as was compliance (� � �.45), but neither
burnout nor compliance was significantly related to accidents andinjuries.
Table 7 presents the results of the examination of the indirecteffects. Neither the indirect path of risks and hazards nor that ofsafety climate to accidents and injuries was significant. The indi-rect path for risks and hazards to adverse events was significant(� � .24), as was the indirect path for safety climate to adverseevents (� � �.24). Effects decomposition shows that compliancewas the primary mediator, although a Sobel (1982) test of theindirect effect of safety climate on adverse events through burnoutwas significant ( p � .05).1 Based on these results, there wassupport for partial mediation for adverse events in Hypotheses 7b,8a, and 8b. Although Hypothesis 7a was not supported in theresults of the path model, meta-analytic regression results did findthat burnout partially mediated ( p � .05) the relationship betweenjob demands and adverse events. Furthermore, although the effectsof safety climate on adverse events were partially mediated bycompliance and burnout, safety climate also had a direct effect onaccidents and injuries.
Generalization Within and Across Industries
Our final analysis concerned the extent to which relationships ofjob demands and resources with burnout, compliance, and safetyoutcomes generalize across industry. Thus, we analyzed the rela-tive importance of job demands and resources in predicting burn-
1 The Sobel (1982) formula, in which the estimate of the mediationeffect is divided by its standard error and this value is compared to astandard normal distribution, is the most commonly used method fortesting the significance of the mediation variable effect. Simulation studieshave found the Sobel method produces accurate estimates of the standarderrors. Although it has less power than some methods, it also has moreaccurate Type I error rates than other methods. Thus, choosing othermethods for determining statistical significance of the mediation variable isunlikely to change the results of the analysis (MacKinnon, Lockwood,Hoffman, West, & Sheets, 2002).
Table 6Summary of Relationships for JD-R Model in Context of Safety
Variable Burnout Engagement Compliance Satisfaction Accidents and injuries Adverse events Unsafe behavior
Job demandsRisks and hazards � � � � � � Physical demands � � � � Complexity � � � � �
Job resourcesKnowledge � � � �Autonomy � � � � � �Social support � � � � � � �Leadership � � � � �Safety climate � � � � � �
Burnout Engagement
Engagement � �Compliance � � � � � � � � �Satisfaction � � �
Note. Includes only relationships in which 95% confidence interval does not cross zero. or � indicates direction of relationship, with representingpositive relationship and � representing negative relationship. or � � � explains � 50% of variance; or � � explains 25%–49% of variance; or � explains 0%–24% of variance. JD-R model � job demands–resources model.
12 NAHRGANG, MORGESON, AND HOFMANN
out and engagement (see Table 8) and the relative importance ofjob demands and resources, burnout, and engagement in predictingsafety outcomes (see Table 9). To conduct this analysis, we con-structed a separate meta-analytic correlation matrix for each of thefour industries. Due to a low number of studies, we did not explorerelationships with satisfaction and unsafe behavior. Furthermore,some relationships were not explored in a given industry andtherefore are not shown in Tables 8 and 9. If a correlation betweenjob demands and job resources was not studied in a particularindustry, we estimated the correlation based on the average cor-relation across industries.
In terms of explaining variance in burnout, risks and hazardsexplained the largest percentage of variance across industries (seeTable 4). When analyzed by industry, risks and hazards explainedthe largest percentage of variance only in construction (96.6%) andtransportation (60.9%), where both had moderate effect sizes (rc �.24, rc � .39, respectively). Complexity explained the largestpercentage of variance in health care (96.4%) and manufacturing/processing (89.5%; see Table 8), although the correlation wasmuch stronger in the health-care industry than the manufacturing/processing industry (rc � .41 vs. rc � .19). As for job resources,across industries, autonomy, leadership, and safety climate ex-plained the largest percentage of variance in burnout (see Table 4).Autonomy explained the largest percentage of variance in theconstruction industry (56.5%) and also had a moderate effect size(rc � .40). The various forms of a supportive environment ex-plained the largest amount of variance in the other industries, withmoderate effect sizes (range rc � �.19 to rc � �.52).
Risks and hazards also explained the largest amount of variancein engagement and compliance across industries (see Table 4). Thevariance in engagement in the construction and transportationindustries, however, was equally explained by risks and hazardsand physical demands, although the effect size for risks andhazards–engagement relationship was much stronger in the trans-portation industry than in the construction industry (rc ��.47 vs.rc � �.22). Risks and hazards explained the largest amount ofvariance in engagement (64.8%) in the health-care industry, butcomplexity explained the largest amount of variance of engage-ment (70.0%) in the manufacturing/processing industry. Both risksand hazards and complexity had large effect sizes (rc � �.76, rc ��.59, respectively). Risks and hazards explained the largest per-centage of variance in compliance across industries except inmanufacturing/processing, where physical demands and complex-ity explained equal variance with moderate effect sizes (rc � �.40for both; see Table 8). Across industries, the different sources of asupportive environment explained the largest amount of variancein engagement and compliance (see Table 4). This was also con-sistent when analyzed by industry, where effect sizes were alsolarge (average rc � .62). The exception was knowledge, whichexplained a large amount of variance in engagement (22.2%) andcompliance (29.1%) in the manufacturing/processing industry andalso had large effect sizes (rc � .56, rc � .58, respectively).Knowledge also explained a large amount of variance in compli-ance (38.6%) and had a large effect size (rc � .76) in the trans-portation industry (see Table 8).
Adverse EventsRisks & Hazards
Safety Climate
Burnout
Compliance
.09
.05
.41**
-.51**
-.32**
-.06
Accidents & Injuries
-.45**
.19**
-.19*
Figure 2. Hypothesized path model. Values represent standardized coefficients. � p � .05. �� p � .01.
Table 7Indirect Relationships Through Burnout and Compliance
Relationship
Indirect effect(mediation by burnout
and compliance)
Indirect effect through
Burnout Compliance
Risks and hazards 3 accidents and injuries .03 .00 .03Risks and hazards 3 adverse events .24�� .01 .23Safety climate 3 accidents and injuries �.04 �.02 �.02Safety climate 3 adverse events �.24�� �.06 �.18
�� p � .01.
13SAFETY AT WORK

Risks and hazards explained the largest amount of variance inaccidents and injuries and adverse events across industries (seeTable 4). For accidents and injuries, this was also true in construc-tion (61.0%) and transportation (50.0%), although the effect size inthe construction industry was much stronger than in the transpor-tation industry (rc � .17 vs. rc � .06). In the health-care industry,physical demands explained the largest amount of variance(52.0%) but had an effect size (rc � .22) similar to that intransportation. Risks and hazards also explained the largest amountof variance in adverse events in construction (57.1%) and healthcare (72.6%), although the effect size was much stronger in thehealth-care industry than the construction industry (rc � .45 vs.rc � .18). Physical demands explained the largest amount ofvariance in the manufacturing/processing industry (54.4%) andhad an effect size of rc � .23 (see Table 9). The various forms ofa supportive environment explained the largest amount of variancein accidents and injuries and adverse events across industries (seeTable 4). This pattern was consistent in the industry analysisexcept in the construction and manufacturing/processing indus-tries, where autonomy explained the largest amount of variance inadverse events (45.5% and 84.8%, respectively). Overall, effectsizes were moderate in terms of the relationship of the various
forms of a supportive environment to accidents and injuries andadverse events.
Finally, we investigated the amount of variance in accidents andinjuries and adverse events explained by burnout and engagement.Across industries, burnout and compliance explained the largestamount of variance in accidents and injuries and adverse events(see Table 5). When analyzed by industry, this pattern was alsoconsistent, and the effect sizes were moderate (see Table 9).Overall, the results of the industry analysis demonstrate that thejob demands that explain the most variance in burnout, engage-ment, and safety outcomes differ by industry, but that a supportiveenvironment explains the most variance consistently across indus-tries. Burnout and compliance also explain the most variance in allindustries and thus may be the primary mechanisms through whichjob demands and resources influence safety outcomes.
Discussion
We sought to develop and meta-analytically test the linkbetween job demands and resources and burnout, engagement,and safety outcomes in the workplace. Using the JD-R model(Bakker & Demerouti, 2007; Demerouti et al., 2001), we cate-
Table 8Relative Importance of Job Demands–Job Resources in Predicting Burnout and Engagement Across Industry
Variable
Burnout
Engagement
Engagement Compliance
Const Health Manu Trans Const Health Manu Trans Const Health Manu Trans
Risks and hazards%R2 96.6�† — 2.6 60.9� 47.1�† 64.8� 19.2� 47.8� 71.9� 67.8�† 2.3 100.0rc .24 — .02 .39 �.22 �.76 �.40 �.47 �.16 �.89 �.14 �.20
Physical demands%R2 3.4† 3.6 7.9† 39.1� 52.9 18.8 10.8� 52.2�† 28.1 24.0 48.8� —rc .06 .11 �.07 .33 �.23 �.16 �.22 .50 �.11 �.08 �.40 —
Complexity%R2 — 96.4�† 89.5� — — 16.4� 70.0� — — 8.2� 48.8�† —rc — .41 .19 — — �.47 �.59 — — �.41 �.40 —
Job demands total R2 0.06 0.17 0.04 0.20 0.09 1.00 0.46 0.67 0.03 1.00 0.39 0.04
Knowledge%R2 5.7�† 3.2 18.3 — 10.6� 6.9� 22.2� 13.1 5.0� 3.6� 29.1� 38.6�†
rc �.14 �.05 �.02 — .48 .35 .56 .14 .41 .28 .58 .76Autonomy
%R2 56.5�† — 24.6� — — — 10.8� 2.4� — — — —rc .40 — �.42 — — — .44 .18 — — — —
Social support%R2 13.3�† 40.2�† 16.0�† 85.1�† 49.3�† 29.4� 10.6� 5.2 23.3�† 28.2� 27.5�† —rc �.16 .26 �.46 �.52 .80 .70 .48 .12 .11 .69 .62 —
Leadership%R2 — 34.1� 18.3�† 6.6�† 16.9� 32.3� 27.5� 44.4� 50.1� 32.5� 22.2� 20.4�†
rc — �.46 �.47 �.20 .70 .70 .62 .67 .62 .69 .59 .60Safety climate
%R2 24.5� 22.5� 22.9�† 8.3� 23.2� 32.3� 28.9� 34.9� 21.5� 35.6� 21.2� 41.0�
rc �.22 �.21 �.49 �.19 .68 .71 .65 .59 .53 .72 .61 .75
Job resources total R2 0.68 1.00 0.52 0.29 0.88 0.57 0.51 0.93 0.79 0.58 0.50 0.71
Note. A dash indicates that relative importance could not be calculated due to low number or absence of studies. An asterisk indicates that the 95%confidence interval does not cross zero; a dagger indicates that percentage is based on k � 1.� Const � construction; Health � health care; Manu � manufacturing/processing; Trans � transportation.
14 NAHRGANG, MORGESON, AND HOFMANN

gorized the conditions related to workplace safety into jobdemands and job resources. We found, consistent with the JD-Rmodel, that job demands such as risks and hazards and com-plexity impair employees’ health and lead to burnout. Likewise,we found support for job resources such as knowledge, auton-omy, and a supportive environment motivating employees to-ward higher engagement. Job demands were also found tohinder an employee’s progress toward engagement, whereas jobresources were found to mitigate burnout. Finally, we foundthat burnout was detrimental to working safely but that engage-ment motivated employees toward working safely. Tests ofmediation suggest that the health impairment process and the
motivational process proposed by the JD-R model are bothmechanisms through which job demands and resources influ-ence safety outcomes.
We also examined which job demands and resources contributethe most to burnout, engagement, and safety outcomes. We foundthat across industries, risks and hazards was the most consistentjob demand in terms of explaining variance in burnout, engage-ment, and safety outcomes. A supportive environment, whetherfrom social support, leadership, or safety climate, was also con-sistent in explaining variance across these same outcomes. Whenanalysis was by industry, we did find that the type of job demandthat explained the most variance differed by industry, whereas a
Table 9Relative Importance of Job Demands–Job Resources, Burnout, and Engagement in Predicting Safety Outcomes Across Industry
Variable
Safety outcomes
Accidents and injuries Adverse events
Const Health Manu Trans Const Health Manu Trans
Risks and hazards%R2 61.0�† 13.3† 66.7 50.0� 57.1�† 72.6� 2.6 —rc .17 .07 .18 .06 .18 .45 .07 —
Physical demands%R2 39.0� 52.0� 28.6� 50.0 42.9�† 21.5 54.4� 100.0rc .14 .22 .14 .06 .16 .08 .23 .27
Complexity%R2 — 34.7� 4.8† — — 6.0� 43.0�† —rc — .20 �.02 — — .17 .20 —
Job demands total R2 .04 .10 .04 .06 .05 .37 .11 .07
Knowledge%R2 30.4� 4.3� 4.7� 9.7� 36.4�† 6.3� 6.9� —rc �.17 �.07 �.25 �.06 �.20 �.17 �.25 —
Autonomy%R2 13.0�† 23.9�† 10.3† — 45.5�† 20.0�† 84.8�† —rc �.14 �.23 .08 — �.21 �.28 �.80 —
Social support%R2 15.2�† — 63.5� — 6.1† — — 89.3�†
rc �.13 — �.97 — �.02 — — .56Leadership
%R2 — 55.4� 9.8� 83.9� — 12.1� 3.2� —rc — �.29 �.40 �.16 — �.20 �.21 —
Safety climate%R2 41.3� 16.3� 11.7� 6.5 12.1† 61.6� 5.1� 10.7rc �.20 �.20 �.34 �.02 �.07 �.40 �.27 .11
Job resources total R2 .05 .09 1.00 .03 .10 .19 .71 .38
Burnout%R2 80.3� 10.4 — 80.0� 72.9† 27.7� — 100.0rc .28 .07 — .21 .33 .30 — .19
Engagement%R2 16.4� 22.6† 28.3 — — 12.1� 22.0† —rc �.18 .02 �.21 — — �.33 �.18 —
Compliance%R2 3.3� 67.0� 71.7� 20.0� 27.1�† 60.1� 78.0� —rc �.11 �.21 �.29 �.12 �.22 �.51 �.28 —
Burnout and engagement total R2 .12 .11 .09 .05 .13 .40 .08 .04
Note. A dash indicates that relative importance could not be calculated due to low number or absence of studies. An asterisk indicates that the 95%confidence interval does not cross zero; a dagger indicates that percentage is based on k � 1. Const � construction; Health � health care; Manu �manufacturing/processing; Trans � transportation.
15SAFETY AT WORK

supportive environment remained consistent in explaining themost variance in all industries.
Theoretical Contributions
Our research makes three important theoretical contributions.First, by drawing from the JD-R model we were able to provide anintegrative theoretical framework that can account for the variousjob demands and resources present in the working environmentand their relationship to safety outcomes. This allowed us toinvestigate the health impairment and motivational processesthrough which job demands and resources relate to workplacesafety, which have not been explored in past meta-analytic sum-maries. We found support for both processes. Job demands werepositively related to burnout, which in turn was positively relatedto accidents and injuries and adverse events, reflecting a healthimpairment process. Job resources were positively related to en-gagement, which in turn was positively related to safety outcomes,reflecting a motivational process.
Second, we are the first to examine the relative importance ofthe factors related to workplace safety. Although there are a varietyof job demands and resources, we were able to identify whichparticular job demand and job resource contributed the most toburnout, engagement, and safety outcomes. This is an importantcontribution, as executives believe the best way to improve safetyis through providing relevant training (Huang, Leamon, Courney,Chen, & DeArmond, 2007). The results of our study suggest thatreducing risks and hazards and establishing a supportive environ-ment are among the best ways to improve safety.
Third, the current study clarifies potential questions regardingconstruct validity in the safety literature. The first relates to thediscriminant validity of the constructs of engagement, compliance,and unsafe behavior. As the JD-R model suggests, employeeengagement and compliance represent two forms of engagement.We found that these two constructs are related (rc � .57) and thatjob demands and resources explain relatively equal amount ofvariance in engagement and compliance. Compliance, however,explains the largest amount of variance in safety outcomes, dem-onstrating that compliance is a key engagement construct in theJD-R model. Unsafe behavior is categorized as an outcome underthe JD-R model and showed only moderate relationships withengagement and compliance, thus demonstrating it is a separateconstruct both theoretically and empirically.
The second question regarding construct validity is the discrimi-nant validity of safety climate. One of the job resources is asupportive environment, which can be further delineated in termsof the source of the support, whether from the broader socialenvironment, leadership, or safety climate. The JD-R model cate-gorizes all of these as job resources, and empirically we found theconstructs to be highly related to one another (range rc � .69 torc � .80). Although there were differences in terms of which formof a supportive environment explained the most variance in safetyoutcomes, we believe that organizations would best improve safetyby creating a supportive environment that encompasses all sourcesof support rather than focusing on the various forms of a support-ive environment.
The third construct validity question relates to the predictivevalidity of job demands, job resources, burnout, and engagement.We found that job demands explained relatively little variance in
accidents and injuries (R2 � .03) compared to job resources (R2 �.32) but that job demands and resources explained a similaramount of variance in adverse events (R2 � .20 and R2 � .22,respectively). Burnout and engagement explained a small amountof variance in accidents and injuries (R2 � .05) compared toadverse events (R2 � .28). The mediation analysis showed that therelationship of risks and hazards to adverse events was mediatedthrough compliance, and that burnout and compliance mediatedthe relationship between safety climate and adverse events. Safetyclimate was also found to have a direct relationship with accidentsand injuries. Thus, it appears job demands hinder employee com-pliance, whereas job resources enhance employee motivation tocomply and mitigate burnout. Accidents and injuries, however,may be best prevented by job resources such as a supportiveenvironment.
Practical Implications
Our results have important practical implications for organiza-tions. First, we found that risks and hazards, physical demands,and complexity relate to burnout, engagement, and safety out-comes but that risks and hazards is the key job demand in terms ofexplaining the most variance. This suggests that organizationswould benefit from performing risk assessments in order to findways to mitigate or avoid the risks and hazards inherent in theirparticular setting. Although risks and hazards were importantacross industries, there was variability in the importance of theother job demands across industries. This suggests that managerscould use our results to identify which job demands are the mostimportant in their particular setting and use that information as astarting point in designing targeted interventions.
Second, although executives believe training is the key safetyintervention (Huang et al., 2007), our results suggest that organi-zations should consider creating a supportive environment foremployees. Organizations can develop this supportive environ-ment by training supervisors to be better leaders, emphasizing theimportance of teamwork and social support, and establishing thevalue of safety. Our results demonstrate that establishing a sup-portive environment will benefit organizations across industries.
Third, the study suggests the importance of recognizing that jobdemands and resources have broader implications than safetyoutcomes. Job demands exhaust employees, lead to burnout, andhinder engagement. Fortunately, job resources motivate employeestowards engagement and mitigate burnout. By creating a support-ive environment, organizations are not just achieving a safe work-place but are potentially increasing the motivation and health oftheir employees.
Comparison to Previous Meta-Analyses
The most recent quantitative summary of the safety literaturefocused on the person- and situation-based antecedents of safety(Christian et al., 2009). Our findings differ in three importantways. First, Christian et al. did not include articles in which the jobor outcome was driving related, nor did they include unpublishedstudies. We addressed these important limitations. As a result, ourresearch includes more than twice as many independent samples astheirs did and offers the most complete and accurate estimates ofsafety-related relationships. By excluding driving-related jobs and
16 NAHRGANG, MORGESON, AND HOFMANN

outcomes, Christian et al. omitted the majority of research con-ducted in the transportation industry. This omission is notablebecause we found that risks and hazards are particularly importantin terms of explaining variance in engagement and accidents andinjuries in the transportation industry. This finding contrasts withresearch that has shown relatively weak relationships for thesesame constructs. We also found that the largest amount of variancein accidents and injuries in the transportation industry is explainedby leadership rather than safety climate, which is another keydifference from past research (Christian et al., 2009). Thus, thecomprehensiveness of our review allowed us to explore the rela-tionships across all industries and discover that there were indeedimportant differences across industries.
Second, it has been suggested that safety knowledge is morestrongly related to compliance and participation than is safetyclimate (Christian et al., 2009). Although we also found thatknowledge and safety climate were positively related to compli-ance and engagement (which includes participation), the results ofour relative importance analysis suggest that safety climate, ratherthan knowledge, was the job resource that explained the largestamount of variance in compliance and engagement. The results ofthese analyses are important because the use of the epsilon statistictakes into account the correlation between the two predictors(Johnson, 2000). Given that knowledge and safety climate arepositively related (rc � .57), it is important to take into account theproportionate contribution each makes to the total variance ex-plained, when each of their direct effects and their effect whencombined are considered.
Third, previous investigations excluded complexity and burnout(Christian et al., 2009), which were found to be important con-structs in the current study. Although risks and hazards was aconsistent job demand in relation to burnout, engagement, andsafety outcomes, in certain industries, such as health care andmanufacturing/processing, complexity explained a large amount ofvariance in these outcomes. By including burnout, we were able toexamine the health impairment process in which job demands candeplete an employee’s mental and physical resources. Becauseexisting safety performance models (Christian et al., 2009; Neal &Griffin, 2004) primarily focus on motivational processes, theyneglect a potentially important pathway through which elements ofthe work environment can impact safety performance. Results ofthe current study show that job demands are positively related toburnout and that burnout explains a large amount of variance insafety outcomes.
Limitations and Future Research
There are several limitations associated with the current study.First, relatively few studies have been conducted for many of therelationships examined. Thus, we provide preliminary results ofthese relationships. In particular, although burnout was found to bepositively related to accidents and injuries and adverse events,relatively few studies have examined these relationships. Futureresearch should examine the relationship of job demands andresources with burnout and the relationship of burnout to safetyoutcomes. Furthermore, given that autonomy has long been dis-cussed as a key job resource (Karasek, 1979), future researchshould investigate the relationship of autonomy to burnout, en-gagement, and safety outcomes. Second, the low number of studies
for some constructs limited our moderator analyses. Although weinvestigated the extent to which the relationships generalizedacross industries, many estimates were based on a relatively fewstudies. Given that the contribution of job demands differed acrossindustries, future research should investigate the JD-R model in allindustries.
Third, several limitations in the use of meta-analytic correlationmatrices with regard to path analyses have been noted and inves-tigated by researchers (Field, 2005; Furlow & Beretvas, 2005;Hafdahl, 2007; Hafdahl & Williams, 2009). These limitationsprimarily focus on the accuracy of parameter estimates andgoodness-of fit-indices. One concern is that different studies con-tribute to different cells in the matrix, which is analogous tomissing data at the subject level in primary studies. For example,in the current study, the meta-analytic correlation for the relation-ship between complexity and burnout is obtained from studies thatare different from the studies that are utilized to obtain the meta-analytic correlation for the relationship between physical demandsand burnout. Research has found parameter estimates and chi-square tests to be biased when data in a meta-analytic matrix aremissing not at random (Furlow & Beretvas, 2005). Thus, if effectsizes are missing not at random, the results may be subject to bias(Naragon-Gainey, 2010). Although we utilized all effect sizes thatcontributed to a particular cell, there is the potential for this bias tobe present in our meta-analytic path analysis results as well. Thispotential limitation should be kept in mind when interpreting theseresults.
Finally, most workplace safety research has involved evaluatingall of the factors from the employee’s perception. Job demands,job resources, burnout, and engagement were often assessed fromthe same source. Thus, the studies suffer from common methodbias that potentially inflated the relationships between constructs.This is a well-known problem (Crampton & Wagner, 1994; Pod-sakoff, MacKenzie, Lee, & Podsakoff, 2003), and meta-analyzingdata does not remove these flaws. Related to this, because mostconstructs were assessed from the same source and at the sametime, it is impossible to draw strong causal inferences from thecurrent study. Future research should not only incorporate ratingsfrom multiple sources but also include experimental or longitudi-nal research to help clarify causality.
These limitations notwithstanding, we believe that consideringboth the health impairment process and the more traditionallyinvestigated motivational process has provided a richer andbroader investigation of how the organizational context impactssafety outcomes. We have highlighted the important role thatburnout plays as a mechanism through which job demands andresources relate to safety outcomes and hope this will lead tofurther investigations of the health impairment process.
References
References marked with an asterisk indicate studies included in themeta-analysis.
*Alhemood, A. M., Genaidy, A. M., Shell, R., Gunn, M., & Shoaf, C.(2004). Towards a model of safety climate measurement. InternationalJournal of Occupational Safety and Ergonomics, 10, 303–318.
*Andriessen, J. H. (1978). Safe behavior and safety motivation. Journal ofOccupational Accidents, 1, 363–376. doi:10.1016/0376-6349(78)90006-8
17SAFETY AT WORK

*Arboleda, A., Morrow, P. C., Crum, M. R., & Shelley, M. C., II. (2003).Management practices as antecedents of safety culture within the truck-ing industry: Similarities and differences by hierarchical level. Journalof Safety Research, 34, 189–197. doi:10.1016/S0022-4375(02)00071-3
*Arcury, T. A., Quandt, S. A., & Russell, G. B. (2002). Pesticide safetyamong farmworkers: Perceived risk and perceived control as factorsreflecting environmental justice. Environmental Health Perspectives,110, 233–240.
*Arezes, P. M., & Miguel, A. S. (2005). Individual perception of noiseexposure and hearing protection in industry. Human Factors, 47, 683–692. doi:10.1518/001872005775570934
*Arezes, P. M., & Miguel, A. S. (2008). Risk perception and safetybehaviour: A study in an occupational environment. Safety Science, 46,900–907. doi:10.1016/j.ssci.2007.11.008
*Armstrong, K. J., & Laschinger, H. (2006). Structural empowerment,magnet hospital characteristics, and patient safety culture: Making thelink. Journal of Nursing Care Quality, 21, 124–132.
*Arocena, P., Nunez, I., & Villanueva, M. (2008). The impact of preven-tion measures and organisational factors on occupational injuries. SafetyScience, 46, 1369–1384. doi:10.1016/j.ssci.2007.09.003
*Attwood, D., Khan, F., & Veitch, B. (2006). Offshore oil and gasoccupational accidents: What is important? Journal of Loss Preventionin the Process Industries, 19, 386–398. doi:10.1016/j.jlp.2005.10.006
*Baas, J. R. (2002). An exploratory study of the role of trust in safetyclimates and overall safety. Dissertation Abstracts International: Sec-tion B. Sciences and Engineering, 63(2-B), 1073.
*Baba, V. V., Tourigny, L., Wang, X. Y., & Liu, W. M. (2009). Proactivepersonality and work performance in China: The moderating effects ofemotional exhaustion and perceived safety climate. Canadian Journal ofAdministrative Sciences, 26, 23–37. doi:10.1002/cjas.90
*Baek, J. B., Bae, S., Ham, B. H., & Singh, K. P. (2008). Safety climatepractice in Korean manufacturing industry. Journal of Hazardous Ma-terials, 159, 49–52. doi:10.1016/j.jhazmat.2007.07.125
Bakker, A. B., & Demerouti, E. (2007). The job demands–resources model:State of the art. Journal of Managerial Psychology, 22, 309–328.doi:10.1108/02683940710733115
Bakker, A. B., Demerouti, E., & Euwema, M. C. (2005). Job resourcesbuffer the impact of job demands on burnout. Journal of OccupationalHealth Psychology, 10, 170–180. doi:10.1037/1076-8998.10.2.170
Bakker, A. B., Demerouti, E., & Schaufeli, W. B. (2003). Dual processesat work in a call centre: An application of the job demands–resourcesmodel. European Journal of Work and Organizational Psychology, 12,393–417. doi:10.1080/13594320344000165
Bakker, A. B., van Emmerik, H., & Euwema, M. C. (2006). Crossover ofburnout and engagement in work teams. Work and Occupations, 33,464–489. doi:10.1177/0730888406291310
*Barling, J., Kelloway, E. K., & Iverson, R. D. (2003a). Accidentaloutcomes: Attitudinal consequences of workplace injuries. Journal ofOccupational Health Psychology, 8, 74 – 85. doi:10.1037/1076-8998.8.1.74
*Barling, J., Kelloway, E. K., & Iverson, R. D. (2003b). High-qualitywork, job satisfaction, and occupational injuries. Journal of AppliedPsychology, 88, 276–283. doi:10.1037/0021-9010.88.2.276
*Barling, J., Loughlin, C., & Kelloway, E. (2002). Development and test ofa model linking safety-specific transformational leadership and occupa-tional safety. Journal of Applied Psychology, 87, 488–496. doi:10.1037/0021-9010.87.3.488
*Behn, L. D., Thompson, R. C., & Hilton, T. F. (1999). Follow-upassessment of the Federal Aviation Administration’s Logistics Centersafety climate (FAA Office of Aviation Medicine Reports, 99–19, p.10). Oklahoma City, OK: U.S. Department of Transportation, FederalAviation Administration.
*Ben-Ami, S., Shaham, J., Rabin, S., Melzer, A., & Ribak, J. (2001). Theinfluence of nurses’ knowledge, attitudes, and health beliefs on their safe
behavior with cytotoxic drugs in Israel. Cancer Nursing, 24, 192–200.doi:10.1097/00002820-200106000-00007
Beretvas, S. N., & Furlow, C. F. (2006). Evaluation of an approximatemethod for synthesizing covariance matrices for use in meta-analyticSEM. Structural Equation Modeling: A Multidisciplinary Journal, 13,153–185. doi:10.1207/s15328007sem1302_1
*Boden, L. I., Hall, A. A., Levenstein, C., & Punnett, L. (1984). Theimpact of health and safety committees. Journal of Occupational Med-icine, 26, 829–834. doi:10.1097/00043764-198411000-00013
*Bognar, A., Barach, P., Johnson, J. K., Duncan, R. C., Birnbach, D.,Woods, D., . . . Bacha, E. A. (2008). Errors and the burden of errors:Attitudes, perceptions, and the culture of safety in pediatric cardiacsurgical teams. Annals of Thoracic Surgery, 85, 1374 –1381. doi:10.1016/j.athoracsur.2007.11.024
*Brady, J. (2000). Training to promote worker’s use of hearing protection:The influence of work climate factors on training effectiveness. Disser-tation Abstracts International, 60(9), 3233.
*Brown, K. A., Willis, P. G., & Prussia, G. E. (2000). Predicting safeemployee behavior in the steel industry: Development and test of asociotechnical model. Journal of Operations Management, 18, 445–465.doi:10.1016/S0272-6963(00)00033-4
Budescu, D. V. (1993). Dominance analysis: A new approach to theproblem of relative importance of predictors in multiple regression.Psychological Bulletin, 114, 542–551. doi:10.1037/0033-2909.114.3.542
Bureau of Economic Analysis. (2008). Gross domestic product (GDP).Retrieved from http://www.bea.gov/national/index.htm#gdp
*Burke, M. J., Sarpy, S. A., Tesluk, P. E., & Smith-Crowe, K. (2002).General safety performance: A test of a grounded theoretical model.Personnel Psychology, 55, 429 – 457. doi:10.1111/j.1744-6570.2002.tb00116.x
Campbell, J. P. (1990). Modeling the performance prediction problem inindustrial and organizational psychology. In M. D. Dunnette & L. M.Hough (Eds.), Handbook of industrial and organizational psychology(Vol. 1, 2nd ed., pp. 687–732). Palo Alto, CA: Consulting PsychologistsPress.
*Caska, B. A. (1999, July). Effects of perceived danger and safety oninjuries and attitudes. Poster session presented at the meeting of theSociety for Industrial and Organizational Psychology, Atlanta, GA.
Cavanaugh, M. A., Boswell, W. R., Roehling, M. V., & Boudreau, J. W.(2000). An empirical examination of self-reported work stress amongU.S. managers. Journal of Applied Psychology, 85, 65–74. doi:10.1037/0021-9010.85.1.65
Cheung, M. W. L., & Chan, W. (2005). Meta-analytic structural equationmodeling: A two-stage approach. Psychological Methods, 10, 40–64.doi:10.1037/1082-989X.10.1.40
*Chowdhury, S. K., & Endres, M. L. (2010). Customer involvement inservice operation and its impact on job stress and work place injury.Academy of Management Journal, 53, 182–198.
Christian, M. S., Bradley, J. C., Wallace, J. C., & Burke, M. J. (2009).Workplace safety: A meta-analysis of the roles of person and situationfactors. Journal of Applied Psychology, 94, 1103–1127. doi:10.1037/a0016172
Clarke, S. (2006a). The relationship between safety climate and safetyperformance: A meta-analytic review. Journal of Occupational HeathPsychology, 11, 315–327. doi:10.1037/1076-8998.11.4.315
*Clarke, S. (2006b). Safety climate in an automobile manufacturing plant:The effects of work environment, job communication and safety atti-tudes on accidents and unsafe behaviour. Personnel Review, 35, 413–430. doi:10.1108/00483480610670580
Clarke, S., & Robertson, I. T. (2005). A meta-analytic review of the BigFive personality factors and accident involvement in occupational andnon-occupational settings. Journal of Occupational and OrganizationalPsychology, 78, 355–376. doi:10.1348/096317905X26183
18 NAHRGANG, MORGESON, AND HOFMANN

*Clarke, S., & Ward, K. (2006). The role of leader influence tactics andsafety climate in engaging employees’ safety participation. Risk Analy-sis, 26, 1175–1185. doi:10.1111/j.1539-6924.2006.00824.x
*Colemont, A., & Van den Broucke, S. (2008). Measuring determinants ofoccupational health related behavior in Flemish farmers: An applicationof the theory of planned behavior. Journal of Safety Research, 39,55–64. doi:10.1016/j.jsr.2007.12.001
*Cooper, M. D., Phillips, R. A., Sutherland, V. J., & Makin, P. J. (1994).Reducing accidents using goal setting and feedback: A field study.Journal of Occupational and Organizational Psychology, 67, 219–240.
Crampton, S. M., & Wagner, J. A. (1994). Percept-percept inflation inmicroorganizational research: An investigation of prevalence and effect.Journal of Applied Psychology, 79, 67–76. doi:10.1037/0021-9010.79.1.67
Crawford, E. R., LePine, J. A., & Rich, B. L. (2010). Linking job demandsand resources to employee engagement and burnout: A theoreticalextension and meta-analytic test. Journal of Applied Psychology, 95,834–848.
*Cree, T., & Kelloway, E. (1997). Responses to occupational hazards: Exitand participation. Journal of Occupational Health Psychology, 2, 304–311. doi:10.1037/1076-8998.2.4.304
*Crossman, D. C. (2009). The impact of safety culture on worker motiva-tion and the economic bottom line. Dissertation Abstracts International:Section B. Sciences and Engineering, 69(7-B), 4100.
*Cullen, J. C., & Hammer, L. B. (2007). Developing and testing a theo-retical model linking work–family conflict to employee safety. Journalof Occupational Health Psychology, 12, 266–278. doi:10.1037/1076-8998.12.3.266
*Darby, P., Murray, W., & Raeside, R. (2009). Applying online fleet driverassessment to help identify, target and reduce occupational road safetyrisks. Safety Science, 47, 436–442. doi:10.1016/j.ssci.2008.05.004
Darlington, R. B. (1968). Multiple regression in psychological research andpractice. Psychological Bulletin, 69, 161–182. doi:10.1037/h0025471
*Dearmond, S. (2008). Workplace sleepiness: Organizational antecedentsand consequences. Dissertation Abstracts International: Section B. Sci-ences and Engineering, 68(08), 5621.
*Dedobbeleer, N., & Beland, F. (1991). A safety climate measure forconstruction sites. Journal of Safety Research, 22, 97–103. doi:10.1016/0022-4375(91)90017-P
*Dejoy, D. M., Murphy, L. R., & Gershon, R. M. (1995). The influence ofemployee, job task, and organizational factors on adherence to universalprecautions among nurses. International Journal of Industrial Ergonom-ics, 16, 43–55. doi:10.1016/0169-8141(94)00075-E
*DeJoy, D. M., Schaffer, B. S., Wilson, M. G., Vandenberg, R. J., & Butts,M. M. (2004). Creating safer workplaces: Assessing the determinantsand role of safety climate. Journal of Safety Research, 35, 81–90.doi:10.1016/j.jsr.2003.09.018
*DeJoy, D. M., Searcy, C. A., Murphy, L. R., & Gershon, R. R. M. (2000).Behavior-diagnostic analysis of compliance with universal precautionsamong nurses. Journal of Occupational Health Psychology, 5, 127–141.doi:10.1037/1076-8998.5.1.127
Demerouti, E., Bakker, A. B., Nachreiner, F., & Schaufeli, W. B. (2001).The job demands–resources model of burnout. Journal of Applied Psy-chology, 86, 499–512. doi:10.1037/0021-9010.86.3.499
*Dıaz-Cabrera, D., Hernandez-Fernaud, E., & Isla-Diaz, R. (2007). Anevaluation of a new instrument to measure organisational safety culturevalues and practices. Accident Analysis & Prevention, 39, 1202–1211.doi:10.1016/j.aap.2007.03.005
*Donald, I., & Canter, D. (1994). Employee attitudes and safety in thechemical industry. Journal of Loss Prevention in the Process Industries,7, 203–208. doi:10.1016/0950-4230(94)80067-7
*Dunbar, R. L. M. (1975). Managers influence on subordinates’ thinkingabout safety. Academy of Management Journal, 18, 364–369. doi:10.2307/255538
Eisenberger, R., Fasolo, P., & Davis-LaMastro, V. (1990). Perceivedorganizational support and employee diligence, commitment, and inno-vation. Journal of Applied Psychology, 75, 51–59. doi:10.1037/0021-9010.75.1.51
Eisenberger, R., Huntington, R., Hutchison, S., & Sowa, D. (1986). Per-ceived organizational support. Journal of Applied Psychology, 71, 500–507. doi:10.1037/0021-9010.71.3.500
*Ek, A., & Akselsson, R. (2007). Aviation on the ground: Safety culture ina ground handling company. International Journal of Aviation Psychol-ogy, 17, 59–76. doi:10.1207/s15327108ijap1701_4
*Ek, A., Akselsson, R., Arvidsson, M., & Johansson, C. R. (2007). Safetyculture in Swedish air traffic control. Safety Science, 45, 791–811.doi:10.1016/j.ssci.2006.08.017
*Eklöf, M., & Torner, M. (2002). Perception and control of occupationalinjury risks in fishery: A pilot study. Work & Stress, 16, 58–69.doi:10.1080/02678370110114694
*Evans, D. D., Michael, J. H., Wiedenbeck, J. K., & Ray, C. D. (2005).Relationships between organizational climates and safety-related eventsat four wood manufacturers. Forest Products Journal, 55, 23–28.
*Felknor, S. A., Aday, L. A., Burau, K. D., Delclos, G. L., & Kapadia,A. S. (2000). Safety climate and its association with injuries and safetypractices in public hospitals in Costa Rica. International Journal ofOccupational Environmental Health, 6, 18–25.
Field, A. P. (2005). Is the meta-analysis of correlation coefficients accuratewhen population correlations vary? Psychological Methods, 10, 444–467. doi:10.1037/1082-989X.10.4.444
*Fogarty, G. J. (2005). Psychological strain mediates the impact of safetyclimate on maintenance errors. International Journal of Applied Avia-tion Studies, 5, 53–63.
*Fogarty, G., & Shaw, A. (2003). Safety climate and the theory of plannedbehaviour: Towards the prediction of unsafe behaviour [Abstract). Aus-tralian Journal of Psychology, 55, 123.
*Ford, M. T. (2009). Implications of psychological distance for the struc-ture and motivation of safety at work. Dissertation Abstracts Interna-tional: Section B. Sciences and Engineering, 69(8-B), 5089.
*Frone, M. R. (1998). Predictors of work injuries among employed ado-lescents. Journal of Applied Psychology, 83, 565–576. doi:10.1037/0021-9010.83.4.565
*Fullarton, C., & Stokes, M. (2007). The utility of a workplace injuryinstrument in prediction of workplace injury. Accident Analysis & Pre-vention, 39, 28–37. doi:10.1016/j.aap.2006.05.015
Furlow, C. F., & Beretvas, S. N. (2005). Meta-analytic methods for poolingcorrelation matrices for structural equation modeling under differentpatterns of missing data. Psychological Methods, 10, 227–254. doi:10.1037/1082-989X.10.2.227
*Garavan, T. N., & O’Brien, F. (2001). An investigation into the relation-ship between safety climate and safety behaviors in Irish organizations.Irish Journal of Management, 22, 141–170.
*Geller, E., Roberts, D., & Gilmore, M. R. (1996). Predicting propensity toactively care for occupational safety. Journal of Safety Research, 27,1–8. doi:10.1016/0022-4375(95)00024-0
*Gershon, R. R. M., Qureshi, K. A., Pogorzelska, M., Rosen, J., Gebbie,K. M., Brandt-Rauf, P. W., & Sherman, M, F. (2007). Non-hospitalbased registered nurses and the risk of bloodborne pathogen exposure.Industrial Health, 45, 695–704. doi:10.2486/indhealth.45.695
*Gibbons, A. M., von Thaden, T. L., & Wiegmann, D. A. (2006). Devel-opment and initial validation of a survey for assessing safety culturewithin commercial flight operations. International Journal of AviationPsychology, 16, 215–238. doi:10.1207/s15327108ijap1602_6
*Gillen, M., Baltz, D., Gassel, M., Kirsch, L., & Vaccaro, D. (2002).Perceived safety climate, job demands, and coworker support amongunion and nonunion injured construction workers. Journal of SafetyResearch, 33, 33–51. doi:10.1016/S0022-4375(02)00002-6
*Gimeno, D., Felknor, S., Burau, K. D., & Delclos, G. L. (2005). Organi-
19SAFETY AT WORK
sational and occupational risk factors associated with work relatedinjuries among public hospital employees in Costa Rica. Occupationaland Environmental Medicine, 62, 337–343. doi:10.1136/oem.2004.014936
*Ginsburg, L., Gilin, D., Tregunno, D., Norton, P. G., Flemons, W., &Fleming, M. (2009). Advancing measurement of patient safety culture.Health Services Research, 44, 205–224. doi:10.1111/j.1475-6773.2008.00908.x
*Ginsburg, L., Norton, P. G., Casebeer, A., & Lewis, S. (2005). Aneducational intervention to enhance nurse leaders’ perceptions of patientsafety culture. Health Services Research, 40, 997–1020. doi:10.1111/j.1475-6773.2005.00401.x
*Goldenhar, L. M., Williams, L. J., & Swanson, N. G. (2003). Modellingrelationships between job stressors and injury and near-miss outcomesfor construction labourers. Work & Stress, 17, 218–240. doi:10.1080/02678370310001616144
*Graso, M., Probst, T., & Estrada, A. (2008, April). Extending the con-sideration of future consequences to safety outcomes. Poster sessionpresented at the meeting of the Society for Industrial and OrganizationalPsychology, San Francisco, CA.
*Griffin, M. A., & Neal, A. (2000). Perceptions of safety at work: Aframework for linking safety climate to safety performance, knowledge,and motivation. Journal of Occupational Health Psychology, 5, 347–358. doi:10.1037/1076-8998.5.3.347
*Grosch, J. W., Gershon, R. R. M., Murphy, L. R., & DeJoy, D. M. (1999).Safety climate dimensions associated with occupational exposure toblood-borne pathogens in nurses. American Journal of Industrial Medi-cine, 1, 122–124. doi:10.1002/(SICI)1097-0274(199909)36:1�122::AID-AJIM43�3.0.CO;2-L
*Grote, G. (2008). Diagnosis of safety culture: A replication and extensiontowards assessing “safe” organizational change processes. Safety Sci-ence, 46, 450–460.
*Grote, G., & Kuenzler, C. (2000). Diagnosis of safety culture in safetymanagement audits. Safety Science, 34, 131–150. doi:10.1016/S0925-7535(00)00010-2
*Guastello, S. J. (1991). Psychosocial variables related to transit safety:The application of catastrophe theory. Work & Stress, 5, 17–28. doi:10.1080/02678379108256999
*Gyekye, S. A. (2005). Workers’ perceptions of workplace safety and jobsatisfaction. International Journal of Occupational Safety and Ergonom-ics, 11, 291–302.
*Gyekye, S. A., & Salminen, S. (2005). Are “good soldiers” safety con-scious? An examination of the relationship between organizational cit-izenship behaviors and perception of workplace safety. Social Behaviorand Personality, 33, 805–820. doi:10.2224/sbp.2005.33.8.805
*Gyekye, S. A., & Salminen, S. (2009). Educational status and organiza-tional safety climate: Does educational attainment influence workers’perceptions of workplace safety? Safety Science, 47, 20 –28. doi:10.1016/j.ssci.2007.12.007
Hackman, J. R., & Oldham, G. R. (1976). Motivation through the design ofwork: Test of a theory. Organizational Behavior and Human Perfor-mance, 16, 250–279. doi:10.1016/0030-5073(76)90016-7
Hafdahl, A. R. (2007). Combining correlation matrices: Simulation anal-ysis of improved fixed-effects methods. Journal of Educational andBehavioral Statistics, 32, 180–205. doi:10.3102/1076998606298041
Hafdahl, A. R., & Williams, M. A. (2009). Meta-analysis of correlationsrevisited: Attempted replication and extension of Field’s (2001). simu-lation studies. Psychological Methods, 14, 24 – 42. doi:10.1037/a0014697
*Hahn, S. E., & Murphy, L. R. (2008). A short scale for measuring safetyclimate. Safety Science, 46, 1047–1066. doi:10.1016/j.ssci.2007.06.002
Halbesleben, J. R. B. (2006). Sources of social support and burnout: Ameta-analytic test of the conservation of resources model. Journal ofApplied Psychology, 91, 1134–1145. doi:10.1037/0021-9010.91.5.1134
*Halbesleben, J. R. B., Wakefield, B. J., Wakefield, D. S., & Cooper, L. B.(2008). Nurse burnout and patient safety outcomes: Nurse safety per-ception versus reporting behavior. Western Journal of Nursing Re-search, 30, 560–577. doi:10.1177/0193945907311322
*Hansen, C. P. (1989). A causal model of the relationship among accidents,biodata, personality, and cognitive factors. Journal of Applied Psychol-ogy, 74, 81–90. doi:10.1037/0021-9010.74.1.81
*Harris, T. C. (1998). Predicting workplace safety outcomes throughsubordinate and supervisor involvement in safety issues. DissertationAbstracts International: Section B. Sciences and Engineering, 58, 4500.
*Hartmann, C. W., Rosen, A. K., Meterko, M., Shokeen, P., Zhao, S.,Singer, S., . . . Gaba, D. M. (2008). An overview of patient safetyclimate in the VA. Health Services Research, 43, 1263–1284. doi:10.1111/j.1475-6773.2008.00839.x
*Hayes, B. E., Perander, J., Smecko, T., & Trask, J. (1998). Measuringperceptions of workplace safety: Development and validation of theWork Safety Scale. Journal of Safety Research, 29, 145–161. doi:10.1016/S0022-4375(98)00011-5
Heidemeier, H., & Moser, K. (2009). Self–other agreement in job perfor-mance ratings: A meta-analytic test of a process model. Journal ofApplied Psychology, 94, 353–370. doi:10.1037/0021-9010.94.2.353
*Hemingway, M. A., & Smith, C. S. (1999). Organizational climate andoccupational stressors as predictors of withdrawal behaviors and injuriesin nurses. Journal of Occupational and Organizational Psychology, 72,285–299. doi:10.1348/096317999166680
*Hine, D. W., Lewko, J., & Blanco, J. (1999). Alignment to workplacesafety principles: An application to mining. Journal of Safety Research,30, 173–185. doi:10.1016/S0022-4375(99)00012-2
*Hinsz, V. B., & Nickell, G. S. (2004, April). A motivational model ofproduct safety and security behaviors. Poster session presented at themeeting of the Society for Industrial and Organizational Psychology,Chicago, IL.
*Hinsz, V. B., Nickell, G. S., & Park, E. S. (2007). The role of work habitsin the motivation of food safety behaviors. Journal of ExperimentalPsychology: Applied, 13, 105–114. doi:10.1037/1076-898X.13.2.105
Hobfoll, S. E., & Freedy, J. (1993). Conservation of resources: A generalstress theory applied to burnout. In W. B. Schaufeli, C. A. Maslach, &T. Marek (Eds.), Professional burnout: Recent developments in theoryand research (pp. 115–133). Philadelphia, PA: Taylor & Francis.
*Hofmann, D. A., & Mark, B. (2006). An investigation of the relationshipbetween safety climate and medication errors as well as other nurse andpatient outcomes. Personnel Psychology, 59, 847–869. doi:10.1111/j.1744-6570.2006.00056.x
*Hofmann, D. A., & Morgeson, F. P. (1999). Safety-related behavior as asocial exchange: The role of perceived organizational support andleader–member exchange. Journal of Applied Psychology, 84, 286–296.doi:10.1037/0021-9010.84.2.286
*Hofmann, D. A., Morgeson, F. P., & Gerras, S. J. (2003). Climate as amoderator of the relationship between leader–member exchange andcontent specific citizenship: Safety climate as an exemplar. Journal ofApplied Psychology, 88, 170–178. doi:10.1037/0021-9010.88.1.170
*Hofmann, D. A., & Stetzer, A. (1996). A cross-level investigation offactors influencing unsafe behaviors and accidents. Personnel Psychol-ogy, 49, 307–339. doi:10.1111/j.1744-6570.1996.tb01802.x
*Hofmann, D. A., & Stetzer, A. (1998). The role of safety climate andcommunication in accident interpretation: Implications for learning fromnegative events. Academy of Management Journal, 41, 644–657. doi:10.2307/256962
*Hope, L., Mearns, K., & Cheyne, A. (2004, April). Investment in work-force health: Examining implications for safety and commitment. Postersession presented at the meeting of the Society for Industrial andOrganizational Psychology, Chicago, IL.
*Hsu, S. H., Lee, C.-C., Wu, M.-C., & Takano, K. (2008). A cross-culturalstudy of organizational factors on safety: Japanese vs. Taiwanese oil
20 NAHRGANG, MORGESON, AND HOFMANN

refinery plants. Accident Analysis & Prevention, 40, 24 –34. doi:10.1016/j.aap.2007.03.020
*Huang, Y. H., Chen, P. Y., Krauss, A. D., & Rogers, D. A. (2004).Quality of the execution of corporate safety policies and employee safetyoutcomes: Assessing the moderating role of supervisor safety supportand the mediating role of employee safety control. Journal of Businessand Psychology, 18, 483–506. doi:10.1023/B:JOBU.0000028448.01394.bf
*Huang, Y. H., Chen, P. Y., Rogers, D. A., & Krauss, A. D. (2003). Roleof workplace safety: A revisit of the relationship between job satisfac-tion and employment status. Work, 21, 251–256.
*Huang, Y.-H., Ho, M., Smith, G. S., & Chen, P. Y. (2006). Safety climateand self-reported injury: Assessing the mediating role of employeesafety control. Accident Analysis & Prevention, 38, 425–433. doi:10.1016/j.aap.2005.07.002
Huang, Y. H., Leamon, T. B., Courney, T. K., Chen, P. Y., & DeArmond,S. (2007). Corporate financial decision-makers’ perceptions of work-place safety. Accident Analysis & Prevention, 39, 767–775. doi:10.1016/j.aap.2006.11.007
*Huang, Y. H., Pransky, G. S., Shaw, W. S., Benjamin, K. L., & Savageau,J. A. (2006). Factors affecting the organizational responses of employersto workers with injuries. Work, 26, 75–84.
Humphrey, S. E., Nahrgang, J. D., & Morgeson, F. P. (2007). Integratingmotivational, social, and contextual work design features: A meta-analytic summary and theoretical extension of the work design literature.Journal of Applied Psychology, 92, 1332–1356. doi:10.1037/0021-9010.92.5.1332
Hunter, J. E., & Schmidt, F. L. (2004). Methods of meta-analysis: Cor-recting error and bias in research findings. Thousand Oaks, CA: Sage.
*Hurst, C. S., Eby, L. T., & Butts, M. M. (2009, April). Conversationsabout health: Supervisor health and safety support scale development.Poster session presented at the meeting of the Society for Industrial andOrganizational Psychology, New Orleans, LA.
Institute of Medicine. (1999). To err is human: Building a safer healthsystem. Washington, DC: Author.
*Iverson, R. D., & Erwin, P. J. (1997). Predicting occupational injury: Therole of affectivity. Journal of Occupational and Organizational Psychol-ogy, 70, 113–128.
Johnson, J. W. (2000). A heuristic method for estimating the relativeweight of predictor variables in multiple regression. Multivariate Be-havioral Research, 35, 1–19. doi:10.1207/S15327906MBR3501_1
Johnson, J. W. (2001). The relative importance of task and contextualperformance imensions to supervisor judgments of overall performance.Journal of Applied Psychology, 86, 984 –996. doi:10.1037/0021-9010.86.5.984
Johnson, J. W., & Lebreton, J. M. (2004). History and use of relativeimportance indices in organizational research. Organizational ResearchMethods, 7, 238–257. doi:10.1177/1094428104266510
Jöreskog, K. G., & Sörbom, D. (2002). LISREL 8: Structural equationmodeling with the SIMPLIS command language. Lincolnwood, IL: Sci-entific Software International.
Kahn, W. A. (1990). Psychological conditions of personal engagement anddisengagement at work. Academy of Management Journal, 33, 692–724.doi:10.2307/256287
*Kao, C. S., Lai, W. H., Chuang, T. F., & Lee, J. C. (2008). Safety culturefactors, group differences, and risk perception in five petrochemicalplants. Process Safety Progress, 27, 145–152. doi:10.1002/prs.10246
Karasek, R. A. (1979). Job demands, job decision latitude, and mentalstrain: Implications for job redesign. Administrative Science Quarterly,24, 285–308. doi:10.2307/2392498
Karasek, R. A., Triantis, K. P., & Chaudhry, S. S. (1982). Co-worker andsupervisor support as moderators of associations between task charac-teristics and mental strain. Journal of Occupational Behavior, 3, 181–200. doi:10.1002/job.4030030205
*Katz-Navon, T., Naveh, E., & Stern, Z. (2007). Safety self-efficacy andsafety performance: Potential antecedents and the moderation effect ofstandardization. International Journal of Health Care Quality Assur-ance, 20, 572–584. doi:10.1108/09526860710822716
*Kelloway, E. K., Mullen, J., & Francis, L. (2006). Divergent effects oftransformational and passive leadership on employee safety. Journal ofOccupational Health Psychology, 11, 76 – 86. doi:10.1037/1076-8998.11.1.76
*Kerr, M. (1995). Factors related to Mexican American workers’ use ofhearing protection. Dissertation Abstracts International, 55(08), 3238B.
*Krispin, J. V. (1999). The construction and validation of a measure ofsafety climate: Exploring the link between attitudes and perceptionsaround safety and safe performance. Dissertation Abstracts Interna-tional: Section B. Sciences and Engineering, 59(7-B), 3747.
*Kudo, Y., Satoh, T., Kido, S., Watanabe, M., Miki, T., Miyajima, E., . . .Aizawa, Y. (2008). A pilot study testing the dimensions of safety climateamong Japanese nurses. Industrial Health, 46, 158–165. doi:10.2486/indhealth.46.158
*Laschinger, H., & Armstrong, K. J. (2007). Empowerment, professionalproactive environments, and patient safety climate: A replication study.Unpublished manuscript.
*Laschinger, H. S., & Leiter, M. (2006). The impact of nursing workenvironments on patient safety outcomes: The mediating role of burnout/engagement. Journal of Nursing Administration, 36, 259–267. doi:10.1097/00005110-200605000-00019
*Lawton, R. J. (1998). Not working to rule: Understanding proceduralviolations at work. Safety Science, 28, 77–95. doi:10.1016/S0925-7535(97)00073-8
Lebreton, J. M., Binning, J. F., Adorno, A. J., & Melcher, K. M. (2004).Importance of personality and job-specific affect for predicting jobattitudes and withdrawal behavior. Organizational Research Methods, 7,300–325. doi:10.1177/1094428104266015
Lee, R. T., & Ashforth, B. E. (1996). A meta-analytic examination of thecorrelates of the three dimensions of job burnout. Journal of AppliedPsychology, 81, 123–133. doi:10.1037/0021-9010.81.2.123
*Lin, S. H., Tang, W. J., Miao, J. Y., Wang, Z. M., & Wang, P. X. (2008).Safety climate measurement at workplace in China: A validity andreliability assessment. Safety Science, 46, 1037–1046. doi:10.1016/j.ssci.2007.05.001
*Lundblad, J. P. (2005). Teamwork and safety climates in small ruralhospitals. Dissertation Abstracts International: Section A. Humanitiesand Social Sciences, 65(10-A), 3728.
*Lusk, S. L., Ronis, D. I., & Kerr, M. J. (1995). Predictors of hearingprotection use among workers: Implications for training programs. Hu-man Factors, 37, 635–640. doi:10.1518/001872095779049390
*Machin, M., & De Souza, J. M. D. (2004). Predicting health outcomes andsafety behaviour in taxi drivers. Transportation Research Part F: TrafficPsychology and Behaviour, 7, 257–270. doi:10.1016/j.trf.2004.09.004
MacKinnon, D. P., Lockwood, C. M., Hoffman, J. M., West, S. G., &Sheets, V. (2002). A comparison of methods to test mediation and otherintervening variable effects. Psychological Methods, 7, 83–104. doi:10.1037/1082-989X.7.1.83
*Maierhofer, N. I., Griffin, M. A., & Sheehan, M. (2000). Linking managervalues and behavior with employee values and behavior: A study ofvalues and safety in the hairdressing industry. Journal of OccupationalHealth Psychology, 5, 417–427. doi:10.1037/1076-8998.5.4.417
*Marchand, A., Simard, M., Carpentier-Roy, M., & Ouellet, F. (1998).From a unidimensional to a bidimensional concept and measurement ofworkers’ safety behavior. Scandinavian Journal of Work, Environment& Health, 24, 293–299.
*Marks, K., & Kath, L. (2008, April). Drivers of upward safety commu-nication. Paper presented at the meeting of the Society for Industrial andOrganizational Psychology, San Francisco, CA.
Maslach, C., & Leiter, M. P. (1997). The truth about burnout: How
21SAFETY AT WORK

organizations cause personal stress and what to do about it. SanFrancisco, CA: Jossey-Bass.
Maslach, C., & Leiter, M. P. (2008). Early predictors of job burnout andengagement. Journal of Applied Psychology, 93, 498–512. doi:10.1037/0021-9010.93.3.498
*Matsubara, S., Hagihara, A., & Nobutomo, K. (2008). Development of apatient safety climate scale in Japan. International Journal for Quality inHealth Care, 20, 211–220. doi:10.1093/intqhc/mzn003
*McCoy, K. D., Beekmann, S. E., Ferguson, K. J., Vaughn, T. E., Torner,J. C., Woolson, R. F., & Doebbeling, B. N. (2001). Monitoring adher-ence to standard precautions. American Journal of Infection Control, 29,24–31. doi:10.1067/mic.2001.111226
*McLain, D. L. (1995). Responses to health and safety risk in the workenvironment. Academy of Management Journal, 38, 1726–1743. doi:10.2307/256852
*McLain, D. L., & Jarrell, K. A. (2007). The perceived compatibility ofsafety and production expectations in hazardous occupations. Journal ofSafety Research, 38, 299–309. doi:10.1016/j.jsr.2006.10.011
*Mearns, K., Flin, R., Gordon, R., & Fleming, M. (1998). Measuring safetyclimate on offshore installations. Work & Stress, 12, 238–254. doi:10.1080/02678379808256864
*Mearns, K., Flin, R., Gordon, R., & Fleming, M. (2001). Human andorganizational factors in offshore safety. Work & Stress, 15, 144–160.doi:10.1080/026783701102678370110066616
*Mearns, K. J., & Reader, T. (2008). Organizational support and safetyoutcomes: An un-investigated relationship? Safety Science, 46, 388–397. doi:10.1016/j.ssci.2007.05.002
Meijman, T. F., & Mulder, G. (1998). Psychological aspects of workload.In P. J. Drenth, H. Thierry, & C. J. de Wolff (Eds.), Handbook of workand organizational psychology (2nd ed., pp. 5–33). Hove, England:Erlbaum.
*Michael, J. H., Evans, D. D., Jansen, K. J., & Haight, J. M. (2005).Management commitment to safety as organizational support: Relation-ships with non-safety outcomes in wood manufacturing employees.Journal of Safety Research, 36, 171–179. doi:10.1016/j.jsr.2005.03.002
*Michael, J. H., Guo, Z. G., Wiedenbeck, J. K., & Ray, C. D. (2006).Production supervisor impacts on subordinates’ safety outcomes: Aninvestigation of leader–member exchange and safety communication.Journal of Safety Research, 37, 469–477. doi:10.1016/j.jsr.2006.06.004
*Mohamed, S. (2002). Safety climate in construction site environments.Journal of Construction Engineering and Management, 128, 375–384.doi:10.1061/(ASCE)0733-9364(2002)128:5(375)
*Mohamed, S. (2003). Scorecard approach to benchmarking organizationalsafety culture in construction. Journal of Construction Engineering andManagement, 129, 80–88. doi:10.1061/(ASCE)0733-9364(2003)129:1(80)
*Moody, R. F. (2007). Safety culture on hospital nursing units: Humanperformance and organizational system factors that make a difference.Dissertation Abstracts International: Section B. Sciences and Engineer-ing, 67(08), 4349.
Morgeson, F. P., & Humphrey, S. E. (2006). The Work Design Question-naire (WDQ): Developing and validating a comprehensive measure forassessing job design and the nature of work. Journal of Applied Psy-chology, 91, 1321–1339. doi:10.1037/0021-9010.91.6.1321
*Morrow, P. C., & Crum, M. R. (1998). The effects of perceived andobjective safety risk on employee outcomes. Journal of VocationalBehavior, 53, 300–313. doi:10.1006/jvbe.1997.1620
*Morrow, P. C., & Crum, M. R. (2004). Antecedents of fatigue, close calls,and crashes among commercial motor-vehicle drivers. Journal of SafetyResearch, 35, 59–69. doi:10.1016/j.jsr.2003.07.004
*Morrow, P. C., & McElroy, J. C. (2006). Union loyalty antecedents: Ajustice perspective. Journal of Labor Research, 27, 75–87. doi:10.1007/s12122-006-1010-3
*Mueller, L. M. (2003). Safety climate and organizational climate: An
examination of discriminant validity between constructs and the impactof using different item referents. Dissertation Abstracts International:Section B. Sciences and Engineering, 63(9-B), 4405.
*Mullen, J. E., & Kelloway, E. K. (2009). Safety leadership: A longitudinalstudy of the effects of transformational leadership on safety outcomes.Journal of Occupational and Organizational Psychology, 82, 253–272.doi:10.1348/096317908X325313
Myers, D. G. (1999). Close relationships and quality of life. In D. Kahne-man, E. Diener, & N. Schwarz (Eds.), Well-being: The foundations ofhedonic psychology (pp. 374–391). New York, NY: Russell Sage Foun-dation.
Naragon-Gainey, K. (2010). Meta-analysis of the relations of anxietysensitivity to the depressive and anxiety disorders. Psychological Bul-letin, 136, 128–150. doi:10.1037/a0018055
*Naveh, E., Katz-Navon, T., & Stern, Z. (2005). Treatment errors inhealthcare: A safety climate approach. Management Science, 51, 948–960. doi:10.1287/mnsc.1050.0372
Neal, A., & Griffin, M. A. (2004). Safety climate and safety at work. In J.Barling & M. R. Frone (Eds.), The psychology of workplace safety (pp.15–34). Washington, DC: American Psychological Association.
*Neal, A., & Griffin, M. A. (2006). A study of the lagged relationshipsamong safety climate, safety motivation, safety behavior, and accidentsat the individual and group levels. Journal of Applied Psychology, 91,946–953. doi:10.1037/0021-9010.91.4.946
*Neal, A., Griffin, M. A., & Hart, P. M. (2000). The impact of organiza-tional climate on safety climate and individual behavior. Safety Science,34, 99–109. doi:10.1016/S0925-7535(00)00008-4
*Newnam, S., Griffin, M. A., & Mason, C. (2008). Safety in work vehicles:A multilevel study linking safety values and individual predictors towork-related driving crashes. Journal of Applied Psychology, 93, 632–644. doi:10.1037/0021-9010.93.3.632
*Niskanen, T. (1994). Assessing the safety environment in work organi-zation of road maintenance jobs. Accident Analysis & Prevention, 26,27–39. doi:10.1016/0001-4575(94)90066-3
*Parboteeah, K. P., & Kapp, E. A. (2008). Ethical climates and workplacesafety behaviors: An empirical investigation. Journal of Business Ethics,80, 515–529. doi:10.1007/s10551-007-9452-y
*Parker, S. K., Axtell, C., & Turner, N. (2001). Designing a safer work-place: Importance of job autonomy, communication quality, and sup-portive supervisors. Journal of Occupational Health Psychology, 6,211–228. doi:10.1037/1076-8998.6.3.211
*Paul, P. S., & Maiti, J. (2005). Development and test of a sociotechnicalmodel for accident/injury occurrences in underground coalmines. Jour-nal of the South African Institute of Mining and Metallurgy, 105, 43–53.
*Petersen, D. (1973). The effectiveness of safety programs as perceived byemployees. Journal of the American Society of Safety Engineers, 18,22–26.
Podsakoff, P. M., MacKenzie, S. B., Lee, J., & Podsakoff, N. P. (2003).Common method biases in behavioral research: A critical review of theliterature and recommended remedies. Journal of Applied Psychology,88, 879–903. doi:10.1037/0021-9010.88.5.879
*Pousette, A., Larsson, S., & Tarner, M. (2008). Safety climate cross-validation, strength and prediction of safety behaviour. Safety Science,46, 398–404. doi:10.1016/j.ssci.2007.06.016
*Probst, T. M. (2004). Safety and insecurity: Exploring the moderatingeffect of organizational safety climate. Journal of Occupational HealthPsychology, 9, 3–10. doi:10.1037/1076-8998.9.1.3
*Probst, T. M., & Brubaker, T. L. (2001). The effects of job insecurity onemployee safety outcomes: Cross sectional and longitudinal explora-tions. Journal of Occupational Health Psychology, 6, 139–159. doi:10.1037/1076-8998.6.2.139
*Probst, T. M., & Estrada, A. (2010). Accident under-reporting amongemployees: Testing the moderating influence of psychological safety
22 NAHRGANG, MORGESON, AND HOFMANN

climate and supervisor enforcement of safety practices. Accident Anal-ysis & Prevention, 42, 1438–1444.
*Prussia, G. E., Brown, K. A., & Willis, P. (2003). Mental models ofsafety: Do managers and employees see eye to eye? Journal of SafetyResearch, 34, 143–156. doi:10.1016/S0022-4375(03)00011-2
*Real, K. (2008). Information seeking and workplace safety: A fieldapplication of the risk perception attitude framework. Journal ofApplied Communication Research, 36, 339 –359. doi:10.1080/00909880802101763
*Reiman, T., & Oedewald, P. (2004). Measuring maintenance culture andmaintenance core task with CULTURE-questionnaire: A case study inthe power industry. Safety Science, 42, 859 – 889. doi:10.1016/j.ssci.2004.04.001
*Reiman, T., Oedewald, P., & Rollenhagen, C. (2005). Characteristics oforganizational culture at the maintenance units of two Nordic nuclearpower. Reliability Engineering & System Safety, 89, 331–345. doi:10.1016/j.ress.2004.09.004
*Reynolds, G. S. (2005). Alcohol tolerance norms and risky work climatemoderate the cognitive effects of workplace substance abuse prevention.Dissertation Abstracts International: Section B. Sciences and Engineer-ing, 66(1-B), 539.
Rich, B. L., LePine, J. A., & Crawford, E. R. (2010). Job engagement:Antecedents and effects on job performance. Academy of ManagementJournal, 53, 617–635.
*Rundmo, T. (1994). Associations between organizational factors andsafety and contingency measures on offshore petroleum platforms. Scan-dinavian Journal of Work Environment & Health, 20, 122–127.
*Rundmo, T. (1996). Associations between risk perception and safety.Safety Science, 24, 197–209. doi:10.1016/S0925-7535(97)00038-6
Schaufeli, W. B., & Bakker, A. B. (2004). Job demands, job resources, andtheir relationship with burnout and engagement: A multi-sample study.Journal of Organizational Behavior, 25, 293–315. doi:10.1002/job.248
Schaufeli, W. B., Bakker, A. B., & van Rhenen, W. (2009). How changesin job demands and resources predict burnout, work engagement, andsickness absenteeism. Journal of Organizational Behavior, 30, 893–917.doi:10.1002/job.595
Schaufeli, W. B., Salanova, M., Gonzalez-Roma, V., & Bakker, A. B.(2002). The measurement of engagement and burnout: A two sampleconfirmatory factor analytic approach. Journal of Happiness Studies, 3,71–92. doi:10.1023/A:1015630930326
Schaufeli, W. B., Taris, T. W., & van Rhenen, W. (2008). Workaholism,burnout, and work engagement: Three of a kind or three different kindsof employee well-being? Applied Psychology, 57, 173–203. doi:10.1111/j.1464-0597.2007.00285.x
Schneider, B. (1990). The climate for service: An application of the climateconstruct. In B. Schneider (Ed.), Organizational climate and culture (pp.383–412). San Francisco, CA: Jossey-Bass.
*Seo, D. C. (2004). Development and testing of a model that explainscontributing factors to unsafe work behavior. Dissertation AbstractsInternational: Section B. Sciences and Engineering, 65(2-B), 691.
*Sexton, J. B., Helmreich, R. L., Neilands, T. B., Rowan, K., Vella, K.,Boyden, J., . . . Thomas, E. J. (2006). The Safety Attitudes Question-naire: Psychometric properties, benchmarking data, and emerging re-search. BMC Health Services Research, 6, 44. doi:10.1186/1472-6963-6-44
*Shoji, T., & Egawa, Y. (2006). Structure of safety climates and its effectson workers’ attitudes and work safety at Japanese construction worksites. Journal of the University of Occupational and EnvironmentalHealth, 28, 29–43.
*Sinclair, R. R., Martin, J. E., & Sears, L. E. (2010). Labor unions andsafety climate: Perceived union safety values and retail employee safetyoutcomes. Accident Analysis & Prevention, 42, 1477–1487.
*Singer, S., Meterko, M., Baker, L., Gaba, D., Falwell, A., & Rosen, A.(2007). Workforce perceptions of hospital safety culture: Development
and validation of the Patient Safety Climate in Healthcare Organizationssurvey. Health Services Research, 42, 1999–2021. doi:10.1111/j.1475-6773.2007.00706.x
*Siu, O. L., Phillips, D. R., & Leung, T.-W. (2003). Age differences insafety attitudes and safety performance in Hong Kong constructionworkers. Journal of Safety Research, 34, 199–205. doi:10.1016/S0022-4375(02)00072-5
*Siu, O. L., Phillips, D. R., & Leung, T. W. (2004). Safety climate andsafety performance among construction workers in Hong Kong: The roleof psychological strains as mediators. Accident Analysis & Prevention,36, 359–366. doi:10.1016/S0001-4575(03)00016-2
*Smith-Crowe, K., Burke, M. J., & Landis, R. S. (2003). Organizationalclimate as a moderator of safety knowledge–safety performance rela-tionships. Journal of Organizational Behavior, 24, 861– 876. doi:10.1002/job.217
*Smits, M., Christiaans-Dingelhoff, I., Wagner, C., van der Wal, G., &Groenewegen, P. P. (2008). The psychometric properties of the “Hos-pital Survey on Patient Safety Culture” in Dutch hospitals. BMC HealthServices Research, 8, 230. doi:10.1186/1472-6963-8-230
*Snyder, L. A., Krauss, A. D., Chen, P. Y., Finlinson, S., & Huang, Y.-H.(2008). Occupational safety: Application of the job demand–control–support model. Accident Analysis & Prevention, 40, 1713–1723. doi:10.1016/j.aap.2008.06.008
Sobel, M. E. (1982). Asymptotic intervals for indirect effects in structuralequations models. In S. Leinhard (Ed.). Sociological methodology (pp.290–312). San Francisco, CA: Jossey-Bass.
*Sorra, J., & Nieva, V. (2004). Pilot study: Reliability and validity of thehospital survey on patient safety. Rockville, MD: Agency for HealthcareResearch and Quality.
*Sorra, J., Nieva, V., Schreiber, G., King, M., & Kaplan, H. (2002). Safetyculture and event reporting in hospital transfusion services. Transfusion,42(Suppl. 9), 138S.
*Strahan, C., Watson, B., & Lennon, A. (2008). Can organisational safetyclimate and occupational stress predict work-related driver fatigue?Transportation Research Part F: Traffic Psychology and Behaviour, 11,418–426. doi:10.1016/j.trf.2008.04.002
Tabachnick, B. G., & Fidell, L. S. (2001). Using multivariate statistics.Boston, MA: Allyn & Bacon.
*Taylor, J. C., & Thomas, R. L., III (2003). Toward measuring safetyculture in aviation maintenance: The structure of trust and profession-alism. International Journal of Aviation Psychology, 13, 321–343. doi:10.1207/S15327108IJAP1304_01
*Tharaldsen, J. E., Olsen, E., & Rundmo, T. (2008). A longitudinal studyof safety climate on the Norwegian continental shelf. Safety Science, 46,427–439. doi:10.1016/j.ssci.2007.05.006
*Truchon, M., Fillion, L., & Gelinas, C. (2003). Validation of a FrenchCanadian version of the Organizational Policies and Practices (OPP)questionnaire. Work, 20, 111–119.
*Truxillo, D. M., Buck, M. A., McCune, E. A., Bauer, T. N., Hammer,L. B., & Bertolino, M. (2007, April). Validity evidence for anexpectancy-based measure of safety motivation. Poster session presentedat the meeting of the Society for Industrial and Organizational Psychol-ogy, New York, NY.
*Turnberg, W., & Daniell, W. (2008). Evaluation of a healthcare safetyclimate measurement tool. Journal of Safety Research, 39, 563–568.
*Turner, N., Chmiel, N., & Walls, M. (2005). Railing for safety: Jobdemands, job control, and safety citizenship role definition. Journal ofOccupational Health Psychology, 10, 504 –512. doi:10.1037/1076-8998.10.4.504
*Turner, N., Parker, S. K., & Williams, H. M. (2009). Self-managingteams, work characteristics, and employee safety performance. Unpub-lished manuscript.
Viswesvaran, C., & Ones, D. S. (1995). Theory testing: Combining psy-
23SAFETY AT WORK
chometric meta-analysis and structural equations modeling. PersonnelPsychology, 48, 865–885. doi:10.1111/j.1744-6570.1995.tb01784.x
*Wallace, C., & Chen, G. (2006). A multilevel integration of personality,climate, self-regulation, and performance. Personnel Psychology, 59,529–557. doi:10.1111/j.1744-6570.2006.00046.x
*Wallace, J. (2005). A multilevel examination of occupational safety:Regulatory focus as an explanatory link between climate, conscientious-ness, and performance. Dissertation Abstracts International: Section B.Sciences and Engineering, 65(7-B), 3760.
*Wallace, J. C., & Chen, G. (2005). Development and validation of awork-specific measure of cognitive failure: Implications for occupa-tional safety. Journal of Occupational and Organizational Psychology,78, 615–632. doi:10.1348/096317905X37442
*Wallace, J. C., & Vodanovich, S. J. (2003). Workplace safety perfor-mance: Conscientiousness, cognitive failure, and their interaction. Jour-nal of Occupational Health Psychology, 8, 316–327. doi:10.1037/1076-8998.8.4.316
*Watson, G. W., Scott, D., Bishop, J., & Turnbeaugh, T. (2005). Dimen-sions of interpersonal relationships and safety in the steel industry.Journal of Business and Psychology, 19, 303–318. doi:10.1007/s10869-004-2230-2
*Westaby, J. D., & Lee, B. C. (2003). Antecedents of injury among youthin agricultural settings: A longitudinal examination of safety conscious-ness, dangerous risk taking, and safety knowledge. Journal of SafetyResearch, 34, 227–240. doi:10.1016/S0022-4375(03)00030-6
*Westaby, J. D., & Lowe, J. K. (2005). Risk-taking orientation and injuryamong youth workers: Examining the social influence of supervisors,coworkers, and parents. Journal of Applied Psychology, 90, 1027–1035.doi:10.1037/0021-9010.90.5.1027
*Williams, H., Turner, N., & Parker, S. K. (2009). The compensatory roleof transformational leadership in promoting safety behaviors. Unpub-lished manuscript.
*Wills, A. R., Watson, B., & Biggs, H. C. (2006). Comparing safetyclimate factors as predictors of work-related driving behavior. Journal ofSafety Research, 37, 375–383. doi:10.1016/j.jsr.2006.05.008
*Wilson, K. A. (2008). Does safety culture predict clinical outcomes?
Dissertation Abstracts International: Section B. Sciences and Engineer-ing, 69(02).
World Heath Organization. (2008). Global strategy on occupational healthfor all: The way to health at work. Retrieved from http://www.who.int/occupational_health/en/
*Zacharatos, A., Barling, J., & Iverson, R. D. (2005). High-performancework systems and occupational safety. Journal of Applied Psychology,90, 77–93. doi:10.1037/0021-9010.90.1.77
*Zhang, Z., Bhave, D., & Arvey, R. (2008, April). Employee participationand workplace safety: A multilevel analysis. Poster session presented atthe meeting of the Society for Industrial and Organizational Psychology,San Francisco, CA.
*Zhou, Q., Fang, D. P., & Wang, X. M. (2008). A method to identifystrategies for the improvement of human safety behavior by consideringsafety climate and personal experience. Safety Science, 46, 1406–1419.doi:10.1016/j.ssci.2007.10.005
Zohar, D. (1980). Safety climate in industrial organizations: Theoreticaland applied implications. Journal of Applied Psychology, 65, 96–102.doi:10.1037/0021-9010.65.1.96
*Zohar, D. (2000). A group-level model of safety climate: Testing theeffect of group climate on microaccidents in manufacturing jobs. Jour-nal of Applied Psychology, 85, 587–596. doi:10.1037/0021-9010.85.4.587
Zohar, D. (2002a). The effects of leadership dimensions, safety climate,and assigned priorities on minor injuries in work groups. Journal ofOrganizational Behavior, 23, 75–92. doi:10.1002/job.130
*Zohar, D. (2002b). Modifying supervisory practices to improve subunitsafety: A leadership-based intervention model. Journal of Applied Psy-chology, 87, 156–163. doi:10.1037/0021-9010.87.1.156
Zohar, D., & Luria, G. (2004). Climate as a social–cognitive constructionof supervisory safety practices: Scripts as proxy of behavior patterns.Journal of Applied Psychology, 89, 322–333. doi:10.1037/0021-9010.89.2.322
Received August 22, 2008Revision received August 13, 2010
Accepted August 23, 2010 �
24 NAHRGANG, MORGESON, AND HOFMANN