Embed Size (px)
Citation preview
Chalmers University of Technology
University of Gothenburg
Department of Computer Science and Engineering
Göteborg, Sweden, December 2014
Safety Analysis and Model Transforming in
EAST-ADL Master of Science Thesis in Software Engineering
WENJING YUAN

The Author grants to Chalmers University of Technology and University of Gothenburg
the non-exclusive right to publish the Work electronically and in a non-commercial
purpose make it accessible on the Internet.
The Author warrants that he/she is the author to the Work, and warrants that the Work
does not contain text, pictures or other material that violates copyright law.
The Author shall, when transferring the rights of the Work to a third party (for example a
publisher or a company), acknowledge the third party about this agreement. If the Author
has signed a copyright agreement with a third party regarding the Work, the Author
warrants hereby that he/she has obtained any necessary permission from this third party to
let Chalmers University of Technology and University of Gothenburg store the Work
electronically and make it accessible on the Internet.
Safety Analysis and Model Transforming in EAST-ADL
Wenjing. Yuan
© Wenjing. Yuan, December 2014.
Examiner: Richard Berntsson Svensson
Chalmers University of Technology
University of Gothenburg
Department of Computer Science and Engineering
SE-412 96 Göteborg
Sweden
Telephone + 46 (0)31-772 1000
Department of Computer Science and Engineering
Göteborg, Sweden December 2014


Acknowledgements
I would like to express my sincere gratitude to my supervisors
Matthias Tichy, Chalmers University of Technology and
University of Gothenburg, and Henrik Lönn, Volvo Group
Trucks Technology, for the continuous support, guidance and
patience throughout this thesis project. In addition, I would like
to thank Prof. Yiannis Papadopoulos and Septavera Sharvia
from University of Hull, for assisting the HiP-HOPS and
EATOP integration. Thanks go to Ma Yue, itemis for providing
technology support in EATOP.
My special thanks go to my colleagues and interviewees at
Volvo Group. Thank you for the trust and valuable input.
In the end, I would like to thank Olle Olsson and my cat Terra
for keeping company with me and encouraging me throughout
the thesis project.
Abstract
As architecture modeling becomes the trend in automotive
industry, problems are raised regarding the gaining complexity
in system design and safety analysis. The current safety
analysis requires large amount of manual work and the result is
usually unstable.
This study follows design research methodology and four
artifacts are designed, implemented and evaluated. The
outcomes of this research improves the current safety analysis
working process by automating the model transformation and
controlling version consistency between dependent model
aspects. Besides, it also provides the possibility to apply safety
analysis in an early stage of the development to reduce the
amount of later modifications.

Table of Content Chapter 1 Introduction ....................................................................................................................... 1
1.1 Problem statement and Research Questions .................................................................................. 1
1.1.1 Defining ................................................................................................................................. 2
1.1.2 Analyzing .............................................................................................................................. 3
1.1.3 Understanding ....................................................................................................................... 3
1.1.4 Evolving ................................................................................................................................ 3
1.2 Overview ....................................................................................................................................... 4
Chapter 2 Background ........................................................................................................................ 5
2.1 EAST-ADL ................................................................................................................................... 5
2.2 EAST-ADL Modeling Concept and Fault Tree Analysis ............................................................. 6
2.2.1 Function Modeling ................................................................................................................. 6
2.2.2 Error Modeling ....................................................................................................................... 8
2.2.3 Fault Tree Analysis................................................................................................................. 9
2.3 EATOP ........................................................................................................................................ 11
2.4 HiP-HOPS ................................................................................................................................... 11
Chapter 3 Related Work .................................................................................................................... 12
Chapter 4 Research Methodology .................................................................................................... 14
Chapter 5 Defining and Reorganizing Error Model ...................................................................... 17
5.1 EAST-ADL Example Model Structure Description .................................................................... 18
5.2 Error Model Auto-generation ...................................................................................................... 22
5.2.1 Concept Description ............................................................................................................. 22
5.2.2 Example Use Case ................................................................................................................ 23
5.2.3 One to One Mapping ............................................................................................................ 25
5.2.4 Alternatives and Decisions ................................................................................................... 27
5.3 Error Model Reorganization ........................................................................................................ 31
5.3.1 Concept Description ............................................................................................................. 31
5.3.2 Example Use Case ................................................................................................................ 31
5.3.3 Alternatives and Decisions ................................................................................................... 34
5.4 Algorithm .................................................................................................................................... 34
5.4.1 Error Model Auto-generation ............................................................................................... 34
5.4.2 Error Model Reorganization ................................................................................................. 35
5.5 Summary ..................................................................................................................................... 37
Chapter 6 HiP-HOPS Fault Tree Analysis in EATOP .................................................................. 38
6.1 Different Levels of Goals ............................................................................................................ 38
6.2 Design and Result ........................................................................................................................ 39
6.2.1 Error Model for Fault Tree Analysis .................................................................................... 40
6.2.2 Generating Fault Tree in EATOP ......................................................................................... 42
6.2.3 Relate Fault Tree with EAST-ADL ...................................................................................... 45
6.3 Summary ..................................................................................................................................... 46
Chapter 7 Graphical Support in EATOP ......................................................................................... 48
7.1 Investigations in model visualization .......................................................................................... 48
7.1.1 Integrate Continental Graphical Editor................................................................................. 49
7.1.2 Integrate Diagram Viewer .................................................................................................... 49
7.2 Different views generated by Diagram generator........................................................................ 50
7.2.1 Identifiable Element ............................................................................................................. 50
7.2.2 ErrorModelType and ErrorModelPrototype View ............................................................... 51
7.2.3 ErrorModelType and ErrorModelPrototype Target View .................................................... 53
7.3 Structure and Algorithm .............................................................................................................. 54
7.4 Summary ..................................................................................................................................... 55
Chapter 8 Consistency Checking between nominal model and error model ............................... 56
8.1 Design Specification .................................................................................................................... 57
8.1.1 Alternatives for consistency checking .................................................................................. 57
8.1.2 Version Control Design Specification .................................................................................. 57
8.2 Result Specification ..................................................................................................................... 59
8.2.1 Initiate Version ..................................................................................................................... 59
8.2.2 Version Increase ................................................................................................................... 61
8.2.3 Checking Version Consistency ............................................................................................. 62
8.2.4 Synchronizing Target Version .............................................................................................. 63
8.3 Summary ..................................................................................................................................... 64
Chapter 9 Evaluation ........................................................................................................................ 65
9.1 Evaluation Criteria ...................................................................................................................... 65
9.1.1 Artifact success ..................................................................................................................... 65
9.1.2 Novelty & Explanation capability ........................................................................................ 66
9.2 Data Collection ............................................................................................................................ 66
9.2.1 Data Collection Method ....................................................................................................... 67
9.2.2 Data Collection Procedure .................................................................................................... 68
9.2.3 Participants ........................................................................................................................... 68
9.2.4 Questions .............................................................................................................................. 69
9.3 Data Analysis .............................................................................................................................. 72
9.3.1 Hypotheses ........................................................................................................................... 72
9.3.2 Data analysis framework ...................................................................................................... 73
9.3.3 Summary of interview findings ............................................................................................ 73
9.3.4 Hypotheses Confirmation and Reflection............................................................................. 84
9.3.5 Threats to Validity ................................................................................................................ 87
Chapter 10 Conclusion ...................................................................................................................... 89
10.1 Summary ................................................................................................................................... 89
10.2 Contribution and Limitation ...................................................................................................... 90
10.3 Future Work .............................................................................................................................. 90
Bibliography ........................................................................................................................................ 91
Appendix A – I ..................................................................................................................................... 95
BBW_4Wheel ErrorModelGeneration Screenshot .......................................................................... 95
Appendix A – II ................................................................................................................................... 97
BBW_4Wheel ErrorModel Re-organization Screenshot ................................................................. 97
Appendix A – III .................................................................................................................................. 99
Three Columns Algorithm .................................................................................................................. 99
Appendix B – EAST-ADL 2.1.12 Class Diagram ........................................................................... 101
Appendix C – I Example Views in GlobalBrakeController Model – Diagram............................ 104
Appendix C – II Example Views in GlobalBrakeController Model – XML ................................ 108
1
Chapter 1 Introduction
With the growing number of integrated functions in automotive systems, one of the main
tasks is to solve the contradiction between the increasing complexity of the system and the
demands on accuracy and efficiency in system development. In order to cope with this
problem, it is getting more and more popular to use suitable levels of abstraction for
representing the system architecture. Various kinds of models and the corresponding analysis
approaches are introduced to handle different situations. Among these, safety analysis
together with system architecture models, which are crucial for measuring the vehicle’s
quality and safety in automotive industry, are chosen to be the topic in this study.
Currently, plenty of tools and approaches are targeting to support safety analysis by
transforming between models according to the reviewed literature. However, challenges
remain in maintaining consistency among safety requirements and analysis results, which
means the final architecture design may not satisfy the corresponding safety requirements
because of the unavoidable modifications in evolutions. Besides, how to guarantee the overall
quality with a limited effort in time and cost is another issue worthy of discussion.
In this research, the researcher focuses on resolving those problems mentioned above by
providing corresponding solutions together with relevant EAST-ADL artifacts. EAST-ADL is
an Architecture Description Language (ADL) for automotive embedded systems (EAST-ADL
specification). The overall goal of this study is providing automation and visualization support
for current safety working flow. The error modeling is a concept in EAST-ADL which
reflects the safety aspect from a system perspective. The research outcomes are evaluated by
system engineers and safety engineers in order to collect feedback and improve the current
and future solutions.
1.1 Problem statement and Research Questions In order to apply the safety analysis to an architecture model, four steps are typically
appropriate to conduct in automotive industry. First is defining an error propagation model
from the architecture model, the error propagation model indicates the possible failures and
how the failures are propagated in the architecture design. Fault tree analysis is the second
step. Based on the information provided in the error propagation model, fault tree analysis
provides a better understanding of how the system can fail. By taking the result from fault tree
analysis into consideration, the third step is to find out how to reduce the risk of failures in the
architecture model and modifying the architecture model is the fourth step. Those four steps
are iteratively applied to eliminate the failure risks.
2
However, problems exist in those working procedures, most of the work are done manually
and redundancy occurs when different teams are working for the same goal. Besides,
inconsistency among system architecture model and error model occurs as they evolve. After
the modifications are made on either architecture or error model side, there is no efficient way
in the system to detect and control these changes with corresponding model on the other side.
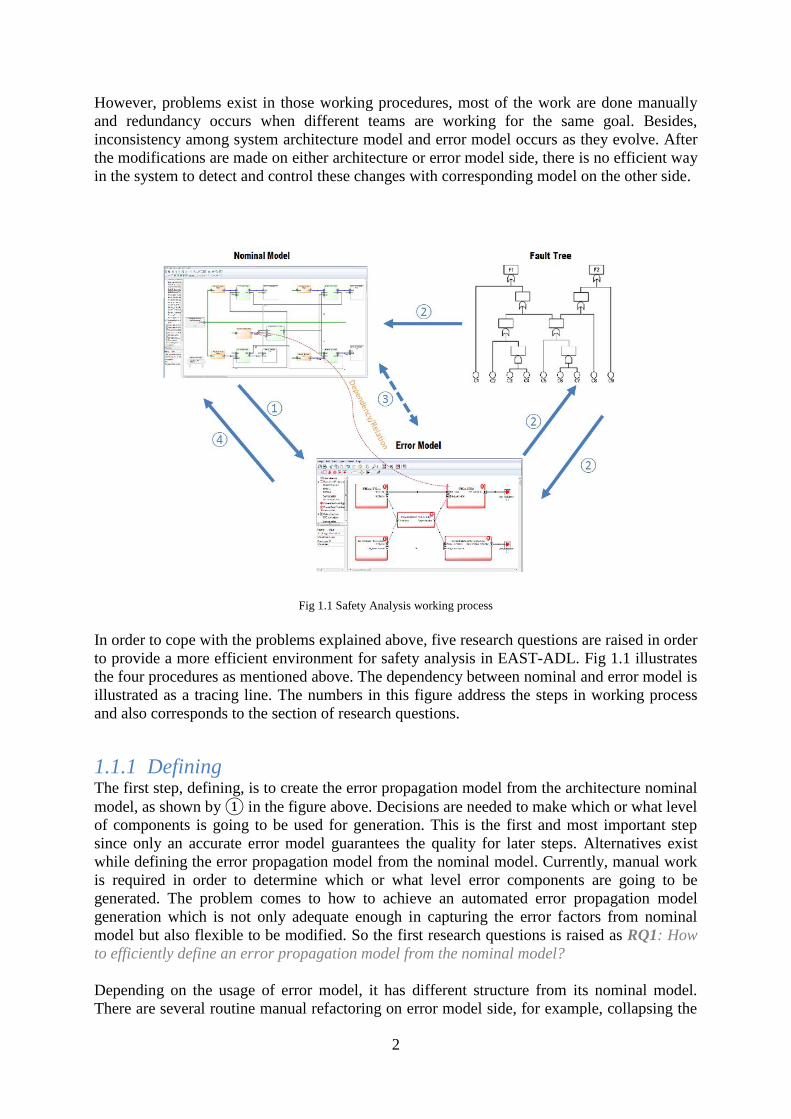
Fig 1.1 Safety Analysis working process
In order to cope with the problems explained above, five research questions are raised in order
to provide a more efficient environment for safety analysis in EAST-ADL. Fig 1.1 illustrates
the four procedures as mentioned above. The dependency between nominal and error model is
illustrated as a tracing line. The numbers in this figure address the steps in working process
and also corresponds to the section of research questions.
1.1.1 Defining The first step, defining, is to create the error propagation model from the architecture nominal
model, as shown by ① in the figure above. Decisions are needed to make which or what level
of components is going to be used for generation. This is the first and most important step
since only an accurate error model guarantees the quality for later steps. Alternatives exist
while defining the error propagation model from the nominal model. Currently, manual work
is required in order to determine which or what level error components are going to be
generated. The problem comes to how to achieve an automated error propagation model
generation which is not only adequate enough in capturing the error factors from nominal
model but also flexible to be modified. So the first research questions is raised as RQ1: How
to efficiently define an error propagation model from the nominal model?
Depending on the usage of error model, it has different structure from its nominal model.
There are several routine manual refactoring on error model side, for example, collapsing the
3
connections and ports which have the same source element and destination element. Some
algorithms are needed to be defined in order to reduce the manual work of refactoring. The
second research question is defining process is revealed as RQ2: How to reduce the manual
work in refactoring the model?
1.1.2 Analyzing The second step is the analysis process. In this step, the fault propagation data in the error
model is synthesized and analyzed into fault tree. The analysis tool automatically generates
the corresponding fault tree once the error logic is defined. There are several analysis tools
available in fault tree analysis area, such as AltaRica, HiP-HOPS, Rodelica. In this research,
we need to decide which tool is the most efficient for EAST-ADL Fault Tree Analysis and
create the corresponding analysis algorithm for EATOP. In order to provide a more efficient
environment for fault tree analysis in EATOP, an implementation is needed to integrate
EATOP with the fault tree analysis tool. So the third research question is: RQ3: How to apply
Fault Tree Analysis on EAST-ADL error model and relate the generated Fault Tree result
with both error model and nominal model in EATOP?
1.1.3 Understanding As shown by ③ in Fig 1.1, this step is for evaluating and validating relations between the
generated models after the previous two steps. In order to have a better understanding, a
certain method of visualization between models is needed. The goal of this step is to help the
user to understand how the error model is related with the corresponding architecture nominal
model. The visualization should be able to reduce the manual work in the current status and
provide a general view of corresponding models. For this reason, the fourth research question
is revealed as RQ4: How to visualize the error propagation model together with nominal
model and fault tree?
1.1.4 Evolving After the models are evaluated, evolution is unavoidable. This step is about the modifications
happening after the initial model generating stage, adjusting and improving the models in
order to fit the constraints and fulfill the safety requirements. As shown in 1.1, the consistency
between nominal model and error model are checked in this step.
Error modeling is the bridge between nominal models and fault tree analysis. Since the fault
tree is generated directly from the error model, the consistency problem between fault tree and
nominal model is transferred as the consistency between error model and nominal model. The
handling of components inconsistency is quite important in automotive structure development
area. So in this step, the research question is raised as RQ5: How to ensure consistency
between nominal architecture models and error models?
4
1.2 Overview The contribution of this study has been made in Electrical and Embedded System department
at AB Volvo Group Trucks Technology, Advanced Technology and Research. Two
supervisors from both industry and academic sides and a certain amount of safety engineers in
this department were involved.
In this study, we designed and implemented several features based on EATOP. EATOP is an
eclipse based EAST-ADL platform. The aims of those features are solving the research
questions revealed in the previous section. For the questions in step ① defining, a one to one
mapping pattern is designed to define the corresponding error model from architecture model.
And the mapping design is implemented into EATOP plugin which is able to automatically
generate error model elements out of existing function model elements. The final outcomes in
first step reduce the manual work in error model defining. For fault tree analysis in the step
②, HiP-HOPS is integrated into EATOP and several fault tree analysis results are annotated
in EATOP model. The graphic support for step ③ understanding in this research focuses on
visualizing the relations between error modeling and architecture modeling since the relation
visualization is the main topic in research question 4. For the inconsistency problem in step
④, a version control feature is developed to help the user manage and synchronize the
changes from version perspective. In order to prove the design and implementation of each
feature solving the research questions and achieving their goals, an evaluation is executed
among system engineers and safety engineers from different departments in Volvo Group
Trucks Technology. Even the whole thesis is carried out in one single company, it still
produces the academic value to improve the common safety analysis procedures in
automotive area and the result of this research is able to generalize to automotive industry.
This thesis report starts with a general introduction of the research background in chapter 2,
which provides more detailed information about EAST-ADL function modeling along with
error modeling and several concepts in safety analysis. Further elaboration and the solutions
for each research question are presented from Chapter 5 to Chapter 8 respectively. Design use
cases are demonstrated in each chapter and the final result screenshot are depicted in
Appendix. Chapter 9 specifies how the evaluation data is collected in this study together with
the collected data analysis. Chapter 10 draws a final conclusion with the outlines of future
work.
5
Chapter 2 Background
This research is mainly based on EAST-ADL, an Architecture Description Language for
automotive embedded system. A description about EAST-ADL is provided in the first section
followed by a detailed explanation of two modeling concepts. EATOP and the tooling
environment are summarized in section 2.3 and it is followed with a description about Fault
Tree Analysis. The related work is elaborated in the end of this chapter.
2.1 EAST-ADL EAST-ADL is an Architecture Description Language (ADL) to model functional-, system-,
software-, and hardware-architecture in the automotive domain (eclipse EATOP, 2013). It is
initially defined in the European ITEA EAST-EEA project and maintained by EAST-ADL
Association. The main role of EAST-ADL is to provide a sufficient detail for design, analysis,
documentation and synthesis in automotive electronic system modeling, it provides various
levels of concerns for organizing and representing the automotive system.
Fig 2.1 EAST-ADL 2.1.12 Abstraction Representation

6
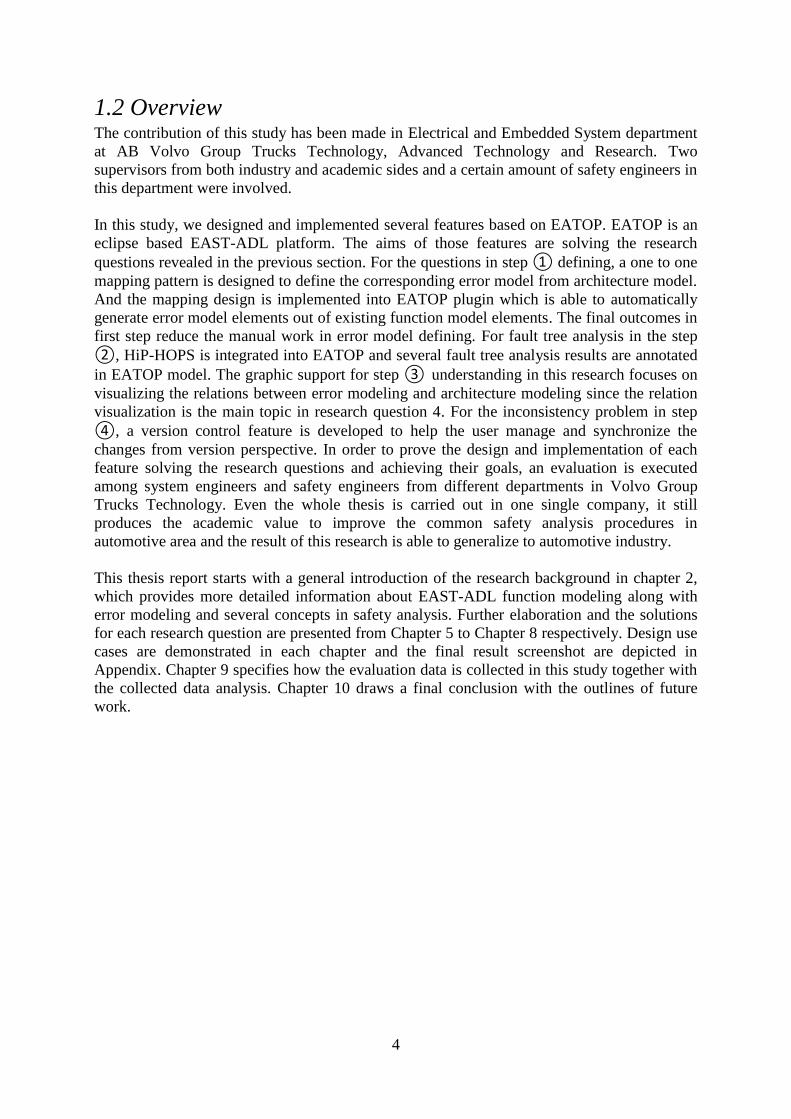
As shown in Fig 2.1, the functionality of the vehicle in EAST-ADL 2.1.12 is described at four
levels of abstractions, which are Vehicle Level, Analysis Level, Design Level and
Implementation Level. Among those four levels, only implementation does not have its own
structure, all the elements are represented by AUTOSAR since AUTOSAR focuses more on
software architecture and execution platform while EAST-ADL is used for features,
functional architecture and topology. The intent of Vehicle level is to state what the vehicle
should do, it contains the modeling elements which represent the intended functionality.
Analysis level provides an abstract functional architecture while Design level has the detailed
functional definition. The right hand side of Fig 2.1 illustrates the extensions in EAST-ADL,
which include structural constructs, behavioral constructs, variability, requirements, timing,
dependability and so on. Those extensions reference the core elements with all abstraction
levels. More detailed information about structural constructs and dependability will be
elaborated in next section.
2.2 EAST-ADL Modeling Concept and Fault Tree Analysis As discussed above, the modeling concepts of EAST-ADL, or so called EAST-ADL
extensions, cover various areas from requirements modeling to timing modeling. In this
section, we will provide more details with an example model about function modeling and
safety modeling.
2.2.1 Function Modeling Function Modeling is performed in the Functional Analysis Architecture and Function Design
Architecture, which are also the root components in Analysis Level as FAA and in Function
Level as FDA. The Allocation of Function Design Architecture is represented in
corresponding Hardware Design Architecture. The concept provided in function modeling is
the functions interact with each other through their function ports and connectors. Each of the
function is modeled by function prototypes and they can be typed by a function type. And a
function type is where contains ports, connectors and other function elements. The general
structure is illustrated in Fig 2.2 and the class diagram of function modeling is shown in
Appendix B.1.
.
Fig 2.2 EAST-ADL 2.1.12 Function Modeling on Analysis Level and Design Level
7
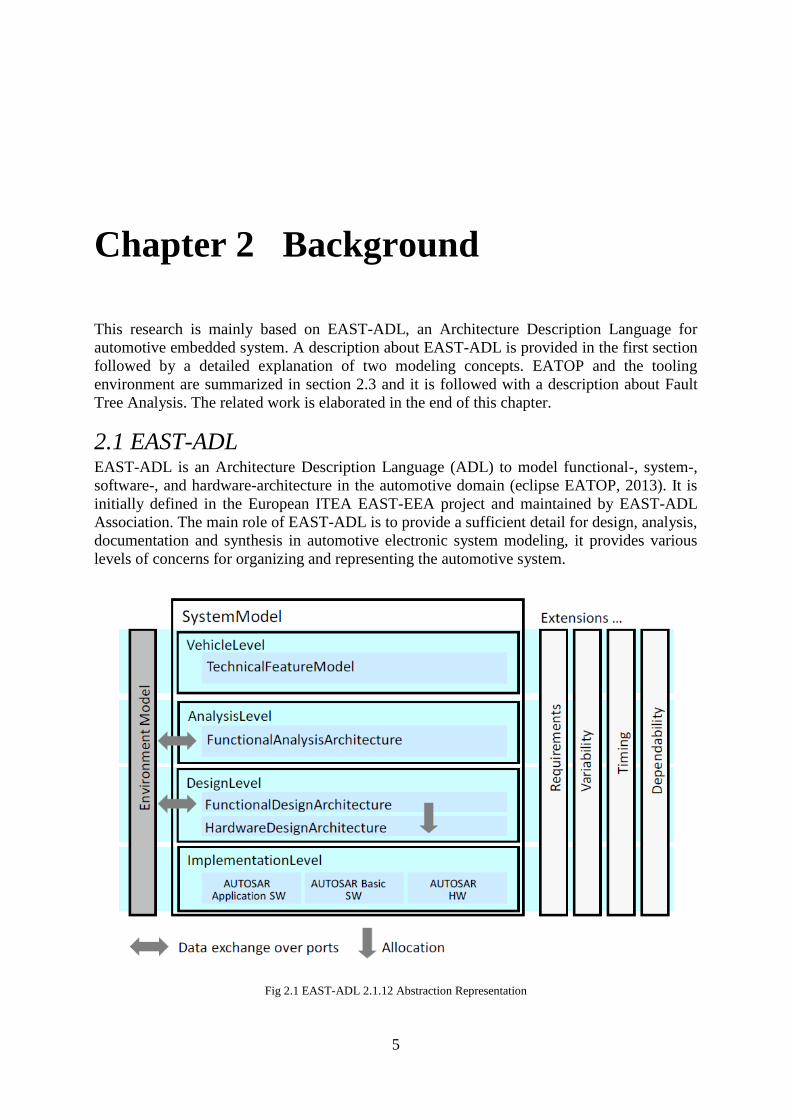
As a standard example of EAST-ADL, “Brake_By_Wire_4Wheel” contains function
modeling elements on both analysis level and design level. Those two levels are separated
into two packages called “AnalysisLevelElements” and “DesignLevelElements”. As
illustrated in Fig 2.3(a), the analysis function elements like AnalysisFunctionType(ABS_T,
BatteryObserver..), FunctionalDevice(BatteryDoDSensor, BatteryVoltageSensor..) are
directly located under the AnalysisLevelElements package. AnalysisFunctionType is used to
model the functional structure on AnalysisLevel and the FunctionalDevice is the interface
between the electronic architecture and the environment (EAST-ADL specification 2.1.12).
While the DesignLevelElements are divided into function modeling and hardware modeling.
“FCN” contains the function design architecture elements like DesignFunctionType(ABS_T,
BBW_FDA..), used to model the functional structure on DesignLevel. And
HardwareFunctionType (HW_Brake_T, HW_Encoder_T..) types DesignFuhnctionPrototypes
(EAST-ADL specification 2.1.12). “HW” package, which means Hardware Modeling
contains the elements to model physical entities of the embedded electrical/electronic system.
The example DesignLevel elements are shown in Fig 2.3(b).
Fig 2.3(a) Analysis Level Elements in BBW Fig 2.3(b) Design Level Elements in BBW
Fig 2.3 EAST-ADL Brake-By-Wire Example of Function Modeling
8
2.2.2 Error Modeling EAST-ADL error modeling provides the concerns with faults, errors and failures throughout
an architecture design process. It provides the support for safety engineering by representing
possible incorrect behaviors of a system in its operation. (e.g., component errors and their
propagations.) In this case, the abnormal behaviors of architectural elements as well as their
instantiations in a particular product context can be captured and they are captured in one
error modeling element called “Error Behavior”. An incoming flaw or an internal flaw
represents a fault for the component which may or may not result in a component failure.
While an outgoing flaw which is propagated from the component results a failure. (EAST-
ADL Domain Model Specification, V2.1.12).
Fig 2.4 EAST-ADL 2.1.12 Error Modeling
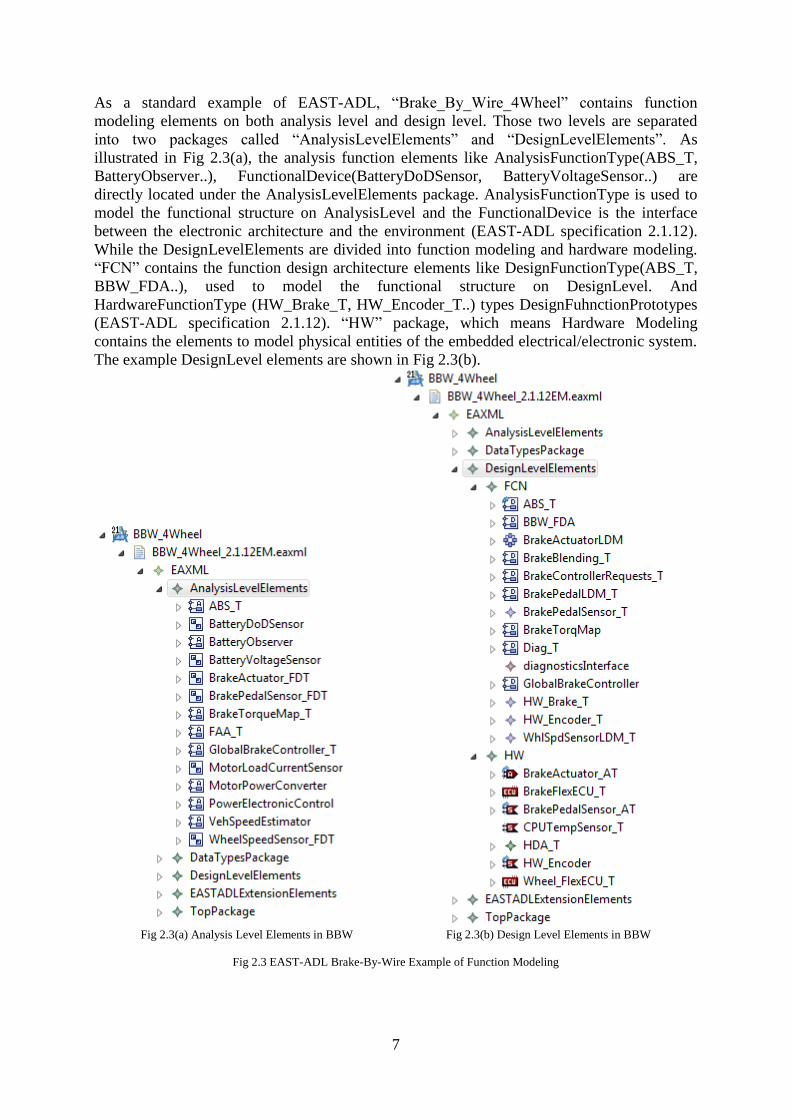
Figure 2.4 illustrates the relations between error model and function analysis model. Error
Modeling is regarded as a separate view from nominal architecture. The related error models
present traces to the nominal architecture and the hazard together with error relation between
the components. As presented in Fig 2.4, EM1 in Dependability side under ErrorModel
represents the failure logic of AF1 in SystemModel side under AnalysisLevel and EM2
represnets both AF2 and AF3 in the system model, which means the tracing from error model
to system model could be a one to one element mapping or one to many mapping according to
the different situations. Besides providing the FaultFailure logic, error model elements also
represent the ASIL level of its corresponding system model. More information about basic
concept of failures is presented in section 2.2.3. The ASIL level is an automotive safety
integrity level which expresses the required levels of safety in one system. Each hazardous
event is assigned an ASIL to each required error model element, which means the criticality
of this hazard. As shown above, EM2 is assigned the ASIL as level C. In general, Error
modeling concept in EAST-ADL is a language construct for associating the annotations of
error descriptions to the target system entities for maintaining the traceability (Chen, et al.
2013) and it is also the base of safety analysis which is elaborated in section 2.2.3.
Taking the Brake-By-Wire model as an example, Fig 2.5 carries out more detailed
information of how error modeling elements behave in a system. The Dependability package
of a system contains all the related elements which represent the system’s ability to ensure
service failures are at a level of frequency and severity that is acceptable and Error Modeling
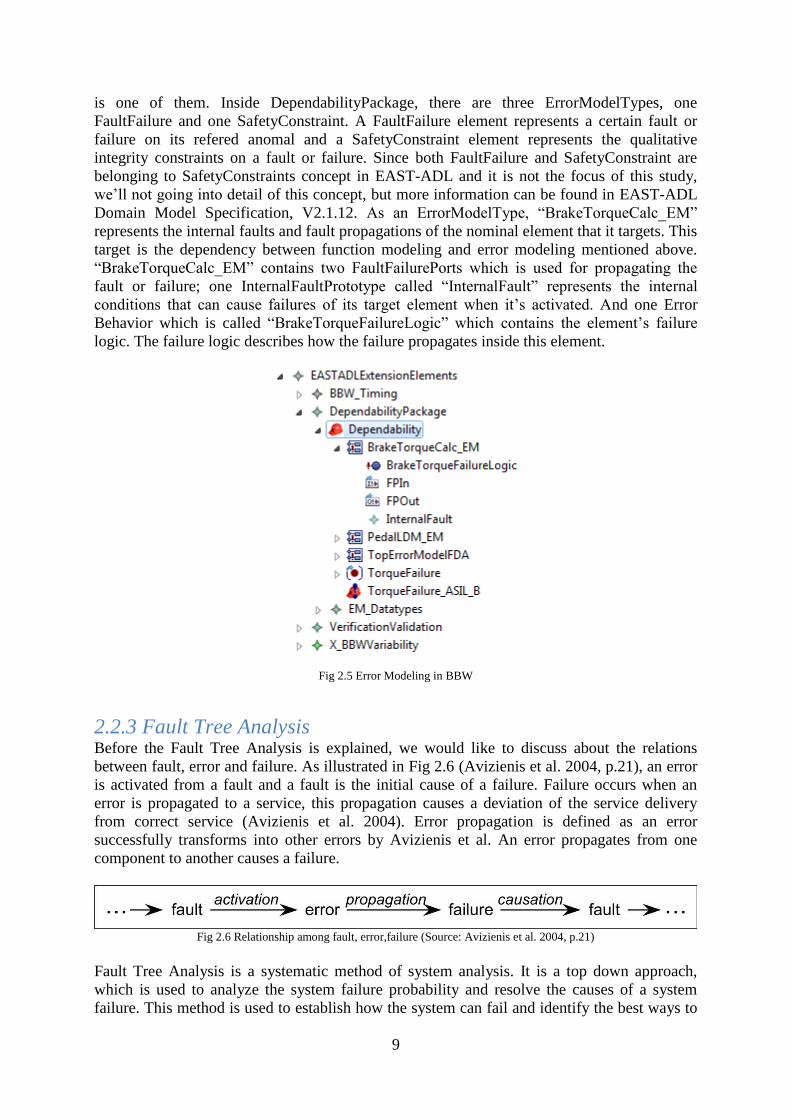
9
is one of them. Inside DependabilityPackage, there are three ErrorModelTypes, one
FaultFailure and one SafetyConstraint. A FaultFailure element represents a certain fault or
failure on its refered anomal and a SafetyConstraint element represents the qualitative
integrity constraints on a fault or failure. Since both FaultFailure and SafetyConstraint are
belonging to SafetyConstraints concept in EAST-ADL and it is not the focus of this study,
we’ll not going into detail of this concept, but more information can be found in EAST-ADL
Domain Model Specification, V2.1.12. As an ErrorModelType, “BrakeTorqueCalc_EM”
represents the internal faults and fault propagations of the nominal element that it targets. This
target is the dependency between function modeling and error modeling mentioned above.
“BrakeTorqueCalc_EM” contains two FaultFailurePorts which is used for propagating the
fault or failure; one InternalFaultPrototype called “InternalFault” represents the internal
conditions that can cause failures of its target element when it’s activated. And one Error
Behavior which is called “BrakeTorqueFailureLogic” which contains the element’s failure
logic. The failure logic describes how the failure propagates inside this element.
Fig 2.5 Error Modeling in BBW
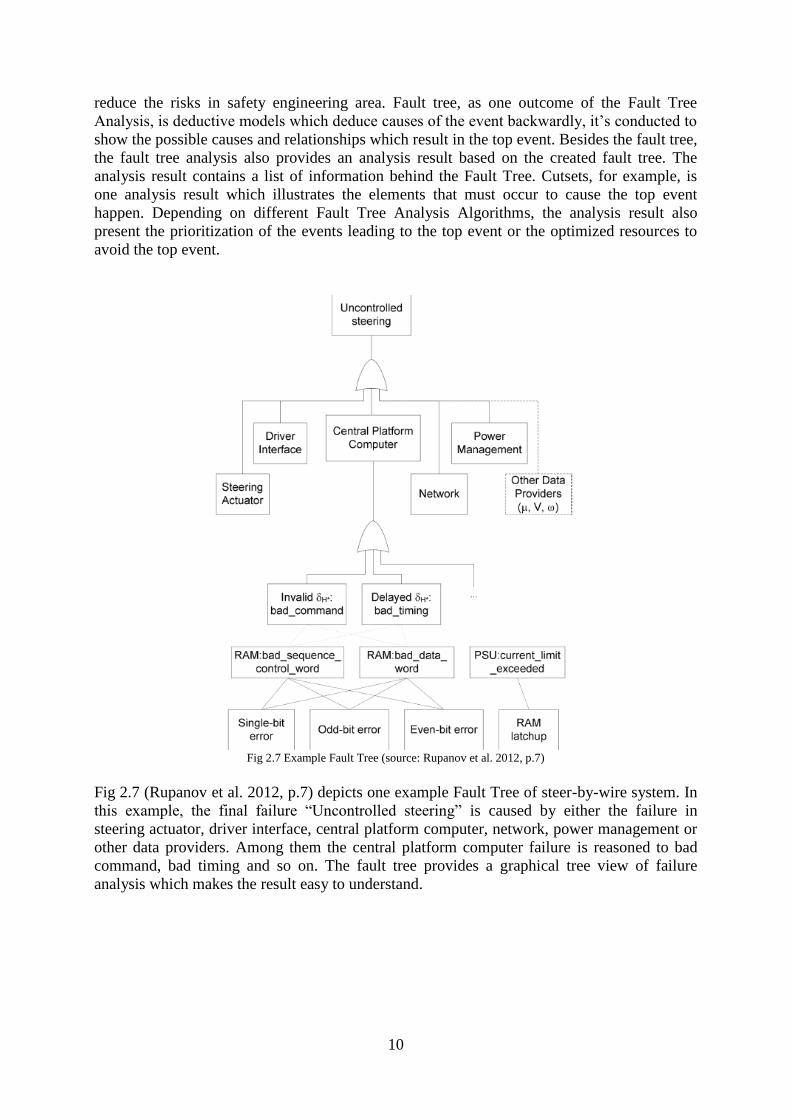
2.2.3 Fault Tree Analysis Before the Fault Tree Analysis is explained, we would like to discuss about the relations
between fault, error and failure. As illustrated in Fig 2.6 (Avizienis et al. 2004, p.21), an error
is activated from a fault and a fault is the initial cause of a failure. Failure occurs when an
error is propagated to a service, this propagation causes a deviation of the service delivery
from correct service (Avizienis et al. 2004). Error propagation is defined as an error
successfully transforms into other errors by Avizienis et al. An error propagates from one
component to another causes a failure.
Fig 2.6 Relationship among fault, error,failure (Source: Avizienis et al. 2004, p.21)
Fault Tree Analysis is a systematic method of system analysis. It is a top down approach,
which is used to analyze the system failure probability and resolve the causes of a system
failure. This method is used to establish how the system can fail and identify the best ways to
10
reduce the risks in safety engineering area. Fault tree, as one outcome of the Fault Tree
Analysis, is deductive models which deduce causes of the event backwardly, it’s conducted to
show the possible causes and relationships which result in the top event. Besides the fault tree,
the fault tree analysis also provides an analysis result based on the created fault tree. The
analysis result contains a list of information behind the Fault Tree. Cutsets, for example, is
one analysis result which illustrates the elements that must occur to cause the top event
happen. Depending on different Fault Tree Analysis Algorithms, the analysis result also
present the prioritization of the events leading to the top event or the optimized resources to
avoid the top event.
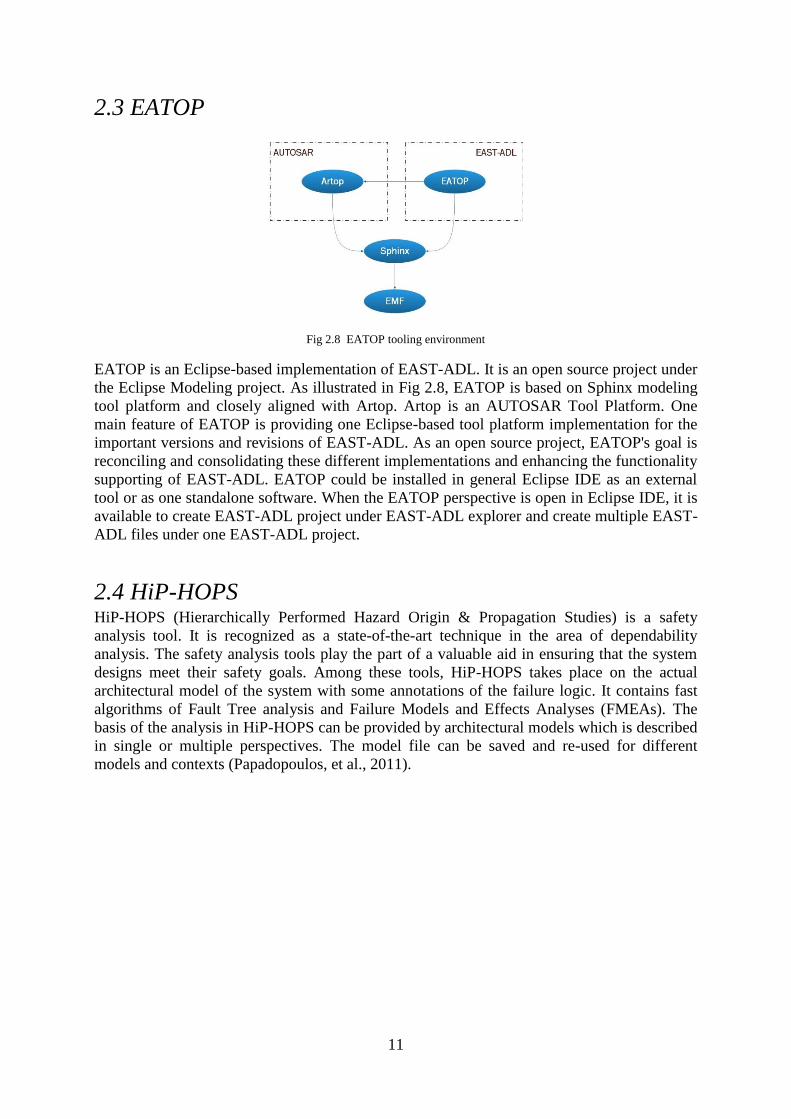
Fig 2.7 Example Fault Tree (source: Rupanov et al. 2012, p.7)
Fig 2.7 (Rupanov et al. 2012, p.7) depicts one example Fault Tree of steer-by-wire system. In
this example, the final failure “Uncontrolled steering” is caused by either the failure in
steering actuator, driver interface, central platform computer, network, power management or
other data providers. Among them the central platform computer failure is reasoned to bad
command, bad timing and so on. The fault tree provides a graphical tree view of failure
analysis which makes the result easy to understand.
11
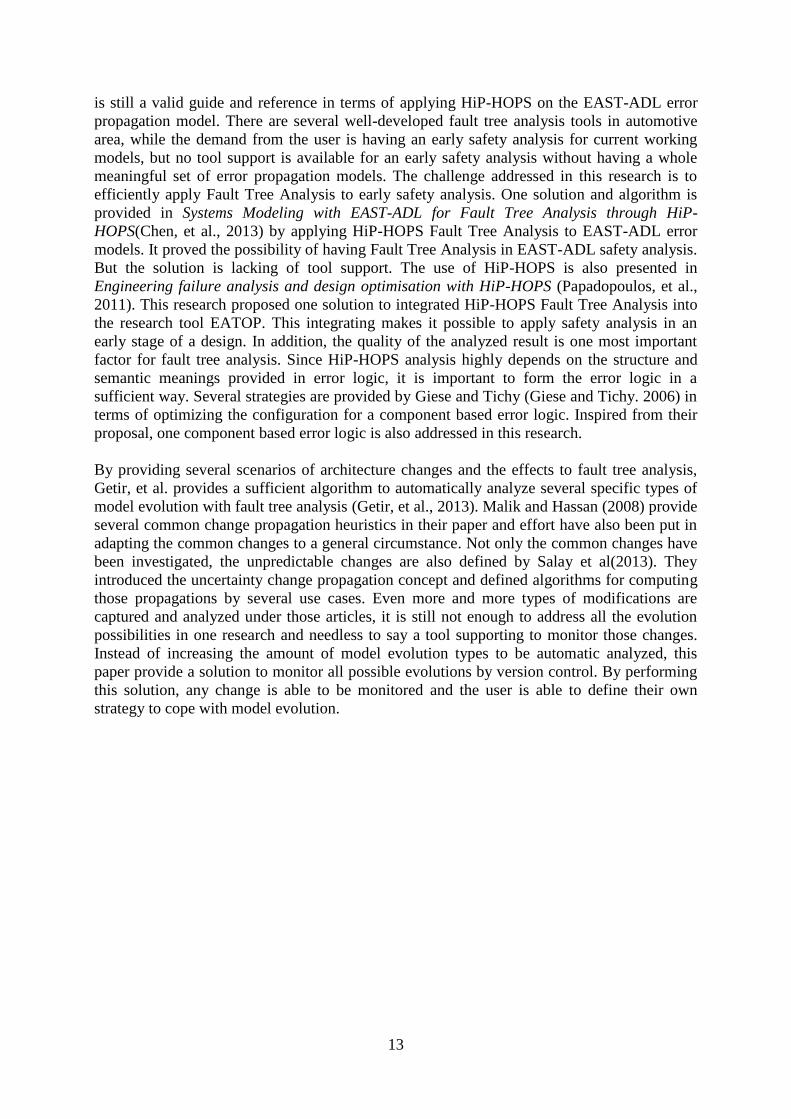
2.3 EATOP
Fig 2.8 EATOP tooling environment
EATOP is an Eclipse-based implementation of EAST-ADL. It is an open source project under
the Eclipse Modeling project. As illustrated in Fig 2.8, EATOP is based on Sphinx modeling
tool platform and closely aligned with Artop. Artop is an AUTOSAR Tool Platform. One
main feature of EATOP is providing one Eclipse-based tool platform implementation for the
important versions and revisions of EAST-ADL. As an open source project, EATOP's goal is
reconciling and consolidating these different implementations and enhancing the functionality
supporting of EAST-ADL. EATOP could be installed in general Eclipse IDE as an external
tool or as one standalone software. When the EATOP perspective is open in Eclipse IDE, it is
available to create EAST-ADL project under EAST-ADL explorer and create multiple EAST-
ADL files under one EAST-ADL project.
2.4 HiP-HOPS HiP-HOPS (Hierarchically Performed Hazard Origin & Propagation Studies) is a safety
analysis tool. It is recognized as a state-of-the-art technique in the area of dependability
analysis. The safety analysis tools play the part of a valuable aid in ensuring that the system
designs meet their safety goals. Among these tools, HiP-HOPS takes place on the actual
architectural model of the system with some annotations of the failure logic. It contains fast
algorithms of Fault Tree analysis and Failure Models and Effects Analyses (FMEAs). The
basis of the analysis in HiP-HOPS can be provided by architectural models which is described
in single or multiple perspectives. The model file can be saved and re-used for different
models and contexts (Papadopoulos, et al., 2011).

12
Chapter 3 Related Work
Several areas are covered in this thesis, which are automotive modeling language, safety
analysis process and development, Fault Tree Analysis and error propagation together with
change propagation. In each area, several latest academic articles are studied as related work
in this thesis. The related works play the role of navigator to lead the academic direction of
this research.
Cuenot, et al proposed a basic safety procedure as shown in Fig 3.1. This safety analysis
process concept is raised in “Safe Automotive soFtware architecture” (SAFE) project and it is
applicable for both AUTOSAR and EAST-ADL modeling language. This working procedure
is used as a base in this research and several improvements are provided in this research.
Fig 3.1 Safety analysis process overview for functional safety concept (Cuenot, et al., 2013)
The automotive industry are using several modeling languages. Besides EAST-ADL, the
AUTOSAR (AUTomotive Open System ARchitecture) standardized architecture is used for
describing software component implementation and integration together with ECU
configuration (Cuenot, et al., 2013). Delivered in 2012, AUTOSAR 4.0 contains a well-
defined set of safety mechanisms responsible for error detection and error handling.
AUTOSAR does not, however, support modeling and analysis of error propagation. Since the
EAST-ADL safety support are applicable to both AUTOSAR and EAST-ADL, we focus on
the latter.
The need of creating connections between architecture model and fault tree analysis addressed
in third research is still a valid and common question in safety analysis area. Grunske and Han
provide a comparison between existing safety evaluation methods and AADL’s error annex
from modeling support, process support and tool support three perspectives (Grunske and
Han, 2008). The pros and cons of applying HiP-HOPS Fault Tree Analysis is also addressed
in comparison. Even this paper focuses on presenting the strength of AADL’s error annex, it
13
is still a valid guide and reference in terms of applying HiP-HOPS on the EAST-ADL error
propagation model. There are several well-developed fault tree analysis tools in automotive
area, while the demand from the user is having an early safety analysis for current working
models, but no tool support is available for an early safety analysis without having a whole
meaningful set of error propagation models. The challenge addressed in this research is to
efficiently apply Fault Tree Analysis to early safety analysis. One solution and algorithm is
provided in Systems Modeling with EAST-ADL for Fault Tree Analysis through HiP-
HOPS(Chen, et al., 2013) by applying HiP-HOPS Fault Tree Analysis to EAST-ADL error
models. It proved the possibility of having Fault Tree Analysis in EAST-ADL safety analysis.
But the solution is lacking of tool support. The use of HiP-HOPS is also presented in
Engineering failure analysis and design optimisation with HiP-HOPS (Papadopoulos, et al.,
2011). This research proposed one solution to integrated HiP-HOPS Fault Tree Analysis into
the research tool EATOP. This integrating makes it possible to apply safety analysis in an
early stage of a design. In addition, the quality of the analyzed result is one most important
factor for fault tree analysis. Since HiP-HOPS analysis highly depends on the structure and
semantic meanings provided in error logic, it is important to form the error logic in a
sufficient way. Several strategies are provided by Giese and Tichy (Giese and Tichy. 2006) in
terms of optimizing the configuration for a component based error logic. Inspired from their
proposal, one component based error logic is also addressed in this research.
By providing several scenarios of architecture changes and the effects to fault tree analysis,
Getir, et al. provides a sufficient algorithm to automatically analyze several specific types of
model evolution with fault tree analysis (Getir, et al., 2013). Malik and Hassan (2008) provide
several common change propagation heuristics in their paper and effort have also been put in
adapting the common changes to a general circumstance. Not only the common changes have
been investigated, the unpredictable changes are also defined by Salay et al(2013). They
introduced the uncertainty change propagation concept and defined algorithms for computing
those propagations by several use cases. Even more and more types of modifications are
captured and analyzed under those articles, it is still not enough to address all the evolution
possibilities in one research and needless to say a tool supporting to monitor those changes.
Instead of increasing the amount of model evolution types to be automatic analyzed, this
paper provide a solution to monitor all possible evolutions by version control. By performing
this solution, any change is able to be monitored and the user is able to define their own
strategy to cope with model evolution.

14
Chapter 4 Research Methodology
According to the fact that this research aims at improving the safety analysis working process,
action research and design research are taken into consideration since both of them could be
used to address an improvement in information systems. Design research is a constitution of
finding problem, design and development in information technology area. It is sometimes
called as “Improvement Research”, which means the improving performance plays an
important part in design research. Action research is a fundamentally change-oriented
approach and it focuses on practical problems with theoretical relevance (Cole, et al., 2005).
As specified by the name, action research applies changes through action. Even if both
research methods aim at improvement, there are dissimilarities among them. Action research
emanates from social science while design research emanates from engineering science.
Design research demands innovation and novel technology and it aims for cutting-edge
technology, where action research goes more for normal design practice and it demands rather
safe solutions based on robust technology(Goldkuhl, 2013). Being related to an FFI (Strategic
Vehicle Research and Innovation) project, this research applies more innovation and cutting-
edge technology than existing robust technology. Besides, new artifacts are designed and
implemented in this research rather than improving by observing action. Due to the reasons
above, design research is selected to be conducted in this thesis work.
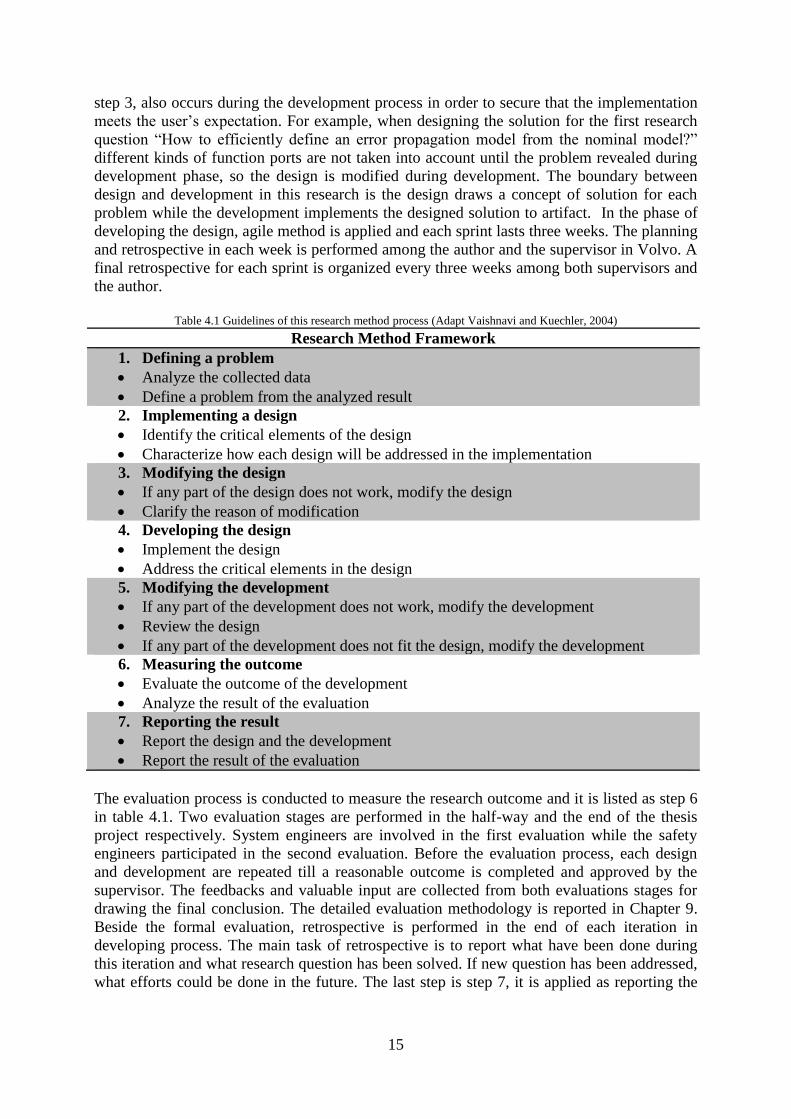
The research process in this study is listed in Table 4.1. It is based on the design science
research model given by Vaishnavi and Kuechler (Vaishnavi and Kuechler, 2004). Step 1 is
defining a problem. All the data for defining problems in this research are collected by
industry supervisor among the experts working in system architecture and safety analysis area
in Volvo Group Trucks Technology. By considering the probability of the problems to be
solved and the priority of importance of each problem, five research questions are revealed.
After the questions are defined, step 2 designing is performed. A design process is divided
into implementing a design and modifying a design as shown in table 4.1. The critical
elements defined in each research question are reflected in the design. For example, the
critical elements of first research question “How to efficiently define an error propagation
model from the nominal model?” are “efficiently define” and bridging two modeling concepts.
In order to reflect those two aspects in the design, a sufficient mapping strategy is designed to
bridge different modeling elements. The time performance is also taken into consideration
when defining the algorithm in order to fulfill the demands of “efficiency”. More elaboration
for this research question is presented in Chapter 5. Besides, several modifications are applied
in order to finalize a design. When an initial design is released, an investigation is needed to
prove the feasibility of the design and this investigation is executed by researcher. Whenever
problems found in the investigated design, a discussion is arranged among supervisors and
researcher to decide whether to modify the design and if yes, how to modify it. When a design
is approved and available to develop, the research comes to step 4, the development stage
which is listed as “Developing the design” in the table. The modification of design which is
15
step 3, also occurs during the development process in order to secure that the implementation
meets the user’s expectation. For example, when designing the solution for the first research
question “How to efficiently define an error propagation model from the nominal model?”
different kinds of function ports are not taken into account until the problem revealed during
development phase, so the design is modified during development. The boundary between
design and development in this research is the design draws a concept of solution for each
problem while the development implements the designed solution to artifact. In the phase of
developing the design, agile method is applied and each sprint lasts three weeks. The planning
and retrospective in each week is performed among the author and the supervisor in Volvo. A
final retrospective for each sprint is organized every three weeks among both supervisors and
the author.
Table 4.1 Guidelines of this research method process (Adapt Vaishnavi and Kuechler, 2004)
Research Method Framework
1. Defining a problem
Analyze the collected data
Define a problem from the analyzed result
2. Implementing a design
Identify the critical elements of the design
Characterize how each design will be addressed in the implementation
3. Modifying the design
If any part of the design does not work, modify the design
Clarify the reason of modification
4. Developing the design
Implement the design
Address the critical elements in the design
5. Modifying the development
If any part of the development does not work, modify the development
Review the design
If any part of the development does not fit the design, modify the development
6. Measuring the outcome
Evaluate the outcome of the development
Analyze the result of the evaluation
7. Reporting the result
Report the design and the development
Report the result of the evaluation
The evaluation process is conducted to measure the research outcome and it is listed as step 6
in table 4.1. Two evaluation stages are performed in the half-way and the end of the thesis
project respectively. System engineers are involved in the first evaluation while the safety
engineers participated in the second evaluation. Before the evaluation process, each design
and development are repeated till a reasonable outcome is completed and approved by the
supervisor. The feedbacks and valuable input are collected from both evaluations stages for
drawing the final conclusion. The detailed evaluation methodology is reported in Chapter 9.
Beside the formal evaluation, retrospective is performed in the end of each iteration in
developing process. The main task of retrospective is to report what have been done during
this iteration and what research question has been solved. If new question has been addressed,
what efforts could be done in the future. The last step is step 7, it is applied as reporting the

16
result. A report which presents the design, development and evaluation in this research is the
outcome of this step.
17
Chapter 5 Defining and
Reorganizing Error Model
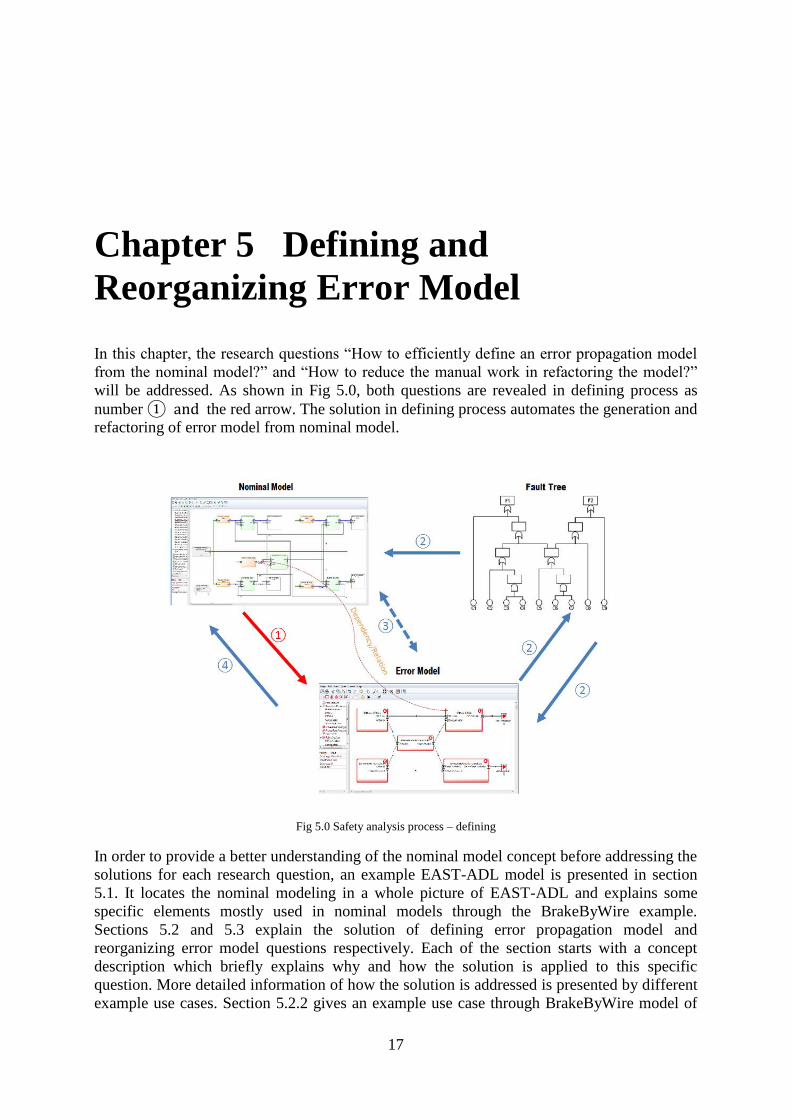
In this chapter, the research questions “How to efficiently define an error propagation model
from the nominal model?” and “How to reduce the manual work in refactoring the model?”
will be addressed. As shown in Fig 5.0, both questions are revealed in defining process as
number ① and the red arrow. The solution in defining process automates the generation and
refactoring of error model from nominal model.
Fig 5.0 Safety analysis process – defining
In order to provide a better understanding of the nominal model concept before addressing the
solutions for each research question, an example EAST-ADL model is presented in section
5.1. It locates the nominal modeling in a whole picture of EAST-ADL and explains some
specific elements mostly used in nominal models through the BrakeByWire example.
Sections 5.2 and 5.3 explain the solution of defining error propagation model and
reorganizing error model questions respectively. Each of the section starts with a concept
description which briefly explains why and how the solution is applied to this specific
question. More detailed information of how the solution is addressed is presented by different
example use cases. Section 5.2.2 gives an example use case through BrakeByWire model of

18
how the error models are generated and section 5.3.2 provides the examples for error model
reorganization. A one to one model mapping is designed and developed during error model
generation and this is presented in section 5.2.3. The alternatives and decisions that have been
made during resolving the research question is discussed in the end of each section.
By showing explicit considerations of safety concerns throughout an architecture design
process (Blom, et al.,2013), the functional safety modeling mitigates the risks in the long run.
Error propagation modeling, as one part of safety modeling and an extension of the nominal
architecture model, will be demonstrated in this section. A one to one mapping pattern
between EAST-ADL nominal model and error propagation model will be provided. An
EATOP based plug-in is implemented according to this pattern in order to automatically
generate an error propagation model. After the user selection, this error propagation auto-
generation plug-in is able to create all the error model elements together with error behavior
under a suitable container and set all the corresponding targets and instance references
according to EAST-ADL2.1.12. In order to enhance the user experience and reduce the
manual work, collapsing error model elements and navigating targets are implemented as
additional features in this error propagation plug-in. The result screenshots of both error
model generation and error model re-organization are shown in Appendix A.
5.1 EAST-ADL Example Model Structure Description
The figure below illustrates the structure of top level packages defined in EAST- ADL 2.1.12.
All elements, such as requirement, behavior, function type etc., are classified into the sub-
packages inside “EAST-ADL” package as shown in Fig 5.1.
Fig 5.1 Packages in the EAST-ADL domain model
The top container for each instance is called “EAXML”, the XML-based exchange format for
EAST-ADL, supported e.g. by EATOP. In order to allow information exchange between
organizations and tools of design artifacts, this language specification describes how to
capture the needed information for relevant analysis and synthesis but does not define how the
analysis or synthesis should be done (EAST-ADL specification 2.1.12). Before we start with
the example, several element concepts in EAST-ADL needed to be declared. All the
19
explanations are collected from EAST-ADL specification 2.1.12 and each of the element can
also refer to Fig B.1 in Appendix B.
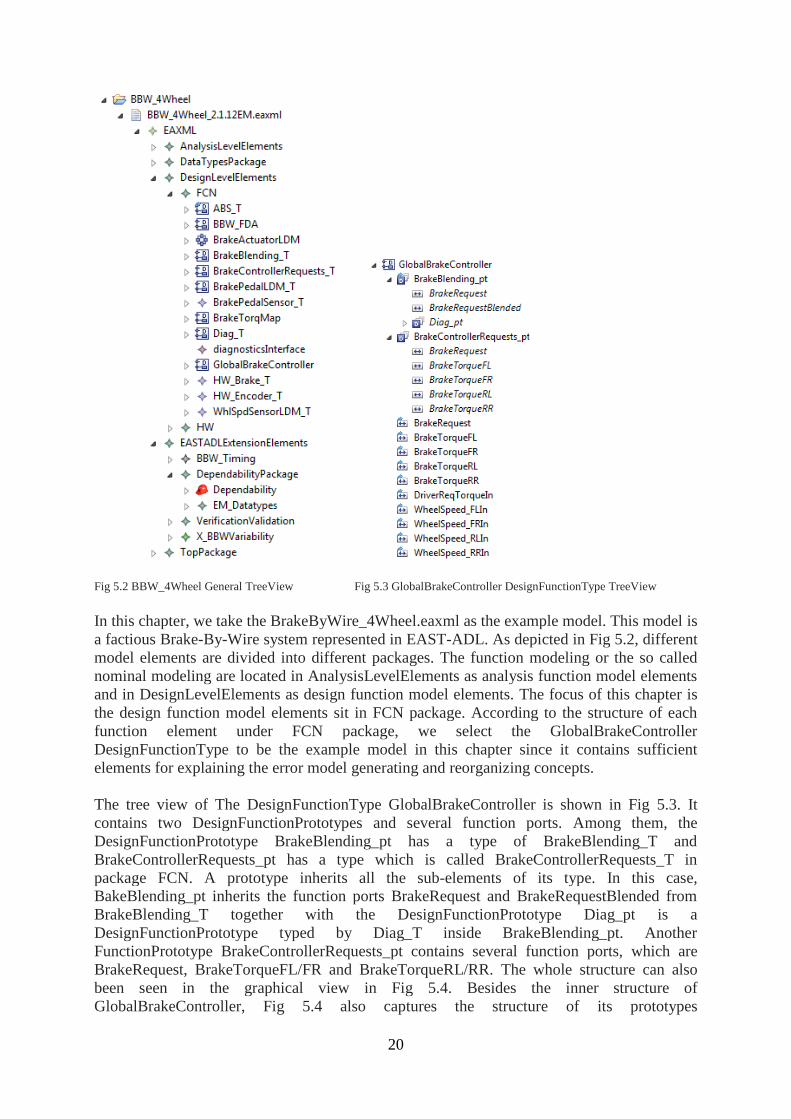
Function modeling:
“The function modeling is performed in the FunctionalAnalysisArchitecture (in the
AnalysisLevel) and the FunctionalDesignArchitecture (in the DesignLevel). The main
modeling concept applied here is functional component modeling:Functions interact with one
another via ports that are connected by connectors owned by the composing function.
Occurrences of functions are modeled by typed prototypes in the composing function. These
occurrences are typed by types.”(EAST-ADL specification 2.1.12)
Function Type
“The Function Model Type includes DesignFunctionType and AnalysisFunctionType. It may
interact with other Functions through their FunctionPorts. Furthermore, a FunctionType may
be decomposed into the contained parts that are FunctionPrototypes. This allows the
functionalities provided by the parent Function to be broken up hierarchically into sub-
functionalities.” (EAST-ADL specification 2.1.12)
Function Prototype
“The FunctionPrototype contains DesignFunctionPrototype and AnalysisFunctionPrototype.
It represents references to the occurrence of the FunctionType that types it when it acts as a
part. The FunctionPrototype is typed by a FunctionType. So the FunctionPrototype represents
an occurrence of the FunctionType that types it.” (EAST-ADL specification 2.1.12)
Function Port
“Function Port contains FunctionFlowPort, FunctionPowerPort and
FunctionClientServerPort. FunctionFlowPorts are single buffer overwrite and non-
consumable.They can be connected if their FunctionPort signatures match. Each
FunctionFlowPort has a direction of “IN” or “OUT” or “IN/OUT”. The FunctionPowerPort
is a FunctionPort for denoting the physical interactions between environment and
sensing/actuation functions. The FunctionPowerPort conserves physical variables in a
dynamic process. The FunctionClientServerPort is a FunctionPort for client-server
interaction. A number of FunctionClientServerPorts of clientServerType "client" can be
connected to one FunctionClientServerPort of clientServerType "server".” (EAST-ADL
specification 2.1.12)The meta-model of Function Port is also shown in Fig B.3.
Function Connector
“Function Connector represents the connections between Function Ports. It could connect
between FunctionPrototypes and between FunctionPrototype and its located FunctionType.
The latter connection is called the delegation connection.” (EAST-ADL specification 2.1.12)
The meta-model of Function Connector is also shown in Fig B.2.
20
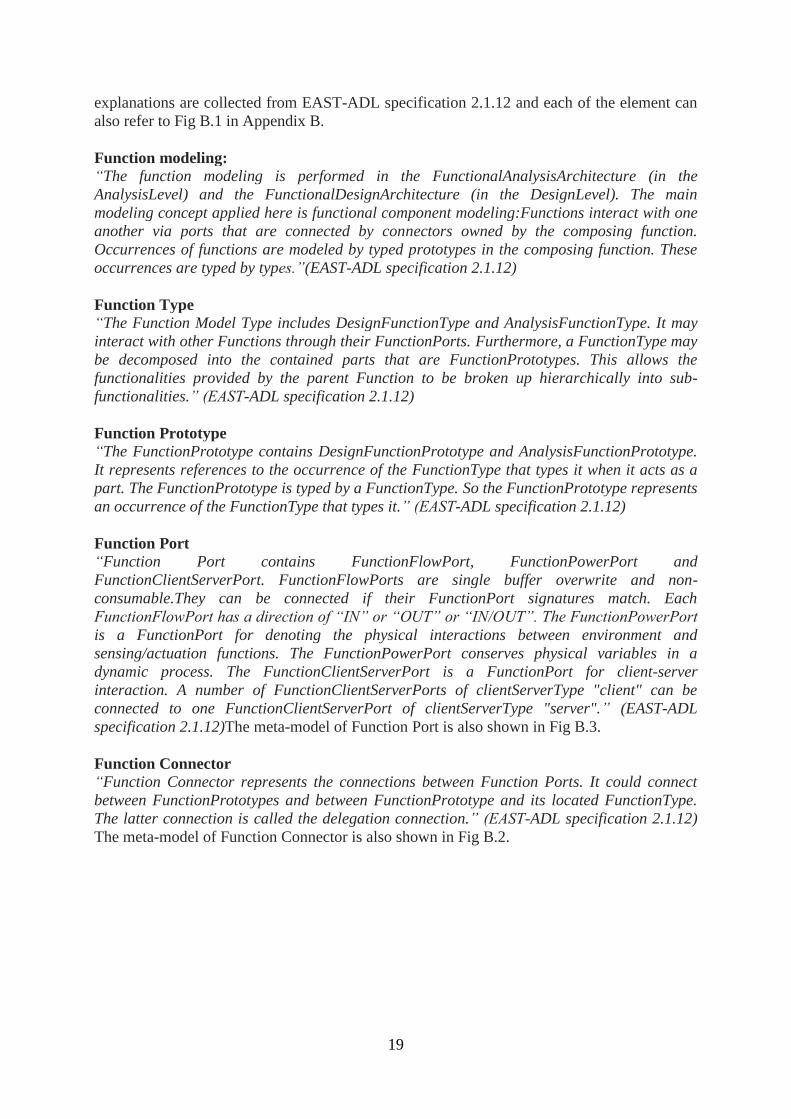
Fig 5.2 BBW_4Wheel General TreeView Fig 5.3 GlobalBrakeController DesignFunctionType TreeView
In this chapter, we take the BrakeByWire_4Wheel.eaxml as the example model. This model is
a factious Brake-By-Wire system represented in EAST-ADL. As depicted in Fig 5.2, different
model elements are divided into different packages. The function modeling or the so called
nominal modeling are located in AnalysisLevelElements as analysis function model elements
and in DesignLevelElements as design function model elements. The focus of this chapter is
the design function model elements sit in FCN package. According to the structure of each
function element under FCN package, we select the GlobalBrakeController
DesignFunctionType to be the example model in this chapter since it contains sufficient
elements for explaining the error model generating and reorganizing concepts.
The tree view of The DesignFunctionType GlobalBrakeController is shown in Fig 5.3. It
contains two DesignFunctionPrototypes and several function ports. Among them, the
DesignFunctionPrototype BrakeBlending_pt has a type of BrakeBlending_T and
BrakeControllerRequests_pt has a type which is called BrakeControllerRequests_T in
package FCN. A prototype inherits all the sub-elements of its type. In this case,
BakeBlending_pt inherits the function ports BrakeRequest and BrakeRequestBlended from
BrakeBlending_T together with the DesignFunctionPrototype Diag_pt is a
DesignFunctionPrototype typed by Diag_T inside BrakeBlending_pt. Another
FunctionPrototype BrakeControllerRequests_pt contains several function ports, which are
BrakeRequest, BrakeTorqueFL/FR and BrakeTorqueRL/RR. The whole structure can also
been seen in the graphical view in Fig 5.4. Besides the inner structure of
GlobalBrakeController, Fig 5.4 also captures the structure of its prototypes
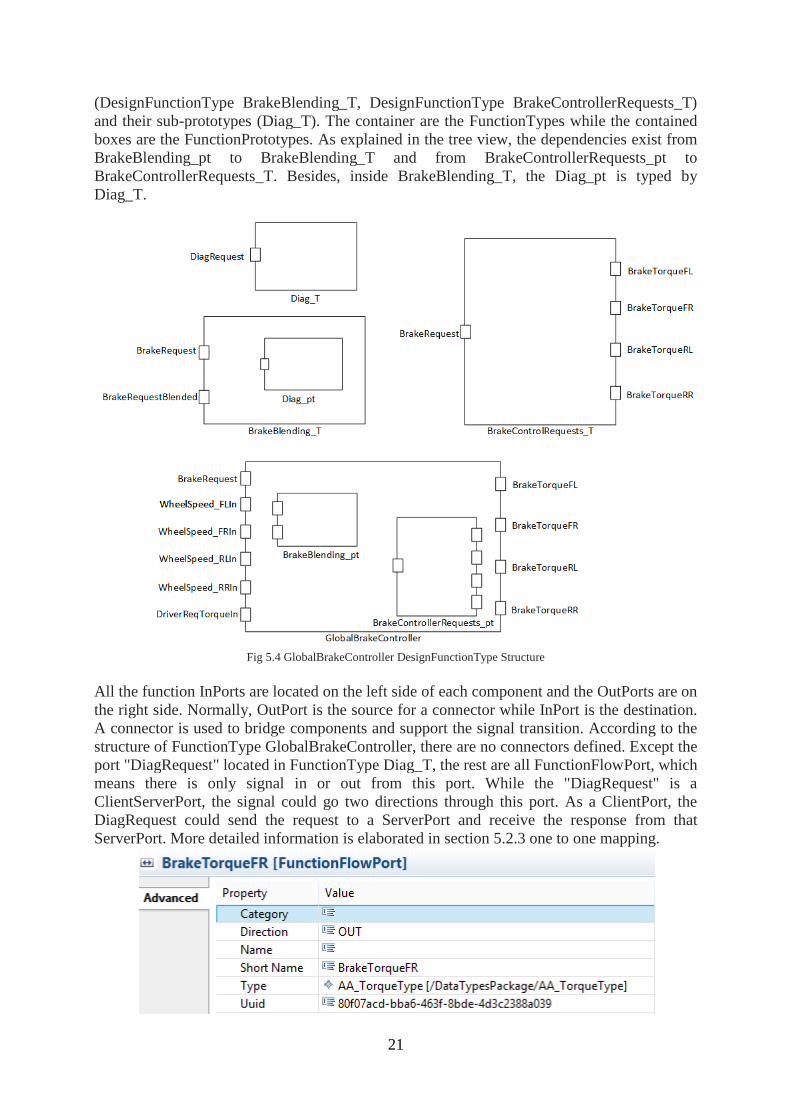
21
(DesignFunctionType BrakeBlending_T, DesignFunctionType BrakeControllerRequests_T)
and their sub-prototypes (Diag_T). The container are the FunctionTypes while the contained
boxes are the FunctionPrototypes. As explained in the tree view, the dependencies exist from
BrakeBlending_pt to BrakeBlending_T and from BrakeControllerRequests_pt to
BrakeControllerRequests_T. Besides, inside BrakeBlending_T, the Diag_pt is typed by
Diag_T.
Fig 5.4 GlobalBrakeController DesignFunctionType Structure
All the function InPorts are located on the left side of each component and the OutPorts are on
the right side. Normally, OutPort is the source for a connector while InPort is the destination.
A connector is used to bridge components and support the signal transition. According to the
structure of FunctionType GlobalBrakeController, there are no connectors defined. Except the
port "DiagRequest" located in FunctionType Diag_T, the rest are all FunctionFlowPort, which
means there is only signal in or out from this port. While the "DiagRequest" is a
ClientServerPort, the signal could go two directions through this port. As a ClientPort, the
DiagRequest could send the request to a ServerPort and receive the response from that
ServerPort. More detailed information is elaborated in section 5.2.3 one to one mapping.
22
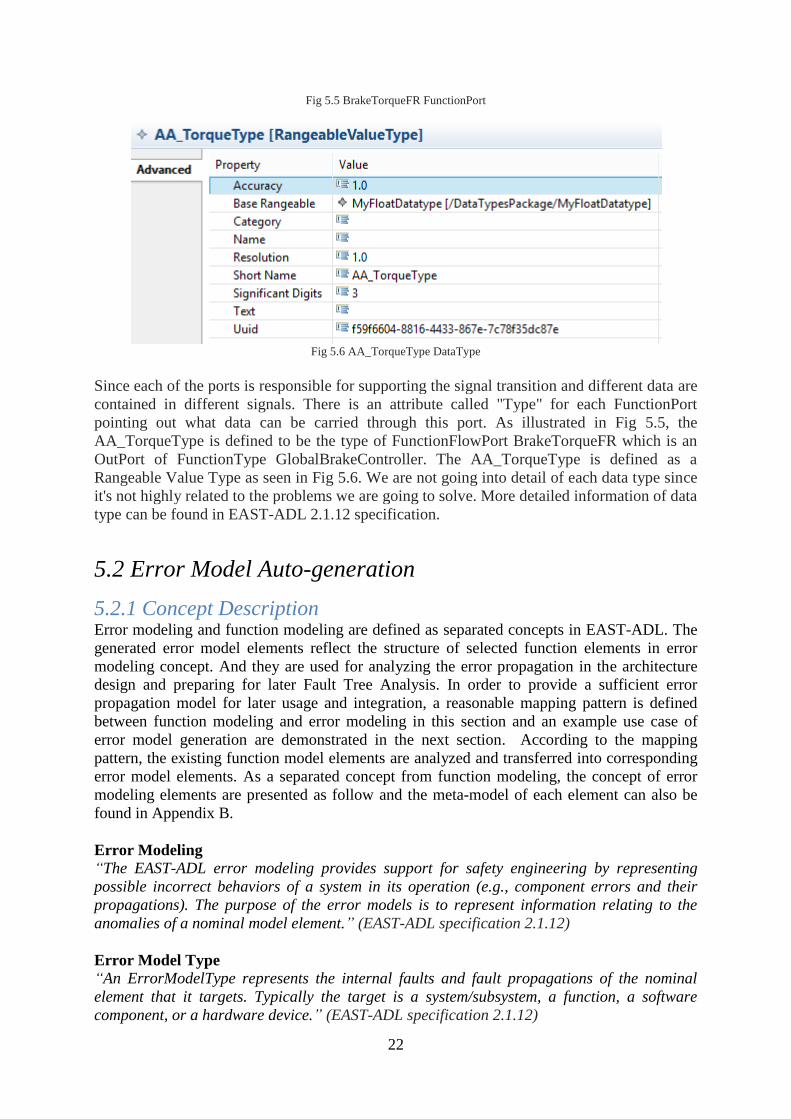
Fig 5.5 BrakeTorqueFR FunctionPort
Fig 5.6 AA_TorqueType DataType
Since each of the ports is responsible for supporting the signal transition and different data are
contained in different signals. There is an attribute called "Type" for each FunctionPort
pointing out what data can be carried through this port. As illustrated in Fig 5.5, the
AA_TorqueType is defined to be the type of FunctionFlowPort BrakeTorqueFR which is an
OutPort of FunctionType GlobalBrakeController. The AA_TorqueType is defined as a
Rangeable Value Type as seen in Fig 5.6. We are not going into detail of each data type since
it's not highly related to the problems we are going to solve. More detailed information of data
type can be found in EAST-ADL 2.1.12 specification.
5.2 Error Model Auto-generation
5.2.1 Concept Description Error modeling and function modeling are defined as separated concepts in EAST-ADL. The
generated error model elements reflect the structure of selected function elements in error
modeling concept. And they are used for analyzing the error propagation in the architecture
design and preparing for later Fault Tree Analysis. In order to provide a sufficient error
propagation model for later usage and integration, a reasonable mapping pattern is defined
between function modeling and error modeling in this section and an example use case of
error model generation are demonstrated in the next section. According to the mapping
pattern, the existing function model elements are analyzed and transferred into corresponding
error model elements. As a separated concept from function modeling, the concept of error
modeling elements are presented as follow and the meta-model of each element can also be
found in Appendix B.
Error Modeling
“The EAST-ADL error modeling provides support for safety engineering by representing
possible incorrect behaviors of a system in its operation (e.g., component errors and their
propagations). The purpose of the error models is to represent information relating to the
anomalies of a nominal model element.” (EAST-ADL specification 2.1.12)
Error Model Type
“An ErrorModelType represents the internal faults and fault propagations of the nominal
element that it targets. Typically the target is a system/subsystem, a function, a software
component, or a hardware device.” (EAST-ADL specification 2.1.12)
23
Error Model Prototype
“The ErrorModelPrototype is used to define hierarchical error models allowing additional
detail or structure to be described in the error model of a particular target. An
ErrorModelPrototype represents an occurrence of the ErrorModelType that types it.” (EAST-
ADL specification 2.1.12)
Fault-Failure Port
“Fault-Failure Port could be divided into FaultInPort and FailureOutPort according to the
error propagation direction. The FaultInPort represents a propagation point for faults that
propagate to the containing ErrorModelType. The FailureOutPort represents a propagation
point for failures that propagate out from the containing ErrorModelType.” (EAST-ADL
specification 2.1.12)
Fault-Failure Propagation Link
“The FaultFailurePropagationLink represents the links for the propagations of faults/failures
across system elements. In particular, it defines that one error model provides the
faults/failures that another error model receives. A fault/failure link can only be applied to
compatible ports, either for fault/failure delegation within an error model or for fault/failure
transmission across two error models.” (EAST-ADL specification 2.1.12)
Internal FaultPrototype
“The InternalFault represents the particular internal conditions of the target
component/system that are of particular concern for its fault/failure definition. The system
anomaly represented by an InternalFault, which when activated, can cause errors and
failures of the target element.” (EAST-ADL specification 2.1.12)
Error Behavior
“ErrorBehavior represents the descriptions of failure logics or semantics that the target
element identified by the ErrorModelType exhibits. Typically the target is a system, a
function, a software component, or a hardware device. Each ErrorBehavior description
relates the occurrences of internal faults and incoming external faults to failures. The faults
and failures that the errorBehavior propagates to and from the target element are declared
through the ports of the error model. ErrorBehavior defines the error propagation logic of its
containing ErrorModelType.” (EAST-ADL specification 2.1.12)
5.2.2 Example Use Case In previous working procedure, defining the system error model manually is usually tedious
and error-prone. The use case below will explain how the automatic error model generation
works and how it is related with nominal model.
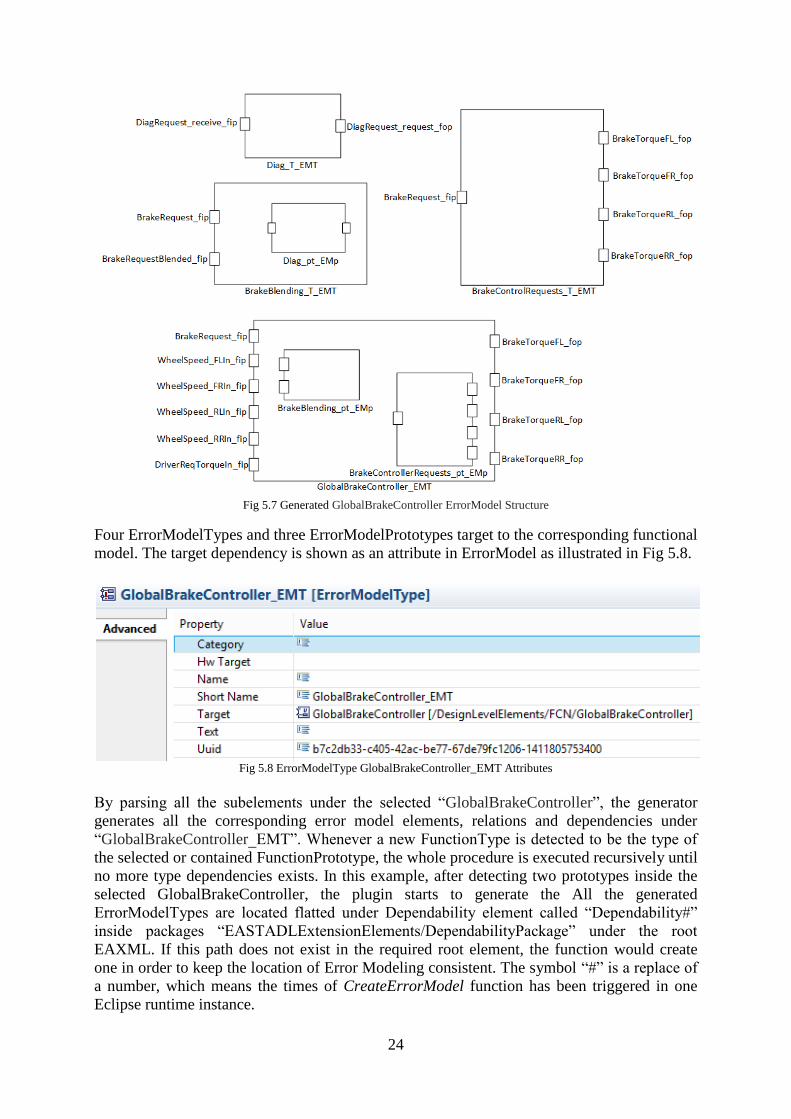
GlobalBrakeController ErrorModelGeneration When “CreateErrorModel” function is triggered by FunctionType GlobalBrakeController, the
following error modeling elements in Fig 5.7 are generated.
24
Fig 5.7 Generated GlobalBrakeController ErrorModel Structure
Four ErrorModelTypes and three ErrorModelPrototypes target to the corresponding functional
model. The target dependency is shown as an attribute in ErrorModel as illustrated in Fig 5.8.
Fig 5.8 ErrorModelType GlobalBrakeController_EMT Attributes
By parsing all the subelements under the selected “GlobalBrakeController”, the generator
generates all the corresponding error model elements, relations and dependencies under
“GlobalBrakeController_EMT”. Whenever a new FunctionType is detected to be the type of
the selected or contained FunctionPrototype, the whole procedure is executed recursively until
no more type dependencies exists. In this example, after detecting two prototypes inside the
selected GlobalBrakeController, the plugin starts to generate the All the generated
ErrorModelTypes are located flatted under Dependability element called “Dependability#”
inside packages “EASTADLExtensionElements/DependabilityPackage” under the root
EAXML. If this path does not exist in the required root element, the function would create
one in order to keep the location of Error Modeling consistent. The symbol “#” is a replace of
a number, which means the times of CreateErrorModel function has been triggered in one
Eclipse runtime instance.

25
All FaultInPorts generated from the FunctionFlowPorts which have the Direction as “IN”, and
when the Direction equals “Out”, it is realized as FailureOutPort in error propagation model.
As specified in EAST-ADL 2.1.12 ErrorModel class diagram in Appendix B, each
FaultFailurePort and FaultFailurePropagation has its instanceReference relation to the
targeted functionPort, which is another way of showing dependency. For the datatype each
port carries, the corresponding ErrorType is generated under the "Dependability#". As shown
in Fig 5.9, Instead of mimicking the datatype of the ports, the ErrorType is an enumeration
with values failure and non-failure. This corresponds to the property of FaultFailurePort as
explained before, each FaultFailurePort represents whether a failure going through the port or
not. In this case, when a failure goes out from a FailureOutPort, its ErrorType is simply set as
“Failure”. And if no failure is going out, a “NonFailure” is applied in this FaultFailurePort
element.
Fig 5.9 ErrorType of GlobalBrakeController_EMT Generation
Comparing the structures between the function modeling in Figure 5.4 and the generated error
modeling in Fig 5.7, we can tell that this generation follows a one to one mapping pattern. All
error model elements can be easily tracing back to function model elements through the
dependency attribute which is named as “target” in error model elements. This use case
provides a general view of what are generated by applying error model auto generation and
why it is generated in this pattern will be explained in next one to one mapping section. How
these elements are generated are elaborated in Algorithm section.
5.2.3 One to One Mapping The Error Model Generation performs one to one mapping between function modeling and
error modeling, the section below provides more detailed information of how the one to one
mapping pattern is designed and the corresponding algorithm in error model generation.
One to One Mapping Pattern Design The error model generator plug-in, as an output for the first research question, defines a one to
one mapping pattern from function modeling to error modeling. By comparing the structures
and connections between function modeling and error modeling, the mapping rule is designed
for error model generating. The detailed mapping definition is shown in Table 5.1. Table 5.1
provides a defined one to one mapping pattern from nominal model to error propagation
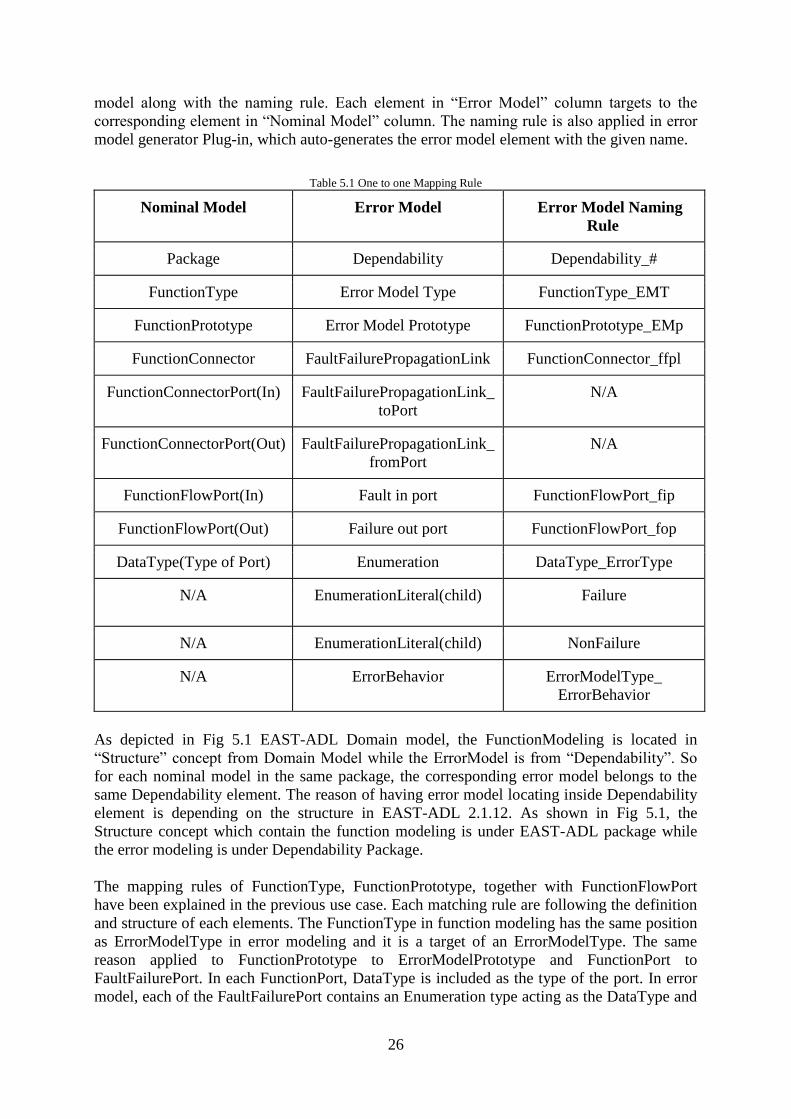
26
model along with the naming rule. Each element in “Error Model” column targets to the
corresponding element in “Nominal Model” column. The naming rule is also applied in error
model generator Plug-in, which auto-generates the error model element with the given name.
Table 5.1 One to one Mapping Rule
Nominal Model Error Model Error Model Naming
Rule
Package Dependability Dependability_#
FunctionType Error Model Type FunctionType_EMT
FunctionPrototype Error Model Prototype FunctionPrototype_EMp
FunctionConnector FaultFailurePropagationLink FunctionConnector_ffpl
FunctionConnectorPort(In) FaultFailurePropagationLink_
toPort
N/A
FunctionConnectorPort(Out) FaultFailurePropagationLink_
fromPort
N/A
FunctionFlowPort(In) Fault in port FunctionFlowPort_fip
FunctionFlowPort(Out) Failure out port FunctionFlowPort_fop
DataType(Type of Port) Enumeration DataType_ErrorType
N/A EnumerationLiteral(child) Failure
N/A EnumerationLiteral(child) NonFailure
N/A ErrorBehavior ErrorModelType_
ErrorBehavior
As depicted in Fig 5.1 EAST-ADL Domain model, the FunctionModeling is located in
“Structure” concept from Domain Model while the ErrorModel is from “Dependability”. So
for each nominal model in the same package, the corresponding error model belongs to the
same Dependability element. The reason of having error model locating inside Dependability
element is depending on the structure in EAST-ADL 2.1.12. As shown in Fig 5.1, the
Structure concept which contain the function modeling is under EAST-ADL package while
the error modeling is under Dependability Package.
The mapping rules of FunctionType, FunctionPrototype, together with FunctionFlowPort
have been explained in the previous use case. Each matching rule are following the definition
and structure of each elements. The FunctionType in function modeling has the same position
as ErrorModelType in error modeling and it is a target of an ErrorModelType. The same
reason applied to FunctionPrototype to ErrorModelPrototype and FunctionPort to
FaultFailurePort. In each FunctionPort, DataType is included as the type of the port. In error
model, each of the FaultFailurePort contains an Enumeration type acting as the DataType and
27
the Enumeration type has two child which means failure and nonfailure for each
FaultFailurePort and the reason of this matching is elaborated in 5.2.2 example use case.
The FunctionConnector is used for supporting the signal transmitting between ports and the
FunctionConnectorPort helps the FunctionConnectors bridge different FunctionPorts. Each
FunctionConnectorPort points to a FunctionPort and FunctionConnector, which means this
FunctionConnector connects this FunctionPort. Each valid FunctionConnector has to have
two FunctionConnectorPorts in order to bridge the connection. But each FunctionPort could
be pointed by more than one FunctionConnectorPort which means each port is able to carry
more than one kind of signal. Since the connector in error model has the responsibility to
connect between ports, when bringing this function connector to Error Models, the
FunctionConnector is realized to be FaultFailurePropagationLink and the
FunctionConnectorPort with IN direction is performed as FaultFailurePropagationLink_toPort
while the OUT direction is FaultFailurePropagationLink_fromPort.
When all the structure of the error model has been set, one ErrorBehavior would be generated
for each ErrorModelType, this ErrorBehavior does not have any mapping element from the
Nominal model, it is used for describing the error logic and behaviors in error model. The
logic included in the ErrorBehavior are applied in Fault Tree Analysis in Chapter 6 and more
detailed information about the syntax of the error logic is explained in section 5.2.5 the
Alternatives and Decisions.
5.2.4 Alternatives and Decisions In order to meet user’s needs and keep the system efficient at the same time, several
alternatives have been taken into consideration during design stage. In this section, those
decisions and alternatives will be discussed and explained.
Different Realization of different function ports In EAST-ADL2.1.12, there are three kinds of function ports belong to the function modeling,
which are FunctionFlowPort, FunctionPowerPort and FunctionClientServerPort.
FunctionFlowPort, as a symbol of data transmission, is typed by EADatatype. The
transformation of flowPort between function modeling and error modeling has been depicted
in use case 1 and in table 5.1. FunctionFlowPort has a direction which indicates the containing
function either requires or provides the data. Whereas, for both FunctionPowerPort and
FunctionClientServerPort, the power transmission and require-response transmission are
bidirectional. The previous unidirectional one to one error model mapping does not support
this anymore. For this reason, we decided to have a two to one mapping for only
FunctionPowerPort and FunctionClientServerPort along with their connectors. The
FunctionPowerPort is a FunctionPort for denoting the physical interactions between
environment and sensing/actuation functions. As shown in table 5.2, it has two direction
called “across” and “through”. The through FunctionPowerPort is responsible for sending out
the power signal and across FunctionPowerport is able to receive the signal. According to this
one direction property, we define the mapping from through FunctionPowerPort to
FailureOutPort and from across FunctionPowerPort to FaultInPort. The
FunctionClientServerPorts perform the signal sending in two directions. A FunctionClientPort
is responsible for sending the request and receive the response from FunctionServerPort while
the FunctionServerPort is responsible for receiving the request from FunctionClientPort and
send back the response. So there are one FaultInPort and one FailureOutPort matching with
28
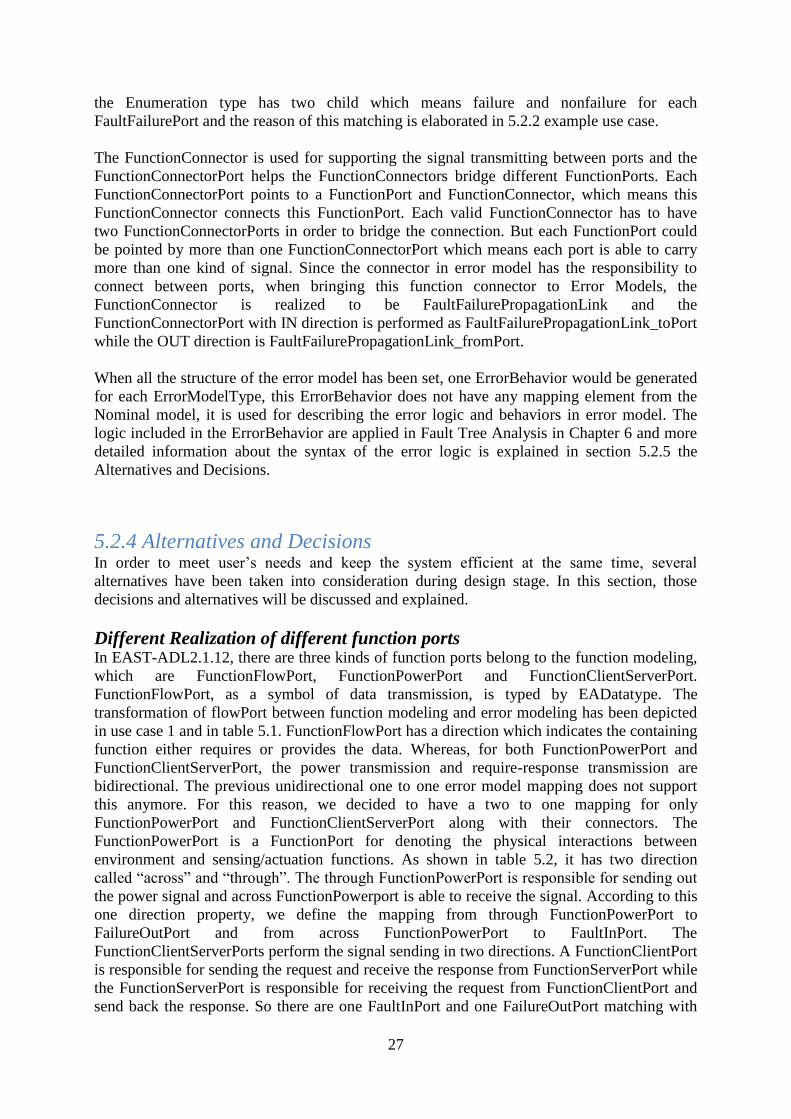
either FunctionClientPort or FunctionServerPort. The example ClientServerPort generation
object diagram is illustrated in Fig 5.10.
Table 5.2 FunctionClientServerPort and FunctionPowerPort mapping
Nominal Model Error Model Error Model Naming Rule
FunctionClientServerPort
(Client)
FaultInPort FCP_receive_fip
FunctionClientServerPort
(Client)
FailureOutPort FCP_request_fop
FunctionClientServerPort
(Sever)
FaultInPort FSP_receive_fip
FunctionClientServerPort
(Sever)
FailureOutPort FSP_response_fop
FunctionPowerPort(across) FaultInPort FAP_across_fip
FunctionPowerPort(across) FailureOutPort FAP_through_fop
FunctionPowerPort(through) FaultInPort FTP_across_fip
FunctionPowerPort(through) FailureOutPort FTP_through_fop
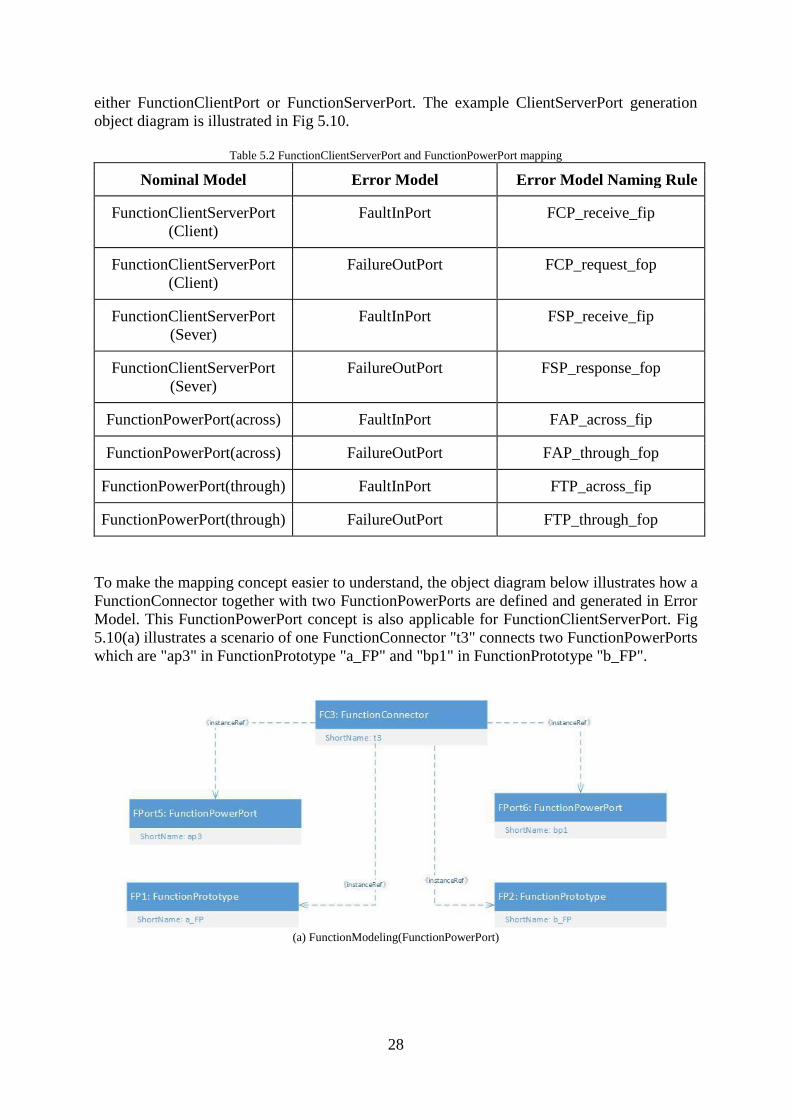
To make the mapping concept easier to understand, the object diagram below illustrates how a
FunctionConnector together with two FunctionPowerPorts are defined and generated in Error
Model. This FunctionPowerPort concept is also applicable for FunctionClientServerPort. Fig
5.10(a) illustrates a scenario of one FunctionConnector "t3" connects two FunctionPowerPorts
which are "ap3" in FunctionPrototype "a_FP" and "bp1" in FunctionPrototype "b_FP".
(a) FunctionModeling(FunctionPowerPort)
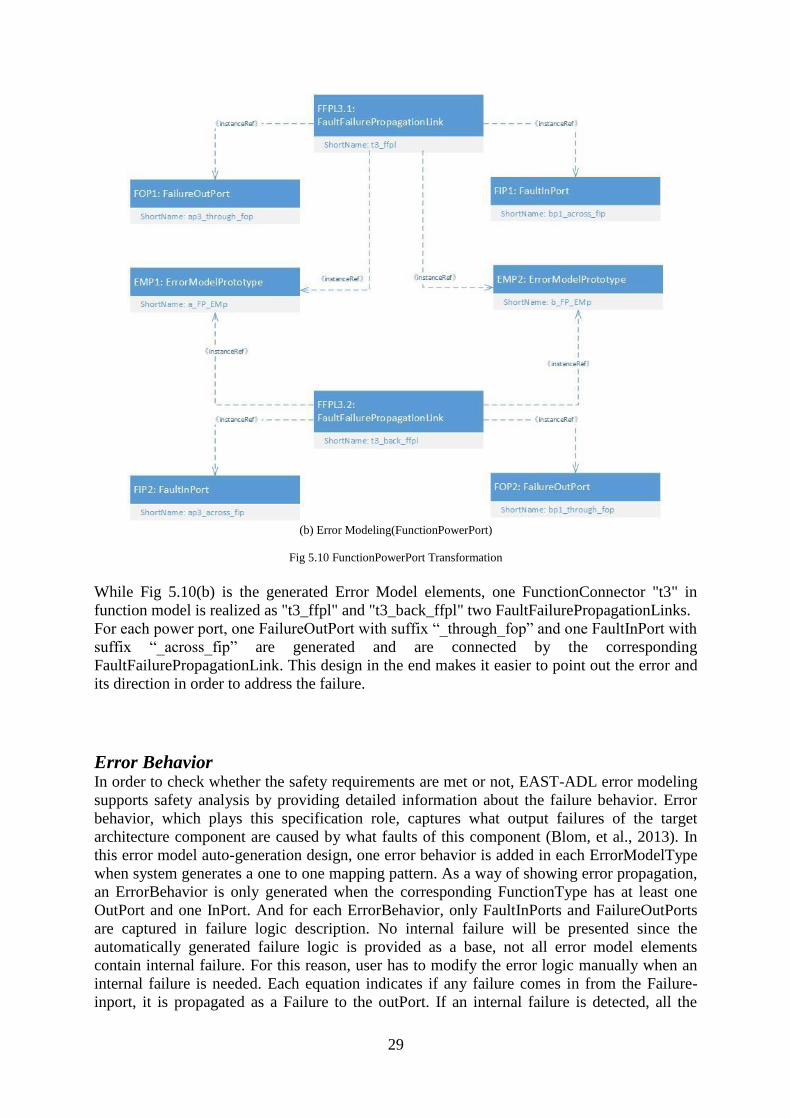
29
(b) Error Modeling(FunctionPowerPort)
Fig 5.10 FunctionPowerPort Transformation
While Fig 5.10(b) is the generated Error Model elements, one FunctionConnector "t3" in
function model is realized as "t3_ffpl" and "t3_back_ffpl" two FaultFailurePropagationLinks.
For each power port, one FailureOutPort with suffix “_through_fop” and one FaultInPort with
suffix “_across_fip” are generated and are connected by the corresponding
FaultFailurePropagationLink. This design in the end makes it easier to point out the error and
its direction in order to address the failure.
Error Behavior In order to check whether the safety requirements are met or not, EAST-ADL error modeling
supports safety analysis by providing detailed information about the failure behavior. Error
behavior, which plays this specification role, captures what output failures of the target
architecture component are caused by what faults of this component (Blom, et al., 2013). In
this error model auto-generation design, one error behavior is added in each ErrorModelType
when system generates a one to one mapping pattern. As a way of showing error propagation,
an ErrorBehavior is only generated when the corresponding FunctionType has at least one
OutPort and one InPort. And for each ErrorBehavior, only FaultInPorts and FailureOutPorts
are captured in failure logic description. No internal failure will be presented since the
automatically generated failure logic is provided as a base, not all error model elements
contain internal failure. For this reason, user has to modify the error logic manually when an
internal failure is needed. Each equation indicates if any failure comes in from the Failure-
inport, it is propagated as a Failure to the outPort. If an internal failure is detected, all the
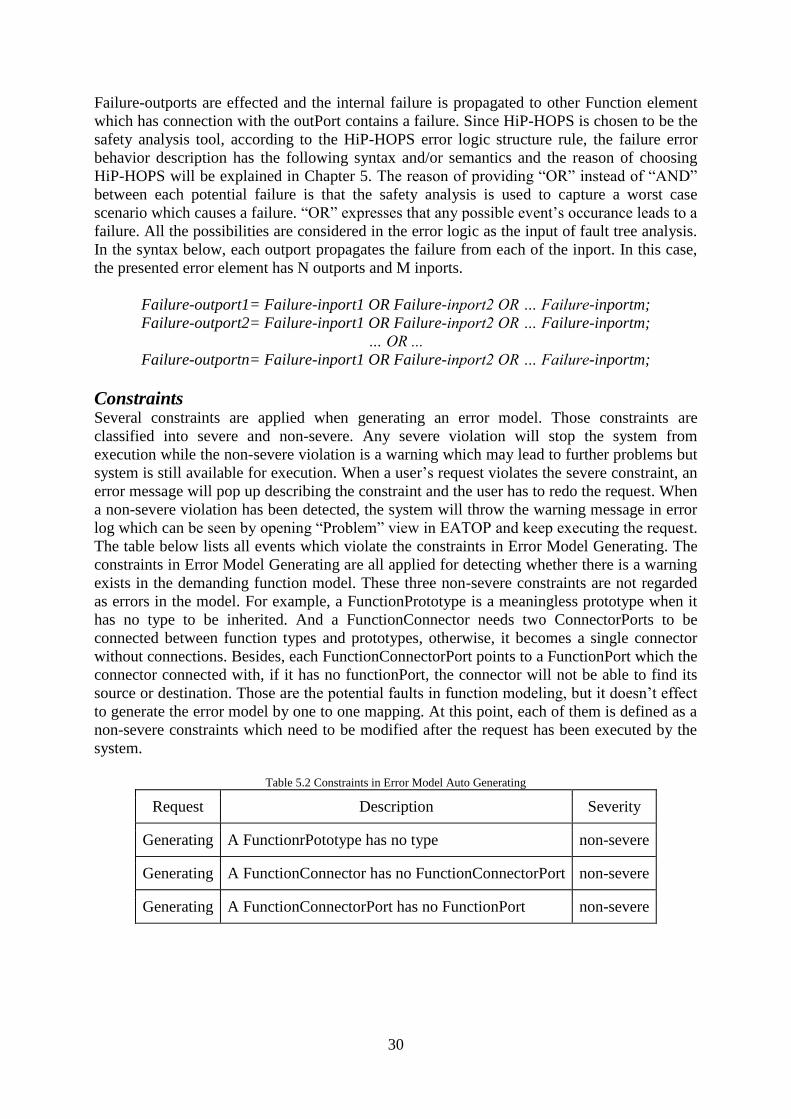
30
Failure-outports are effected and the internal failure is propagated to other Function element
which has connection with the outPort contains a failure. Since HiP-HOPS is chosen to be the
safety analysis tool, according to the HiP-HOPS error logic structure rule, the failure error
behavior description has the following syntax and/or semantics and the reason of choosing
HiP-HOPS will be explained in Chapter 5. The reason of providing “OR” instead of “AND”
between each potential failure is that the safety analysis is used to capture a worst case
scenario which causes a failure. “OR” expresses that any possible event’s occurance leads to a
failure. All the possibilities are considered in the error logic as the input of fault tree analysis.
In the syntax below, each outport propagates the failure from each of the inport. In this case,
the presented error element has N outports and M inports.
Failure-outport1= Failure-inport1 OR Failure-inport2 OR … Failure-inportm;
Failure-outport2= Failure-inport1 OR Failure-inport2 OR … Failure-inportm;
… OR ...
Failure-outportn= Failure-inport1 OR Failure-inport2 OR … Failure-inportm;
Constraints Several constraints are applied when generating an error model. Those constraints are
classified into severe and non-severe. Any severe violation will stop the system from
execution while the non-severe violation is a warning which may lead to further problems but
system is still available for execution. When a user’s request violates the severe constraint, an
error message will pop up describing the constraint and the user has to redo the request. When
a non-severe violation has been detected, the system will throw the warning message in error
log which can be seen by opening “Problem” view in EATOP and keep executing the request.
The table below lists all events which violate the constraints in Error Model Generating. The
constraints in Error Model Generating are all applied for detecting whether there is a warning
exists in the demanding function model. These three non-severe constraints are not regarded
as errors in the model. For example, a FunctionPrototype is a meaningless prototype when it
has no type to be inherited. And a FunctionConnector needs two ConnectorPorts to be
connected between function types and prototypes, otherwise, it becomes a single connector
without connections. Besides, each FunctionConnectorPort points to a FunctionPort which the
connector connected with, if it has no functionPort, the connector will not be able to find its
source or destination. Those are the potential faults in function modeling, but it doesn’t effect
to generate the error model by one to one mapping. At this point, each of them is defined as a
non-severe constraints which need to be modified after the request has been executed by the
system.
Table 5.2 Constraints in Error Model Auto Generating
Request Description Severity
Generating A FunctionrPototype has no type non-severe
Generating A FunctionConnector has no FunctionConnectorPort non-severe
Generating A FunctionConnectorPort has no FunctionPort non-severe
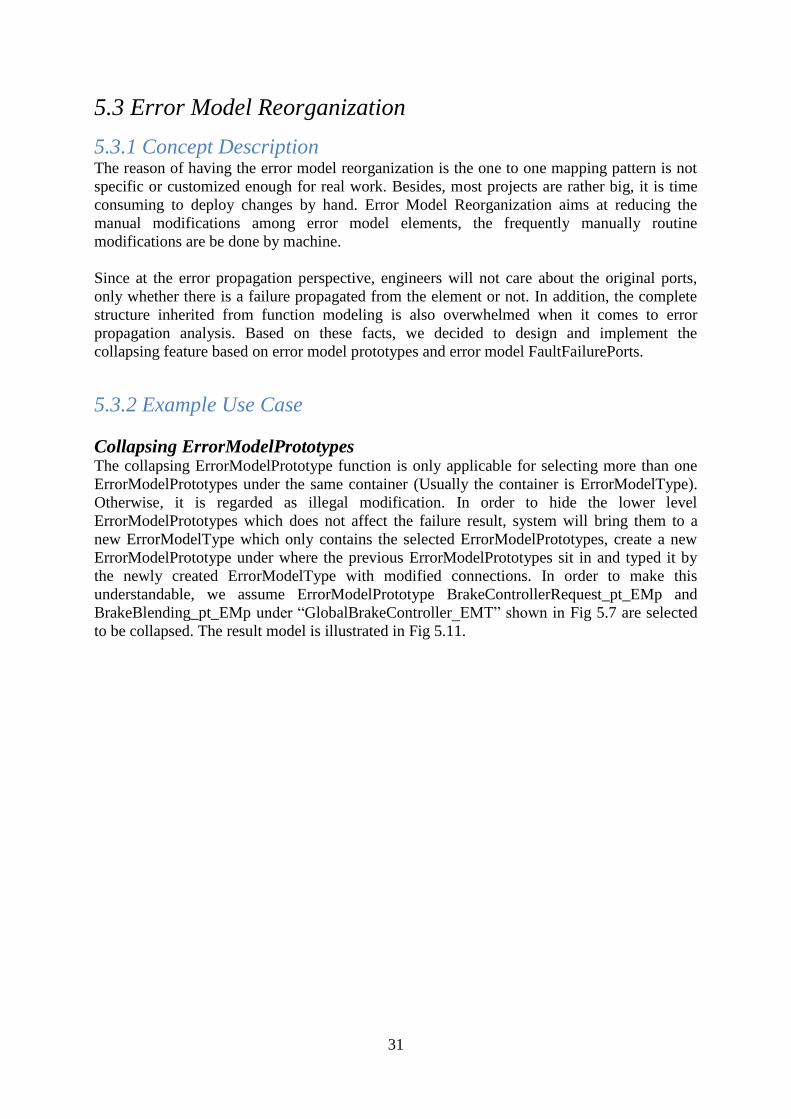
31
5.3 Error Model Reorganization
5.3.1 Concept Description The reason of having the error model reorganization is the one to one mapping pattern is not
specific or customized enough for real work. Besides, most projects are rather big, it is time
consuming to deploy changes by hand. Error Model Reorganization aims at reducing the
manual modifications among error model elements, the frequently manually routine
modifications are be done by machine.
Since at the error propagation perspective, engineers will not care about the original ports,
only whether there is a failure propagated from the element or not. In addition, the complete
structure inherited from function modeling is also overwhelmed when it comes to error
propagation analysis. Based on these facts, we decided to design and implement the
collapsing feature based on error model prototypes and error model FaultFailurePorts.
5.3.2 Example Use Case
Collapsing ErrorModelPrototypes The collapsing ErrorModelPrototype function is only applicable for selecting more than one
ErrorModelPrototypes under the same container (Usually the container is ErrorModelType).
Otherwise, it is regarded as illegal modification. In order to hide the lower level
ErrorModelPrototypes which does not affect the failure result, system will bring them to a
new ErrorModelType which only contains the selected ErrorModelPrototypes, create a new
ErrorModelPrototype under where the previous ErrorModelPrototypes sit in and typed it by
the newly created ErrorModelType with modified connections. In order to make this
understandable, we assume ErrorModelPrototype BrakeControllerRequest_pt_EMp and
BrakeBlending_pt_EMp under “GlobalBrakeController_EMT” shown in Fig 5.7 are selected
to be collapsed. The result model is illustrated in Fig 5.11.
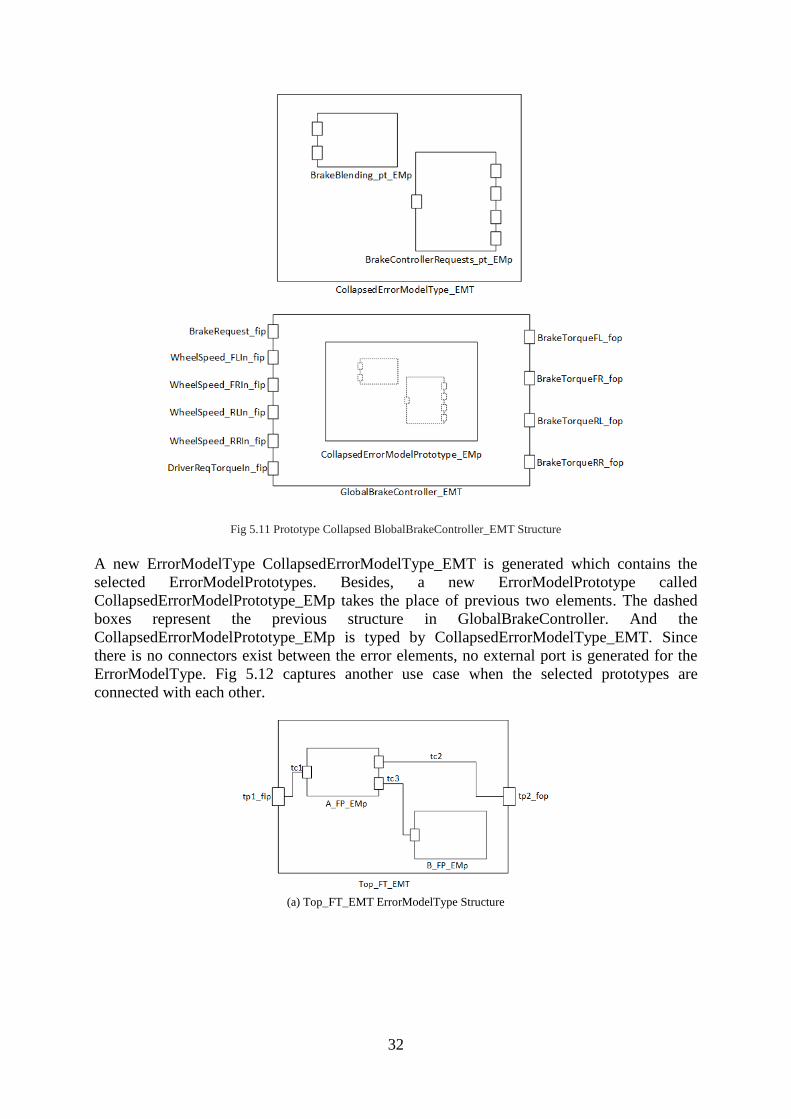
32
Fig 5.11 Prototype Collapsed BlobalBrakeController_EMT Structure
A new ErrorModelType CollapsedErrorModelType_EMT is generated which contains the
selected ErrorModelPrototypes. Besides, a new ErrorModelPrototype called
CollapsedErrorModelPrototype_EMp takes the place of previous two elements. The dashed
boxes represent the previous structure in GlobalBrakeController. And the
CollapsedErrorModelPrototype_EMp is typed by CollapsedErrorModelType_EMT. Since
there is no connectors exist between the error elements, no external port is generated for the
ErrorModelType. Fig 5.12 captures another use case when the selected prototypes are
connected with each other.
(a) Top_FT_EMT ErrorModelType Structure
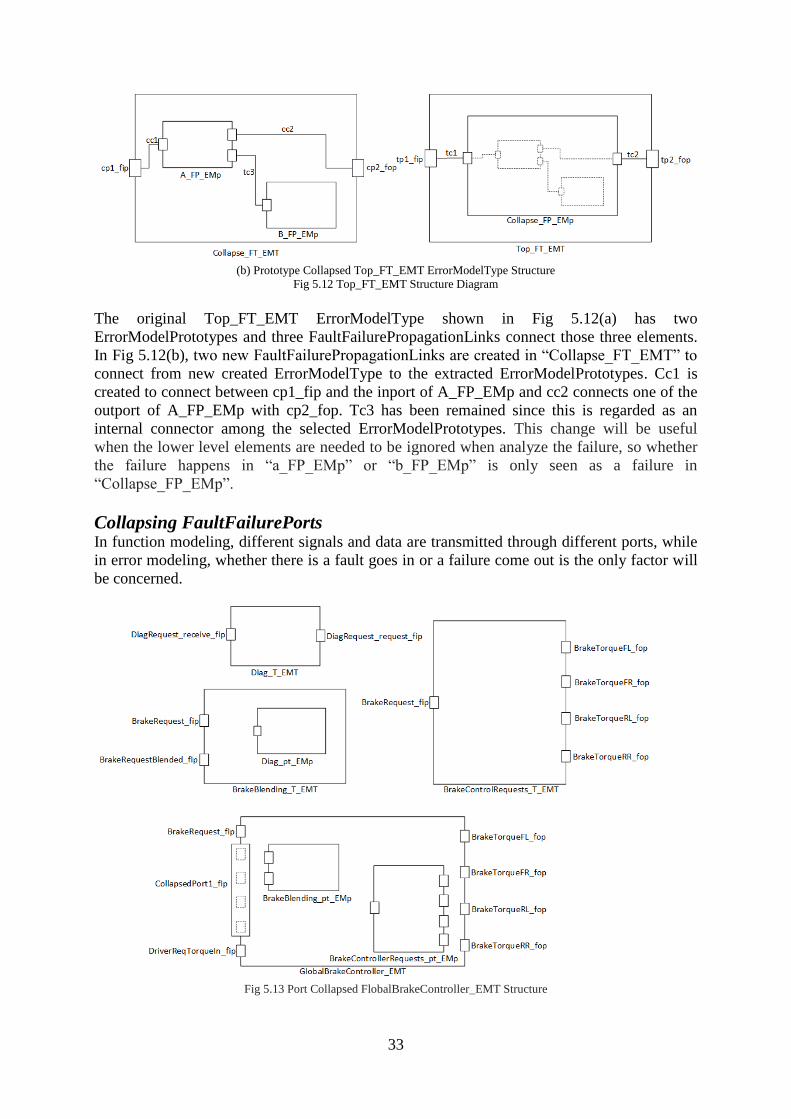
33
(b) Prototype Collapsed Top_FT_EMT ErrorModelType Structure
Fig 5.12 Top_FT_EMT Structure Diagram
The original Top_FT_EMT ErrorModelType shown in Fig 5.12(a) has two
ErrorModelPrototypes and three FaultFailurePropagationLinks connect those three elements.
In Fig 5.12(b), two new FaultFailurePropagationLinks are created in “Collapse_FT_EMT” to
connect from new created ErrorModelType to the extracted ErrorModelPrototypes. Cc1 is
created to connect between cp1_fip and the inport of A_FP_EMp and cc2 connects one of the
outport of A_FP_EMp with cp2_fop. Tc3 has been remained since this is regarded as an
internal connector among the selected ErrorModelPrototypes. This change will be useful
when the lower level elements are needed to be ignored when analyze the failure, so whether
the failure happens in “a_FP_EMp” or “b_FP_EMp” is only seen as a failure in
“Collapse_FP_EMp”.
Collapsing FaultFailurePorts In function modeling, different signals and data are transmitted through different ports, while
in error modeling, whether there is a fault goes in or a failure come out is the only factor will
be concerned.
Fig 5.13 Port Collapsed FlobalBrakeController_EMT Structure
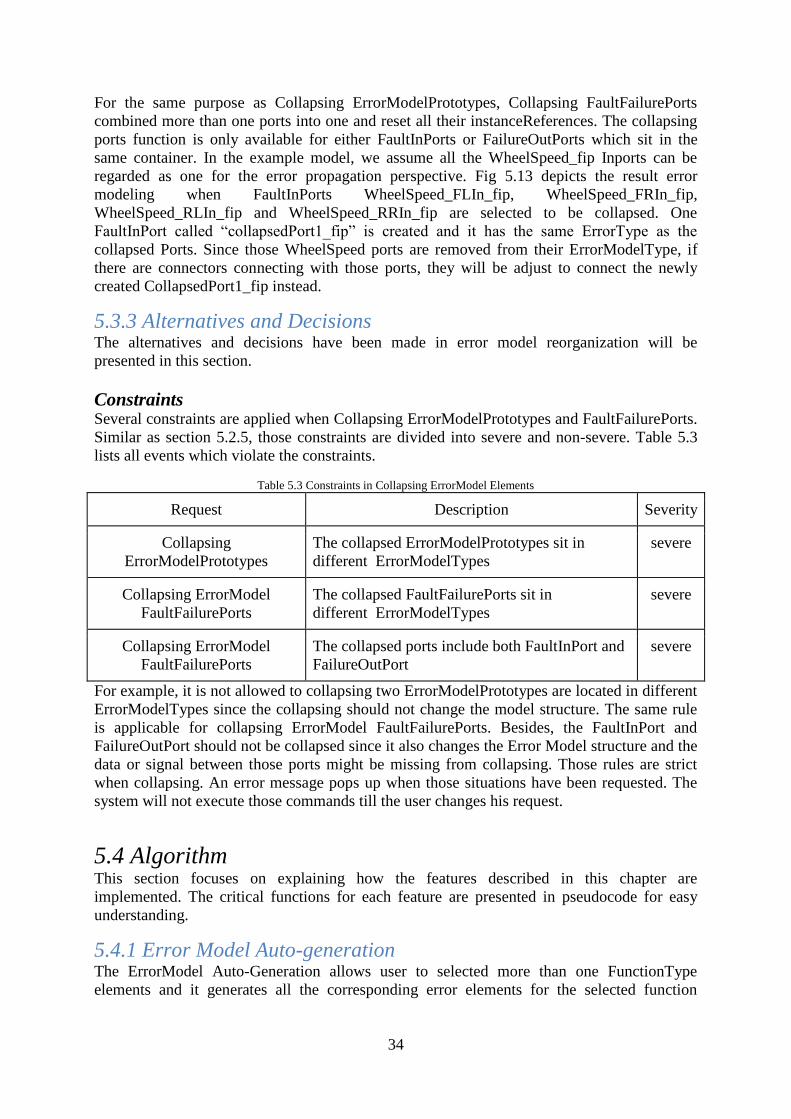
34
For the same purpose as Collapsing ErrorModelPrototypes, Collapsing FaultFailurePorts
combined more than one ports into one and reset all their instanceReferences. The collapsing
ports function is only available for either FaultInPorts or FailureOutPorts which sit in the
same container. In the example model, we assume all the WheelSpeed_fip Inports can be
regarded as one for the error propagation perspective. Fig 5.13 depicts the result error
modeling when FaultInPorts WheelSpeed_FLIn_fip, WheelSpeed_FRIn_fip,
WheelSpeed_RLIn_fip and WheelSpeed_RRIn_fip are selected to be collapsed. One
FaultInPort called “collapsedPort1_fip” is created and it has the same ErrorType as the
collapsed Ports. Since those WheelSpeed ports are removed from their ErrorModelType, if
there are connectors connecting with those ports, they will be adjust to connect the newly
created CollapsedPort1_fip instead.
5.3.3 Alternatives and Decisions The alternatives and decisions have been made in error model reorganization will be
presented in this section.
Constraints Several constraints are applied when Collapsing ErrorModelPrototypes and FaultFailurePorts.
Similar as section 5.2.5, those constraints are divided into severe and non-severe. Table 5.3
lists all events which violate the constraints.
Table 5.3 Constraints in Collapsing ErrorModel Elements
Request Description Severity
Collapsing
ErrorModelPrototypes
The collapsed ErrorModelPrototypes sit in
different ErrorModelTypes
severe
Collapsing ErrorModel
FaultFailurePorts
The collapsed FaultFailurePorts sit in
different ErrorModelTypes
severe
Collapsing ErrorModel
FaultFailurePorts
The collapsed ports include both FaultInPort and
FailureOutPort
severe
For example, it is not allowed to collapsing two ErrorModelPrototypes are located in different
ErrorModelTypes since the collapsing should not change the model structure. The same rule
is applicable for collapsing ErrorModel FaultFailurePorts. Besides, the FaultInPort and
FailureOutPort should not be collapsed since it also changes the Error Model structure and the
data or signal between those ports might be missing from collapsing. Those rules are strict
when collapsing. An error message pops up when those situations have been requested. The
system will not execute those commands till the user changes his request.
5.4 Algorithm This section focuses on explaining how the features described in this chapter are
implemented. The critical functions for each feature are presented in pseudocode for easy
understanding.
5.4.1 Error Model Auto-generation The ErrorModel Auto-Generation allows user to selected more than one FunctionType
elements and it generates all the corresponding error elements for the selected function
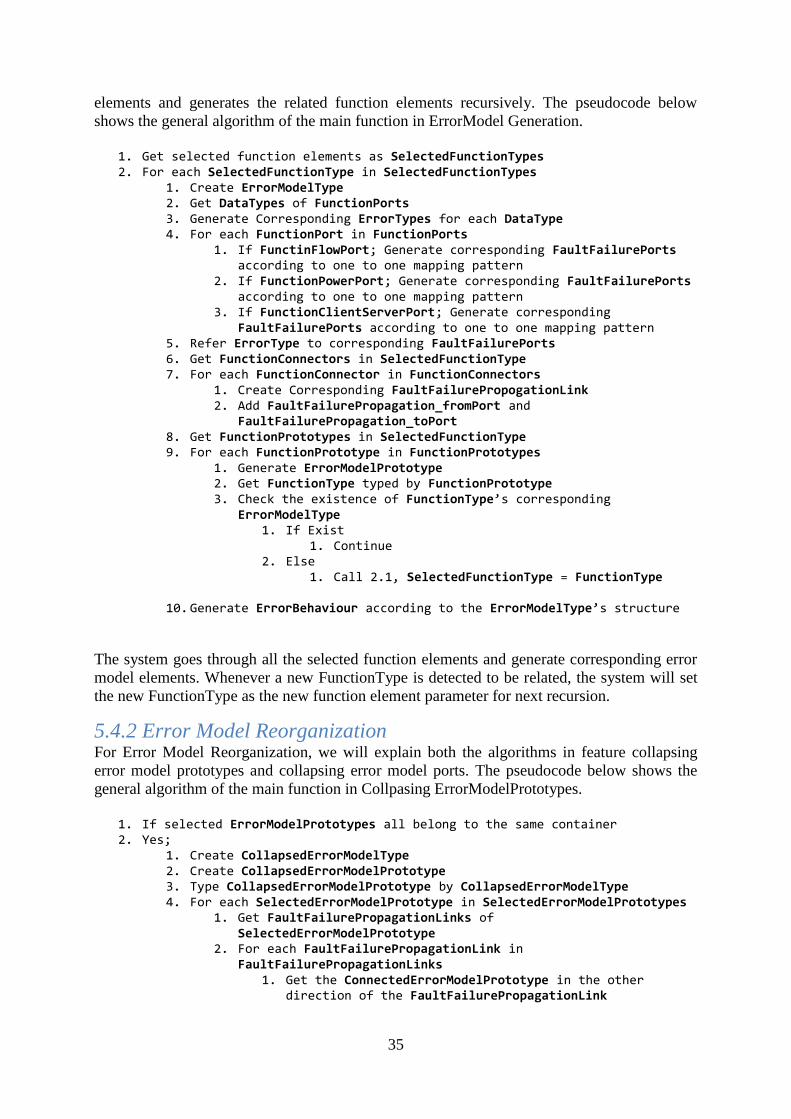
35
elements and generates the related function elements recursively. The pseudocode below
shows the general algorithm of the main function in ErrorModel Generation.
1. Get selected function elements as SelectedFunctionTypes 2. For each SelectedFunctionType in SelectedFunctionTypes
1. Create ErrorModelType 2. Get DataTypes of FunctionPorts 3. Generate Corresponding ErrorTypes for each DataType 4. For each FunctionPort in FunctionPorts
1. If FunctinFlowPort; Generate corresponding FaultFailurePorts according to one to one mapping pattern
2. If FunctionPowerPort; Generate corresponding FaultFailurePorts according to one to one mapping pattern
3. If FunctionClientServerPort; Generate corresponding FaultFailurePorts according to one to one mapping pattern
5. Refer ErrorType to corresponding FaultFailurePorts 6. Get FunctionConnectors in SelectedFunctionType 7. For each FunctionConnector in FunctionConnectors
1. Create Corresponding FaultFailurePropogationLink 2. Add FaultFailurePropagation_fromPort and
FaultFailurePropagation_toPort 8. Get FunctionPrototypes in SelectedFunctionType 9. For each FunctionPrototype in FunctionPrototypes
1. Generate ErrorModelPrototype 2. Get FunctionType typed by FunctionPrototype 3. Check the existence of FunctionType’s corresponding
ErrorModelType 1. If Exist
1. Continue 2. Else
1. Call 2.1, SelectedFunctionType = FunctionType
10. Generate ErrorBehaviour according to the ErrorModelType’s structure
The system goes through all the selected function elements and generate corresponding error
model elements. Whenever a new FunctionType is detected to be related, the system will set
the new FunctionType as the new function element parameter for next recursion.
5.4.2 Error Model Reorganization For Error Model Reorganization, we will explain both the algorithms in feature collapsing
error model prototypes and collapsing error model ports. The pseudocode below shows the
general algorithm of the main function in Collpasing ErrorModelPrototypes.
1. If selected ErrorModelPrototypes all belong to the same container 2. Yes;
1. Create CollapsedErrorModelType 2. Create CollapsedErrorModelPrototype 3. Type CollapsedErrorModelPrototype by CollapsedErrorModelType 4. For each SelectedErrorModelPrototype in SelectedErrorModelPrototypes
1. Get FaultFailurePropagationLinks of SelectedErrorModelPrototype
2. For each FaultFailurePropagationLink in FaultFailurePropagationLinks
1. Get the ConnectedErrorModelPrototype in the other direction of the FaultFailurePropagationLink
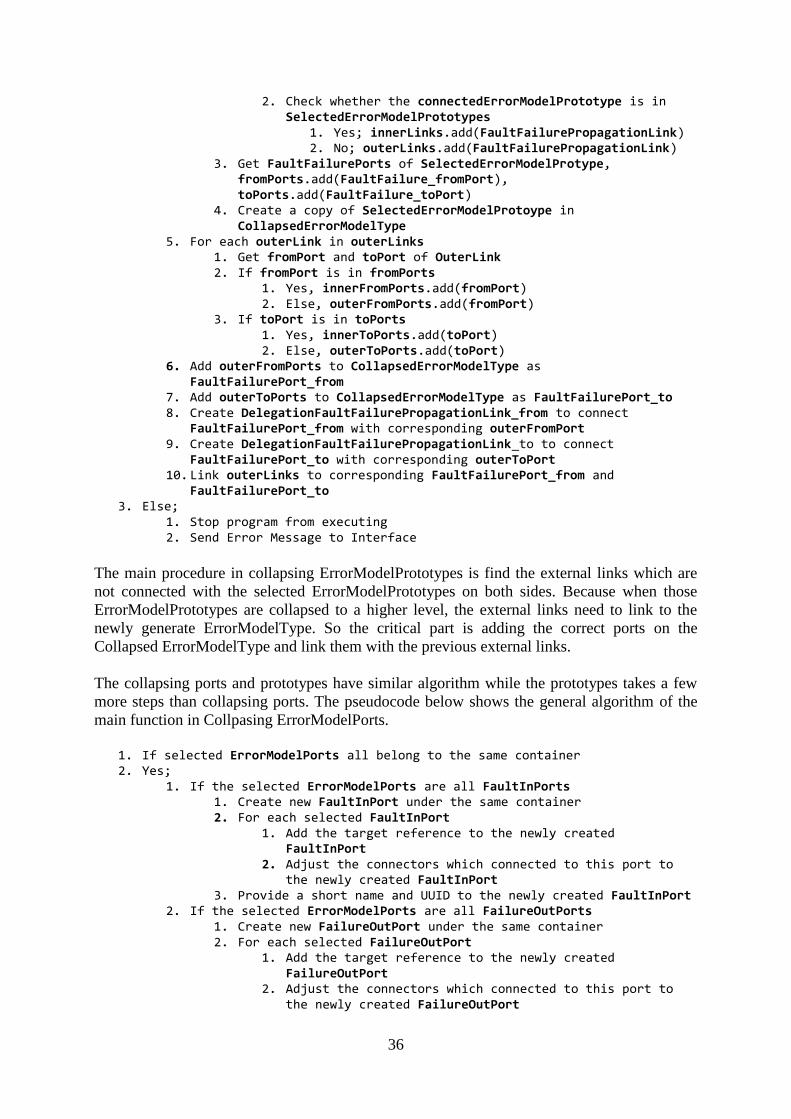
36
2. Check whether the connectedErrorModelPrototype is in SelectedErrorModelPrototypes
1. Yes; innerLinks.add(FaultFailurePropagationLink) 2. No; outerLinks.add(FaultFailurePropagationLink)
3. Get FaultFailurePorts of SelectedErrorModelProtype, fromPorts.add(FaultFailure_fromPort), toPorts.add(FaultFailure_toPort)
4. Create a copy of SelectedErrorModelProtoype in CollapsedErrorModelType
5. For each outerLink in outerLinks 1. Get fromPort and toPort of OuterLink 2. If fromPort is in fromPorts
1. Yes, innerFromPorts.add(fromPort) 2. Else, outerFromPorts.add(fromPort)
3. If toPort is in toPorts 1. Yes, innerToPorts.add(toPort) 2. Else, outerToPorts.add(toPort)
6. Add outerFromPorts to CollapsedErrorModelType as FaultFailurePort_from
7. Add outerToPorts to CollapsedErrorModelType as FaultFailurePort_to 8. Create DelegationFaultFailurePropagationLink_from to connect
FaultFailurePort_from with corresponding outerFromPort 9. Create DelegationFaultFailurePropagationLink_to to connect
FaultFailurePort_to with corresponding outerToPort 10. Link outerLinks to corresponding FaultFailurePort_from and
FaultFailurePort_to 3. Else;
1. Stop program from executing 2. Send Error Message to Interface
The main procedure in collapsing ErrorModelPrototypes is find the external links which are
not connected with the selected ErrorModelPrototypes on both sides. Because when those
ErrorModelPrototypes are collapsed to a higher level, the external links need to link to the
newly generate ErrorModelType. So the critical part is adding the correct ports on the
Collapsed ErrorModelType and link them with the previous external links.
The collapsing ports and prototypes have similar algorithm while the prototypes takes a few
more steps than collapsing ports. The pseudocode below shows the general algorithm of the
main function in Collpasing ErrorModelPorts.
1. If selected ErrorModelPorts all belong to the same container 2. Yes;
1. If the selected ErrorModelPorts are all FaultInPorts 1. Create new FaultInPort under the same container 2. For each selected FaultInPort
1. Add the target reference to the newly created FaultInPort
2. Adjust the connectors which connected to this port to the newly created FaultInPort
3. Provide a short name and UUID to the newly created FaultInPort 2. If the selected ErrorModelPorts are all FailureOutPorts
1. Create new FailureOutPort under the same container 2. For each selected FailureOutPort
1. Add the target reference to the newly created FailureOutPort
2. Adjust the connectors which connected to this port to the newly created FailureOutPort
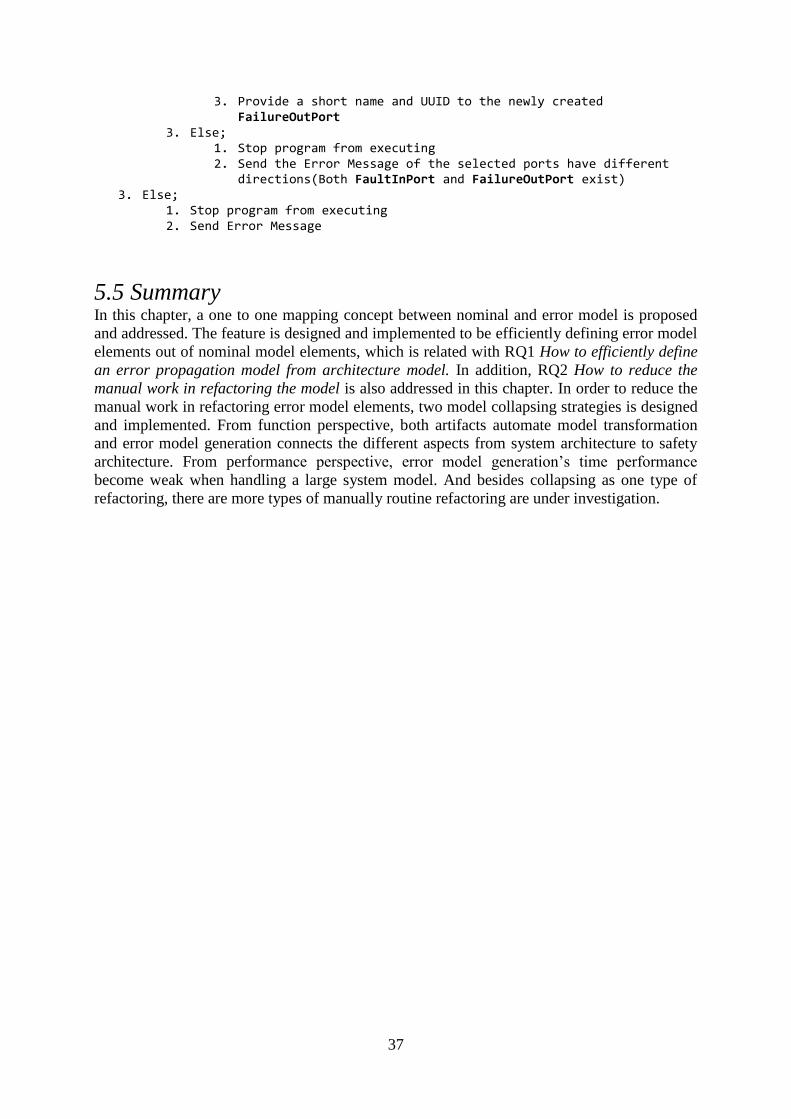
37
3. Provide a short name and UUID to the newly created FailureOutPort
3. Else; 1. Stop program from executing 2. Send the Error Message of the selected ports have different
directions(Both FaultInPort and FailureOutPort exist) 3. Else;
1. Stop program from executing 2. Send Error Message
5.5 Summary In this chapter, a one to one mapping concept between nominal and error model is proposed
and addressed. The feature is designed and implemented to be efficiently defining error model
elements out of nominal model elements, which is related with RQ1 How to efficiently define
an error propagation model from architecture model. In addition, RQ2 How to reduce the
manual work in refactoring the model is also addressed in this chapter. In order to reduce the
manual work in refactoring error model elements, two model collapsing strategies is designed
and implemented. From function perspective, both artifacts automate model transformation
and error model generation connects the different aspects from system architecture to safety
architecture. From performance perspective, error model generation’s time performance
become weak when handling a large system model. And besides collapsing as one type of
refactoring, there are more types of manually routine refactoring are under investigation.

38
Chapter 6 HiP-HOPS Fault Tree
Analysis in EATOP
As the third research question addressed, there is a need to apply the Fault Tree Analysis on
EAST-ADL error models and relate the generated Fault Tree result with both the error model
and the nominal model. As explained in chapter 2, fault tree analysis is used to analyze the
system failure probability and resolve the causes of a system failure. To get an automatically
analyzed system failure is also the final goal of generating error model out of function model.
There are currently several tools supporting fault tree analysis, but none of them are directly
available for EAST-ADL models. So the first challenge is looking for a suitable tool to get
EAST-ADL models supported in a short time. When EAST-ADL model is parsed by one of
the Fault Tree Analysis solution tools, the rest of the work is to connect the generated Fault
Tree with the error model and nominal model in EATOP. Among all existing Fault Tree
Analysis solutions, HiP-HOPS is selected as the Fault Tree Analysis tool to be integrated in
this research. Since the HiP-HOPS error logic is supported in EATOP Error Behavior element
as described in section 6.2.4 and the tool itself is handy and easy to be downloaded and
integrated. Besides, the support from the founder of HiP-HOPS in this research is also a great
help. In all, we believe HiP-HOPS is most suitable tool for this project. Section 6.1 presents
the different goals for solving this problem since several unstable factors exist in this research.
Section 6.2 provides the design and solution for each goal revealed in section 6.1 together
with their final result.
6.1 Different Levels of Goals
Fig 6.1 Safety Analysis process –Fault Tree Analysis
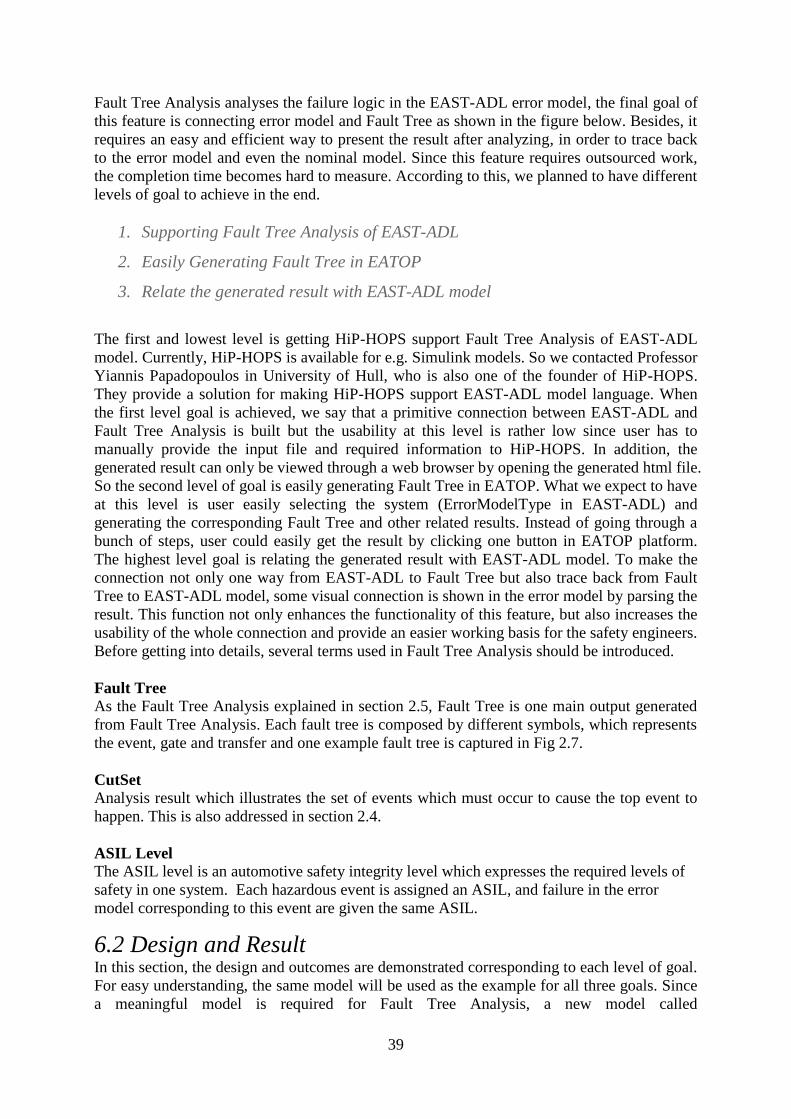
39
Fault Tree Analysis analyses the failure logic in the EAST-ADL error model, the final goal of
this feature is connecting error model and Fault Tree as shown in the figure below. Besides, it
requires an easy and efficient way to present the result after analyzing, in order to trace back
to the error model and even the nominal model. Since this feature requires outsourced work,
the completion time becomes hard to measure. According to this, we planned to have different
levels of goal to achieve in the end.
1. Supporting Fault Tree Analysis of EAST-ADL
2. Easily Generating Fault Tree in EATOP
3. Relate the generated result with EAST-ADL model
The first and lowest level is getting HiP-HOPS support Fault Tree Analysis of EAST-ADL
model. Currently, HiP-HOPS is available for e.g. Simulink models. So we contacted Professor
Yiannis Papadopoulos in University of Hull, who is also one of the founder of HiP-HOPS.
They provide a solution for making HiP-HOPS support EAST-ADL model language. When
the first level goal is achieved, we say that a primitive connection between EAST-ADL and
Fault Tree Analysis is built but the usability at this level is rather low since user has to
manually provide the input file and required information to HiP-HOPS. In addition, the
generated result can only be viewed through a web browser by opening the generated html file.
So the second level of goal is easily generating Fault Tree in EATOP. What we expect to have
at this level is user easily selecting the system (ErrorModelType in EAST-ADL) and
generating the corresponding Fault Tree and other related results. Instead of going through a
bunch of steps, user could easily get the result by clicking one button in EATOP platform.
The highest level goal is relating the generated result with EAST-ADL model. To make the
connection not only one way from EAST-ADL to Fault Tree but also trace back from Fault
Tree to EAST-ADL model, some visual connection is shown in the error model by parsing the
result. This function not only enhances the functionality of this feature, but also increases the
usability of the whole connection and provide an easier working basis for the safety engineers.
Before getting into details, several terms used in Fault Tree Analysis should be introduced.
Fault Tree
As the Fault Tree Analysis explained in section 2.5, Fault Tree is one main output generated
from Fault Tree Analysis. Each fault tree is composed by different symbols, which represents
the event, gate and transfer and one example fault tree is captured in Fig 2.7.
CutSet
Analysis result which illustrates the set of events which must occur to cause the top event to
happen. This is also addressed in section 2.4.
ASIL Level
The ASIL level is an automotive safety integrity level which expresses the required levels of
safety in one system. Each hazardous event is assigned an ASIL, and failure in the error
model corresponding to this event are given the same ASIL.
6.2 Design and Result In this section, the design and outcomes are demonstrated corresponding to each level of goal.
For easy understanding, the same model will be used as the example for all three goals. Since
a meaningful model is required for Fault Tree Analysis, a new model called
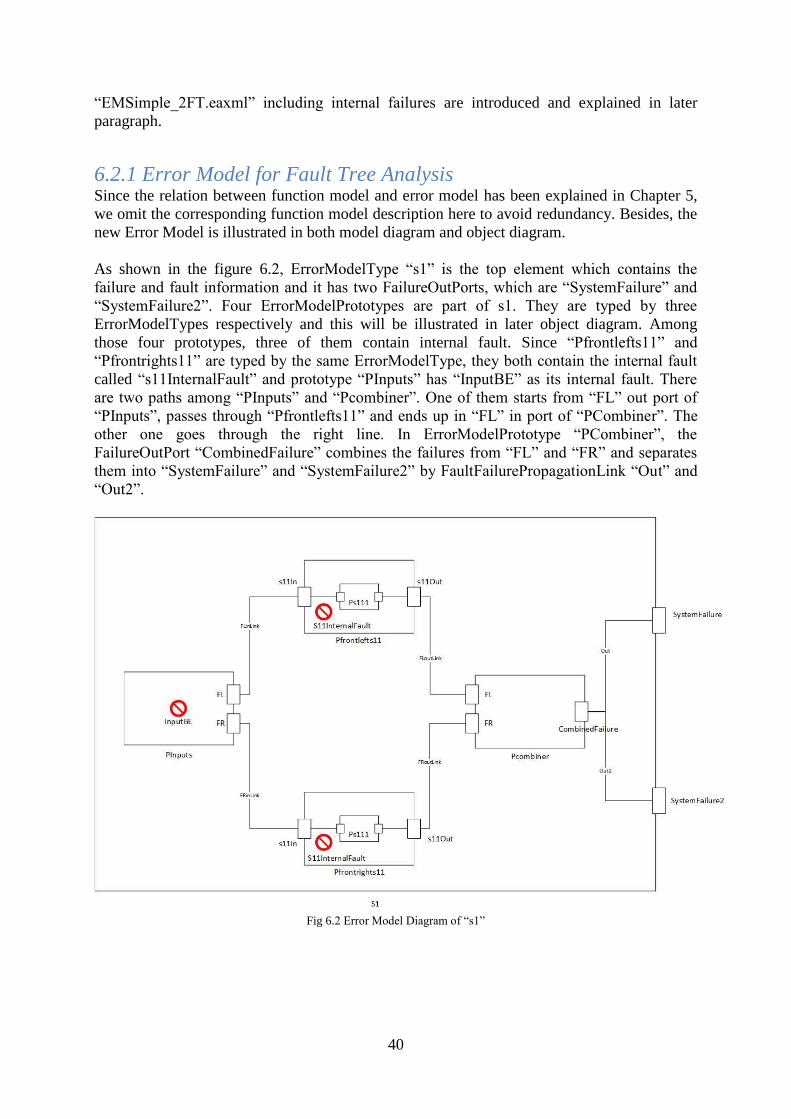
40
“EMSimple_2FT.eaxml” including internal failures are introduced and explained in later
paragraph.
6.2.1 Error Model for Fault Tree Analysis Since the relation between function model and error model has been explained in Chapter 5,
we omit the corresponding function model description here to avoid redundancy. Besides, the
new Error Model is illustrated in both model diagram and object diagram.
As shown in the figure 6.2, ErrorModelType “s1” is the top element which contains the
failure and fault information and it has two FailureOutPorts, which are “SystemFailure” and
“SystemFailure2”. Four ErrorModelPrototypes are part of s1. They are typed by three
ErrorModelTypes respectively and this will be illustrated in later object diagram. Among
those four prototypes, three of them contain internal fault. Since “Pfrontlefts11” and
“Pfrontrights11” are typed by the same ErrorModelType, they both contain the internal fault
called “s11InternalFault” and prototype “PInputs” has “InputBE” as its internal fault. There
are two paths among “PInputs” and “Pcombiner”. One of them starts from “FL” out port of
“PInputs”, passes through “Pfrontlefts11” and ends up in “FL” in port of “PCombiner”. The
other one goes through the right line. In ErrorModelPrototype “PCombiner”, the
FailureOutPort “CombinedFailure” combines the failures from “FL” and “FR” and separates
them into “SystemFailure” and “SystemFailure2” by FaultFailurePropagationLink “Out” and
“Out2”.
Fig 6.2 Error Model Diagram of “s1”
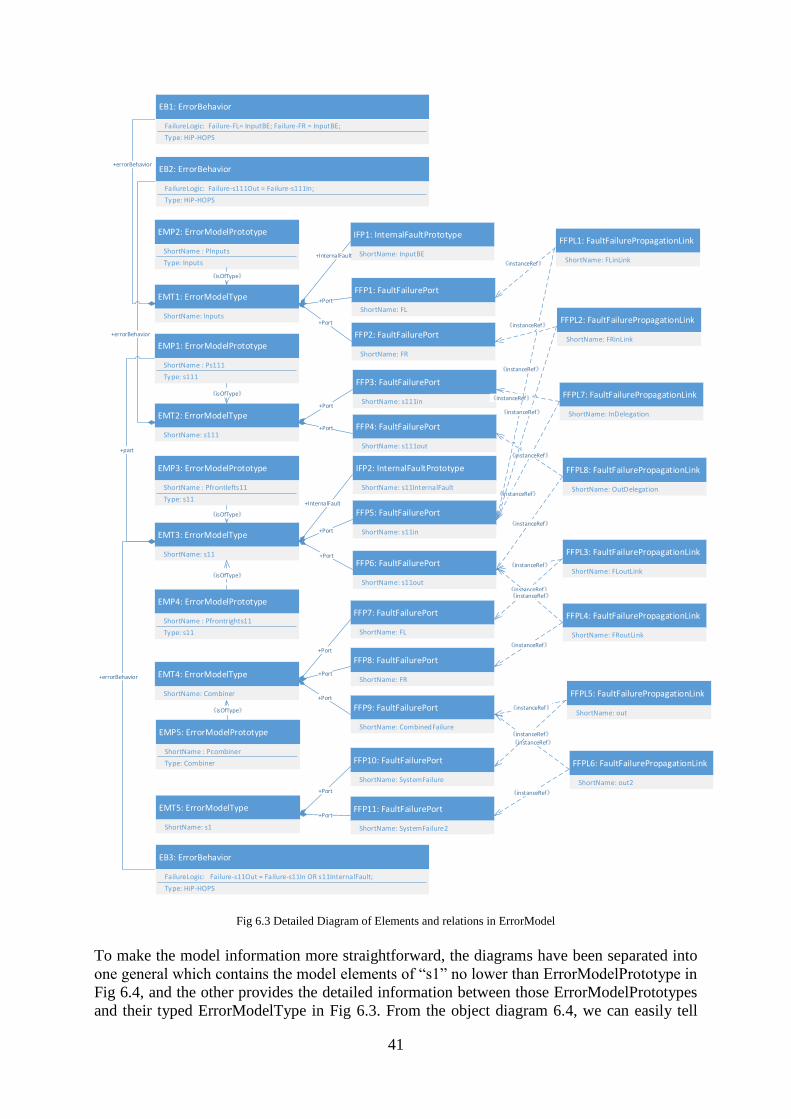
41
EMT1: ErrorModelType
ShortName: Inputs
EMT2: ErrorModelType
ShortName: s111
EMT3: ErrorModelType
ShortName: s11
EMT4: ErrorModelType
ShortName: Combiner
FFP1: FaultFailurePort
ShortName: FL
FFP2: FaultFailurePort
ShortName: FR
FFP3: FaultFailurePort
ShortName: s111in
FFP4: FaultFailurePort
ShortName: s111out
FFP6: FaultFailurePort
ShortName: s11out
FFP5: FaultFailurePort
ShortName: s11in
FFP7: FaultFailurePort
ShortName: FL
FFP8: FaultFailurePort
ShortName: FR
FFP9: FaultFailurePort
ShortName: CombinedFailure
+Port
+Port
+Port
+Port
+Port
+Port
+Port
+Port
+Port
EMP1: ErrorModelPrototype
ShortName : Ps111
Type: s111
EMP2: ErrorModelPrototype
ShortName : PInputs
Type: Inputs
EMP3: ErrorModelPrototype
ShortName : Pfrontlefts11
Type: s11
EMP4: ErrorModelPrototype
ShortName : Pfrontrights11
Type: s11
EMP5: ErrorModelPrototype
ShortName : Pcombiner
Type: Combiner
《isOfType》
《isOfType》
《isOfType》
《isOfType》
《isOfType》
+part
FFPL1: FaultFailurePropagationLink
ShortName: FLinLink
FFPL2: FaultFailurePropagationLink
ShortName: FRinLink
FFPL3: FaultFailurePropagationLink
ShortName: FLoutLink
FFPL4: FaultFailurePropagationLink
ShortName: FRoutLink
FFPL5: FaultFailurePropagationLink
ShortName: out
FFPL6: FaultFailurePropagationLink
ShortName: out2
FFPL7: FaultFailurePropagationLink
ShortName: InDelegation
FFPL8: FaultFailurePropagationLink
ShortName: OutDelegation《instanceRef》
《instanceRef》
《instanceRef》
《instanceRef》
《instanceRef》
《instanceRef》
《instanceRef》
《instanceRef》
《instanceRef》
《instanceRef》
《instanceRef》
《instanceRef》
《instanceRef》
《instanceRef》
EMT5: ErrorModelType
ShortName: s1
FFP10: FaultFailurePort
ShortName: SystemFailure
FFP11: FaultFailurePort
ShortName: SystemFailure2
+Port
+Port
《instanceRef》
《instanceRef》
+errorBehavior
IFP1: InternalFaultPrototype
ShortName: InputBE
IFP2: InternalFaultPrototype
ShortName: s11InternalFault
+InternalFault
+InternalFault
+errorBehavior
+errorBehavior
EB1: ErrorBehavior
FailureLogic: Failure-FL= InputBE; Failure-FR = InputBE;
Type: HiP-HOPS
EB2: ErrorBehavior
FailureLogic: Failure-s111Out = Failure-s111In;
Type: HiP-HOPS
EB3: ErrorBehavior
FailureLogic: Failure-s11Out = Failure-s11In OR s11InternalFault;
Type: HiP-HOPS
Fig 6.3 Detailed Diagram of Elements and relations in ErrorModel
To make the model information more straightforward, the diagrams have been separated into
one general which contains the model elements of “s1” no lower than ErrorModelPrototype in
Fig 6.4, and the other provides the detailed information between those ErrorModelPrototypes
and their typed ErrorModelType in Fig 6.3. From the object diagram 6.4, we can easily tell

42
that ErrorModelType “s1” has four ErrorModelPrototypes and six
FaultFailurePropagationLink. Besides, “SystemFailure” and “SystemFailure2” are the ports
belong to s1.
EMT5: ErrorModelType
ShortName: s1
FFP10: FaultFailurePort
ShortName: SystemFailure
FFP11: FaultFailurePort
ShortName: SystemFailure2
+port
+port
EMP2: ErrorModelPrototype
ShortName : PInputs
Type: Inputs
EMP3: ErrorModelPrototype
ShortName : Pfrontlefts11
Type: s11
EMP4: ErrorModelPrototype
ShortName : Pfrontrights11
Type: s11
EMP5: ErrorModelPrototype
ShortName : Pcombiner
Type: Combiner
+part
+part
+part
FFPL1: FaultFailurePropagationLink
ShortName: FLinLink
FFPL2: FaultFailurePropagationLink
ShortName: FRinLink
FFPL3: FaultFailurePropagationLink
ShortName: FLoutLink
FFPL4: FaultFailurePropagationLink
ShortName: FRoutLink
FFPL5: FaultFailurePropagationLink
ShortName: out
FFPL6: FaultFailurePropagationLink
ShortName: out2
+part
+faultfailureconnector
+faultfailureconnector
+faultfailureconnector
+faultfailureconnector
+faultfailureconnector
Fig 6.4 Detailed Diagram of Elements and relations for ErrorModelType “s1”
All the relations between ErrorModelType and ErrorModelPrototype in
“EMSimple_2FT.eaxml” are illustrated as above Fig 6.3 and Fig 6.4. For better
understanding, ErrorModelType, ErrorModelPrototype and their ErrorBehavior are listed in
the left column. The elements in the middle column are mostly FaultFailurePorts and the right
side elements are the FaultFailurePropagationLink connect different ports. The
InternalFaultPrototype are shown in the middle column which are numbered as “IFP1” and
“IFP2” which belong to ErrorModelType “Inputs” and “s11” respectively. One part is not
explained in the model diagram is ErrorModelType “s11” contains one ErrorModelPrototype
“Ps111” which is typed by “s111”.
6.2.2 Generating Fault Tree in EATOP
Goal 1 - Supporting Fault Tree Analysis of EAST-ADL
The work of parsing eaxml file in EATOP to hipxml was handed out on 22 of April and it is
done on June 12th. Septavera Sharvia, a phD in Computer Science and a researcher at
University of Hull, provided on important element. She has completed a feature of translating
an eaxml file to hipxml by giving the directory of the source eaxml and the short name of the
selected top system. The provided “EAXML2HIPXML.jar” which is added in dependency to
a java class. The corresponding hipxml will be generated in the same directory as “filePath”.
In order to parse the generated hipxml, the HiP-HOPS tool is needed. It can be downloaded
from its official website at: http://www.hip-hops.eu/index.php/downloads. There is
commercial version for analyzing bigger models, while in this research we choose the
evaluation version which has a limitation of 20 components. In order to create Fault Tree by
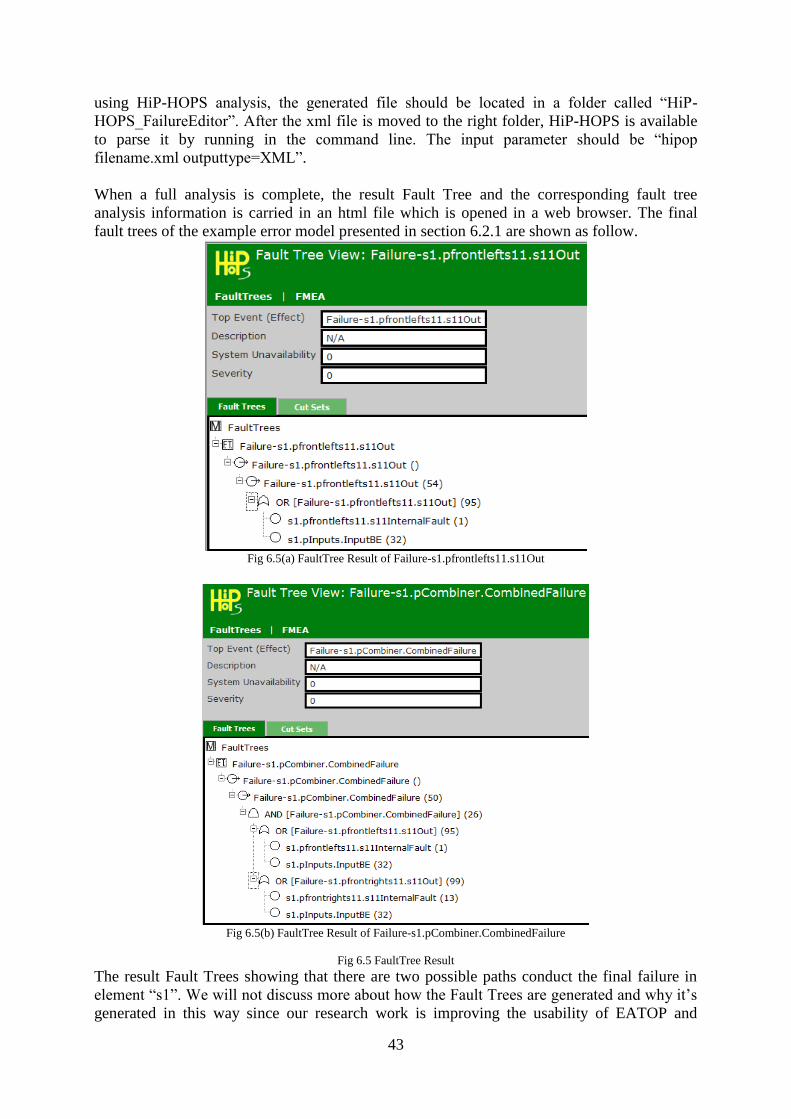
43
using HiP-HOPS analysis, the generated file should be located in a folder called “HiP-
HOPS_FailureEditor”. After the xml file is moved to the right folder, HiP-HOPS is available
to parse it by running in the command line. The input parameter should be “hipop
filename.xml outputtype=XML”.
When a full analysis is complete, the result Fault Tree and the corresponding fault tree
analysis information is carried in an html file which is opened in a web browser. The final
fault trees of the example error model presented in section 6.2.1 are shown as follow.
Fig 6.5(a) FaultTree Result of Failure-s1.pfrontlefts11.s11Out
Fig 6.5(b) FaultTree Result of Failure-s1.pCombiner.CombinedFailure
Fig 6.5 FaultTree Result
The result Fault Trees showing that there are two possible paths conduct the final failure in
element “s1”. We will not discuss more about how the Fault Trees are generated and why it’s
generated in this way since our research work is improving the usability of EATOP and
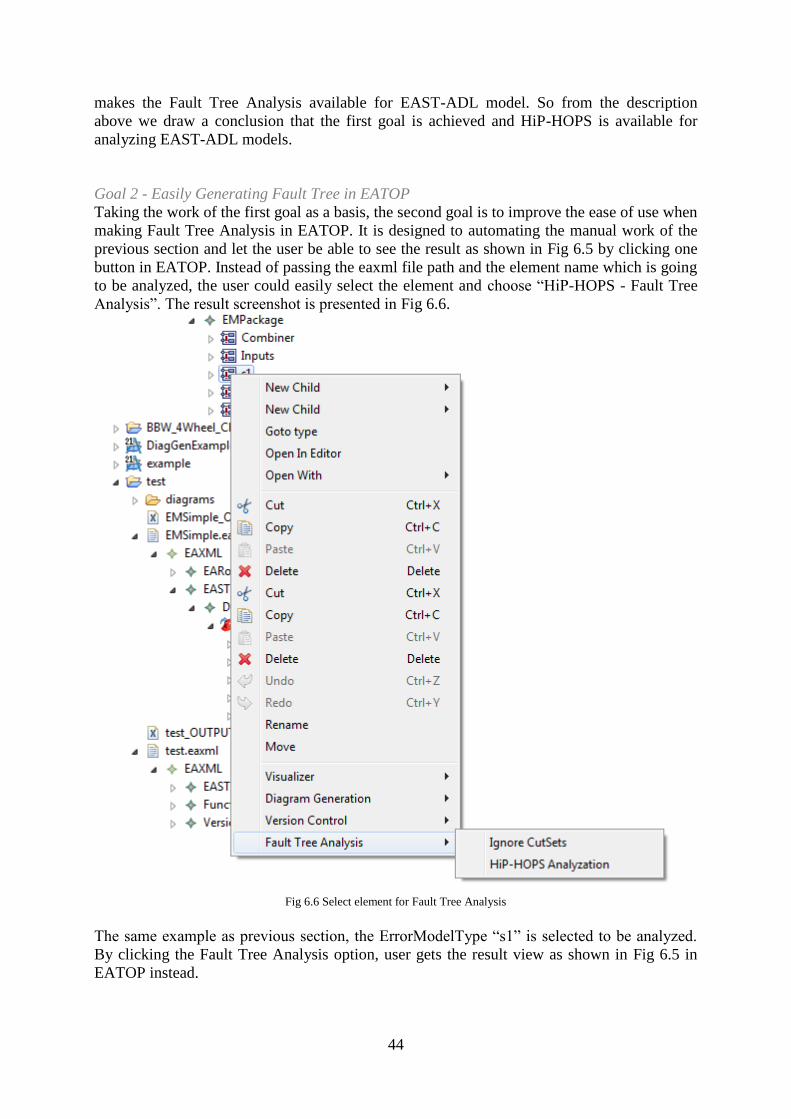
44
makes the Fault Tree Analysis available for EAST-ADL model. So from the description
above we draw a conclusion that the first goal is achieved and HiP-HOPS is available for
analyzing EAST-ADL models.
Goal 2 - Easily Generating Fault Tree in EATOP
Taking the work of the first goal as a basis, the second goal is to improve the ease of use when
making Fault Tree Analysis in EATOP. It is designed to automating the manual work of the
previous section and let the user be able to see the result as shown in Fig 6.5 by clicking one
button in EATOP. Instead of passing the eaxml file path and the element name which is going
to be analyzed, the user could easily select the element and choose “HiP-HOPS - Fault Tree
Analysis”. The result screenshot is presented in Fig 6.6.
Fig 6.6 Select element for Fault Tree Analysis
The same example as previous section, the ErrorModelType “s1” is selected to be analyzed.
By clicking the Fault Tree Analysis option, user gets the result view as shown in Fig 6.5 in
EATOP instead.
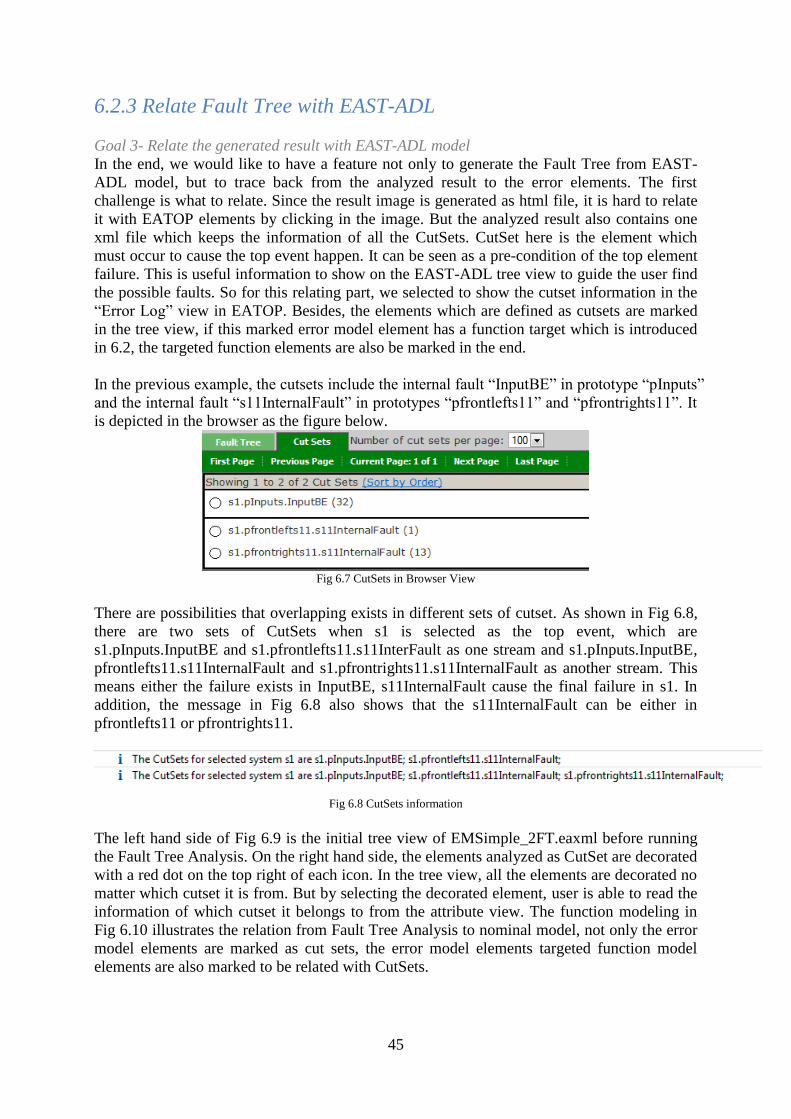
45
6.2.3 Relate Fault Tree with EAST-ADL
Goal 3- Relate the generated result with EAST-ADL model In the end, we would like to have a feature not only to generate the Fault Tree from EAST-
ADL model, but to trace back from the analyzed result to the error elements. The first
challenge is what to relate. Since the result image is generated as html file, it is hard to relate
it with EATOP elements by clicking in the image. But the analyzed result also contains one
xml file which keeps the information of all the CutSets. CutSet here is the element which
must occur to cause the top event happen. It can be seen as a pre-condition of the top element
failure. This is useful information to show on the EAST-ADL tree view to guide the user find
the possible faults. So for this relating part, we selected to show the cutset information in the
“Error Log” view in EATOP. Besides, the elements which are defined as cutsets are marked
in the tree view, if this marked error model element has a function target which is introduced
in 6.2, the targeted function elements are also be marked in the end.
In the previous example, the cutsets include the internal fault “InputBE” in prototype “pInputs”
and the internal fault “s11InternalFault” in prototypes “pfrontlefts11” and “pfrontrights11”. It
is depicted in the browser as the figure below.
Fig 6.7 CutSets in Browser View
There are possibilities that overlapping exists in different sets of cutset. As shown in Fig 6.8,
there are two sets of CutSets when s1 is selected as the top event, which are
s1.pInputs.InputBE and s1.pfrontlefts11.s11InterFault as one stream and s1.pInputs.InputBE,
pfrontlefts11.s11InternalFault and s1.pfrontrights11.s11InternalFault as another stream. This
means either the failure exists in InputBE, s11InternalFault cause the final failure in s1. In
addition, the message in Fig 6.8 also shows that the s11InternalFault can be either in
pfrontlefts11 or pfrontrights11.
Fig 6.8 CutSets information
The left hand side of Fig 6.9 is the initial tree view of EMSimple_2FT.eaxml before running
the Fault Tree Analysis. On the right hand side, the elements analyzed as CutSet are decorated
with a red dot on the top right of each icon. In the tree view, all the elements are decorated no
matter which cutset it is from. But by selecting the decorated element, user is able to read the
information of which cutset it belongs to from the attribute view. The function modeling in
Fig 6.10 illustrates the relation from Fault Tree Analysis to nominal model, not only the error
model elements are marked as cut sets, the error model elements targeted function model
elements are also marked to be related with CutSets.
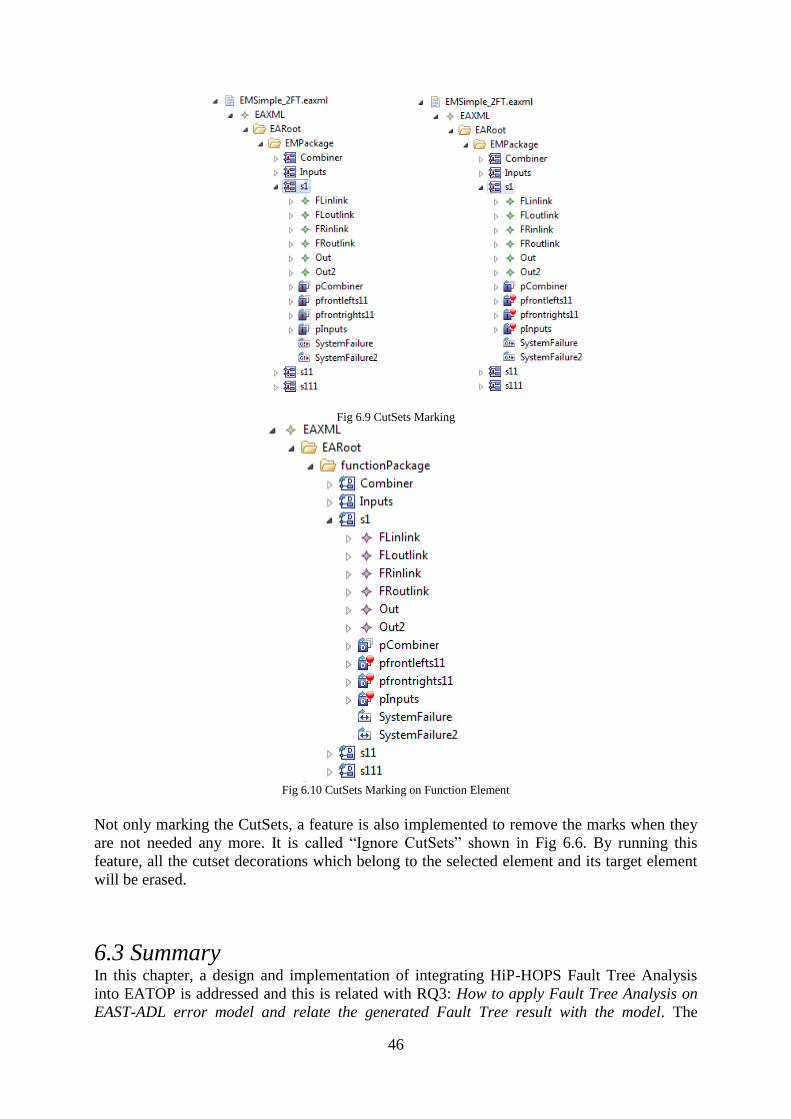
46
Fig 6.9 CutSets Marking
Fig 6.10 CutSets Marking on Function Element
Not only marking the CutSets, a feature is also implemented to remove the marks when they
are not needed any more. It is called “Ignore CutSets” shown in Fig 6.6. By running this
feature, all the cutset decorations which belong to the selected element and its target element
will be erased.
6.3 Summary In this chapter, a design and implementation of integrating HiP-HOPS Fault Tree Analysis
into EATOP is addressed and this is related with RQ3: How to apply Fault Tree Analysis on
EAST-ADL error model and relate the generated Fault Tree result with the model. The

47
feature is able for user to apply Fault Tree Analysis to EAST-ADL error model in EATOP
and it also supports applying Fault Tree Analysis at an early age of a system design which
reduce the failures in later design. Besides, it also reflects the analysis result into the model
view which enhance the usability of Fault Tree Analysis. Automating Fault Tree Analysis for
EAST-ADL is a fair effort. By using a third party commercial artifact (HiP-HOPS), existing
tooling can be used, although extra installation needs to be purchased for industrial use.
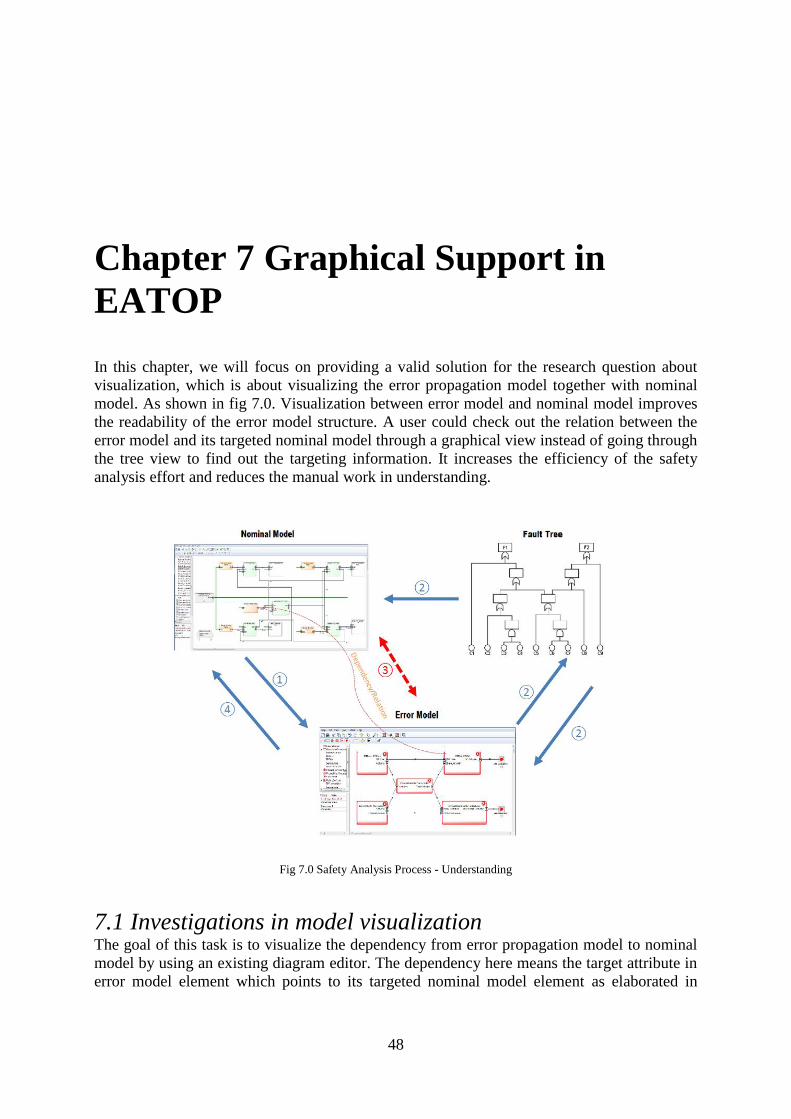
48
Chapter 7 Graphical Support in
EATOP
In this chapter, we will focus on providing a valid solution for the research question about
visualization, which is about visualizing the error propagation model together with nominal
model. As shown in fig 7.0. Visualization between error model and nominal model improves
the readability of the error model structure. A user could check out the relation between the
error model and its targeted nominal model through a graphical view instead of going through
the tree view to find out the targeting information. It increases the efficiency of the safety
analysis effort and reduces the manual work in understanding.
Fig 7.0 Safety Analysis Process - Understanding
7.1 Investigations in model visualization The goal of this task is to visualize the dependency from error propagation model to nominal
model by using an existing diagram editor. The dependency here means the target attribute in
error model element which points to its targeted nominal model element as elaborated in
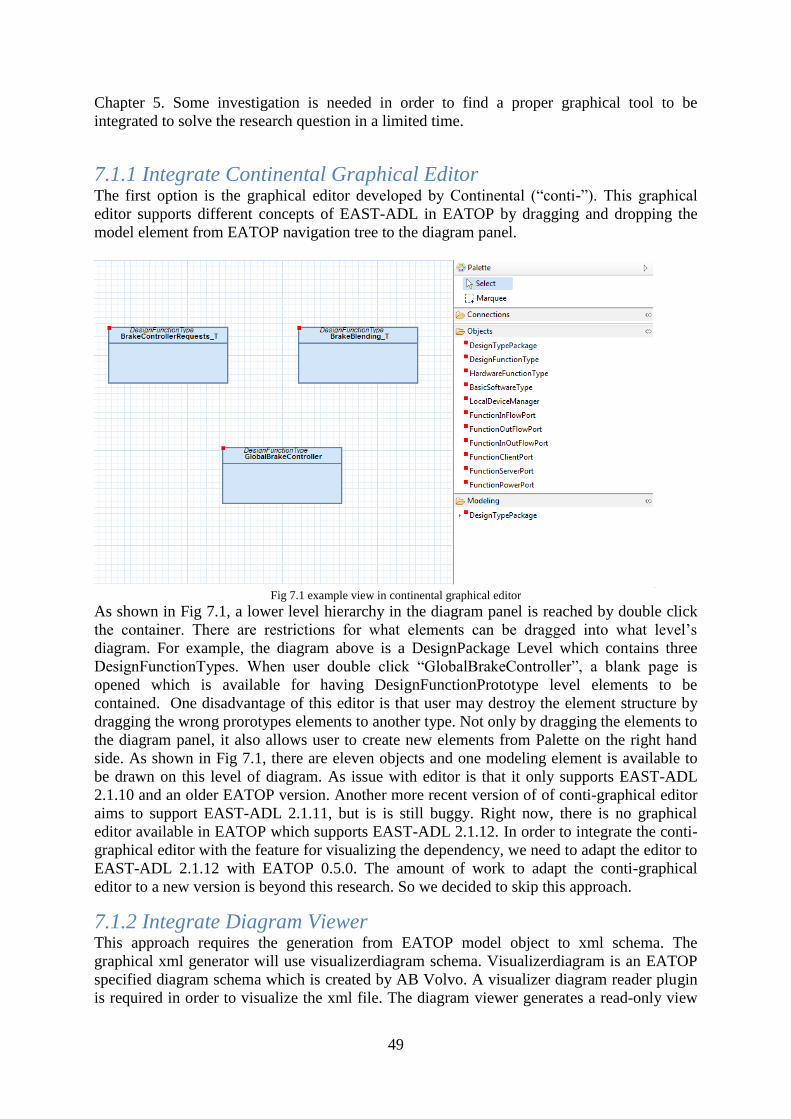
49
Chapter 5. Some investigation is needed in order to find a proper graphical tool to be
integrated to solve the research question in a limited time.
7.1.1 Integrate Continental Graphical Editor The first option is the graphical editor developed by Continental (“conti-”). This graphical
editor supports different concepts of EAST-ADL in EATOP by dragging and dropping the
model element from EATOP navigation tree to the diagram panel.
Fig 7.1 example view in continental graphical editor
As shown in Fig 7.1, a lower level hierarchy in the diagram panel is reached by double click
the container. There are restrictions for what elements can be dragged into what level’s
diagram. For example, the diagram above is a DesignPackage Level which contains three
DesignFunctionTypes. When user double click “GlobalBrakeController”, a blank page is
opened which is available for having DesignFunctionPrototype level elements to be
contained. One disadvantage of this editor is that user may destroy the element structure by
dragging the wrong prorotypes elements to another type. Not only by dragging the elements to
the diagram panel, it also allows user to create new elements from Palette on the right hand
side. As shown in Fig 7.1, there are eleven objects and one modeling element is available to
be drawn on this level of diagram. As issue with editor is that it only supports EAST-ADL
2.1.10 and an older EATOP version. Another more recent version of of conti-graphical editor
aims to support EAST-ADL 2.1.11, but is is still buggy. Right now, there is no graphical
editor available in EATOP which supports EAST-ADL 2.1.12. In order to integrate the conti-
graphical editor with the feature for visualizing the dependency, we need to adapt the editor to
EAST-ADL 2.1.12 with EATOP 0.5.0. The amount of work to adapt the conti-graphical
editor to a new version is beyond this research. So we decided to skip this approach.
7.1.2 Integrate Diagram Viewer This approach requires the generation from EATOP model object to xml schema. The
graphical xml generator will use visualizerdiagram schema. Visualizerdiagram is an EATOP
specified diagram schema which is created by AB Volvo. A visualizer diagram reader plugin
is required in order to visualize the xml file. The diagram viewer generates a read-only view

50
from its xml file and present the file in diagram editor in EATOP. As shown in Fig 7.2, the
*.visualizerdiagram can be read in EATOP, but it does not allow the user to edit the diagram
directly. Instead, if some changes is needed, user should go to the model element and after the
modification is done, an update is needed for the the generated *.visualizerdiagram files.
Fig 7.2 xml file generating
The EATOP internal diagram viewer is convenient to use and the appearance of the graph
depends on how the algorithm handles complicated situations, for example, the element
overlapping or huge amount of connectors.
7.2 Different views generated by Diagram generator Different views which are generated by the diagram generator are presented in this section
Identifiable element view, realizes a single box in the graph with its name for each of the
selected element. It is applicable for any kind of EAST-ADL element. Error Model Type view
& target and Error ModelPrototype view & target are shown when ErrorModelType element
is selected in EATOP. And the diagram is generated according to the selected elements’
structure. The later subsections will explain how and what elements are generated in different
views respectively.
7.2.1 Identifiable Element
Fig 7.3 Identifiable View – Package View
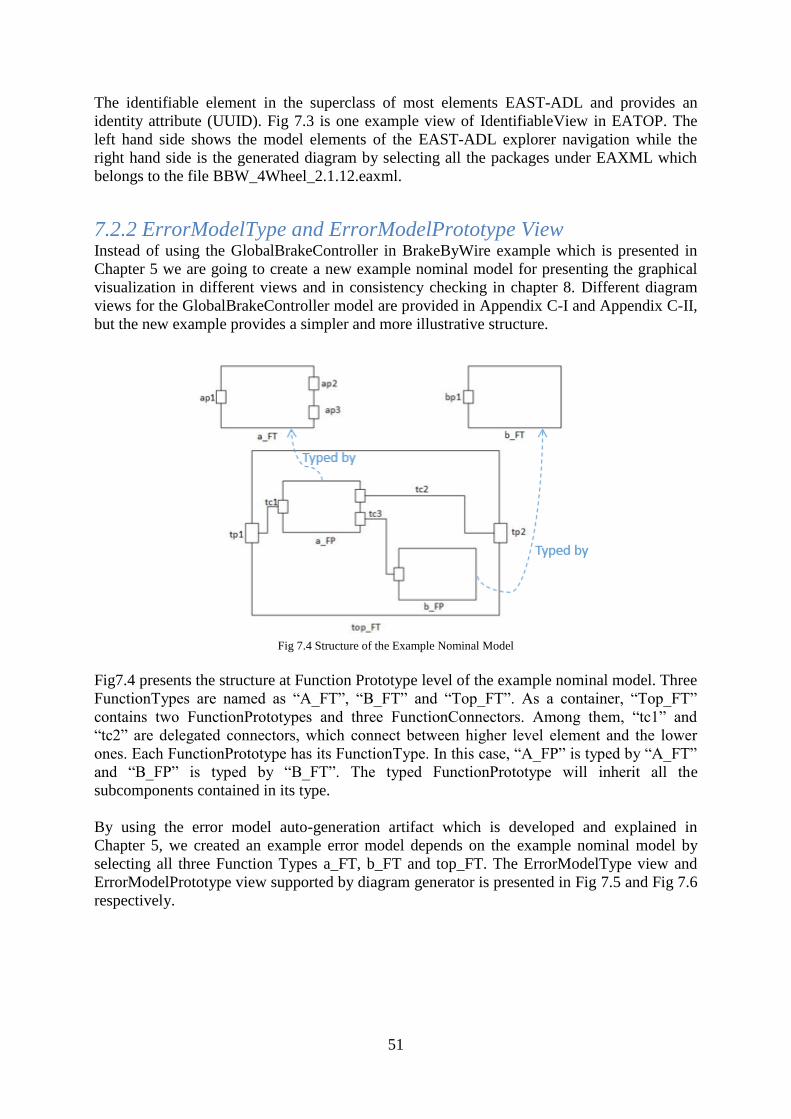
51
The identifiable element in the superclass of most elements EAST-ADL and provides an
identity attribute (UUID). Fig 7.3 is one example view of IdentifiableView in EATOP. The
left hand side shows the model elements of the EAST-ADL explorer navigation while the
right hand side is the generated diagram by selecting all the packages under EAXML which
belongs to the file BBW_4Wheel_2.1.12.eaxml.
7.2.2 ErrorModelType and ErrorModelPrototype View Instead of using the GlobalBrakeController in BrakeByWire example which is presented in
Chapter 5 we are going to create a new example nominal model for presenting the graphical
visualization in different views and in consistency checking in chapter 8. Different diagram
views for the GlobalBrakeController model are provided in Appendix C-I and Appendix C-II,
but the new example provides a simpler and more illustrative structure.
Fig 7.4 Structure of the Example Nominal Model
Fig7.4 presents the structure at Function Prototype level of the example nominal model. Three
FunctionTypes are named as “A_FT”, “B_FT” and “Top_FT”. As a container, “Top_FT”
contains two FunctionPrototypes and three FunctionConnectors. Among them, “tc1” and
“tc2” are delegated connectors, which connect between higher level element and the lower
ones. Each FunctionPrototype has its FunctionType. In this case, “A_FP” is typed by “A_FT”
and “B_FP” is typed by “B_FT”. The typed FunctionPrototype will inherit all the
subcomponents contained in its type.
By using the error model auto-generation artifact which is developed and explained in
Chapter 5, we created an example error model depends on the example nominal model by
selecting all three Function Types a_FT, b_FT and top_FT. The ErrorModelType view and
ErrorModelPrototype view supported by diagram generator is presented in Fig 7.5 and Fig 7.6
respectively.
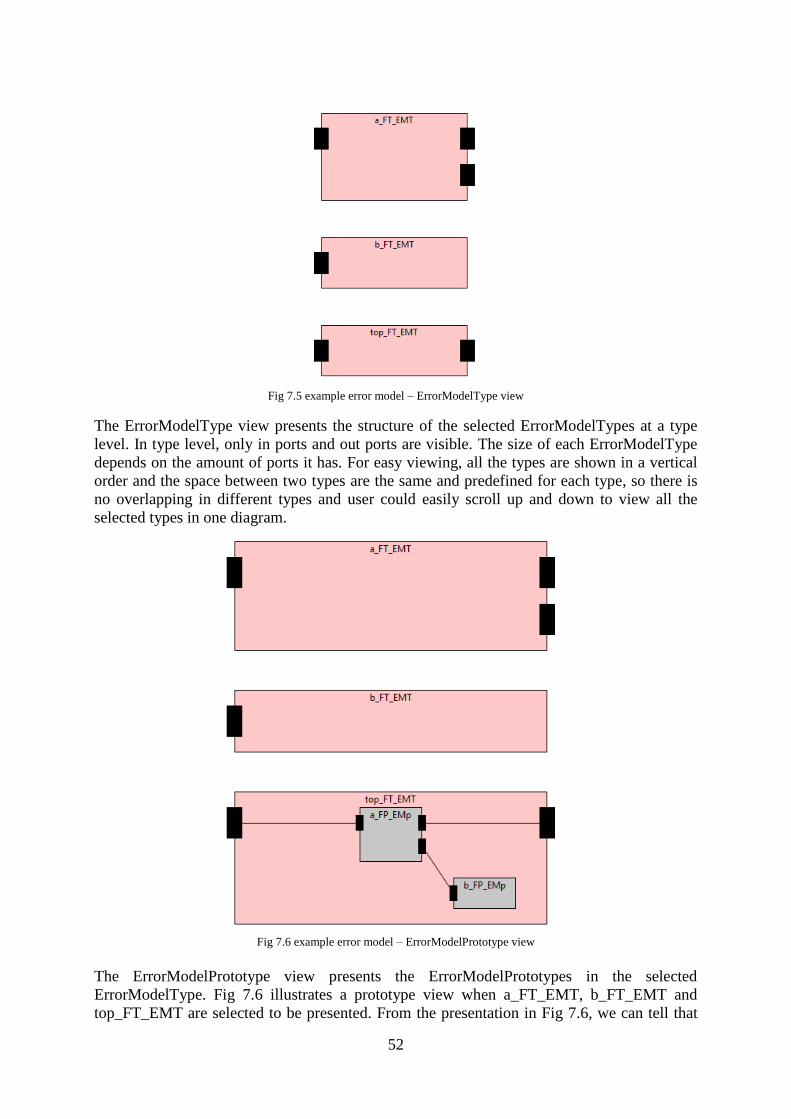
52
Fig 7.5 example error model – ErrorModelType view
The ErrorModelType view presents the structure of the selected ErrorModelTypes at a type
level. In type level, only in ports and out ports are visible. The size of each ErrorModelType
depends on the amount of ports it has. For easy viewing, all the types are shown in a vertical
order and the space between two types are the same and predefined for each type, so there is
no overlapping in different types and user could easily scroll up and down to view all the
selected types in one diagram.
Fig 7.6 example error model – ErrorModelPrototype view
The ErrorModelPrototype view presents the ErrorModelPrototypes in the selected
ErrorModelType. Fig 7.6 illustrates a prototype view when a_FT_EMT, b_FT_EMT and
top_FT_EMT are selected to be presented. From the presentation in Fig 7.6, we can tell that
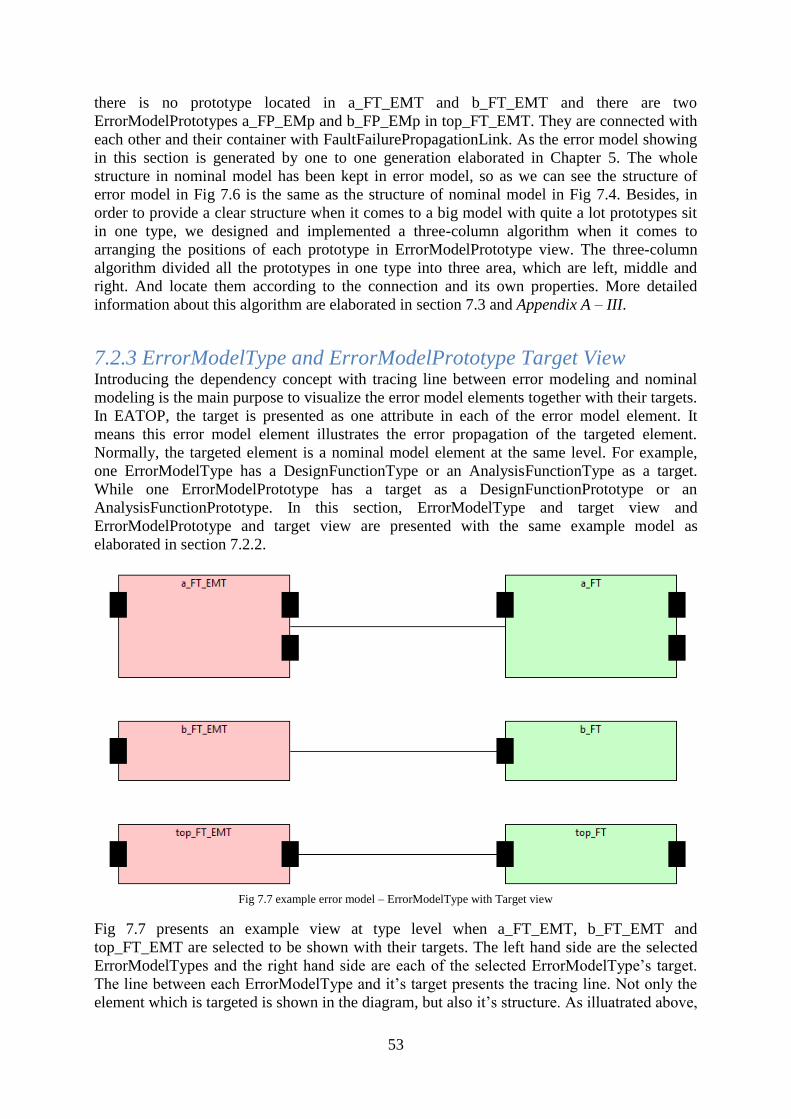
53
there is no prototype located in a_FT_EMT and b_FT_EMT and there are two
ErrorModelPrototypes a_FP_EMp and b_FP_EMp in top_FT_EMT. They are connected with
each other and their container with FaultFailurePropagationLink. As the error model showing
in this section is generated by one to one generation elaborated in Chapter 5. The whole
structure in nominal model has been kept in error model, so as we can see the structure of
error model in Fig 7.6 is the same as the structure of nominal model in Fig 7.4. Besides, in
order to provide a clear structure when it comes to a big model with quite a lot prototypes sit
in one type, we designed and implemented a three-column algorithm when it comes to
arranging the positions of each prototype in ErrorModelPrototype view. The three-column
algorithm divided all the prototypes in one type into three area, which are left, middle and
right. And locate them according to the connection and its own properties. More detailed
information about this algorithm are elaborated in section 7.3 and Appendix A – III.
7.2.3 ErrorModelType and ErrorModelPrototype Target View Introducing the dependency concept with tracing line between error modeling and nominal
modeling is the main purpose to visualize the error model elements together with their targets.
In EATOP, the target is presented as one attribute in each of the error model element. It
means this error model element illustrates the error propagation of the targeted element.
Normally, the targeted element is a nominal model element at the same level. For example,
one ErrorModelType has a DesignFunctionType or an AnalysisFunctionType as a target.
While one ErrorModelPrototype has a target as a DesignFunctionPrototype or an
AnalysisFunctionPrototype. In this section, ErrorModelType and target view and
ErrorModelPrototype and target view are presented with the same example model as
elaborated in section 7.2.2.
Fig 7.7 example error model – ErrorModelType with Target view
Fig 7.7 presents an example view at type level when a_FT_EMT, b_FT_EMT and
top_FT_EMT are selected to be shown with their targets. The left hand side are the selected
ErrorModelTypes and the right hand side are each of the selected ErrorModelType’s target.
The line between each ErrorModelType and it’s target presents the tracing line. Not only the
element which is targeted is shown in the diagram, but also it’s structure. As illuatrated above,
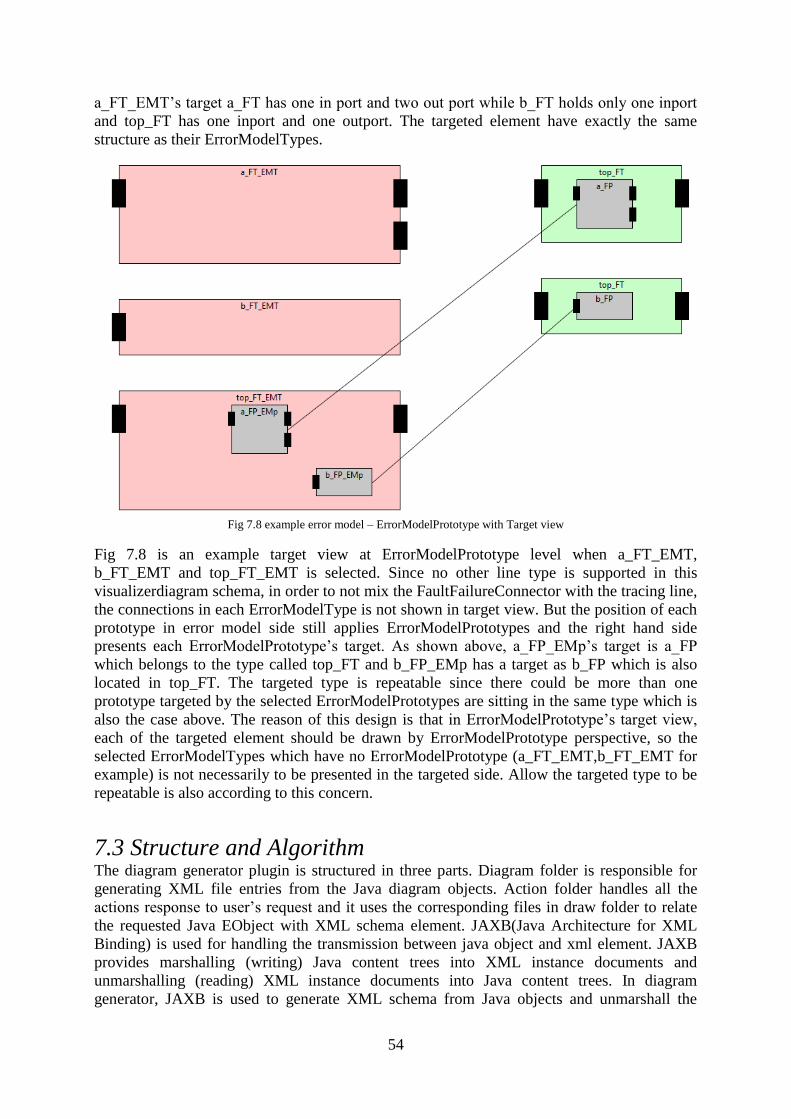
54
a_FT_EMT’s target a_FT has one in port and two out port while b_FT holds only one inport
and top_FT has one inport and one outport. The targeted element have exactly the same
structure as their ErrorModelTypes.
Fig 7.8 example error model – ErrorModelPrototype with Target view
Fig 7.8 is an example target view at ErrorModelPrototype level when a_FT_EMT,
b_FT_EMT and top_FT_EMT is selected. Since no other line type is supported in this
visualizerdiagram schema, in order to not mix the FaultFailureConnector with the tracing line,
the connections in each ErrorModelType is not shown in target view. But the position of each
prototype in error model side still applies ErrorModelPrototypes and the right hand side
presents each ErrorModelPrototype’s target. As shown above, a_FP_EMp’s target is a_FP
which belongs to the type called top_FT and b_FP_EMp has a target as b_FP which is also
located in top_FT. The targeted type is repeatable since there could be more than one
prototype targeted by the selected ErrorModelPrototypes are sitting in the same type which is
also the case above. The reason of this design is that in ErrorModelPrototype’s target view,
each of the targeted element should be drawn by ErrorModelPrototype perspective, so the
selected ErrorModelTypes which have no ErrorModelPrototype (a_FT_EMT,b_FT_EMT for
example) is not necessarily to be presented in the targeted side. Allow the targeted type to be
repeatable is also according to this concern.
7.3 Structure and Algorithm The diagram generator plugin is structured in three parts. Diagram folder is responsible for
generating XML file entries from the Java diagram objects. Action folder handles all the
actions response to user’s request and it uses the corresponding files in draw folder to relate
the requested Java EObject with XML schema element. JAXB(Java Architecture for XML
Binding) is used for handling the transmission between java object and xml element. JAXB
provides marshalling (writing) Java content trees into XML instance documents and
unmarshalling (reading) XML instance documents into Java content trees. In diagram
generator, JAXB is used to generate XML schema from Java objects and unmarshall the
55
generated xml instance when the information is needed for java element, for example, when
drawing the connection between ports, the location of different ports are unmarshalled from
its xml instance.
Since the diagram generator creates a read only view, it’s quite important to keep the diagram
clean and clear, especially when it comes to a big system. For this reason, we have designed
and developed a three column algorithm when locating the prototypes in its type. Since there
are connectors link between different prototype ports or between prototype ports and the type
ports as delegation connectors. The main purpose of the three column algorithm is by re-
organizing the location of the prototypes to make connectors between elements more readable
and understandable. As a result, the prototypes which only have outports or the ones only
have the connections with the type’s inports are located in the left column. The prototypes
which have connections with type’s both inports and outports or the ones have no connections
with the type are located in the middle column. The rest prototypes which only have inports or
the ones only have the connections with the type’s outports are located in the right column.
The piece of code of three columns algorithm is shown in Appendix A – III Three Columns
Algorithm.
7.4 Summary In general, diagram generator plugin is able to present several different views for visualizing
the error propagation model together with the nominal model. And it addresses one possible
solution according to RQ4, which is How to visualize the error propagation model together
with architecture model. It fulfills the requirement of showing the tracing dependency line
between error model and its targeted nominal model at both type and prototype levels. But it
also provides a base support for all identifiable elements in EAST-ADL. The usage of three
columns algorithm enhances the presentation of a large system’s structure in a more
reasonable and clear way. Depending on the support of diagram viewer, each generated file is
easily opened and reviewed in EATOP. But there are inconveniences exist while using it. For
example, the generated diagram is not editable, user has to go back to the model element in
order to make a change. The generated file is not generic, they are parsed by diagram viewer
in EATOP, and no other external tool support this visualizerdiagram xml schema. Besides, the
non-standard schema does not support other kind of lines than solid lines, like dashed lines.
This makes the tracing link and connections to be hard to differ in the diagram. From the
above, we can tell that even flaws exist, but the diagram generator plugin in general is a quick
and easy tool in providing specific visualization in EATOP.
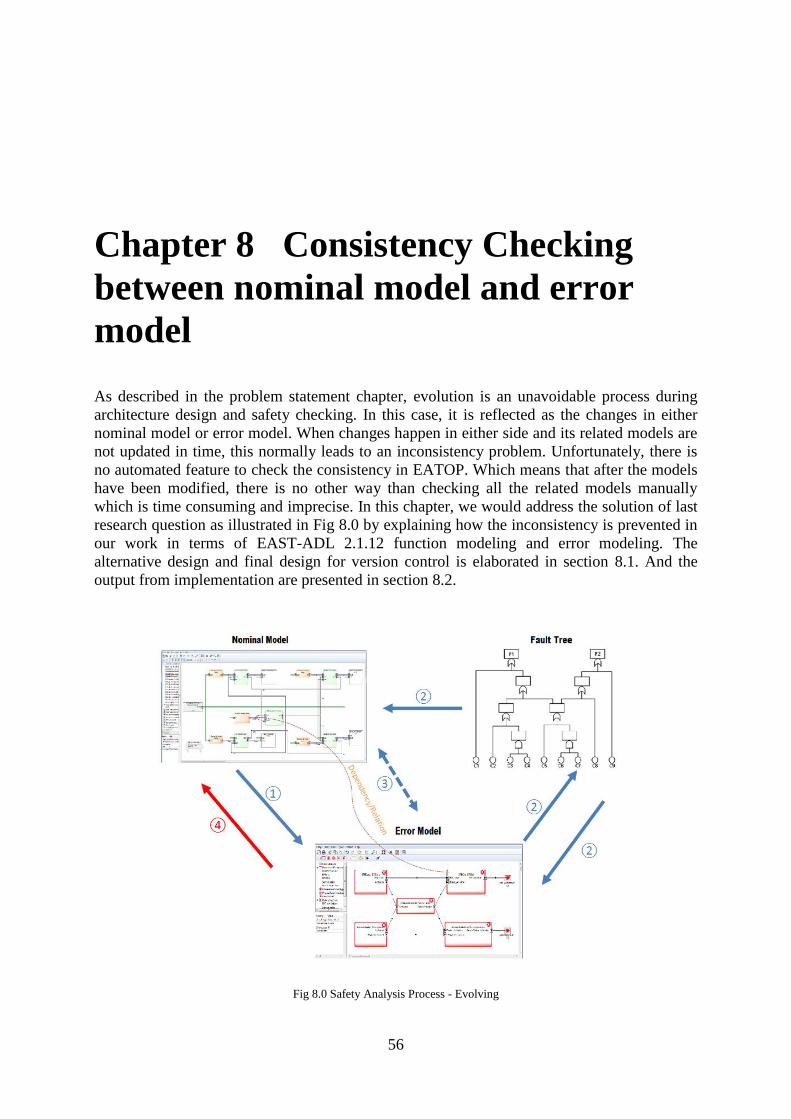
56
Chapter 8 Consistency Checking
between nominal model and error
model
As described in the problem statement chapter, evolution is an unavoidable process during
architecture design and safety checking. In this case, it is reflected as the changes in either
nominal model or error model. When changes happen in either side and its related models are
not updated in time, this normally leads to an inconsistency problem. Unfortunately, there is
no automated feature to check the consistency in EATOP. Which means that after the models
have been modified, there is no other way than checking all the related models manually
which is time consuming and imprecise. In this chapter, we would address the solution of last
research question as illustrated in Fig 8.0 by explaining how the inconsistency is prevented in
our work in terms of EAST-ADL 2.1.12 function modeling and error modeling. The
alternative design and final design for version control is elaborated in section 8.1. And the
output from implementation are presented in section 8.2.
Fig 8.0 Safety Analysis Process - Evolving
57
8.1 Design Specification
8.1.1 Alternatives for consistency checking Several alternatives are available for handling the consistency checking between function
modeling and error modeling. EMF compare is an eclipse based model comparing tool for
EMF model. In this case, the model before changes or after last consistency checking is stored
for comparison. Whenever user requires checking the consistency, the current model is used
to compare with the stored model and the result are the differences between those two models,
for example, the deletion, addition or modification of elements. When inconsistence exists,
the differences are reported to the user. But the problem here is that EMF compare only
handles a settled complexity of evolution by the customized comparison strategy. While in
real life work, not all the changes are able to be predicted in advance and there is no exact
definition of being consistent or not for one element. For example, the function type “ABS_T”
in BBW example could be consistent with one error model type with different structure in
different situations. This makes the EMF compare not applicable for automate the consistency
checking between heterogeneous targets. Another alternative is keeping a hash code for each
element. Since the UUID as a unique ID for each element in EAST-ADL modeling is not
fulfilled in EATOP in default. One alternative is keeping each element’s generated time as the
“hash code” in UUID attribute. And this can keep each element unique. So whenever the
system detects there is one element have two different UUID, it informs the user as
inconsistency may exist since the element has been updated. But considering the initial goal
of UUID is not for save the time stamp and there might be other features read the elements by
its UUID, we decided to drop this idea for consistency checking.
From the discussion above, the automatic detecting way seems not totally applicable for this
situation. But there is one way called version control has been conducted in several
automotive applications for checking the modeling consistency. It requires manual decision
for the version increase and whether there is consistency or not is decided by the user. After
setting the version for each element, system checks whether there is a different between the
targeted version and the error model version. Comparing with other alternatives, version
control do requires more manual work, but it is the most efficient way for handling the
complex situation during consistency checking. Therefore, version control is designed to be
the way for checking the consistency between nominal model and error model in this research.
8.1.2 Version Control Design Specification Fig 8.1 illustrates one example workflow when applying consistency checking for the user’s
intended file. As shown in the Figure, if one “*.eaxml” file has not been version initiated, user
has to run “Initiate version” function in order to set version element for all existing nominal
and error elements. All the versions and targeted versions are set according to the user’s input.
The targeted version here is only available for the error model element, it is used for recording
the matching targeted version to compare with the current target version, and more detail
information will be explained in next section.
When all the elements needed for consistency checking contain a version number, they are
available for consistency checking. If one element has been modified, user has the authority to
either select increase the version of this element or stay the same as before. The version can
be changed by manually typing or by automatically increasing. In manual typing, user needs
to locate the new version number to the corresponding version element and the version can be
modified to any number he needs, while letter is not allowed in a version number. In
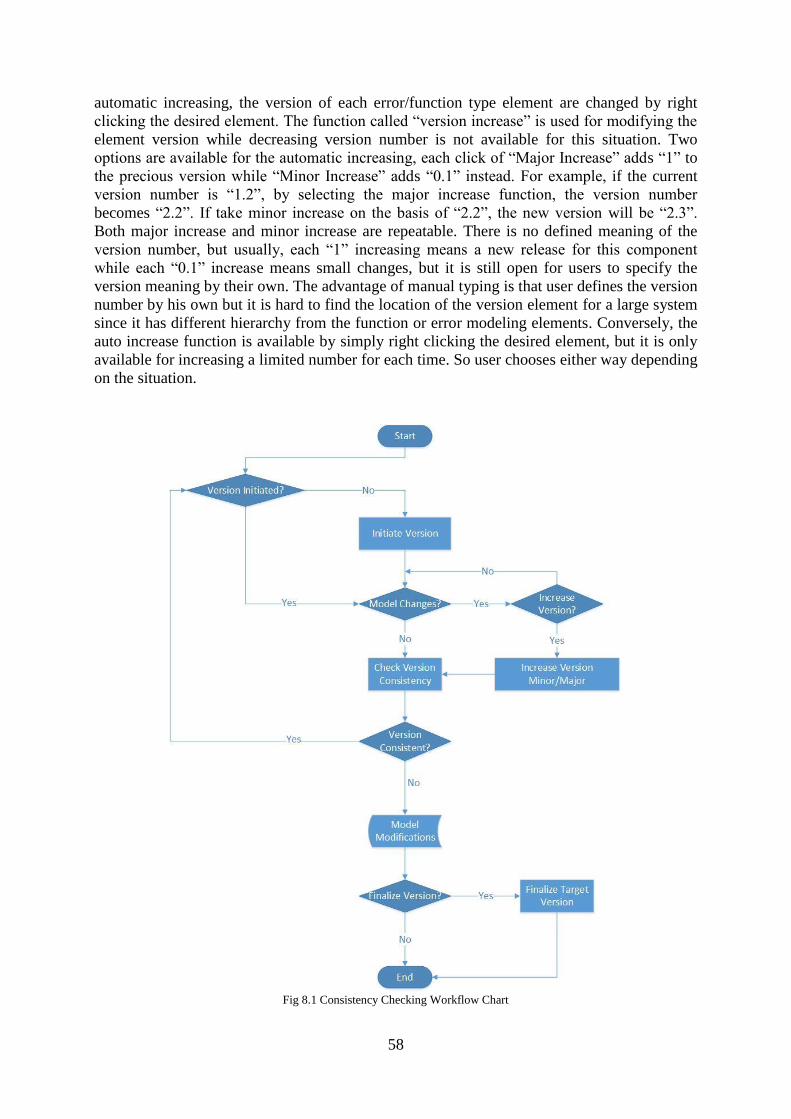
58
automatic increasing, the version of each error/function type element are changed by right
clicking the desired element. The function called “version increase” is used for modifying the
element version while decreasing version number is not available for this situation. Two
options are available for the automatic increasing, each click of “Major Increase” adds “1” to
the precious version while “Minor Increase” adds “0.1” instead. For example, if the current
version number is “1.2”, by selecting the major increase function, the version number
becomes “2.2”. If take minor increase on the basis of “2.2”, the new version will be “2.3”.
Both major increase and minor increase are repeatable. There is no defined meaning of the
version number, but usually, each “1” increasing means a new release for this component
while each “0.1” increase means small changes, but it is still open for users to specify the
version meaning by their own. The advantage of manual typing is that user defines the version
number by his own but it is hard to find the location of the version element for a large system
since it has different hierarchy from the function or error modeling elements. Conversely, the
auto increase function is available by simply right clicking the desired element, but it is only
available for increasing a limited number for each time. So user chooses either way depending
on the situation.
Fig 8.1 Consistency Checking Workflow Chart

59
User does not need to check consistency for each change, he/she could wait till it is time to
revise the whole project or at any time he/she decide to be. But after running the consistency
checking, the user will either be informed that all versions are consistent. Or get the
inconsistency elements message in both information view in EATOP (same as Eclipse) and
the tree view. The version consistency checking does not require any manual work, the
system analyses each element’s version and provide the result of whether it is consistent or
not between the function modeling and nominal modeling. If the goal is to make sure all
elements are consistent with each other, several modifications needed to be done, and after all,
there is an option for the user to finalize the targeted version, which the system helps the user
to make the selected error model elements version match their target versions. If user is
satisfied with the current state of the project, they could start with a new working stage.
Otherwise, they continue with the check consistency from beginning. The consistency
checking in this work does not support the following situations:
1. No version number is set
2. Those error elements which have no target function model
3. Those function elements are not targeted in the error model
8.2 Result Specification After the “why” has been explained in previous section, this section solves the “how”
question for each function by a short description and one example use case. All use cases
follow the working flow shown in Fig 8.1.Besides, sequence diagrams and the result
snapshots will be presented assisting the explanation in order to make each case easy to
understand.
8.2.1 Initiate Version In order to create a version for each model element in EATOP, an Initiate Version step is
needed. While it is only needed to be done once when an architecture design is currently
finished. After running the initiate version function, each existing function and error element
is attached with a version element. The version element attached to function element contains
a version number which means the corresponding function element’s current version number.
While for each error model element, a target version number is also recorded in its version
element which is used for pointing out the consistent target version number. So if the targeted
function element has a version number not equaling to its error element’s target version, then
there must be an inconsistency between them. Any additional function or error element is
allowed to be added into the system after running the initiate version function, but it requires
rerunning the initiate version step. After each rerunning, a new set of version elements are
added and new version number and target version number are required to be set by user.

60
Fig 8.2 Initiate Version Sequence Diagram
As illustrated in Fig 8.2, a request to initiate version is sent by user right clicking on one
EAST-ADL top level element and select “Initiate Version”, system responds by asking for
version number and target version number, the target version number is only applicable for
error element as explained above. In this case as shown in the figure, both versions are set as
“1” as initial, which means all the function and error elements have a version number of “1”,
and all the error model’s target version number should be “1”, so it is regarded as all elements
are consistent in this example. It is designed to use the EAST-ADL 2.1.12
UserAttributedElement to record the version number. Each of this element contains one or
two Numerical Value which is the value of the version number. One example of VersionType
elements are depicted in the picture 8.3. “a_FT_VersionType” is the version element for
element “a_FT” and it means element “a_FT” is currently in version “1”.
There is a distinction between the VersionType for function element and error element. Each
error model element has one extra version number called “TargetVersion” as shown in Fig 8.4.
This extra version is used to record this error element’s target version. In this example, the
“a_FT_EMT” is in version “1” and its matching target element “a_FT” version should be “1”.
So if “a_FT” has a version other than “1”, it means there is a version inconsistency exist
between those two elements. This strategy is used for later consistency checking. According
to user’s requirements, system sets the entire versions into different folders which separates
the function modeling elements and error modeling elements.
Fig 8.3 Error Modeling Version Fig 8.4 Function Modeling Version
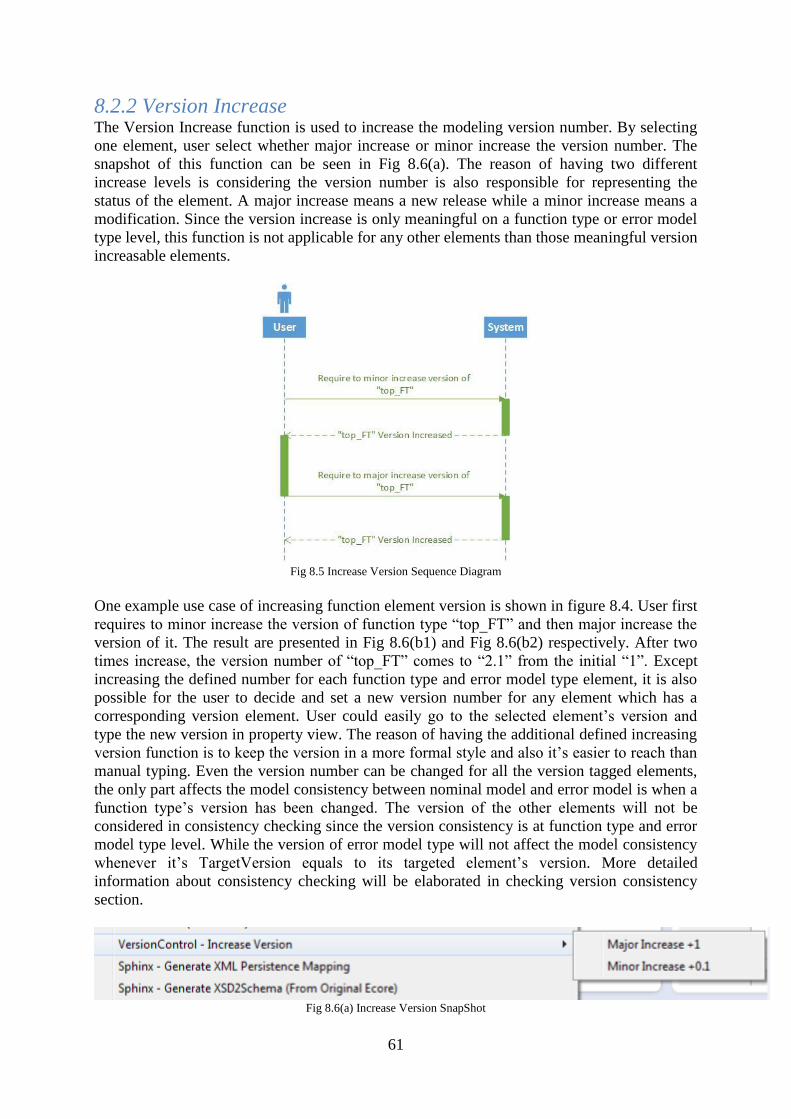
61
8.2.2 Version Increase The Version Increase function is used to increase the modeling version number. By selecting
one element, user select whether major increase or minor increase the version number. The
snapshot of this function can be seen in Fig 8.6(a). The reason of having two different
increase levels is considering the version number is also responsible for representing the
status of the element. A major increase means a new release while a minor increase means a
modification. Since the version increase is only meaningful on a function type or error model
type level, this function is not applicable for any other elements than those meaningful version
increasable elements.
Fig 8.5 Increase Version Sequence Diagram
One example use case of increasing function element version is shown in figure 8.4. User first
requires to minor increase the version of function type “top_FT” and then major increase the
version of it. The result are presented in Fig 8.6(b1) and Fig 8.6(b2) respectively. After two
times increase, the version number of “top_FT” comes to “2.1” from the initial “1”. Except
increasing the defined number for each function type and error model type element, it is also
possible for the user to decide and set a new version number for any element which has a
corresponding version element. User could easily go to the selected element’s version and
type the new version in property view. The reason of having the additional defined increasing
version function is to keep the version in a more formal style and also it’s easier to reach than
manual typing. Even the version number can be changed for all the version tagged elements,
the only part affects the model consistency between nominal model and error model is when a
function type’s version has been changed. The version of the other elements will not be
considered in consistency checking since the version consistency is at function type and error
model type level. While the version of error model type will not affect the model consistency
whenever it’s TargetVersion equals to its targeted element’s version. More detailed
information about consistency checking will be elaborated in checking version consistency
section.
Fig 8.6(a) Increase Version SnapShot
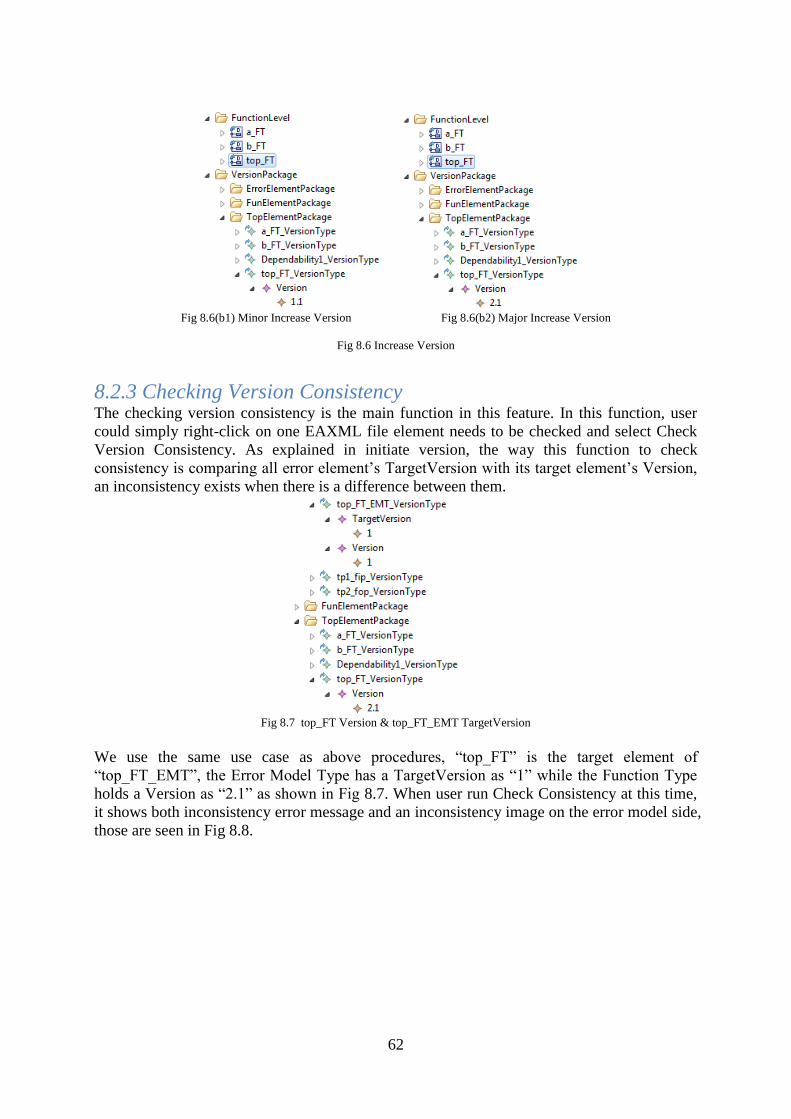
62
Fig 8.6(b1) Minor Increase Version Fig 8.6(b2) Major Increase Version
Fig 8.6 Increase Version
8.2.3 Checking Version Consistency The checking version consistency is the main function in this feature. In this function, user
could simply right-click on one EAXML file element needs to be checked and select Check
Version Consistency. As explained in initiate version, the way this function to check
consistency is comparing all error element’s TargetVersion with its target element’s Version,
an inconsistency exists when there is a difference between them.
Fig 8.7 top_FT Version & top_FT_EMT TargetVersion
We use the same use case as above procedures, “top_FT” is the target element of
“top_FT_EMT”, the Error Model Type has a TargetVersion as “1” while the Function Type
holds a Version as “2.1” as shown in Fig 8.7. When user run Check Consistency at this time,
it shows both inconsistency error message and an inconsistency image on the error model side,
those are seen in Fig 8.8.
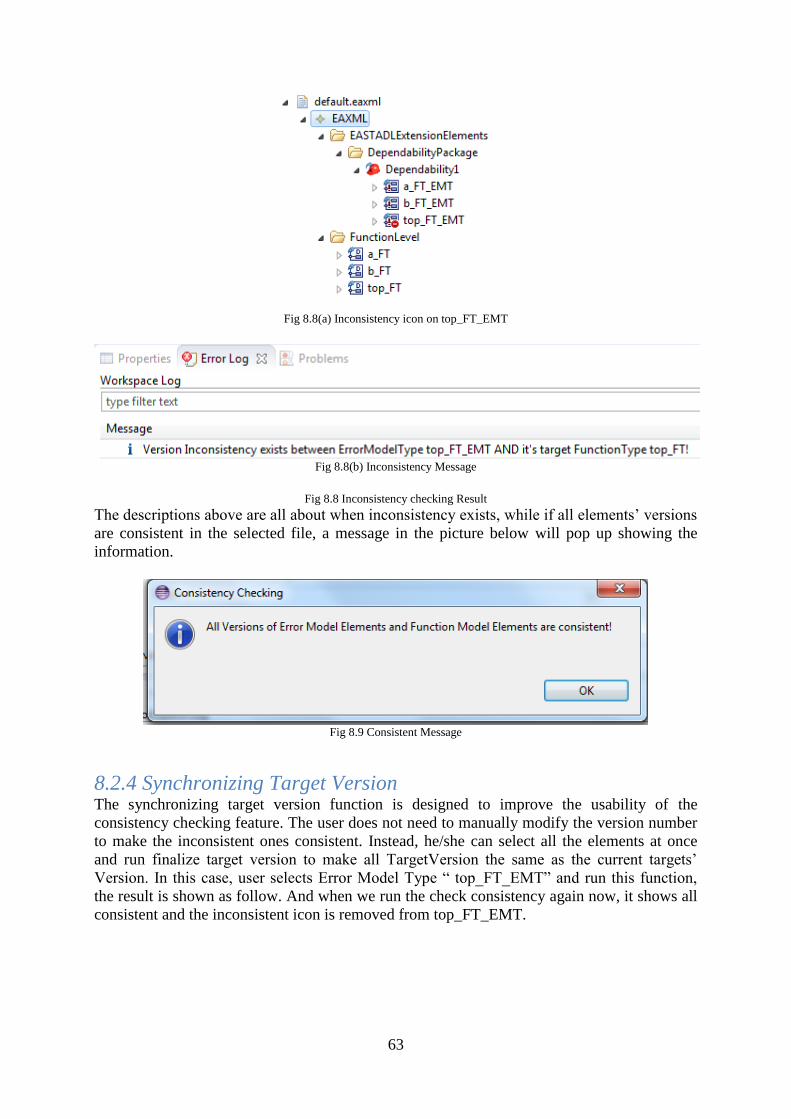
63
Fig 8.8(a) Inconsistency icon on top_FT_EMT
Fig 8.8(b) Inconsistency Message
Fig 8.8 Inconsistency checking Result
The descriptions above are all about when inconsistency exists, while if all elements’ versions
are consistent in the selected file, a message in the picture below will pop up showing the
information.
Fig 8.9 Consistent Message
8.2.4 Synchronizing Target Version The synchronizing target version function is designed to improve the usability of the
consistency checking feature. The user does not need to manually modify the version number
to make the inconsistent ones consistent. Instead, he/she can select all the elements at once
and run finalize target version to make all TargetVersion the same as the current targets’
Version. In this case, user selects Error Model Type “ top_FT_EMT” and run this function,
the result is shown as follow. And when we run the check consistency again now, it shows all
consistent and the inconsistent icon is removed from top_FT_EMT.
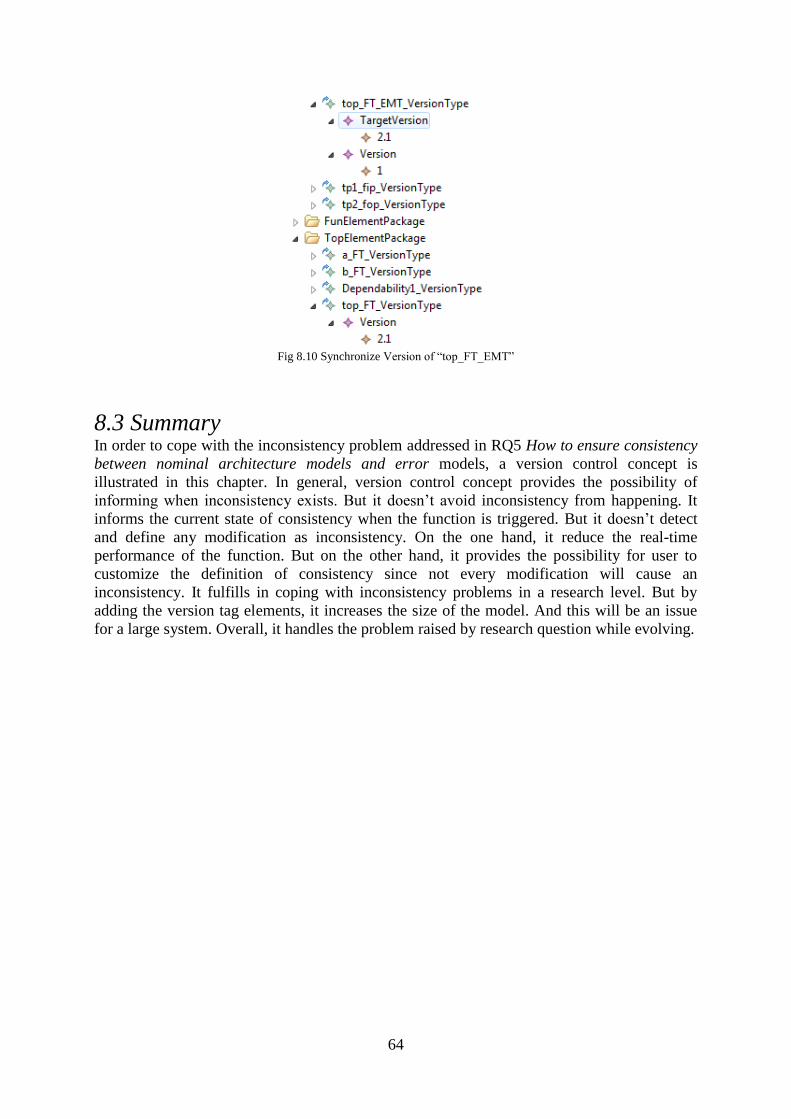
64
Fig 8.10 Synchronize Version of “top_FT_EMT”
8.3 Summary In order to cope with the inconsistency problem addressed in RQ5 How to ensure consistency
between nominal architecture models and error models, a version control concept is
illustrated in this chapter. In general, version control concept provides the possibility of
informing when inconsistency exists. But it doesn’t avoid inconsistency from happening. It
informs the current state of consistency when the function is triggered. But it doesn’t detect
and define any modification as inconsistency. On the one hand, it reduce the real-time
performance of the function. But on the other hand, it provides the possibility for user to
customize the definition of consistency since not every modification will cause an
inconsistency. It fulfills in coping with inconsistency problems in a research level. But by
adding the version tag elements, it increases the size of the model. And this will be an issue
for a large system. Overall, it handles the problem raised by research question while evolving.
65
Chapter 9 Evaluation
As specified in the concept of design research, design and development processes take a main
part of the whole research procedure and are responsible for generating the outcome. After the
outcome is established, it is important to evaluate the successfulness in order for later
modifying. At this point, different kinds of evaluation techniques, including observation,
interviewing and questionnaire are conducted.
The goal of the evaluation process in this research is to get the expert feedback for measuring
the successfulness of the current result. While, the success or failure of the outcome
knowledge and artifact cannot simply be evaluated in terms of how much it fulfill the
expected functionality. Carvalho, Alvaro and Azurem(Carvalho,Alvaro,Azurém 2012)
provide a validation criteria for measuring the outcome of a design research and it will be
applied in this research evaluation.
9.1 Evaluation Criteria In Carvalho, Alvaro and Azurems’ validation criteria, four general aspects of the outcome are
measured, which are artifact success, generalization, novelty and explanation capability.
Artifact success, as shown by name, is used for measuring whether the artifact is success or
not from usefulness, efficacy and efficiency. An unsuccessful artifact also has the value of
providing ways that are not worth of pursuing in later work. “Generalization” defines the
range of applicability for the outcome, so whether the applicability is restricted to specific
situations or universal is measured. “Novelty” indicates the improvements of the measured
outcome comparing with existing knowledge. The evaluation result of novelty are usually
phrased as: this outcome is better compare with before or this concept does not exist. The last
element “explanation capability” considers whether the designed objects are explained well
enough in the outcome description or not. And in this criterion, the best situation is the
outcome meets the designed expectation in general. Considering the diversity and
applicability of different works, detailed measurements for this research are provided as
follow.
9.1.1 Artifact success
Usefulness
Since the goal of this research is to improve the current working flows for safety engineers
and architecture engineers. The usefulness of the outcome is judged by those experts that
whether it solve or mitigate the current problems or not.
66
Efficacy
The efficacy is defined as the degree to which the artifacts achieve the expected results
(Carvalho,Alvaro,Azurém 2012). In this research, the efficacy is measured by comparing the
research questions, user expectation and the outcome functions as described above in this
section.
Efficiency
As specified in software quality standard metrics ISO-9126(Software Product Quality).
Efficiency is considered in both amount of time and resources. This measurement is done by
researcher. All the measured results are applied to the measurement algorithms provided in
ISO-9126.
9.1.2 Novelty & Explanation capability The novelty and explanation capability of the outcome is measured and evaluated through the
feedback from experts. The result of former measurement reflects the significance of the new
concept or knowledge revealed in this study. While the explanation capability is used to
measure the researcher’s capability of bringing ideas into practice and whether the designed
objects are well explained. Those two metrics focus on evaluating the knowledge aspect of a
study.
9.2 Data Collection Based on the thesis progress and outcomes, the data collection together with data analysis is
performed in two stages. The EAST-ADL and EATOP experts are involved in first stage and
the Safety engineers participate the second stage. There are several reasons to have two
evaluation stages. The first is in order to make sure everything goes on the right direction and
speed, an evaluation is needed in the mid of the thesis to judge the completed work and
reorder the later work. The second reason is time limitation, since it takes time to recruit
interviewees from two departments, we decided to separate those experts into two groups.
Besides, those two groups have different focuses, it also makes the data collection and
analysis easier to perform. According to this, the interviews in first stage lays emphasis on the
general process from nominal model to error model in EAST-ADL while the second focuses
more on the usability of the auto-generated Fault Tree through HiP-HOPS.
Table 9.1 Outcomes to be presented in different Interview Stages
Outcomes Stage 1 Stage 2
Auto-generating EAST-ADL nominal model from Simulink model Concept Concept
Auto-generating EAST-ADL error model out of existing nominal model Artifact Artifact
Re-patterning error model elements in EATOP Artifact Artifact
Use of HiP-HOPS for Fault Tree Analysis with EATOP Concept Artifact
Graphical representations for error model elements in EATOP Concept Concept
Version consistency checking between nominal model elements and
error model elements Artifact Artifact
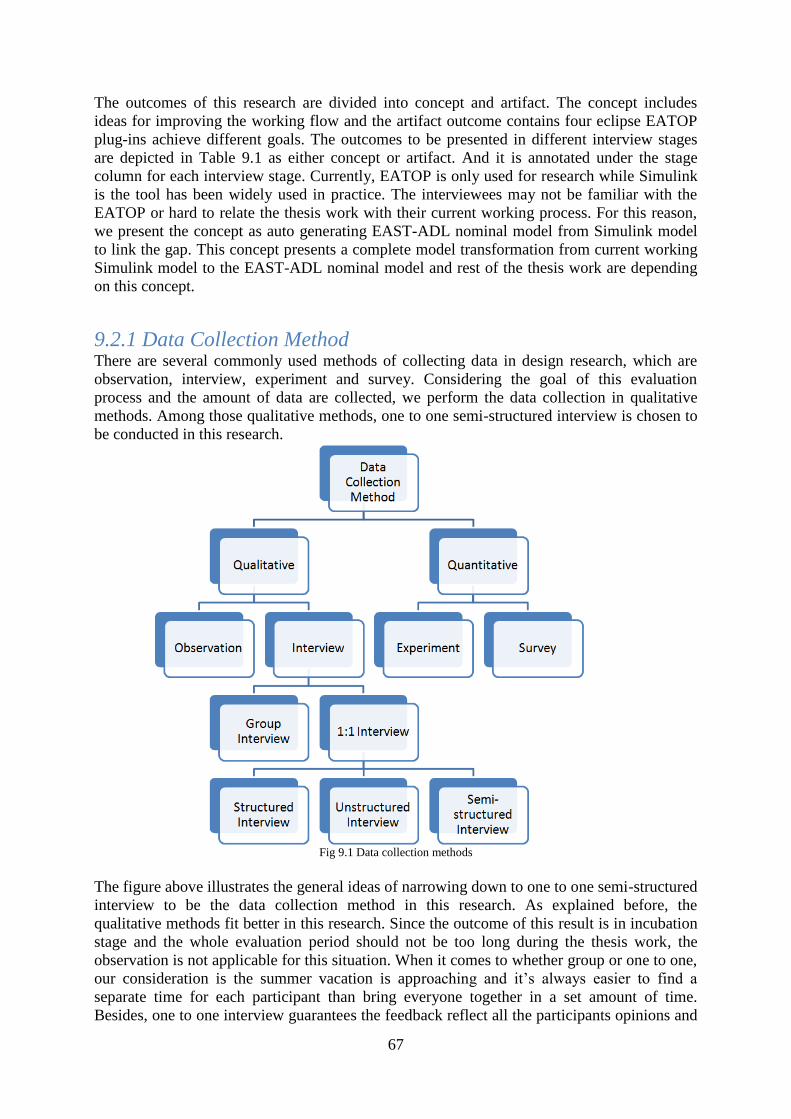
67
The outcomes of this research are divided into concept and artifact. The concept includes
ideas for improving the working flow and the artifact outcome contains four eclipse EATOP
plug-ins achieve different goals. The outcomes to be presented in different interview stages
are depicted in Table 9.1 as either concept or artifact. And it is annotated under the stage
column for each interview stage. Currently, EATOP is only used for research while Simulink
is the tool has been widely used in practice. The interviewees may not be familiar with the
EATOP or hard to relate the thesis work with their current working process. For this reason,
we present the concept as auto generating EAST-ADL nominal model from Simulink model
to link the gap. This concept presents a complete model transformation from current working
Simulink model to the EAST-ADL nominal model and rest of the thesis work are depending
on this concept.
9.2.1 Data Collection Method There are several commonly used methods of collecting data in design research, which are
observation, interview, experiment and survey. Considering the goal of this evaluation
process and the amount of data are collected, we perform the data collection in qualitative
methods. Among those qualitative methods, one to one semi-structured interview is chosen to
be conducted in this research.
Fig 9.1 Data collection methods
The figure above illustrates the general ideas of narrowing down to one to one semi-structured
interview to be the data collection method in this research. As explained before, the
qualitative methods fit better in this research. Since the outcome of this result is in incubation
stage and the whole evaluation period should not be too long during the thesis work, the
observation is not applicable for this situation. When it comes to whether group or one to one,
our consideration is the summer vacation is approaching and it’s always easier to find a
separate time for each participant than bring everyone together in a set amount of time.
Besides, one to one interview guarantees the feedback reflect all the participants opinions and
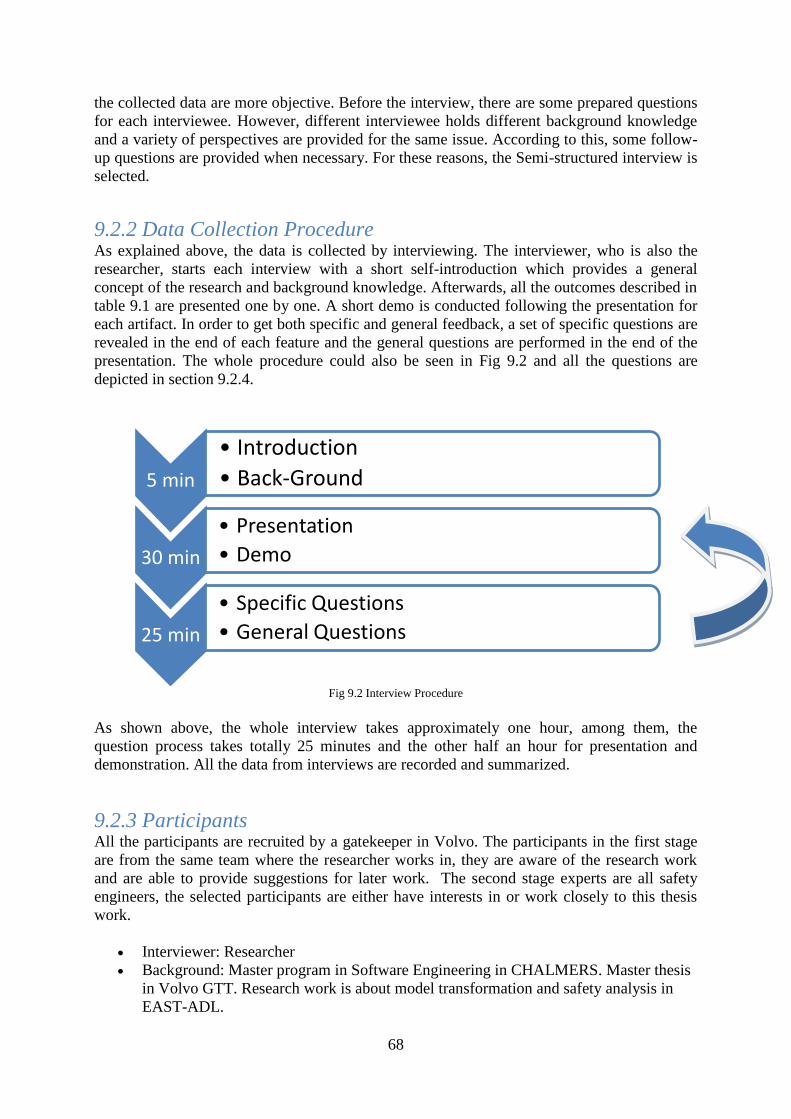
68
the collected data are more objective. Before the interview, there are some prepared questions
for each interviewee. However, different interviewee holds different background knowledge
and a variety of perspectives are provided for the same issue. According to this, some follow-
up questions are provided when necessary. For these reasons, the Semi-structured interview is
selected.
9.2.2 Data Collection Procedure As explained above, the data is collected by interviewing. The interviewer, who is also the
researcher, starts each interview with a short self-introduction which provides a general
concept of the research and background knowledge. Afterwards, all the outcomes described in
table 9.1 are presented one by one. A short demo is conducted following the presentation for
each artifact. In order to get both specific and general feedback, a set of specific questions are
revealed in the end of each feature and the general questions are performed in the end of the
presentation. The whole procedure could also be seen in Fig 9.2 and all the questions are
depicted in section 9.2.4.
Fig 9.2 Interview Procedure
As shown above, the whole interview takes approximately one hour, among them, the
question process takes totally 25 minutes and the other half an hour for presentation and
demonstration. All the data from interviews are recorded and summarized.
9.2.3 Participants All the participants are recruited by a gatekeeper in Volvo. The participants in the first stage
are from the same team where the researcher works in, they are aware of the research work
and are able to provide suggestions for later work. The second stage experts are all safety
engineers, the selected participants are either have interests in or work closely to this thesis
work.
Interviewer: Researcher
Background: Master program in Software Engineering in CHALMERS. Master thesis
in Volvo GTT. Research work is about model transformation and safety analysis in
EAST-ADL.
5 min
• Introduction
• Back-Ground
30 min
• Presentation
• Demo
25 min
• Specific Questions
• General Questions
69
Stage 1:
Interviewee A:
Background: Systems Engineer, Methods Expert
Interviewee B:
Background: Systems Engineer, Tools Expert
Interviewee C:
Background: Systems Engineer, Safety Expert
Interviewee D:
Background: Systems Engineer, Methods Expert
Stage 2:
Interviewee E:
Background: Interviewee E is a Product Quality Assurer. He is working with assessing
safety and quality of electrical and electronic functions by means of fault tree analysis,
failure modes and effects analysis, etc.
Interviewee F:
Background: Interviewee F is a Diagnostic Engineer. He is working on a daily basis
with modeling components and their error behavior, with the purpose of configuring
error detection systems for use in workshops and during operation.
Interviewee G:
Background: Interviewee G is Diagnostics and Logging Technology Strategy
responsible. He identifies and plans technology for detecting and recording errors as a
basis for error correction in the field and in workshops.
9.2.4 Questions Question, as an approach to get interviewee feedback, plays an important role in this data
collection. The predefined questions are listed as follow. The questions revealed during
interviews are recorded and depicted in data analysis section. In order to get a more
measureable data from the interviewees, several features are graded corresponds to the
evaluation criteria explained in section 9.1.
There are two kinds of questions among all outcomes corresponds to whether the presented
outcome is a completed feature or a concept. For each outcome, the artifact success is
measured by interviewees’ grading. In addition, the graded feature needs to be compared with
existing tools to get the benefits and drawbacks. What we care most is whether a feature or a
product is applicable for the current working process, and if not, why it doesn’t fit. Besides,
general questions in the end are more open, they are used to get the interviewees’ general
feeling about this thesis work and their opinions of any improvements are applicable for this
thesis or future work. The answers from interviewees are all valuable information to improve
the current research and inspire the future work.

70
Since the presented outcomes of the thesis work vary for different evaluation stages. Besides,
the focuses and interviewees’ background of the two evaluation stages are different. Not all
the questions are applicable for both stages. Some questions for the first evaluation stage are
modified, added or deleted in the second one. The numbers “① ②” in front of each question
indicate the evaluation stage the question is used for. In the second evaluation stage, no
questions are performed for the features Generating Nominal Model from Simulink and
Graphical Representation during the interview. The reason is that the participants in the
second evaluation are safety engineers, they have more knowledge on Error Propagation and
Fault Tree Analysis and also be able to provide more inputs in those two parts. Besides, some
questions about the implementation and later expectation are not applicable anymore since the
concept in the first stage evaluation are developed as artifacts in the second stage evaluation.
Question topic 1 : Generating Nominal Model from Simulink
• ① In your opinion, will this concept help the safety work?
• ① In order to get similar result, how the current working procedures look like for
you?
• ① Is it necessary to bring this concept into reality? If not, why?
Question topic 2: Error Model Auto Generation
• ①② On a scale of 1 to 5, with 1 being poor and 5 being excellent, how satisfied are
you with this product in terms of the following? And please specify the reason.
– Ease of Use
– Ease of Understanding(description)
– How well the product achieves its goal
• ①② Is there any other product you know has a similar feature?
– If yes, how does it work in this category? And compare with the presented
artifact, what are the advantages and disadvantages?
– If no, how satisfied are you with this product? Any improvements or
suggestions?
• ①② Is this applicable for the current development process in your opinion? If not,
what are the missing parts?
Question topic 3: Re-organize Error Model
• ①② On a scale of 1 to 5, with 1 being poor and 5 being excellent, how satisfied are
you with this product in terms of the following? And please specify the reason.
– Ease of Use
– Ease of Understanding(description)
– How well the product achieves its goal
• ①② Is this applicable for the current development process in your opinion? In not,
what are the missing parts?
• ①② Any other manually done modifications you think is necessary to be automated?
Question topic 4: HiP-HOPS Fault Tree Analysis
• ①② In your opinion, will this concept help the safety work? How?
• ①② Is there anything you think is missing in the design or need to improve?
• ② On a scale of 1 to 5, with 1 being poor and 5 being excellent, how satisfied are
you with this product in terms of the following? And please specify the reason.
– Ease of Use
– Ease of Understanding(description)

71
– How well the product achieves its goal
Question topic 5: Graphical Representation
• ① In your opinion, does anything missing in the design?
• ① Is a graphical editor needed in order to understand the previous result and
relations?
Question topic 6: Consistency Checking
• ①② On a scale of 1 to 5, with 1 being poor and 5 being excellent, how satisfied are
you with this product in terms of the following? And please specify the reason.
– Ease of Use
– Ease of Understanding(description)
– How well the product achieves its goal
• ① What do you think by using the user attribute to record the version? For feature
“Increase Version”
• ①② Is there any other product you know has a similar feature?
– If yes, how does it work in this category? And compare with the presented
artifact, what are the advantages and disadvantages?
– If no, how satisfied are you with this product? Any improvements or
suggestions?
• ①② Is this applicable for the current development process in your opinion? In not,
what are the missing parts?
• ② What do you think about this way of handling version control?
Question topic 1 is used to provide a background knowledge to bridge the gap between the
current working knowledge and the technology developed in this research. Except topic 1,
each question topic aims to solve one or several research questions. Question topic 2 aims to
solve RQ1 which is How to efficiently define an error propagation model from architecture
model? And RQ2 How to reduce the manual work in refactoring the model? is addressed in
question topic 3. Hip-HOPS Fault Tree Analysis in question topic 4 aims to solve RQ3, which
is How to apply Fault Tree Analysis on EAST-ADL error model and relate the generated
Fault Tree result with the model? And RQ4 How to visualize the error propagation model
together with architecture model? is covered in Question topic 5. Consistency Checking
stated in Question topic 6 allows to collect feedbacks to answer RQ 5 How to ensure
consistency between nominal architecture models and error models?
After all the RQs are addressed and features are presented, several general questions are
performed in the end of each interview. The purpose of the general questions is getting a
whole picture of the thesis work from the interviewees’ point of view. Besides, this is also a
step for the interviewee to order and prioritize the later work and provide any additional ideas
they think are related and effect future work.
Question topic 7: General
• ① Pritorize the concept to be implementated(Importance)
– Concistency Checking
• Increase Version
– HiP-HOPS FTA
• Generating .hipxml in EATOP by clicking generating button
• Showing the Fault Tree and Cut sets result in eclipse instead of a web
browser
72
• Marking the cut sets on the model tree
• Save the generated files in a path decided by user
– Graphical Representation
• Showing a view of the error modeling and function modeling element
• Showing the target relation between error and function model
• ① Improvements for short/long term
• ② General feeling of this thesis work
• ② Future expectation
9.3 Data Analysis As a way of deriving conclusion from the collected data, data analysis is carried out in parallel
with data collection in order to adjust and improve later design and implementation process
(Runeson, Höst 2009). Commonly used qualitative data analysis methods are generation of
theory and confirmation of theory (Seaman 1999). Generation of theory is intend to find
theory or hypotheses from the collected data while confirmation of theory is applied to
confirm a predefined hypothesis is true or not. Since several experts opinions are reflected in
the design and implementation, some hypothesis are highly predictable. In this case,
confirmation of theory is selected as the data analysis method in this evaluation.
9.3.1 Hypotheses The hypotheses are mostly generated according to the research questions. The purpose of
these hypotheses is to predict the feedbacks of the interviews and narrow them to a more
structured conclusion. Each of the hypothesis corresponds to one or several research questions
and one general hypothesis in the end indicating the acceptableness of the thesis work.
Hypothesis 2 refers to RQ 1 and hypothesis 3 relate with RQ1 and RQ2. Hypothesis 4
corresponds to RQ3 while hypothesis 5 states the importance of RQ5. RQ4 is related with
hypothesis 6. There is no question about the last hypothesis, but it will be validated by
checking the confirmed rate of all hypotheses and the average score in evaluation criteria.
Since confirmation of the theory is selected as the analysis method, after all feedbacks are
collected, there will be a section in the end drawing the conclusion and confirm the
hypotheses.
1. The transformation between Simulink and EATOP is a must in future work
2. Error model generation feature is easy to use and understand. There is no existing tool
which has a similar function.
3. Error model generation and reorganization will be useful for future work
4. Integrating HiP-HOPS to EATOP will enhance the usability of EATOP when applying
Fault Tree Analysis
5. The consistency checking is quite necessary for both architecture design and safety
analysis.
6. Graphical Representation is the most important feature to be implemented and it makes
the modeling in EATOP much easier to work with.
7. The whole thesis research is acceptable in general. (On a scale of 1 to 5, with 1 being
poor and 5 being excellent, if the overall average scale is more than 3, it is regarded as
acceptable.)

73
9.3.2 Data analysis framework As a research study, the outcomes will not directly affect the current work. So the goal of this
evaluation is to know whether this study provides a better understanding and improvements
for later work. Besides, the feedbacks we are collecting are mostly about whether the outcome
is acceptable and improvements for this study, the terms are mentioned by the interviewee are
limited and mostly predictable. A summary for each topic is concluded and compared. As
illustrated in Fig 9.3, the whole evaluation is a bottom-up procedure. The acceptableness is
measured through summaries and conclusions. The summary is derived from the feedback for
each question and the hypothesis is concluded from all summaries. The acceptableness also
reflects whether the hypotheses are confirmed or not.
Fig 9.3 Data Analysis Framework
9.3.3 Summary of interview findings For each topic, a list of transcripts from each interviewee is presented. Those transcripts have
been rephrased by the interviewer without changing the meaning of interviewees’ statements.
All the questions for both evaluation stages are listed at the beginning of each feature with the
applicable stage numbers and the transcripts are divided into each interviewee, the number of
answered question are listed at the beginning of each answer. A summary is summarized from
74
those transcripts in the end of each topic and these summaries are the basis of later hypothesis
confirmation.
Question topic 1: Generating Nominal Model from Simulink
1. ① In your opinion, will this concept help the safety work?
2. ① In order to get similar result, how the current working procedures look like for
you?
3. ① Is it necessary to bring this concept into reality? If not, why?
Interviewee A:
1. This concept will enhance the model traceability in general. There should be some standard
to support this transformation.
2 & 3. As far as I know, there is no similar features like that, but we do have some tools could
work for the other way around, from EAST-ADL model to Simulink. But I guess, this is quite
hard to do, especially difficult to integrate for the whole truck. So it’s not so necessary.
Interviewee B:
1. This concept could help the safety work, but there are still several steps to take.
2. There is no existing EATOP plugin does this function. As I remember, Meta Edit may have
something similar.
3. It’s hard to say whether it’s necessary or not, since it will change the way we work.
Interviewee C:
1. It makes EAST-ADL easier to work with, but the question is how? How to relate those two
models.
2. As far as I know, there is no such tool doing this work.
3. Isn’t the final goal of the safety work is to generate Fault Tree. HiP-HOPs already supports
the Simulink model, so why we would take more effort to get the same result. While, anyway,
I think this is a good idea in general.
Interviewee D:
1. It’s hard to say whether it would help or not, but I would guess it would influence the future
work. And it depends on how it would be implemented.
2. I’m not so familiar with this area actually, there is no such tool from my experience
3. I couldn’t tell whether it’s necessary or not to bring this concept into reality.
Summary:
The generating nominal model from Simulink would make EAST-ADL easier to understand
and work with. But it may not be necessary to be implemented since how much it would
affect the later work is still unknown and how to relate those two models would be a big
challenge.
Question topic 2: Error Model Auto-generation
1. ①② On a scale of 1 to 5, with 1 being poor and 5 being excellent, how satisfied are
you with this product in terms of the following? And please specify the reason.
a. Ease of Use
b. Ease of Understanding(description)
c. How well the product achieves its goal

75
2. ①② Is there any other product you know has a similar feature?
a. If yes, how does it work in this category? And compare with the presented
artifact, what are the advantages and disadvantages?
b. If no, how satisfied are you with this product? Any improvements or
suggestions?
3. ①② Is this applicable for the current development process in your opinion? If not,
what are the missing parts?
Table 9.2 List of results for Error Model AutoGeneration Question 1(Itve. Short for Interviewee)
Itve. A Itve. B Itve. C Itve. D Itve. E Itve. F Itve. G
Ease of Use 5 4 4 4 4 4 3
Ease of Understanding 5 5 4 4 4 4 3
Achieving its Goal 4 4 4 5 4 4 3
Interviewee A:
2. No, there is no such tool does the error model generation. If what I understand correctly,
this nominal model and error model do not handle the model behavior, so it would be good to
have some kind of skeleton to contain the model behavior.
3. It should be a part of development process in the future.
Interviewee B:
2. Yes, there are error model tools existing, but I’m not sure whether it has this feature. For
this case which you have been implemented, I think it would be good to have a progress bar
when generating, this may not be necessary for a small model, but when it comes to the whole
truck, the user need something to indicate this is working and how much left. Besides, it
would be good to contain the model behavior which is similar as the ones in Simulink. But of
course, this would be a big project to do, I just provide some ideas for future work.
3. It would be quite useful if also takes the memory consumption and big models into
consideration.
Interviewee C:
1. I’m not so familiar with this tool, so I could only measure it and give suggestions depends
on the first impression.
2. I don’t know if there is any other product has a similar feature. One thing I think would
make it more understandable for me is adding Internal Fault for each Error Model Type.
Interviewee D:
1. Everything looks fine for me. It’s easy to use by clicking one button and easy to understand
from your explanation. And it does what the requirement says.
2. But it would be better to have a graphical view showing the different models. Besides, I
have no other comments.
Interviewee E:
1. It’s not too difficult to use and learn. The description is understandable and yes, achieve its
goal, so give it a 4 for each of them
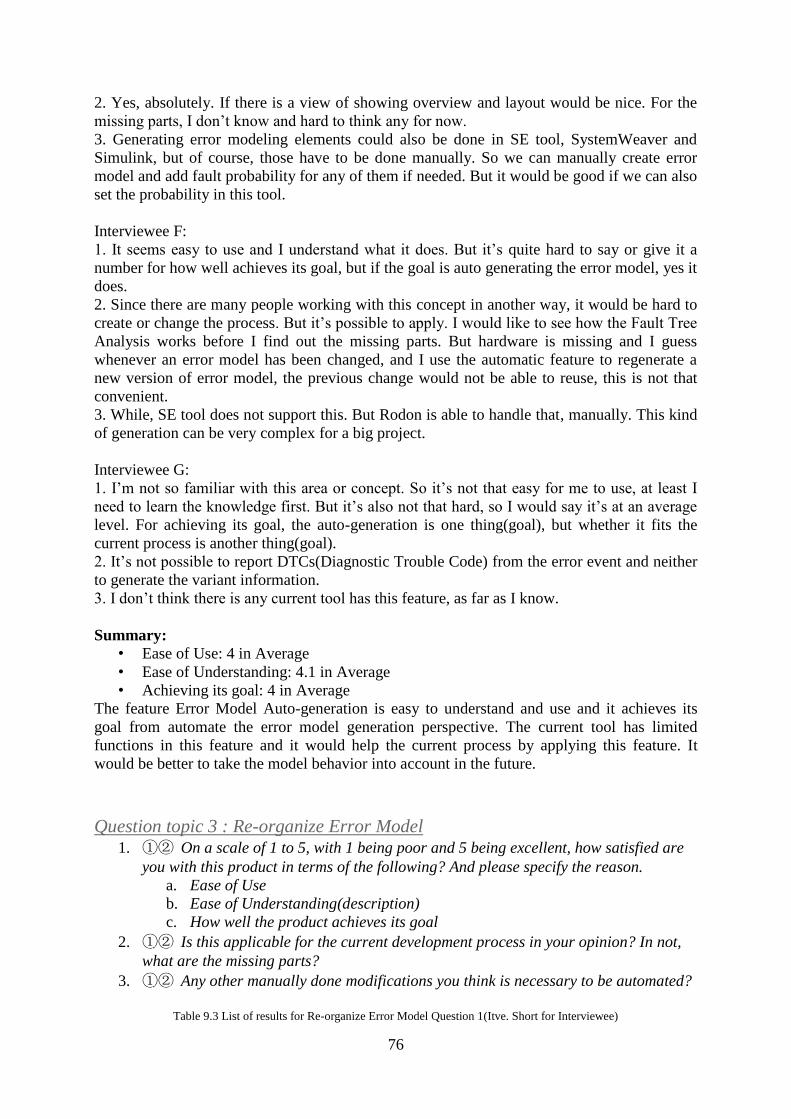
76
2. Yes, absolutely. If there is a view of showing overview and layout would be nice. For the
missing parts, I don’t know and hard to think any for now.
3. Generating error modeling elements could also be done in SE tool, SystemWeaver and
Simulink, but of course, those have to be done manually. So we can manually create error
model and add fault probability for any of them if needed. But it would be good if we can also
set the probability in this tool.
Interviewee F:
1. It seems easy to use and I understand what it does. But it’s quite hard to say or give it a
number for how well achieves its goal, but if the goal is auto generating the error model, yes it
does.
2. Since there are many people working with this concept in another way, it would be hard to
create or change the process. But it’s possible to apply. I would like to see how the Fault Tree
Analysis works before I find out the missing parts. But hardware is missing and I guess
whenever an error model has been changed, and I use the automatic feature to regenerate a
new version of error model, the previous change would not be able to reuse, this is not that
convenient.
3. While, SE tool does not support this. But Rodon is able to handle that, manually. This kind
of generation can be very complex for a big project.
Interviewee G:
1. I’m not so familiar with this area or concept. So it’s not that easy for me to use, at least I
need to learn the knowledge first. But it’s also not that hard, so I would say it’s at an average
level. For achieving its goal, the auto-generation is one thing(goal), but whether it fits the
current process is another thing(goal).
2. It’s not possible to report DTCs(Diagnostic Trouble Code) from the error event and neither
to generate the variant information.
3. I don’t think there is any current tool has this feature, as far as I know.
Summary:
• Ease of Use: 4 in Average
• Ease of Understanding: 4.1 in Average
• Achieving its goal: 4 in Average
The feature Error Model Auto-generation is easy to understand and use and it achieves its
goal from automate the error model generation perspective. The current tool has limited
functions in this feature and it would help the current process by applying this feature. It
would be better to take the model behavior into account in the future.
Question topic 3 : Re-organize Error Model 1. ①② On a scale of 1 to 5, with 1 being poor and 5 being excellent, how satisfied are
you with this product in terms of the following? And please specify the reason.
a. Ease of Use
b. Ease of Understanding(description)
c. How well the product achieves its goal
2. ①② Is this applicable for the current development process in your opinion? In not,
what are the missing parts?
3. ①② Any other manually done modifications you think is necessary to be automated?
Table 9.3 List of results for Re-organize Error Model Question 1(Itve. Short for Interviewee)
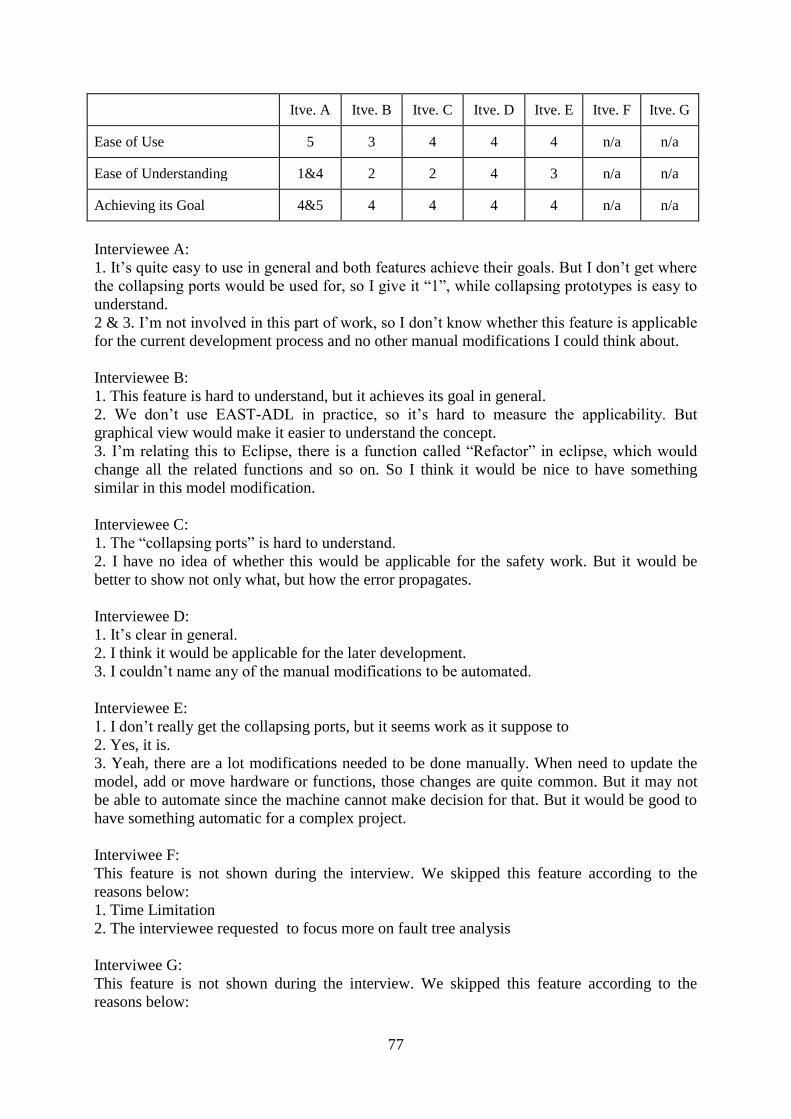
77
Itve. A Itve. B Itve. C Itve. D Itve. E Itve. F Itve. G
Ease of Use 5 3 4 4 4 n/a n/a
Ease of Understanding 1&4 2 2 4 3 n/a n/a
Achieving its Goal 4&5 4 4 4 4 n/a n/a
Interviewee A:
1. It’s quite easy to use in general and both features achieve their goals. But I don’t get where
the collapsing ports would be used for, so I give it “1”, while collapsing prototypes is easy to
understand.
2 & 3. I’m not involved in this part of work, so I don’t know whether this feature is applicable
for the current development process and no other manual modifications I could think about.
Interviewee B:
1. This feature is hard to understand, but it achieves its goal in general.
2. We don’t use EAST-ADL in practice, so it’s hard to measure the applicability. But
graphical view would make it easier to understand the concept.
3. I’m relating this to Eclipse, there is a function called “Refactor” in eclipse, which would
change all the related functions and so on. So I think it would be nice to have something
similar in this model modification.
Interviewee C:
1. The “collapsing ports” is hard to understand.
2. I have no idea of whether this would be applicable for the safety work. But it would be
better to show not only what, but how the error propagates.
Interviewee D:
1. It’s clear in general.
2. I think it would be applicable for the later development.
3. I couldn’t name any of the manual modifications to be automated.
Interviewee E:
1. I don’t really get the collapsing ports, but it seems work as it suppose to
2. Yes, it is.
3. Yeah, there are a lot modifications needed to be done manually. When need to update the
model, add or move hardware or functions, those changes are quite common. But it may not
be able to automate since the machine cannot make decision for that. But it would be good to
have something automatic for a complex project.
Interviwee F:
This feature is not shown during the interview. We skipped this feature according to the
reasons below:
1. Time Limitation
2. The interviewee requested to focus more on fault tree analysis
Interviwee G:
This feature is not shown during the interview. We skipped this feature according to the
reasons below:
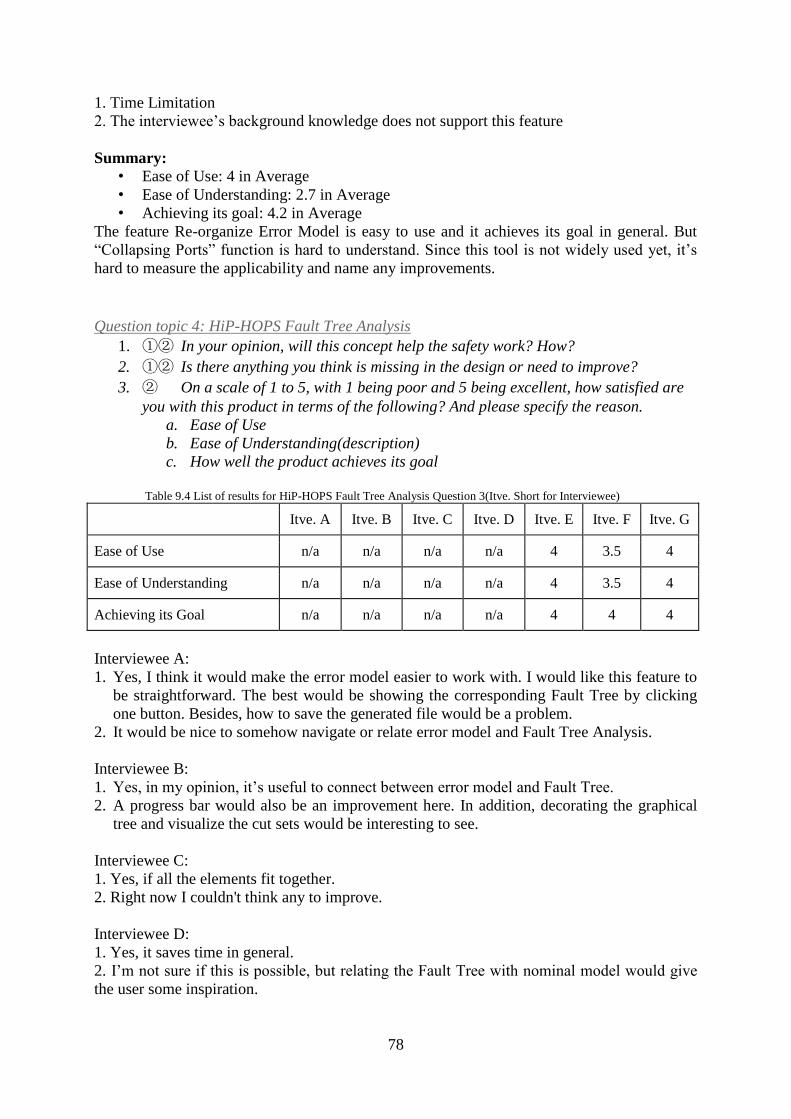
78
1. Time Limitation
2. The interviewee’s background knowledge does not support this feature
Summary:
• Ease of Use: 4 in Average
• Ease of Understanding: 2.7 in Average
• Achieving its goal: 4.2 in Average
The feature Re-organize Error Model is easy to use and it achieves its goal in general. But
“Collapsing Ports” function is hard to understand. Since this tool is not widely used yet, it’s
hard to measure the applicability and name any improvements.
Question topic 4: HiP-HOPS Fault Tree Analysis
1. ①② In your opinion, will this concept help the safety work? How?
2. ①② Is there anything you think is missing in the design or need to improve?
3. ② On a scale of 1 to 5, with 1 being poor and 5 being excellent, how satisfied are
you with this product in terms of the following? And please specify the reason.
a. Ease of Use
b. Ease of Understanding(description)
c. How well the product achieves its goal
Table 9.4 List of results for HiP-HOPS Fault Tree Analysis Question 3(Itve. Short for Interviewee)
Itve. A Itve. B Itve. C Itve. D Itve. E Itve. F Itve. G
Ease of Use n/a n/a n/a n/a 4 3.5 4
Ease of Understanding n/a n/a n/a n/a 4 3.5 4
Achieving its Goal n/a n/a n/a n/a 4 4 4
Interviewee A:
1. Yes, I think it would make the error model easier to work with. I would like this feature to
be straightforward. The best would be showing the corresponding Fault Tree by clicking
one button. Besides, how to save the generated file would be a problem.
2. It would be nice to somehow navigate or relate error model and Fault Tree Analysis.
Interviewee B:
1. Yes, in my opinion, it’s useful to connect between error model and Fault Tree.
2. A progress bar would also be an improvement here. In addition, decorating the graphical
tree and visualize the cut sets would be interesting to see.
Interviewee C:
1. Yes, if all the elements fit together.
2. Right now I couldn't think any to improve.
Interviewee D:
1. Yes, it saves time in general.
2. I’m not sure if this is possible, but relating the Fault Tree with nominal model would give
the user some inspiration.

79
Interviewee E:
1. Definitely! Showing the minimal cutsets is good and it’s actually better than the tool we use
today since it brings the fault tree analysis and the model designing and modification to the
same tool.
2. I don’t know if anything is needed to improve. But it’s really good to have this picture and
it helps to understand the error propagation and improve the current working process.
Interviewee F:
1. This concept will help for sure. We have problems in current working, for example, timing
issue is hard to catch from FTA, so it would be great help if it does help to find those kind of
problems.
2. Still the probability issue, the error logic for severability of each error.
3. This feature is easy to use, but setting the logic probability is hard to achieve. But it
achieves its goal quite well.
Interviewee G:
1. There are two perspectives I consider in safety work, one is hardware and one is logic. So it
helps the safety work from the logic way. It’s always hard to get everything in one tool, this
tool makes it better at this point.
2. It would be good to provide suggestions and improvements to the system. Something like
optimizer provides the optimization solution for the system.
Summary:
• Ease of Use: 3.8 in Average
• Ease of Understanding: 3.8 in Average
• Achieving its goal: 4 in Average
The HiP-HOPS Fault Tree Analysis is a useful feature to be integrated into EATOP. It’s an
improvement to bring the fault tree analysis and the model designing and modification to the
same tool.
Question topic 5: Graphical Representation
1. ① In your opinion, does anything missing in the design?
2. ① Is a graphical editor needed in order to understand the previous result and
relations?
Interviewee A:
1. In my opinion, it would be better to highlight the corresponding element in the tree view
when clicking its graphical representation. Otherwise, it seems good enough.
2. Well, this graphical editor may not help too much for understanding since it is clear enough
from the tree view and it requires quite a lot work, but it would make the modeling better to
work with.
Interviewee B:
1. The connection between the graphical view and the tree view is a weak part here.
2. Yes, it’s necessary to have this graphical view to support the manual work. But consider the
working effort needed in this, bring a better design is more important for a thesis work.
Interviewee C:
1. Nothing missing as what I can think about.

80
2. It is quite important, at least for me, to understand the models and relations.
Interviewee D:
1. Showing the failures would be good to relate this with the previous Fault Tree Analysis.
Besides, provide different colours for different elements or properties would be a plus for user
to understand.
2. This graphical view is pretty much needed from my point of view.
Summary:
Graphical Representation is highly needed for easy understanding. But considering the work
requires for graphical editor, it would be good to bring a concept for future work.
Question topic 6 : Consistency Checking
1. ①② On a scale of 1 to 5, with 1 being poor and 5 being excellent, how satisfied are
you with this product in terms of the following? And please specify the reason.
a. Ease of Use
b. Ease of Understanding(description)
c. How well the product achieves its goal
2. ① What do you think by using the user attribute to record the version? For feature
“Increase Version”
3. ①② Is there any other product you know has a similar feature?
a. If yes, how does it work in this category? And compare with the presented
artifact, what are the advantages and disadvantages?
b. If no, how satisfied are you with this product? Any improvements or
suggestions?
4. ①② Is this applicable for the current development process in your opinion? If not,
what are the missing parts?
5. ② What do you think about this way of handling version control?
Table 9.5 List of results for Consistency Checking Question 1 (Itve. Short for Interviewee)
Itve. A Itve. B Itve. C Itve. D Itve. E Itve. F Itve. G
Ease of Use 3 3 5 4 4 4 4
Ease of Understanding 4 4 4 4 4 4 4
Achieving its Goal 4 3 4 4 4 4 4
Interviewee A:
1. There are several procedures needed in order to check the consistency, so not so easy to use
for me at least. But easy to understand and do achieve its goal.
2. By using user attribute to set the version is quite clear.
3. “SE tool” which is a customized version of SystemWeaver has something to check the
version. So inspired from this, it would be good to be able to check the history of versions.
4. The version control is definitely applicable for the current work and it is always a big issue
to handle.
Interviewee B:

81
2. From what I understand, it may have time consuming issue when comes to a big model and
the set version procedure is a little bit too manual.
3. There are lots of tools are doing the version control. I would like to get a warning message
says “Changes happen in element X”, for example, when X has been changed, and ask the
user whether you would like to increase the version or not. So it’s like auto-updating version.
Interviewee C:
1. It seems easy to use and easy to understand.
2. I have no opinion about using this user attribute element to record the version.
3. “SE tool”, as I know, has the version control function.
4. Yes, this feature is useful everywhere and highly needed.
Interviewee D:
1. Works well for me in general.
2. Using this way to set version is easy to understand and seems easy to control.
3. In SE tools, there are several working stages which control the version, there are working
stages, frozen stage and release stage. In working stage, the version could be modified, but
when it comes to the frozen stage, everything should be freezed, but it’s possible to unfreeze
it to working stage. The last stage is release, at this level, everything should be settled and no
more changes are needed.
4. I’m sure the version control feature would be quite useful for later work, but this is a big
issue to manage.
Interviewee E:
3. SE tool can do the version control, but not in this way. The part is different or I would say
which is missing here is checking more detailed information in the version control, for
example, check if the calibration, connections have been changed.
4. Yes, this way is good and applicable.
Interviewee F:
3. Other tools have similar features, but not for this propose. For example, Rodon also does
version control.
4. Very applicable
Interviewee G:
3. I’m not involved in this area, so I’m not aware of any tools with this feature
4. Yes, I would say it is applicable in many areas
4. It’s a good way of doing it for me, easy to understand.
Summary:
• Ease of Use: 3.9 in Average
• Ease of Understanding: 4 in Average
• Achieving its goal: 3.9 in Average
Checking the consistency is a common feature for most of the work and it is highly needed.
The way of checking the consistency between nominal model and error model is easy to
understand and well achieve its goal. But it requires a little bit more procedures to do. Among
all the current tools, SE tool has been mentioned as a good example of handling consistency
by version control.
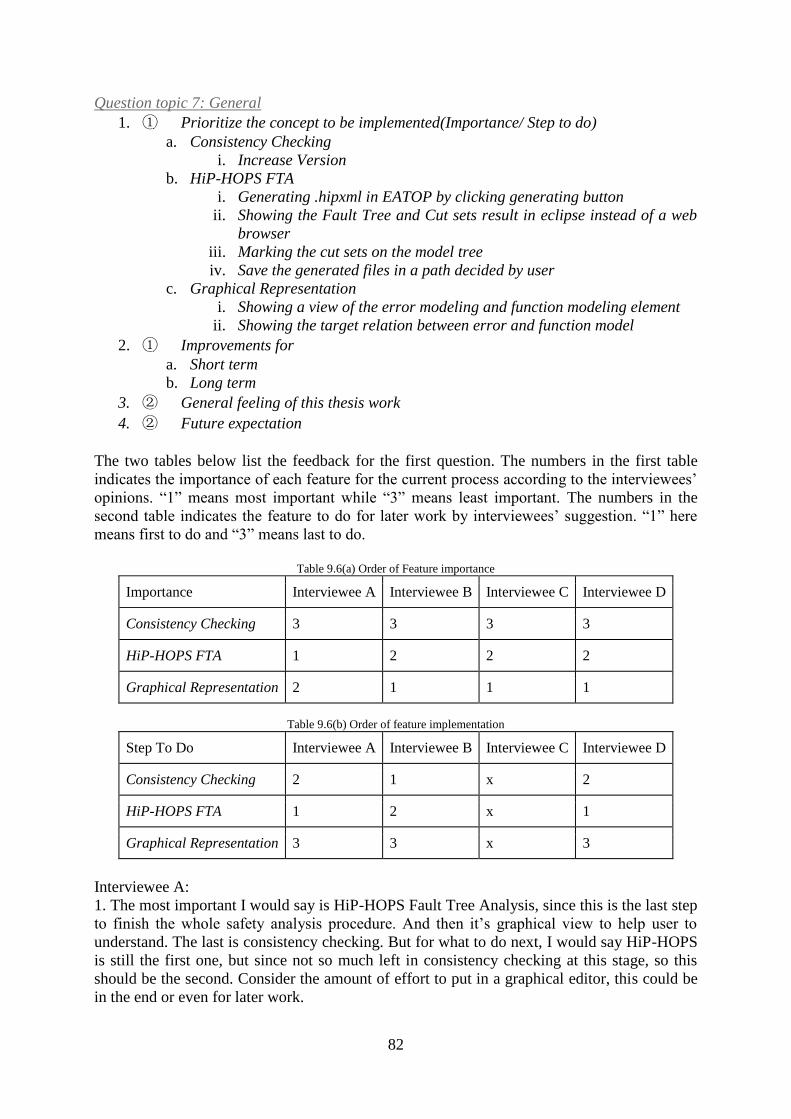
82
Question topic 7: General
1. ① Prioritize the concept to be implemented(Importance/ Step to do)
a. Consistency Checking
i. Increase Version
b. HiP-HOPS FTA
i. Generating .hipxml in EATOP by clicking generating button
ii. Showing the Fault Tree and Cut sets result in eclipse instead of a web
browser
iii. Marking the cut sets on the model tree
iv. Save the generated files in a path decided by user
c. Graphical Representation
i. Showing a view of the error modeling and function modeling element
ii. Showing the target relation between error and function model
2. ① Improvements for
a. Short term
b. Long term
3. ② General feeling of this thesis work
4. ② Future expectation
The two tables below list the feedback for the first question. The numbers in the first table
indicates the importance of each feature for the current process according to the interviewees’
opinions. “1” means most important while “3” means least important. The numbers in the
second table indicates the feature to do for later work by interviewees’ suggestion. “1” here
means first to do and “3” means last to do.
Table 9.6(a) Order of Feature importance
Importance Interviewee A Interviewee B Interviewee C Interviewee D
Consistency Checking 3 3 3 3
HiP-HOPS FTA 1 2 2 2
Graphical Representation 2 1 1 1
Table 9.6(b) Order of feature implementation
Step To Do Interviewee A Interviewee B Interviewee C Interviewee D
Consistency Checking 2 1 x 2
HiP-HOPS FTA 1 2 x 1
Graphical Representation 3 3 x 3
Interviewee A:
1. The most important I would say is HiP-HOPS Fault Tree Analysis, since this is the last step
to finish the whole safety analysis procedure. And then it’s graphical view to help user to
understand. The last is consistency checking. But for what to do next, I would say HiP-HOPS
is still the first one, but since not so much left in consistency checking at this stage, so this
should be the second. Consider the amount of effort to put in a graphical editor, this could be
in the end or even for later work.
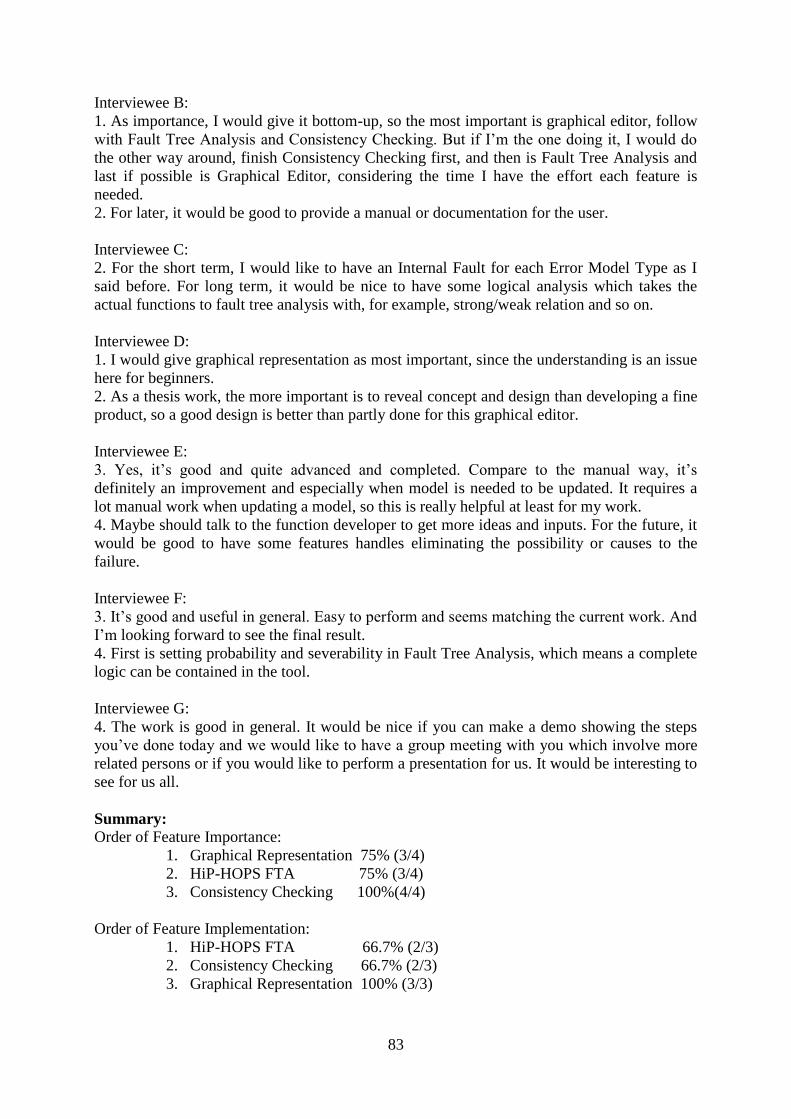
83
Interviewee B:
1. As importance, I would give it bottom-up, so the most important is graphical editor, follow
with Fault Tree Analysis and Consistency Checking. But if I’m the one doing it, I would do
the other way around, finish Consistency Checking first, and then is Fault Tree Analysis and
last if possible is Graphical Editor, considering the time I have the effort each feature is
needed.
2. For later, it would be good to provide a manual or documentation for the user.
Interviewee C:
2. For the short term, I would like to have an Internal Fault for each Error Model Type as I
said before. For long term, it would be nice to have some logical analysis which takes the
actual functions to fault tree analysis with, for example, strong/weak relation and so on.
Interviewee D:
1. I would give graphical representation as most important, since the understanding is an issue
here for beginners.
2. As a thesis work, the more important is to reveal concept and design than developing a fine
product, so a good design is better than partly done for this graphical editor.
Interviewee E:
3. Yes, it’s good and quite advanced and completed. Compare to the manual way, it’s
definitely an improvement and especially when model is needed to be updated. It requires a
lot manual work when updating a model, so this is really helpful at least for my work.
4. Maybe should talk to the function developer to get more ideas and inputs. For the future, it
would be good to have some features handles eliminating the possibility or causes to the
failure.
Interviewee F:
3. It’s good and useful in general. Easy to perform and seems matching the current work. And
I’m looking forward to see the final result.
4. First is setting probability and severability in Fault Tree Analysis, which means a complete
logic can be contained in the tool.
Interviewee G:
4. The work is good in general. It would be nice if you can make a demo showing the steps
you’ve done today and we would like to have a group meeting with you which involve more
related persons or if you would like to perform a presentation for us. It would be interesting to
see for us all.
Summary:
Order of Feature Importance:
1. Graphical Representation 75% (3/4)
2. HiP-HOPS FTA 75% (3/4)
3. Consistency Checking 100%(4/4)
Order of Feature Implementation:
1. HiP-HOPS FTA 66.7% (2/3)
2. Consistency Checking 66.7% (2/3)
3. Graphical Representation 100% (3/3)
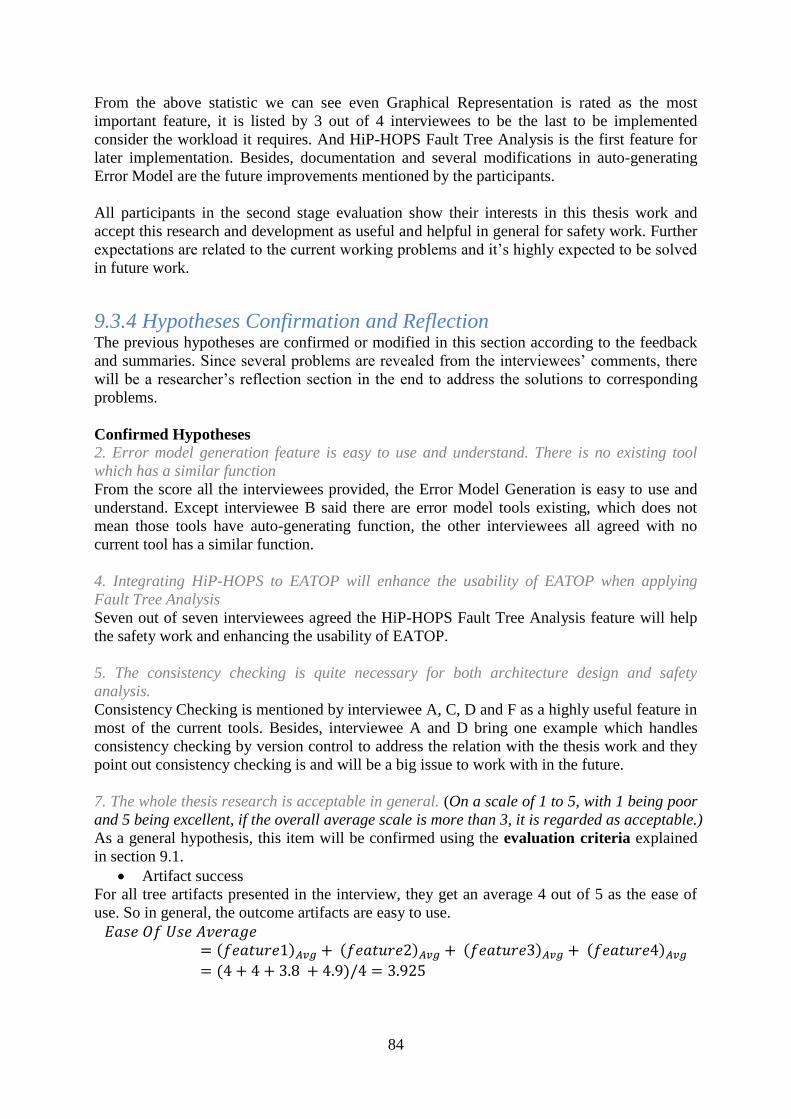
84
From the above statistic we can see even Graphical Representation is rated as the most
important feature, it is listed by 3 out of 4 interviewees to be the last to be implemented
consider the workload it requires. And HiP-HOPS Fault Tree Analysis is the first feature for
later implementation. Besides, documentation and several modifications in auto-generating
Error Model are the future improvements mentioned by the participants.
All participants in the second stage evaluation show their interests in this thesis work and
accept this research and development as useful and helpful in general for safety work. Further
expectations are related to the current working problems and it’s highly expected to be solved
in future work.
9.3.4 Hypotheses Confirmation and Reflection The previous hypotheses are confirmed or modified in this section according to the feedback
and summaries. Since several problems are revealed from the interviewees’ comments, there
will be a researcher’s reflection section in the end to address the solutions to corresponding
problems.
Confirmed Hypotheses
2. Error model generation feature is easy to use and understand. There is no existing tool
which has a similar function
From the score all the interviewees provided, the Error Model Generation is easy to use and
understand. Except interviewee B said there are error model tools existing, which does not
mean those tools have auto-generating function, the other interviewees all agreed with no
current tool has a similar function.
4. Integrating HiP-HOPS to EATOP will enhance the usability of EATOP when applying
Fault Tree Analysis
Seven out of seven interviewees agreed the HiP-HOPS Fault Tree Analysis feature will help
the safety work and enhancing the usability of EATOP.
5. The consistency checking is quite necessary for both architecture design and safety
analysis.
Consistency Checking is mentioned by interviewee A, C, D and F as a highly useful feature in
most of the current tools. Besides, interviewee A and D bring one example which handles
consistency checking by version control to address the relation with the thesis work and they
point out consistency checking is and will be a big issue to work with in the future.
7. The whole thesis research is acceptable in general. (On a scale of 1 to 5, with 1 being poor
and 5 being excellent, if the overall average scale is more than 3, it is regarded as acceptable.)
As a general hypothesis, this item will be confirmed using the evaluation criteria explained
in section 9.1.
Artifact success
For all tree artifacts presented in the interview, they get an average 4 out of 5 as the ease of
use. So in general, the outcome artifacts are easy to use.
𝐸𝑎𝑠𝑒 𝑂𝑓 𝑈𝑠𝑒 𝐴𝑣𝑒𝑟𝑎𝑔𝑒= (𝑓𝑒𝑎𝑡𝑢𝑟𝑒1)𝐴𝑣𝑔 + (𝑓𝑒𝑎𝑡𝑢𝑟𝑒2)𝐴𝑣𝑔 + (𝑓𝑒𝑎𝑡𝑢𝑟𝑒3)𝐴𝑣𝑔 + (𝑓𝑒𝑎𝑡𝑢𝑟𝑒4)𝐴𝑣𝑔
= (4 + 4 + 3.8 + 4.9)/4 = 3.925
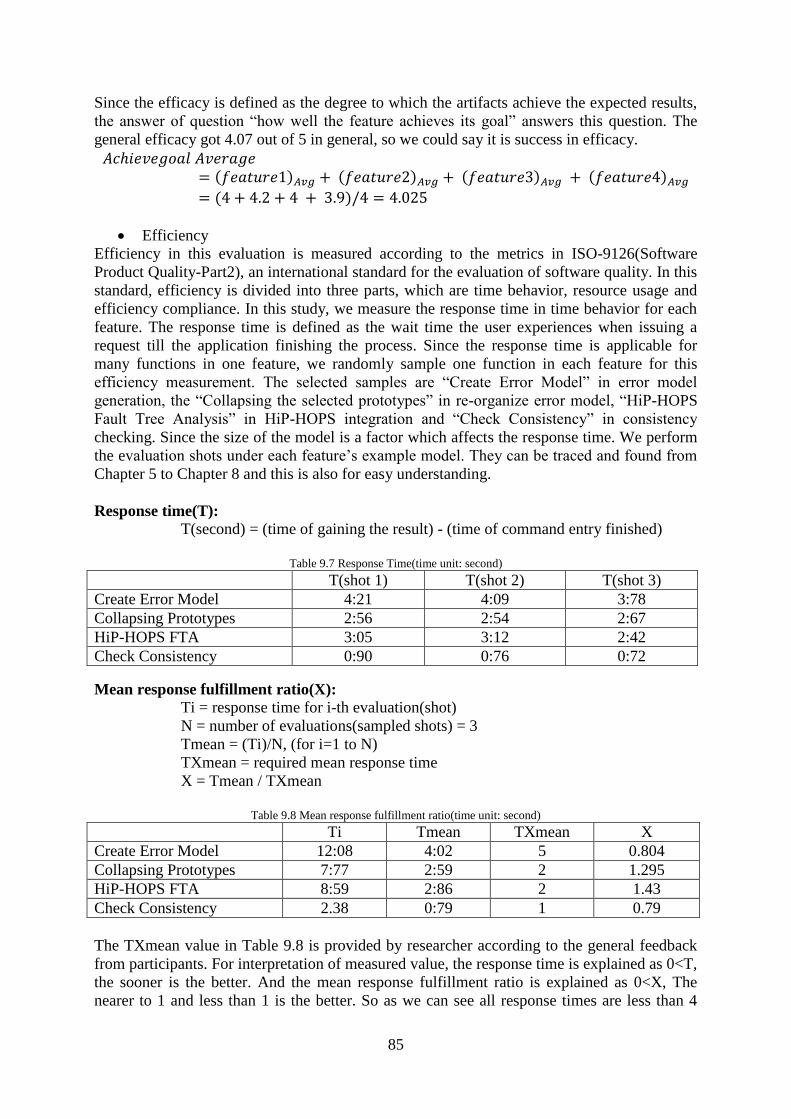
85
Since the efficacy is defined as the degree to which the artifacts achieve the expected results,
the answer of question “how well the feature achieves its goal” answers this question. The
general efficacy got 4.07 out of 5 in general, so we could say it is success in efficacy.
𝐴𝑐ℎ𝑖𝑒𝑣𝑒𝑔𝑜𝑎𝑙 𝐴𝑣𝑒𝑟𝑎𝑔𝑒= (𝑓𝑒𝑎𝑡𝑢𝑟𝑒1)𝐴𝑣𝑔 + (𝑓𝑒𝑎𝑡𝑢𝑟𝑒2)𝐴𝑣𝑔 + (𝑓𝑒𝑎𝑡𝑢𝑟𝑒3)𝐴𝑣𝑔 + (𝑓𝑒𝑎𝑡𝑢𝑟𝑒4)𝐴𝑣𝑔
= (4 + 4.2 + 4 + 3.9)/4 = 4.025
Efficiency
Efficiency in this evaluation is measured according to the metrics in ISO-9126(Software
Product Quality-Part2), an international standard for the evaluation of software quality. In this
standard, efficiency is divided into three parts, which are time behavior, resource usage and
efficiency compliance. In this study, we measure the response time in time behavior for each
feature. The response time is defined as the wait time the user experiences when issuing a
request till the application finishing the process. Since the response time is applicable for
many functions in one feature, we randomly sample one function in each feature for this
efficiency measurement. The selected samples are “Create Error Model” in error model
generation, the “Collapsing the selected prototypes” in re-organize error model, “HiP-HOPS
Fault Tree Analysis” in HiP-HOPS integration and “Check Consistency” in consistency
checking. Since the size of the model is a factor which affects the response time. We perform
the evaluation shots under each feature’s example model. They can be traced and found from
Chapter 5 to Chapter 8 and this is also for easy understanding.
Response time(T):
T(second) = (time of gaining the result) - (time of command entry finished)
Table 9.7 Response Time(time unit: second)
T(shot 1) T(shot 2) T(shot 3)
Create Error Model 4:21 4:09 3:78
Collapsing Prototypes 2:56 2:54 2:67
HiP-HOPS FTA 3:05 3:12 2:42
Check Consistency 0:90 0:76 0:72
Mean response fulfillment ratio(X):
Ti = response time for i-th evaluation(shot)
N = number of evaluations(sampled shots) = 3
Tmean = (Ti)/N, (for i=1 to N)
TXmean = required mean response time
X = Tmean / TXmean
Table 9.8 Mean response fulfillment ratio(time unit: second)
Ti Tmean TXmean X
Create Error Model 12:08 4:02 5 0.804
Collapsing Prototypes 7:77 2:59 2 1.295
HiP-HOPS FTA 8:59 2:86 2 1.43
Check Consistency 2.38 0:79 1 0.79
The TXmean value in Table 9.8 is provided by researcher according to the general feedback
from participants. For interpretation of measured value, the response time is explained as 0<T,
the sooner is the better. And the mean response fulfillment ratio is explained as 0<X, The
nearer to 1 and less than 1 is the better. So as we can see all response times are less than 4
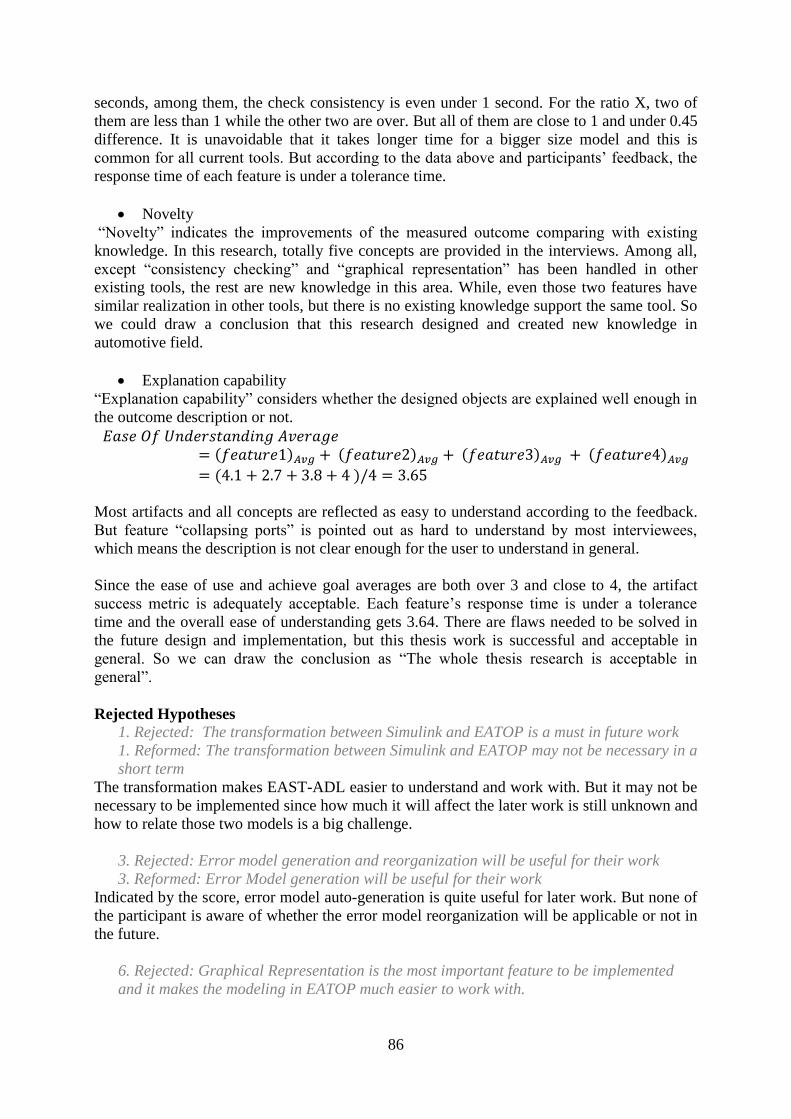
86
seconds, among them, the check consistency is even under 1 second. For the ratio X, two of
them are less than 1 while the other two are over. But all of them are close to 1 and under 0.45
difference. It is unavoidable that it takes longer time for a bigger size model and this is
common for all current tools. But according to the data above and participants’ feedback, the
response time of each feature is under a tolerance time.
Novelty
“Novelty” indicates the improvements of the measured outcome comparing with existing
knowledge. In this research, totally five concepts are provided in the interviews. Among all,
except “consistency checking” and “graphical representation” has been handled in other
existing tools, the rest are new knowledge in this area. While, even those two features have
similar realization in other tools, but there is no existing knowledge support the same tool. So
we could draw a conclusion that this research designed and created new knowledge in
automotive field.
Explanation capability
“Explanation capability” considers whether the designed objects are explained well enough in
the outcome description or not.
𝐸𝑎𝑠𝑒 𝑂𝑓 𝑈𝑛𝑑𝑒𝑟𝑠𝑡𝑎𝑛𝑑𝑖𝑛𝑔 𝐴𝑣𝑒𝑟𝑎𝑔𝑒= (𝑓𝑒𝑎𝑡𝑢𝑟𝑒1)𝐴𝑣𝑔 + (𝑓𝑒𝑎𝑡𝑢𝑟𝑒2)𝐴𝑣𝑔 + (𝑓𝑒𝑎𝑡𝑢𝑟𝑒3)𝐴𝑣𝑔 + (𝑓𝑒𝑎𝑡𝑢𝑟𝑒4)𝐴𝑣𝑔
= (4.1 + 2.7 + 3.8 + 4 )/4 = 3.65
Most artifacts and all concepts are reflected as easy to understand according to the feedback.
But feature “collapsing ports” is pointed out as hard to understand by most interviewees,
which means the description is not clear enough for the user to understand in general.
Since the ease of use and achieve goal averages are both over 3 and close to 4, the artifact
success metric is adequately acceptable. Each feature’s response time is under a tolerance
time and the overall ease of understanding gets 3.64. There are flaws needed to be solved in
the future design and implementation, but this thesis work is successful and acceptable in
general. So we can draw the conclusion as “The whole thesis research is acceptable in
general”.
Rejected Hypotheses
1. Rejected: The transformation between Simulink and EATOP is a must in future work
1. Reformed: The transformation between Simulink and EATOP may not be necessary in a
short term
The transformation makes EAST-ADL easier to understand and work with. But it may not be
necessary to be implemented since how much it will affect the later work is still unknown and
how to relate those two models is a big challenge.
3. Rejected: Error model generation and reorganization will be useful for their work
3. Reformed: Error Model generation will be useful for their work
Indicated by the score, error model auto-generation is quite useful for later work. But none of
the participant is aware of whether the error model reorganization will be applicable or not in
the future.
6. Rejected: Graphical Representation is the most important feature to be implemented
and it makes the modeling in EATOP much easier to work with.
87
6. Reformed: Graphical Representation is the most important feature and it makes the
modeling in EATOP much easier to work with. But according to the workload, it is not
needed to be implemented in the thesis work
All interviewees indicate this fact in the graphical representation section. Besides, interviewee
D brought this idea in Error Model generating section and emphasis it again in the end of the
interview. In general question section, 75% of the interviewees prioritize graphical
representation as the most important feature. While, three out of three interviewees suggest to
provide a graphical design than implementing it in this thesis work.
Reflection
Error Model Generation:
Interviewee A, B, C and E, F all mentioned to add the model behavior information in the
nominal model or error model will be a future work. While currently, the failure logic is
complete, i.e. all inputs affect all outputs, and the user is expected to tidy this manually. A
refinement to be explained but not implemented is to parse the Simulink model (as this is a
relevant source) to establish internal connectivity between ports as a basis for the failure logic
expressions. It will still require manual intervention, as it is not possible to know which faults
generate which failures, but it is a more precise starting point than now.
Re-organize Error Model:
The goal of collapsing ports seems not easy for people to understand. This may due to the
example demonstrated in the interviewees does not address the real problem this feature
handles.
HiP-HOPS Fault Tree Analysis:
Fault Tree Analysis is the final goal of building the error models. In this work, it gathers the
architecture design, error model building and fault tree analysis into the same tool, this is
regarded as a step forward compare with the current tool. More information about the failure
type and possibility is needed to add in later work.
Consistency Checking:
Several participants mentioned SE tool is a good example handling the consistency checking,
it has three states of versions called work, frozen and release. The work version means this
element is possible to modify. Frozen stage freezes the possibility of modification but it’s
possible to change it back to work stage. The release stage is a strict stage which cannot be
transferred to other version stage nor modify the element. In the thesis work, we have two
kinds of versions, since all the versions are specified in number, so each increase in integer is
a release and the increase in decimal part indicates the working stage.
Later work:
In short term, we focus on enhance the usability of EATOP and create better connection
between HiP-HOPS and EATOP. For long term which is also future work, more attention will
be paid on different aspects including enhancing the graphical representation and adding error
behavior, possibility, severability for example, to the error logic.
9.3.5 Threats to Validity Several threats to validity are taken into consideration in this evaluation. Those threats which
could affect the validity result are categorized into threats to construct validity, to external

88
validity and to reliability. This validity category is provided in a guideline article of
conducting and reporting case study research in software engineering (Runeson and Höst,
2009). Since the interview data collection and data analysis processes presented by Runeson
and Höst are taken as a reference in this evaluation. The threats to validity provided by them
then is regarded as highly related with this research evaluation and worth to be referred. Since
the threats to validity are considered at the beginning of the evaluation, several adjustments
have been applied in order to mitigate or avoid the expectable threats.
Construct validity is defined as how well the operational measures that are studied has
captured the concepts under study (Bjarnason et al., 2013). One possible threat to construct
validity is that the design of the interview may mislead the interviewees which affects the
evaluation result. In order to reduce this risk, the interview is designed based on 5 research
questions and reviewed for applicableness and consistency by both supervisors. Besides, a test
interview between the researcher and the industry supervisor is conducted before any official
evaluation is performed. All the variables in the interview design are kept the same in the test.
The problems discovered during the test interview are avoided when it comes to later
evaluation.
External validity refers to how well the findings are able to be generalized and to what extent
the findings are of interest to other people outside the investigated case (Runeson and Höst,
2009). It’s obvious that the selection bias is the main threat in this evaluation which prevent
the findings to be generalized. To mitigate the selection bias, experts with different
backgrounds from system area and safety area are selected as sampling. Even though, there
might still be bias since all the interviewees are selected from the same company, but since
most of the interviewees only hold the background knowledge but not the technology
presented in this research, it is possible to assert that the analysis result can also be applied to
other companies within the same area.
Reliability is also stated as one kind of validity which refers to how well the data and the
analysis are independent from the specific researchers (Runeson and Höst, 2009). The threats
to reliability are usually due to, for example, unclear questions during the interview or the
unstructured coding. To increase the reliability in this evaluation, each question presented in
the interview has been revised several times until get confirmation by both supervisors.
Besides, to reduce the influence by single researcher, each transcript objectively depends on
the record taking from each interview. So few researcher’s subjective opinions affected the
analysis result.
89
Chapter 10 Conclusion
10.1 Summary The gaining complexity of architecture modeling in automotive industry makes the safety
analysis error prone and hard to applying in an early phase. At the same time, safety analysis
also faces the time consuming issue when all processes are done manually. The purpose of
this study is investigating and improving EAST-ADL safety analysis working process. Five
research questions are raised in four safety analysis working steps and each of them is
addressed from Chapter 5 to Chapter 8. By performing design research methodology, four
feature artifacts have been designed, implemented and evaluated. Each artifact is implemented
as an Eclipse EATOP plugin coping with research questions in each safety analysis process.
The evaluation of research outputs is performed as one to one interviews with system
engineers and safety engineers in Volvo Group Trucks Technology. The whole evaluation is
addressed as a data collection phase and data analysis phase in Chapter 9.
RQ1: How to efficiently define an error propagation model from architecture model
A one to one mapping is defined in order to match the architecture model element into error
propagation model element. Besides, an error model auto generation feature is implemented
based on the one to one mapping. The error model auto generation feature is evaluated as easy
to understand and use and it achieves its goal to answer RQ1.
RQ2: How to reduce the manual work in refactoring the model?
This research focuses on reducing the manual work regards to collapsing error model
prototypes and fault failure ports. A feature is designed and developed to automate the
collapsing function. During the evaluation session, several interviewees pointed out that it
will take time till applying this feature into their daily work, but this is useful for their future
work and it does reduce the manual work while refactoring the model. So we draw the
conclusion that the manual work is reduced to some extent in this research.
RQ3: How to apply Fault Tree Analysis on EAST-ADL error model and relate the generated
Fault Tree result with the model?
By integrating HiP-HOPS into EATOP, it makes Fault Tree Analysis possible to be applied
on EAST-ADL error model. At the same time, the Fault Tree Analysis result cutsets are
related from Fault Tree perspective to EAST-ADL modeling perspective. This feature is
evaluated as highly useful during safety analysis and it improves the current safety analysis
status from late stage of an architecture design into early stage. RQ3 is well answered in this
research.
RQ4: How to visualize the error propagation model together with architecture model?
By providing a graphical representation feature, the structure and relation between error
propagation model and architecture model are visualized to some extent. The feedback from
90
evaluation proves that visualization is highly needed in order to better understand an
architecture design and safety analysis.
RQ5: How to ensure consistency between nominal architecture models and error models?
The Version Control plugin handles the inconsistency problem between nominal models and
error models by checking the version number. The majority of the interviewees state that
version inconsistency is one of the biggest problem during system development and this
research provides one possible solution while coping with model inconsistency.
10.2 Contribution and Limitation This research improves safety analysis process in the automotive domain. It automates the
manual work in different safety analysis processes and bridges the gap between system design
and safety design in EAST-ADL. It provides a new concept and artifact for handling model
inconsistency and visualize the model dependency at a certain level. In addition, it brings fault
tree analysis to an early stage of a system design which reduce the flaws in later work.
At the same time, there are limitations in this research. No other experts than the research
supervisors and interviewees are involved in providing feedback. EATOP is selected as the
research platform and only limited attention is given to other tooling. Besides, during the
given period of time, the design and implementation are not able to cover all possible reality
situations. The resources that have been collected and analyzed are also in a limited amount.
10.3 Future Work The research presented in this thesis has raised some further questions that are needed to be
answered. From the evaluation feedback, error logic will be taken into consideration in
addressing the error probability for error model generation and further investigation is needed
for proving the usability of error model reorganization. Currently, different cutsets by Fault
Tree Analysis cannot be different from the cutset decoration. So the future work will include
finding a way to efficiently present different cutsets in EAST-ADL Fault Tree Analysis. As
Interviewee A mentioned, consistency checking is and will always be a big issue to handle in
system architecture design area, the artifact developed in this research is needed to be
improved from both performance and functionality perspectives. And the future work for
graphical support could be seen in two approaches. The first is applying the generated
diagram to a generic schema, which can be imported and exported through a third party tool
for diagram editing. Another approach is integrating the existing graphical editor to be
compatible with the latest EAST-ADL version.

91
Bibliography
Aizpurua, J. I., & Muxika, E. (2013). Model-Based Design of Dependable Systems:
Limitations and Evolution of Analysis and Verification Approaches.International
Journal On Advances in Security, 6(1 and 2), 12-31.
Avizienis, A., Laprie, J.C., Randell, B., Landwehr, C.E.(2004).Basic concepts and taxon- omy
of dependable and secure computing. IEEE Transactions on Dependable and Secure
Computing 1(1), 11-33.
Blom H, Lönn H, Hagl F, Papadopoulos Y, Reiser M, Sjöstedt C, Chen D, Kolagari R, EAST-
ADL – An Architecture Description Language for automotive software-intensive
Systems, White Paper, version 2.1.12. Available at:
http://www.maenad.eu/public/conceptpresentations/EAST-
ADL_WhitePaper_M2.1.12.pdf
Carvalho, Alvaro J, Azurém(2012), Validation Criteria For Outcomes Of Design Research,
the International workshop on IT Artefact Design & Workpractice Intervention, 10
June, 2012, Barcelona.
Chen, D., Mahmud, N., Walker, M., Feng, L., Lönn, H. & Papadopoulos, Y. (2013). Systems
Modeling with EAST-ADL for Fault Tree Analysis through HiP-HOPS. Paper
presented at 4th IFAC Workshop on Dependable Control of Discrete Systems.
Claudia Priesterjahn, Dominik Steenken, Matthias Tichy. (2013). Timed Hazard Analysis of
Self-healing Systems. Assurances for Self-Adaptive Systems. Part I. pp 112-151.
Cole, R. , Purao, S., Rossi, M., Sein, M. 2005. Being Proactive: Where Action Research meets
Design Research. International Conference on Information Systems. (ICIS) Las Vegas,
NV, December 11-14. Originally presented at ICIS.
DeJiu Chen, Lei Feng, Henrik Lönn, Juha-Pekka Tolvanen, (2013). Advances in Automotive
System Modeling: EAST-ADL(Part2). EETimes Europe, [Online] 24 May. Available
at: <http://www.automotive-eetimes.com/en/advances-in-automotive-system-modeling-
east-adl-part-2.html?cmp_id=71&news_id=222902939> [Accessed 6 February]

92
EAST-ADL Association, (2014). EAST-ADL Domain Model Specification version V2.1.12,
Available at: http://www.east-adl.info/Specification/V2.1.12/EAST-ADL-
Specification_V2.1.12.pdf [Accessed 20 March]
Eclipse modeling EATOP, (2013). EATOP. [online] Available at:
<http://eclipse.org/proposals/modeling.eatop/> [Accessed 4 February]
E. Bjarnason, P. Runeson, M. Borg, M. Unterkalmsteiner, E. Engström, B. Regnell, G.
Sabaliauskaite, A. Loconsole, T. Gorschek, and R. Feldt, Challenges and Practices in
Aligning Requirements and Verification & Validation: An Industrial Multi-Unit Case
Study, Empirical Software Engineering Journal, July 2013
Getir, S.; van Hoorn, A.; Grunske, L. & Tichy, M.(2013), Co-Evolution of Software
Architecture and Fault Tree models: An Explorative Case Study on a Pick and Place
Factory Automation System., in Simona Bernardi; Marko Boskovic & José Merseguer,
ed., 'NiM-ALP@MoDELS' , CEUR-WS.org, , pp. 32-40 .
Grunske, Lars; Han, J., "A Comparative Study into Architecture-Based Safety Evaluation
Methodologies Using AADL's Error Annex and Failure Propagation Models," High
Assurance Systems Engineering Symposium, 2008. HASE 2008. 11th IEEE , vol., no.,
pp.283,292, 3-5 Dec. 2008 doi: 10.1109/HASE.2008.32
Guochuan Wang, 2000, Threats to external validity [online] December, Education
dictionaries, National Institute of Education, <http://terms.naer.edu.tw/detail/1303821/>
[Accessed 20 November,2014]
Guochuan Wang, 2000, Threats to internal validity [online] December, Education
dictionaries, National Institute of Education, <http://terms.naer.edu.tw/detail/1302721/
> [Accessed 20 November,2014]
Göran Goldkuhl (2013). Action Research VS. Design Research: Using Practice research as a
lens for comparison and integration. SIG Prag Workshop on IT artefact design &
Workpractice Improvement, 5 June 2013
Holger Giese, Matthias Tichy. (2006) Component-Based Hazard Analysis: Optimal Designs,
Product Lines, and Online-Reconfiguration. SAFECOMP 2006: 156-169
Malik, H.; Hassan, A.E., (2008)Supporting software evolution using adaptive change
propagation heuristics, Software Maintenance, ICSM 2008. IEEE International
Conference on, vol., no., pp.177,186, Sept. 28 2008-Oct. 4 2008
Matthias Biehl, Chen DeJiu, and Martin Törngren. (2010). Integrating safety analysis into the
93
model-based development toolchain of automotive embedded systems. In Proceedings
of the ACM SIGPLAN/SIGBED 2010 conference on Languages, compilers, and tools
for embedded systems (LCTES '10). ACM, New York, NY, USA, 125-132.
P. Cuenot, C. Ainhauser, N. Adler, S. Otten, F. Meurville, (2013). Applying Model Based
Techniques for Early Safety Evaluation of an Automotive Architecture in Compliance
with the ISO 26262 Standard.[online] Available at:
<http://www.erts2014.org/Site/0R4UXE94/Fichier/erts2014_4C2.pdf > [Accessed 8
February 2014]
Runeson, P. and Höst, M. ,2009, Guidelines for Conducting and Reporting Case Study
Research in Software Engineering, Journal of Empirical Software Engineering, 14(2),
131-164.
Rick Salay, Jan Gorzny, and Marsha Chechik. 2013. Change propagation due to uncertainty
change. In Proceedings of the 16th international conference on Fundamental
Approaches to Software Engineering (FASE'13), Vittorio Cortellessa and Dániel Varró
(Eds.). Springer-Verlag, Berlin
Seaman C (1999) Qualitative methods in empirical studies of software engineering. IEEE
Trans Software Engineering 25(4):557–572 see also Chapter 2 in Shull et al. (2008)
Software Product Quality - Part 1:Quality model ; Reference number: ISO/IEC FDIS 9126-1
Software Product Quality - Part 2:External Metrics; Reference number: ISO/IEC DTR 9126-2
Synligare Project, http://www.synligare.eu/
Tahir Naseer Qureshi, DeJiu Chen, Henrik Lönn, and Martin Törngren (2011). From EAST
ADL to AUTOSAR Software Architecture: A Mapping Scheme. Software Architecture,
Volumn 6903,2011,pp328-334. http://dx.doi.org/10.1007/978-3-642-23798-0_35
Vaishnavi, V. and Kuechler, W.(2004). “Design Science Research in Information System,”
January 20,2004; last updated October 23,2013. http://www.desrist.org/design-research-
in-information-systems/
Vladimir Rupanov, Christian Buckl, Ludger Fiege, Michael Armbruster, Alois Knoll, and
Gernot Spiegelberg (2012). Early safety evaluation of design decisions in E/E
architecture according to ISO 26262. In Proceedings of the 3rd international ACM
SIGSOFT symposium on Architecting Critical Systems (ISARCS '12). ACM, New
York, NY, USA, 1-10.

94
VINNOVA FFI Project http://www.vinnova.se/sv/ffi/
Yiannis Papadopoulos, Martin Walker, David Parker, Erich Rüde, Rainer Hamann, Andreas
Uhlig, Uwe Grätz, Rune Lien (2011), Engineering failure analysis and design
optimisation with HiP-HOPS, Engineering Failure Analysis, Volume 18, Issue 2, March
2011, Pages 590-608
Wohlin, C., Runeson, P., Höst, M., Ohlsson, M.C., Regnell, B. & Wesslén, A. 2012,
Experimentation in software engineering, Springer, Berlin.
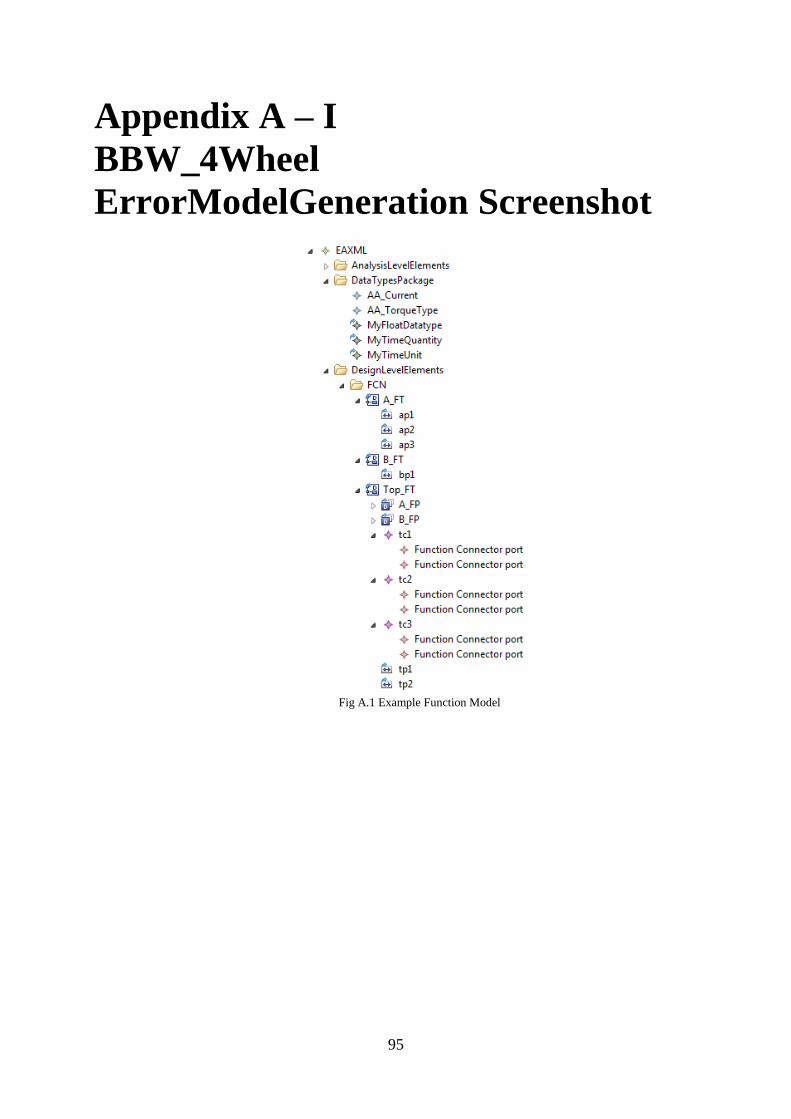
95
Appendix A – I
BBW_4Wheel
ErrorModelGeneration Screenshot
Fig A.1 Example Function Model
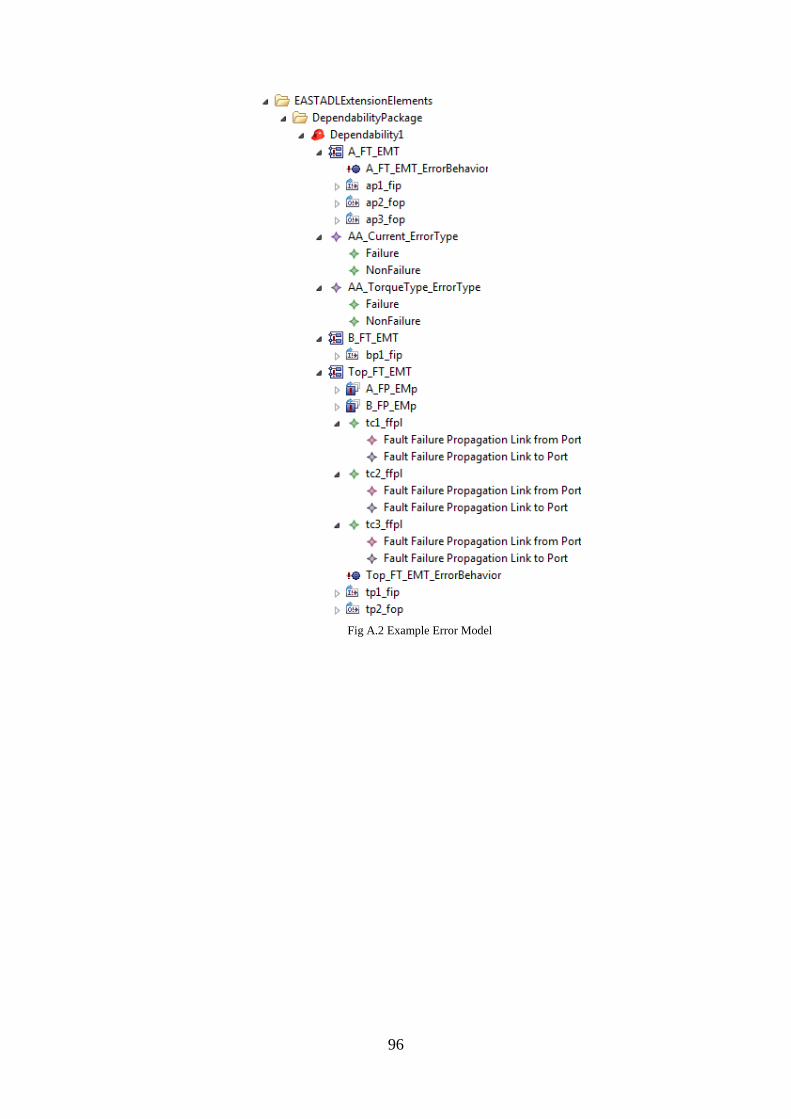
96
Fig A.2 Example Error Model
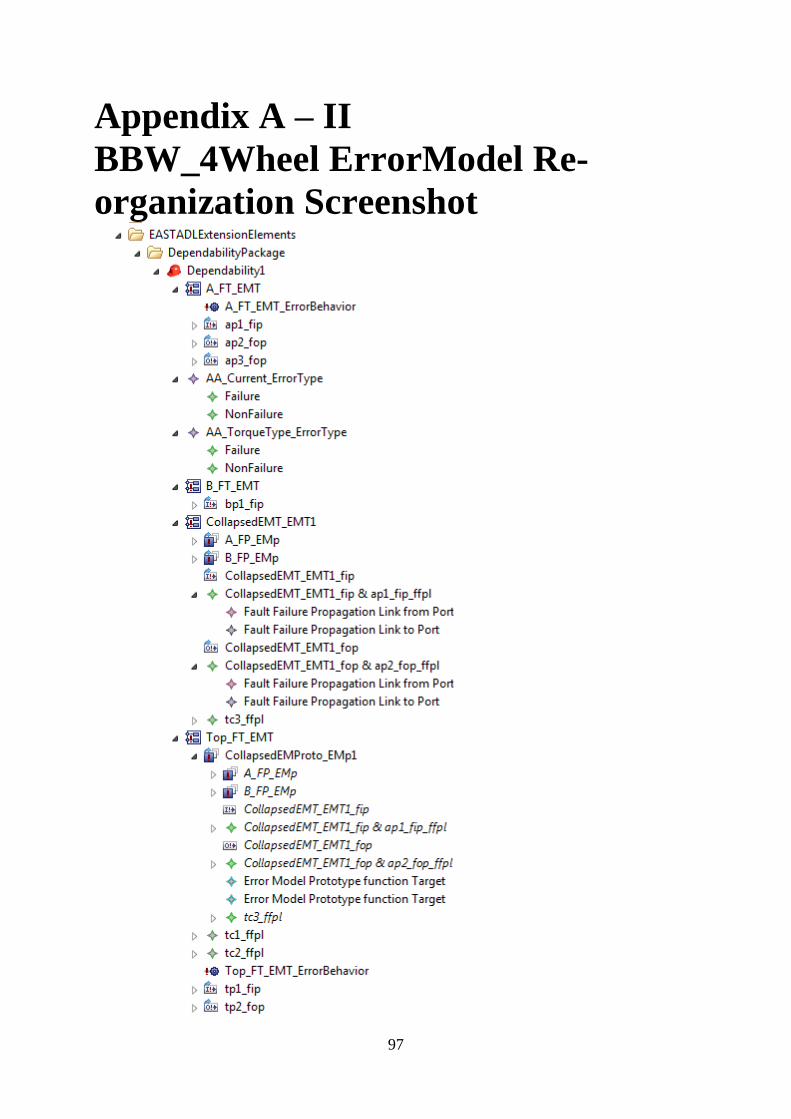
97
Appendix A – II
BBW_4Wheel ErrorModel Re-
organization Screenshot
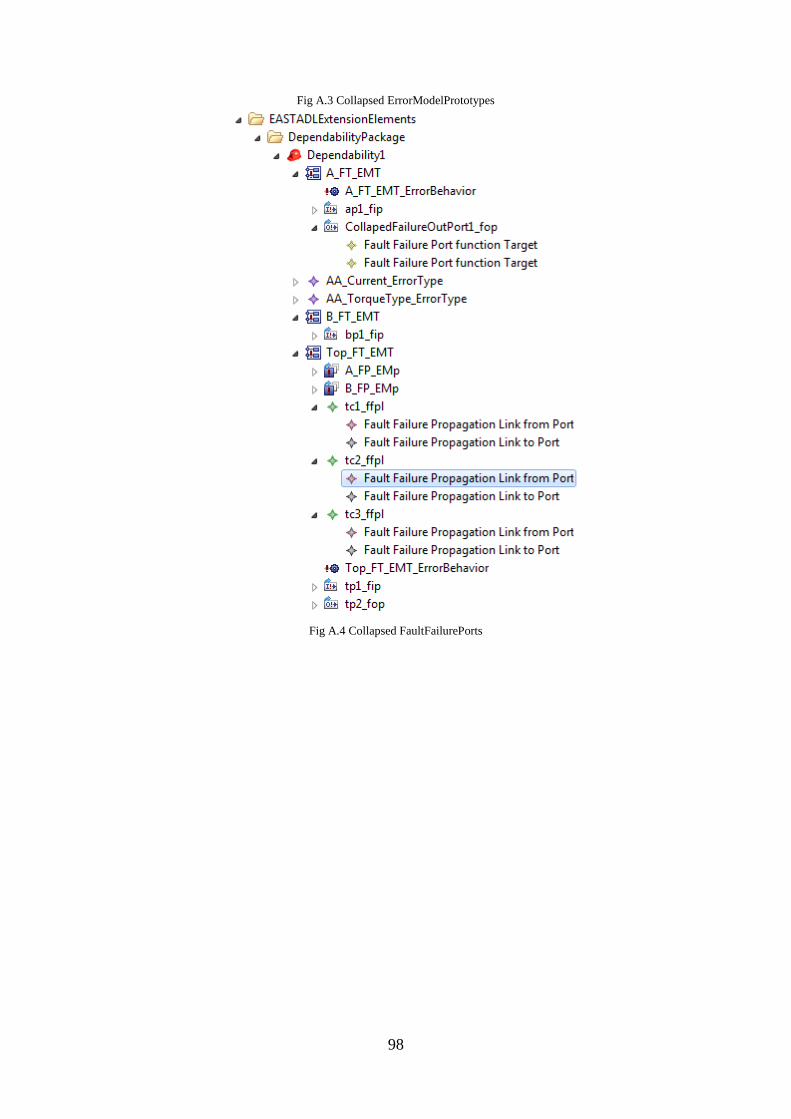
98
Fig A.3 Collapsed ErrorModelPrototypes
Fig A.4 Collapsed FaultFailurePorts
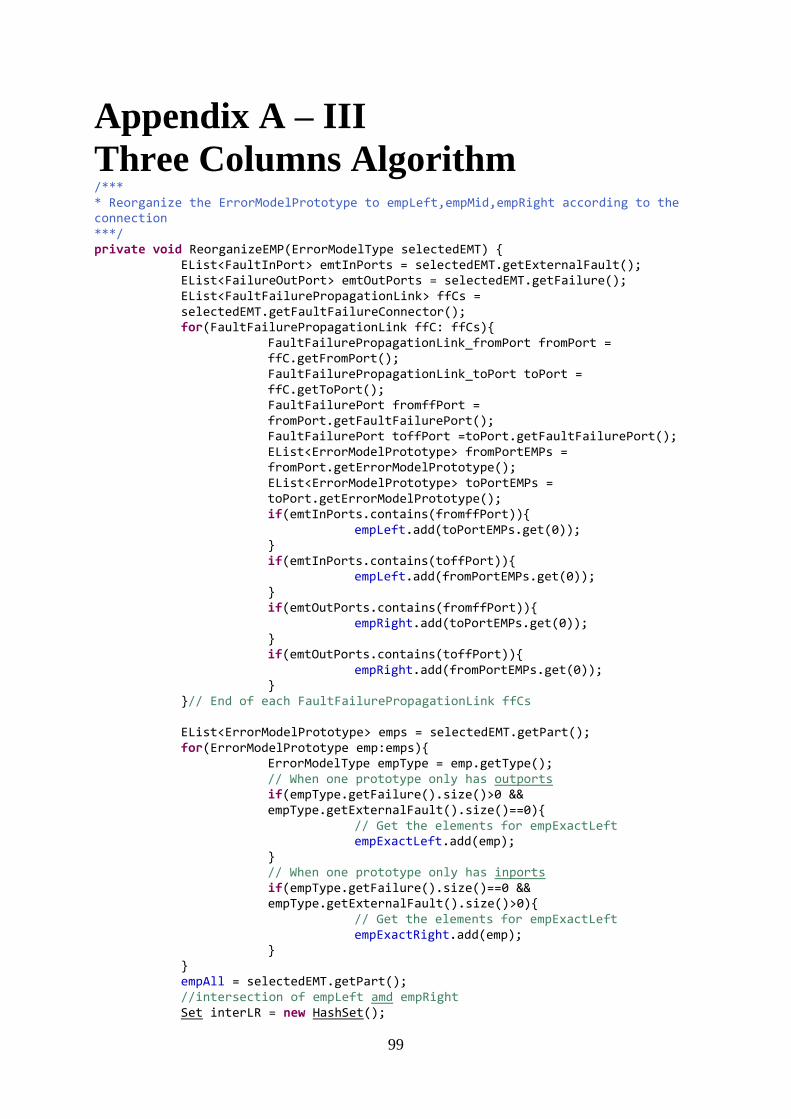
99
Appendix A – III
Three Columns Algorithm /*** * Reorganize the ErrorModelPrototype to empLeft,empMid,empRight according to the connection ***/ private void ReorganizeEMP(ErrorModelType selectedEMT) { EList<FaultInPort> emtInPorts = selectedEMT.getExternalFault(); EList<FailureOutPort> emtOutPorts = selectedEMT.getFailure();
EList<FaultFailurePropagationLink> ffCs = selectedEMT.getFaultFailureConnector();
for(FaultFailurePropagationLink ffC: ffCs){ FaultFailurePropagationLink_fromPort fromPort = ffC.getFromPort(); FaultFailurePropagationLink_toPort toPort = ffC.getToPort(); FaultFailurePort fromffPort = fromPort.getFaultFailurePort();
FaultFailurePort toffPort =toPort.getFaultFailurePort(); EList<ErrorModelPrototype> fromPortEMPs = fromPort.getErrorModelPrototype(); EList<ErrorModelPrototype> toPortEMPs = toPort.getErrorModelPrototype();
if(emtInPorts.contains(fromffPort)){ empLeft.add(toPortEMPs.get(0)); } if(emtInPorts.contains(toffPort)){ empLeft.add(fromPortEMPs.get(0)); } if(emtOutPorts.contains(fromffPort)){ empRight.add(toPortEMPs.get(0)); } if(emtOutPorts.contains(toffPort)){ empRight.add(fromPortEMPs.get(0)); } }// End of each FaultFailurePropagationLink ffCs EList<ErrorModelPrototype> emps = selectedEMT.getPart(); for(ErrorModelPrototype emp:emps){ ErrorModelType empType = emp.getType(); // When one prototype only has outports
if(empType.getFailure().size()>0 && empType.getExternalFault().size()==0){
// Get the elements for empExactLeft empExactLeft.add(emp); } // When one prototype only has inports
if(empType.getFailure().size()==0 && empType.getExternalFault().size()>0){
// Get the elements for empExactLeft empExactRight.add(emp); } } empAll = selectedEMT.getPart(); //intersection of empLeft amd empRight Set interLR = new HashSet();
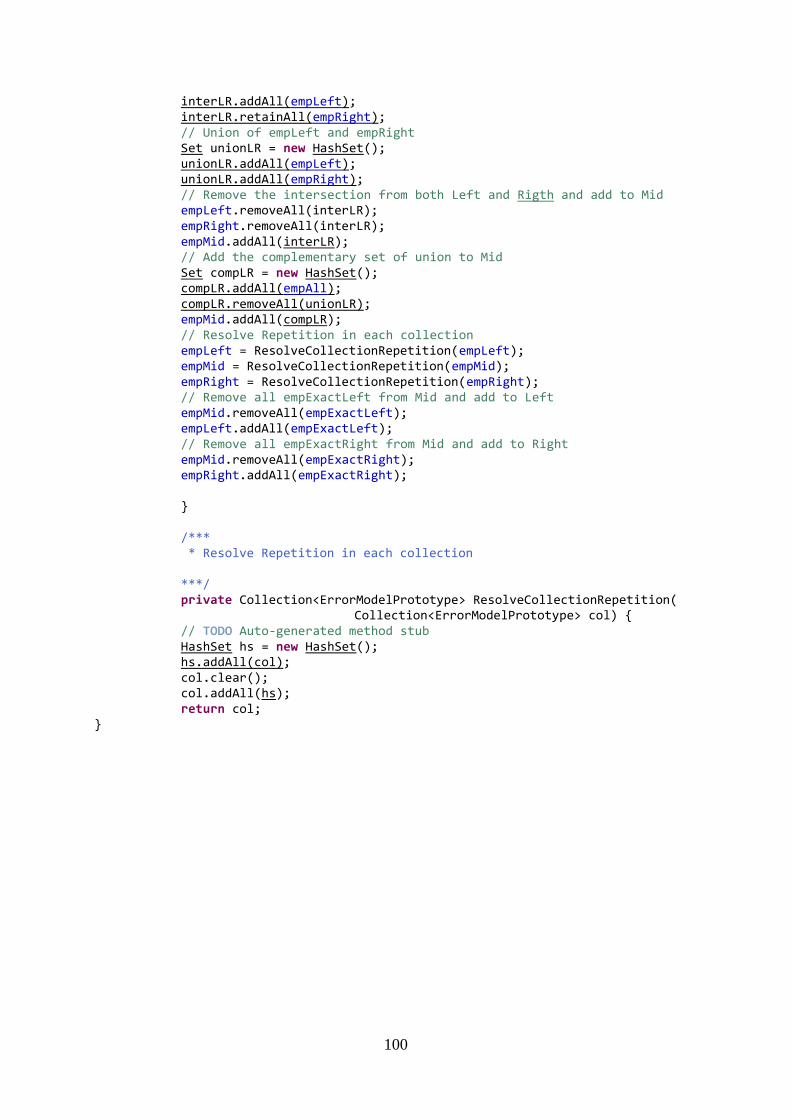
100
interLR.addAll(empLeft); interLR.retainAll(empRight); // Union of empLeft and empRight Set unionLR = new HashSet(); unionLR.addAll(empLeft); unionLR.addAll(empRight); // Remove the intersection from both Left and Rigth and add to Mid empLeft.removeAll(interLR); empRight.removeAll(interLR); empMid.addAll(interLR); // Add the complementary set of union to Mid Set compLR = new HashSet(); compLR.addAll(empAll); compLR.removeAll(unionLR); empMid.addAll(compLR); // Resolve Repetition in each collection empLeft = ResolveCollectionRepetition(empLeft); empMid = ResolveCollectionRepetition(empMid); empRight = ResolveCollectionRepetition(empRight);
// Remove all empExactLeft from Mid and add to Left empMid.removeAll(empExactLeft); empLeft.addAll(empExactLeft); // Remove all empExactRight from Mid and add to Right empMid.removeAll(empExactRight); empRight.addAll(empExactRight); } /*** * Resolve Repetition in each collection ***/ private Collection<ErrorModelPrototype> ResolveCollectionRepetition( Collection<ErrorModelPrototype> col) { // TODO Auto-generated method stub HashSet hs = new HashSet(); hs.addAll(col); col.clear(); col.addAll(hs); return col; }
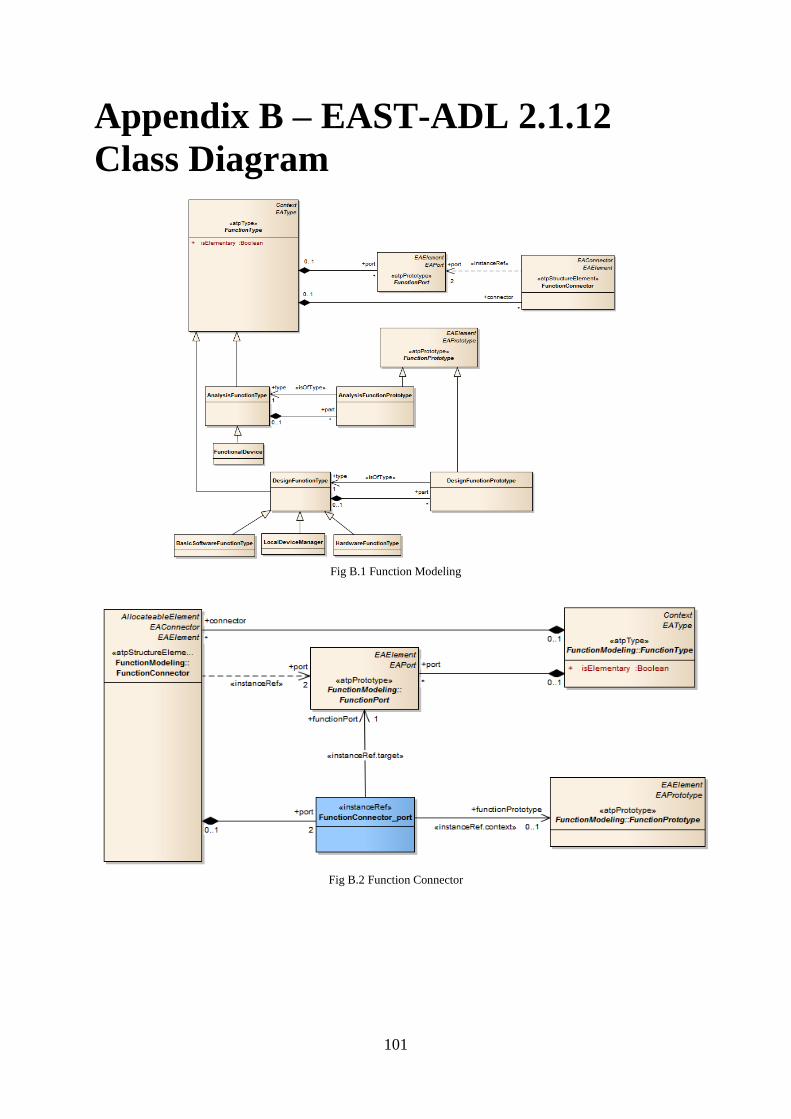
101
Appendix B – EAST-ADL 2.1.12
Class Diagram
Fig B.1 Function Modeling
Fig B.2 Function Connector

102
Fig B.3 Function Port
Fig B.4 Error Modeling
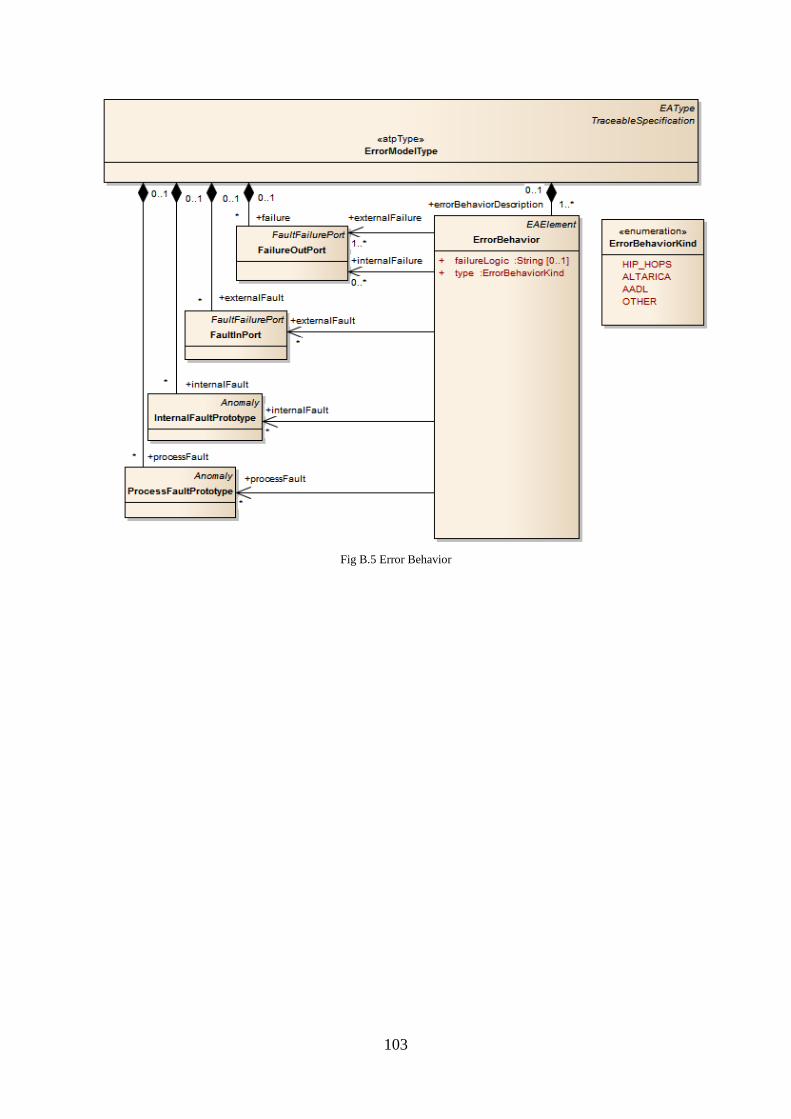
103
Fig B.5 Error Behavior
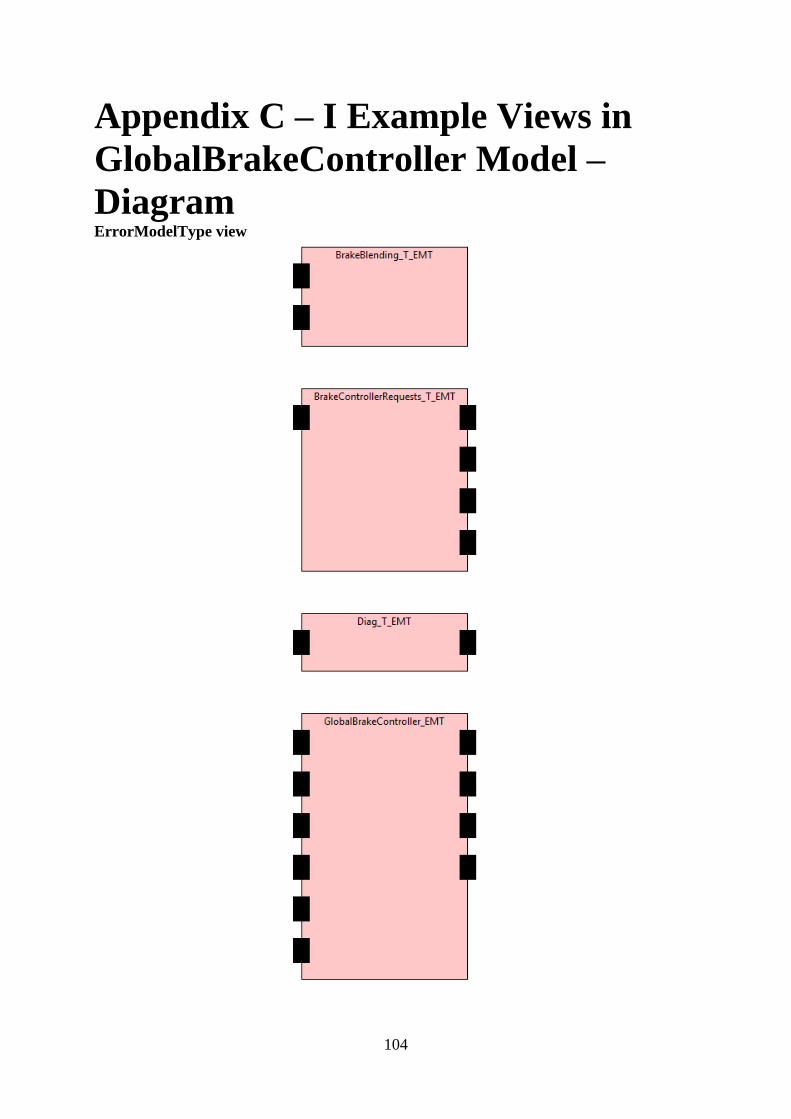
104
Appendix C – I Example Views in
GlobalBrakeController Model –
Diagram ErrorModelType view
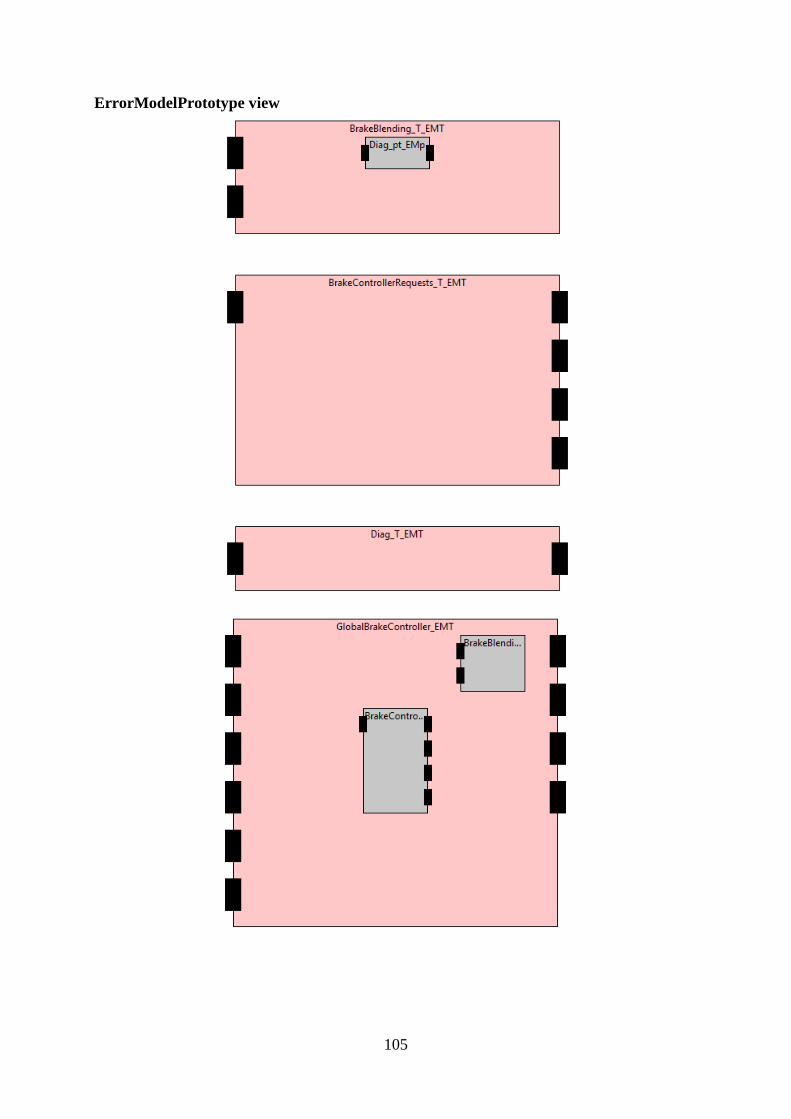
105
ErrorModelPrototype view
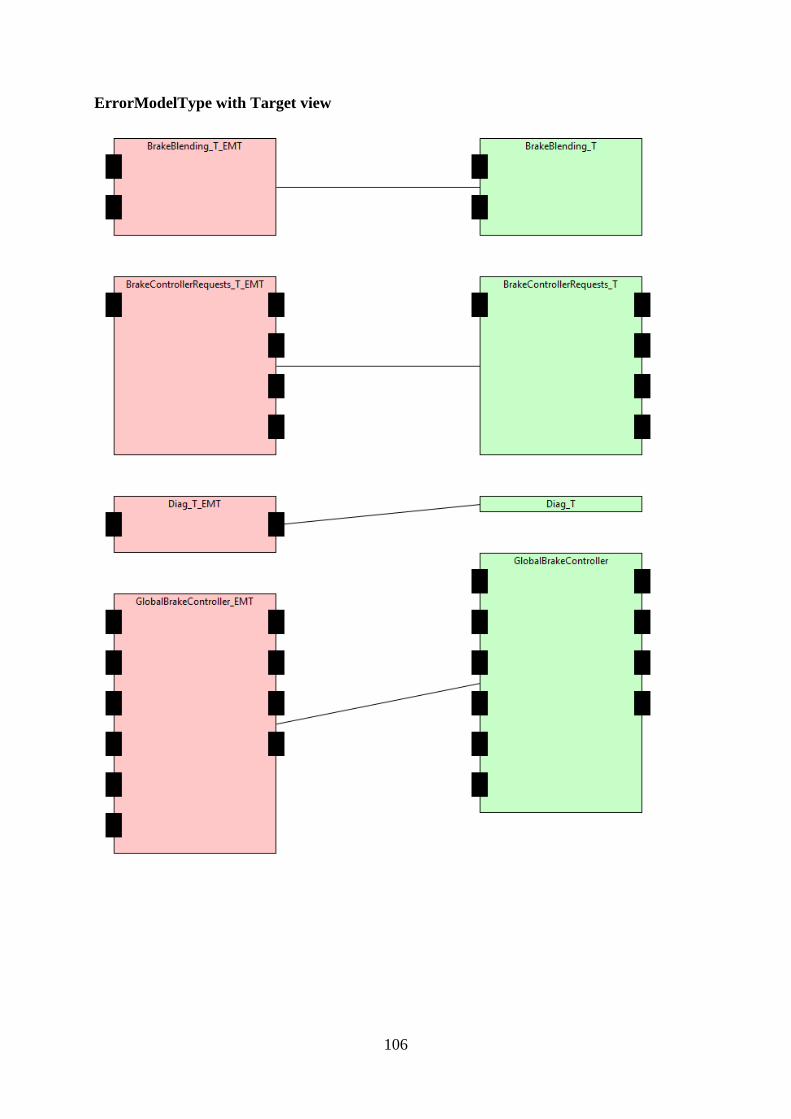
106
ErrorModelType with Target view
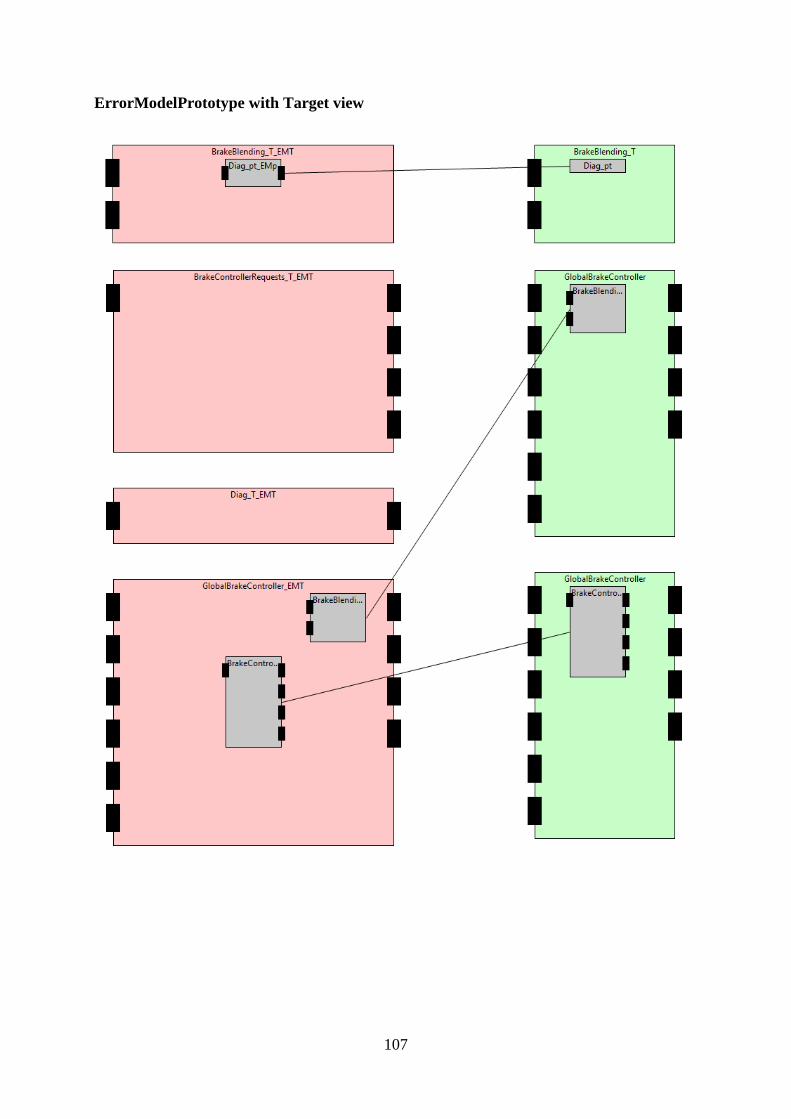
107
ErrorModelPrototype with Target view

108
Appendix C – II Example Views in
GlobalBrakeController Model –
XML The XML generated and presented follow a preliminary graphical exchange format.
ErrorModelType view <?xml version="1.0" encoding="UTF-8" standalone="yes"?> <Diagram> <ModelFile>BBW_4Wheel_2.1.12EM.eaxml</ModelFile> <Element> <Element-Ref>/EASTADLExtensionElements/DependabilityPackage/Dependability2/BrakeBlending_T_EMT</Element-Ref> <Name>BrakeBlending_T_EMT</Name> <Box> <xPos>400</xPos> <yPos>50</yPos> <zPos>0</zPos> <Size x="200" y="120"/> <Color r="255" g="200" b="200"/> <Outline>true</Outline> </Box> </Element> <Element> <Element-Ref>/EASTADLExtensionElements/DependabilityPackage/Dependability2/BrakeBlending_T_EMT/BrakeRequest_fip</Element-Ref> <Name>BrakeRequest_fip</Name> <Box> <xPos>390</xPos> <yPos>70</yPos> <zPos>0</zPos> <Size x="20" y="30"/> <Color r="0" g="0" b="0"/> <Outline>true</Outline> </Box> </Element> <Element> <Element-Ref>/EASTADLExtensionElements/DependabilityPackage/Dependability2/BrakeBlending_T_EMT/BrakeRequestBlended_fip</Element-Ref> <Name>BrakeRequestBlended_fip</Name> <Box> <xPos>390</xPos> <yPos>120</yPos> <zPos>0</zPos> <Size x="20" y="30"/> <Color r="0" g="0" b="0"/> <Outline>true</Outline> </Box> </Element> <Element>

109
<Element-Ref>/EASTADLExtensionElements/DependabilityPackage/Dependability2/BrakeControllerRequests_T_EMT</Element-Ref> <Name>BrakeControllerRequests_T_EMT</Name> <Box> <xPos>400</xPos> <yPos>220</yPos> <zPos>0</zPos> <Size x="200" y="220"/> <Color r="255" g="200" b="200"/> <Outline>true</Outline> </Box> </Element> <Element> <Element-Ref>/EASTADLExtensionElements/DependabilityPackage/Dependability2/BrakeControllerRequests_T_EMT/BrakeRequest_fip</Element-Ref> <Name>BrakeRequest_fip</Name> <Box> <xPos>390</xPos> <yPos>240</yPos> <zPos>0</zPos> <Size x="20" y="30"/> <Color r="0" g="0" b="0"/> <Outline>true</Outline> </Box> </Element> <Element> <Element-Ref>/EASTADLExtensionElements/DependabilityPackage/Dependability2/BrakeControllerRequests_T_EMT/BrakeTorqueFL_fop</Element-Ref> <Name>BrakeTorqueFL_fop</Name> <Box> <xPos>590</xPos> <yPos>240</yPos> <zPos>0</zPos> <Size x="20" y="30"/> <Color r="0" g="0" b="0"/> <Outline>true</Outline> </Box> </Element> <Element> <Element-Ref>/EASTADLExtensionElements/DependabilityPackage/Dependability2/BrakeControllerRequests_T_EMT/BrakeTorqueFR_fop</Element-Ref> <Name>BrakeTorqueFR_fop</Name> <Box> <xPos>590</xPos> <yPos>290</yPos> <zPos>0</zPos> <Size x="20" y="30"/> <Color r="0" g="0" b="0"/> <Outline>true</Outline> </Box> </Element> <Element> <Element-Ref>/EASTADLExtensionElements/DependabilityPackage/Dependability2/BrakeControllerRequests_T_EMT/BrakeTorqueRL_fop</Element-Ref>
110
<Name>BrakeTorqueRL_fop</Name> <Box> <xPos>590</xPos> <yPos>340</yPos> <zPos>0</zPos> <Size x="20" y="30"/> <Color r="0" g="0" b="0"/> <Outline>true</Outline> </Box> </Element> <Element> <Element-Ref>/EASTADLExtensionElements/DependabilityPackage/Dependability2/BrakeControllerRequests_T_EMT/BrakeTorqueRR_fop</Element-Ref> <Name>BrakeTorqueRR_fop</Name> <Box> <xPos>590</xPos> <yPos>390</yPos> <zPos>0</zPos> <Size x="20" y="30"/> <Color r="0" g="0" b="0"/> <Outline>true</Outline> </Box> </Element> <Element> <Element-Ref>/EASTADLExtensionElements/DependabilityPackage/Dependability2/Diag_T_EMT</Element-Ref> <Name>Diag_T_EMT</Name> <Box> <xPos>400</xPos> <yPos>490</yPos> <zPos>0</zPos> <Size x="200" y="70"/> <Color r="255" g="200" b="200"/> <Outline>true</Outline> </Box> </Element> <Element> <Element-Ref>/EASTADLExtensionElements/DependabilityPackage/Dependability2/Diag_T_EMT/DiagRequest_receive_fip</Element-Ref> <Name>DiagRequest_receive_fip</Name> <Box> <xPos>390</xPos> <yPos>510</yPos> <zPos>0</zPos> <Size x="20" y="30"/> <Color r="0" g="0" b="0"/> <Outline>true</Outline> </Box> </Element> <Element> <Element-Ref>/EASTADLExtensionElements/DependabilityPackage/Dependability2/Diag_T_EMT/DiagRequest_request_fop</Element-Ref> <Name>DiagRequest_request_fop</Name> <Box> <xPos>590</xPos>
111
<yPos>510</yPos> <zPos>0</zPos> <Size x="20" y="30"/> <Color r="0" g="0" b="0"/> <Outline>true</Outline> </Box> </Element> <Element> <Element-Ref>/EASTADLExtensionElements/DependabilityPackage/Dependability2/GlobalBrakeController_EMT</Element-Ref> <Name>GlobalBrakeController_EMT</Name> <Box> <xPos>400</xPos> <yPos>610</yPos> <zPos>0</zPos> <Size x="200" y="320"/> <Color r="255" g="200" b="200"/> <Outline>true</Outline> </Box> </Element> <Element> <Element-Ref>/EASTADLExtensionElements/DependabilityPackage/Dependability2/GlobalBrakeController_EMT/BrakeRequest_fip</Element-Ref> <Name>BrakeRequest_fip</Name> <Box> <xPos>390</xPos> <yPos>630</yPos> <zPos>0</zPos> <Size x="20" y="30"/> <Color r="0" g="0" b="0"/> <Outline>true</Outline> </Box> </Element> <Element> <Element-Ref>/EASTADLExtensionElements/DependabilityPackage/Dependability2/GlobalBrakeController_EMT/DriverReqTorqueIn_fip</Element-Ref> <Name>DriverReqTorqueIn_fip</Name> <Box> <xPos>390</xPos> <yPos>680</yPos> <zPos>0</zPos> <Size x="20" y="30"/> <Color r="0" g="0" b="0"/> <Outline>true</Outline> </Box> </Element> <Element> <Element-Ref>/EASTADLExtensionElements/DependabilityPackage/Dependability2/GlobalBrakeController_EMT/WheelSpeed_FLIn_fip</Element-Ref> <Name>WheelSpeed_FLIn_fip</Name> <Box> <xPos>390</xPos> <yPos>730</yPos> <zPos>0</zPos> <Size x="20" y="30"/>
112
<Color r="0" g="0" b="0"/> <Outline>true</Outline> </Box> </Element> <Element> <Element-Ref>/EASTADLExtensionElements/DependabilityPackage/Dependability2/GlobalBrakeController_EMT/WheelSpeed_FRIn_fip</Element-Ref> <Name>WheelSpeed_FRIn_fip</Name> <Box> <xPos>390</xPos> <yPos>780</yPos> <zPos>0</zPos> <Size x="20" y="30"/> <Color r="0" g="0" b="0"/> <Outline>true</Outline> </Box> </Element> <Element> <Element-Ref>/EASTADLExtensionElements/DependabilityPackage/Dependability2/GlobalBrakeController_EMT/WheelSpeed_RLIn_fip</Element-Ref> <Name>WheelSpeed_RLIn_fip</Name> <Box> <xPos>390</xPos> <yPos>830</yPos> <zPos>0</zPos> <Size x="20" y="30"/> <Color r="0" g="0" b="0"/> <Outline>true</Outline> </Box> </Element> <Element> <Element-Ref>/EASTADLExtensionElements/DependabilityPackage/Dependability2/GlobalBrakeController_EMT/WheelSpeed_RRIn_fip</Element-Ref> <Name>WheelSpeed_RRIn_fip</Name> <Box> <xPos>390</xPos> <yPos>880</yPos> <zPos>0</zPos> <Size x="20" y="30"/> <Color r="0" g="0" b="0"/> <Outline>true</Outline> </Box> </Element> <Element> <Element-Ref>/EASTADLExtensionElements/DependabilityPackage/Dependability2/GlobalBrakeController_EMT/BrakeTorqueFL_fop</Element-Ref> <Name>BrakeTorqueFL_fop</Name> <Box> <xPos>590</xPos> <yPos>630</yPos> <zPos>0</zPos> <Size x="20" y="30"/> <Color r="0" g="0" b="0"/> <Outline>true</Outline> </Box>
113
</Element> <Element> <Element-Ref>/EASTADLExtensionElements/DependabilityPackage/Dependability2/GlobalBrakeController_EMT/BrakeTorqueFR_fop</Element-Ref> <Name>BrakeTorqueFR_fop</Name> <Box> <xPos>590</xPos> <yPos>680</yPos> <zPos>0</zPos> <Size x="20" y="30"/> <Color r="0" g="0" b="0"/> <Outline>true</Outline> </Box> </Element> <Element> <Element-Ref>/EASTADLExtensionElements/DependabilityPackage/Dependability2/GlobalBrakeController_EMT/BrakeTorqueRL_fop</Element-Ref> <Name>BrakeTorqueRL_fop</Name> <Box> <xPos>590</xPos> <yPos>730</yPos> <zPos>0</zPos> <Size x="20" y="30"/> <Color r="0" g="0" b="0"/> <Outline>true</Outline> </Box> </Element> <Element> <Element-Ref>/EASTADLExtensionElements/DependabilityPackage/Dependability2/GlobalBrakeController_EMT/BrakeTorqueRR_fop</Element-Ref> <Name>BrakeTorqueRR_fop</Name> <Box> <xPos>590</xPos> <yPos>780</yPos> <zPos>0</zPos> <Size x="20" y="30"/> <Color r="0" g="0" b="0"/> <Outline>true</Outline> </Box> </Element> </Diagram>
ErrorModelType with Target view <?xml version="1.0" encoding="UTF-8" standalone="yes"?> <Diagram> <ModelFile>BBW_4Wheel_2.1.12EM.eaxml</ModelFile> <Element> <Element-Ref>/EASTADLExtensionElements/DependabilityPackage/Dependability2/BrakeBlending_T_EMT</Element-Ref> <Name>BrakeBlending_T_EMT</Name> <Box> <xPos>150</xPos> <yPos>50</yPos> <zPos>0</zPos>
114
<Size x="200" y="120"/> <Color r="255" g="200" b="200"/> <Outline>true</Outline> </Box> </Element> <Element> <Element-Ref>/EASTADLExtensionElements/DependabilityPackage/Dependability2/BrakeBlending_T_EMT/BrakeRequest_fip</Element-Ref> <Name>BrakeRequest_fip</Name> <Box> <xPos>140</xPos> <yPos>70</yPos> <zPos>0</zPos> <Size x="20" y="30"/> <Color r="0" g="0" b="0"/> <Outline>true</Outline> </Box> </Element> <Element> <Element-Ref>/EASTADLExtensionElements/DependabilityPackage/Dependability2/BrakeBlending_T_EMT/BrakeRequestBlended_fip</Element-Ref> <Name>BrakeRequestBlended_fip</Name> <Box> <xPos>140</xPos> <yPos>120</yPos> <zPos>0</zPos> <Size x="20" y="30"/> <Color r="0" g="0" b="0"/> <Outline>true</Outline> </Box> </Element> <Element> <Element-Ref>/DesignLevelElements/FCN/BrakeBlending_T</Element-Ref> <Name>BrakeBlending_T</Name> <Box> <xPos>600</xPos> <yPos>50</yPos> <zPos>0</zPos> <Size x="200" y="120"/> <Color r="200" g="255" b="200"/> <Outline>true</Outline> </Box> </Element> <Element> <Element-Ref>/DesignLevelElements/FCN/BrakeBlending_T/BrakeRequest</Element-Ref> <Name>BrakeRequest</Name> <Box> <xPos>590</xPos> <yPos>70</yPos> <zPos>0</zPos> <Size x="20" y="30"/> <Color r="0" g="0" b="0"/> <Outline>true</Outline> </Box> </Element> <Element>
115
<Element-Ref>/DesignLevelElements/FCN/BrakeBlending_T/BrakeRequestBlended</Element-Ref> <Name>BrakeRequestBlended</Name> <Box> <xPos>590</xPos> <yPos>120</yPos> <zPos>0</zPos> <Size x="20" y="30"/> <Color r="0" g="0" b="0"/> <Outline>true</Outline> </Box> </Element> <Element> <Element-Ref>/EASTADLExtensionElements/DependabilityPackage/Dependability2/BrakeControllerRequests_T_EMT</Element-Ref> <Name>BrakeControllerRequests_T_EMT</Name> <Box> <xPos>150</xPos> <yPos>220</yPos> <zPos>0</zPos> <Size x="200" y="220"/> <Color r="255" g="200" b="200"/> <Outline>true</Outline> </Box> </Element> <Element> <Element-Ref>/EASTADLExtensionElements/DependabilityPackage/Dependability2/BrakeControllerRequests_T_EMT/BrakeRequest_fip</Element-Ref> <Name>BrakeRequest_fip</Name> <Box> <xPos>140</xPos> <yPos>240</yPos> <zPos>0</zPos> <Size x="20" y="30"/> <Color r="0" g="0" b="0"/> <Outline>true</Outline> </Box> </Element> <Element> <Element-Ref>/EASTADLExtensionElements/DependabilityPackage/Dependability2/BrakeControllerRequests_T_EMT/BrakeTorqueFL_fop</Element-Ref> <Name>BrakeTorqueFL_fop</Name> <Box> <xPos>340</xPos> <yPos>240</yPos> <zPos>0</zPos> <Size x="20" y="30"/> <Color r="0" g="0" b="0"/> <Outline>true</Outline> </Box> </Element> <Element> <Element-Ref>/EASTADLExtensionElements/DependabilityPackage/Dependability2/BrakeControllerRequests_T_EMT/BrakeTorqueFR_fop</Element-Ref> <Name>BrakeTorqueFR_fop</Name>
116
<Box> <xPos>340</xPos> <yPos>290</yPos> <zPos>0</zPos> <Size x="20" y="30"/> <Color r="0" g="0" b="0"/> <Outline>true</Outline> </Box> </Element> <Element> <Element-Ref>/EASTADLExtensionElements/DependabilityPackage/Dependability2/BrakeControllerRequests_T_EMT/BrakeTorqueRL_fop</Element-Ref> <Name>BrakeTorqueRL_fop</Name> <Box> <xPos>340</xPos> <yPos>340</yPos> <zPos>0</zPos> <Size x="20" y="30"/> <Color r="0" g="0" b="0"/> <Outline>true</Outline> </Box> </Element> <Element> <Element-Ref>/EASTADLExtensionElements/DependabilityPackage/Dependability2/BrakeControllerRequests_T_EMT/BrakeTorqueRR_fop</Element-Ref> <Name>BrakeTorqueRR_fop</Name> <Box> <xPos>340</xPos> <yPos>390</yPos> <zPos>0</zPos> <Size x="20" y="30"/> <Color r="0" g="0" b="0"/> <Outline>true</Outline> </Box> </Element> <Element> <Element-Ref>/DesignLevelElements/FCN/BrakeControllerRequests_T</Element-Ref> <Name>BrakeControllerRequests_T</Name> <Box> <xPos>600</xPos> <yPos>220</yPos> <zPos>0</zPos> <Size x="200" y="220"/> <Color r="200" g="255" b="200"/> <Outline>true</Outline> </Box> </Element> <Element> <Element-Ref>/DesignLevelElements/FCN/BrakeControllerRequests_T/BrakeRequest</Element-Ref> <Name>BrakeRequest</Name> <Box> <xPos>590</xPos> <yPos>240</yPos> <zPos>0</zPos> <Size x="20" y="30"/>
117
<Color r="0" g="0" b="0"/> <Outline>true</Outline> </Box> </Element> <Element> <Element-Ref>/DesignLevelElements/FCN/BrakeControllerRequests_T/BrakeTorqueFL</Element-Ref> <Name>BrakeTorqueFL</Name> <Box> <xPos>790</xPos> <yPos>240</yPos> <zPos>0</zPos> <Size x="20" y="30"/> <Color r="0" g="0" b="0"/> <Outline>true</Outline> </Box> </Element> <Element> <Element-Ref>/DesignLevelElements/FCN/BrakeControllerRequests_T/BrakeTorqueFR</Element-Ref> <Name>BrakeTorqueFR</Name> <Box> <xPos>790</xPos> <yPos>290</yPos> <zPos>0</zPos> <Size x="20" y="30"/> <Color r="0" g="0" b="0"/> <Outline>true</Outline> </Box> </Element> <Element> <Element-Ref>/DesignLevelElements/FCN/BrakeControllerRequests_T/BrakeTorqueRL</Element-Ref> <Name>BrakeTorqueRL</Name> <Box> <xPos>790</xPos> <yPos>340</yPos> <zPos>0</zPos> <Size x="20" y="30"/> <Color r="0" g="0" b="0"/> <Outline>true</Outline> </Box> </Element> <Element> <Element-Ref>/DesignLevelElements/FCN/BrakeControllerRequests_T/BrakeTorqueRR</Element-Ref> <Name>BrakeTorqueRR</Name> <Box> <xPos>790</xPos> <yPos>390</yPos> <zPos>0</zPos> <Size x="20" y="30"/> <Color r="0" g="0" b="0"/> <Outline>true</Outline> </Box> </Element> <Element>

118
<Element-Ref>/EASTADLExtensionElements/DependabilityPackage/Dependability2/Diag_T_EMT</Element-Ref> <Name>Diag_T_EMT</Name> <Box> <xPos>150</xPos> <yPos>490</yPos> <zPos>0</zPos> <Size x="200" y="70"/> <Color r="255" g="200" b="200"/> <Outline>true</Outline> </Box> </Element> <Element> <Element-Ref>/EASTADLExtensionElements/DependabilityPackage/Dependability2/Diag_T_EMT/DiagRequest_receive_fip</Element-Ref> <Name>DiagRequest_receive_fip</Name> <Box> <xPos>140</xPos> <yPos>510</yPos> <zPos>0</zPos> <Size x="20" y="30"/> <Color r="0" g="0" b="0"/> <Outline>true</Outline> </Box> </Element> <Element> <Element-Ref>/EASTADLExtensionElements/DependabilityPackage/Dependability2/Diag_T_EMT/DiagRequest_request_fop</Element-Ref> <Name>DiagRequest_request_fop</Name> <Box> <xPos>340</xPos> <yPos>510</yPos> <zPos>0</zPos> <Size x="20" y="30"/> <Color r="0" g="0" b="0"/> <Outline>true</Outline> </Box> </Element> <Element> <Element-Ref>/DesignLevelElements/FCN/Diag_T</Element-Ref> <Name>Diag_T</Name> <Box> <xPos>600</xPos> <yPos>490</yPos> <zPos>0</zPos> <Size x="200" y="20"/> <Color r="200" g="255" b="200"/> <Outline>true</Outline> </Box> </Element> <Element> <Element-Ref>/EASTADLExtensionElements/DependabilityPackage/Dependability2/GlobalBrakeController_EMT</Element-Ref> <Name>GlobalBrakeController_EMT</Name> <Box>
119
<xPos>150</xPos> <yPos>610</yPos> <zPos>0</zPos> <Size x="200" y="320"/> <Color r="255" g="200" b="200"/> <Outline>true</Outline> </Box> </Element> <Element> <Element-Ref>/EASTADLExtensionElements/DependabilityPackage/Dependability2/GlobalBrakeController_EMT/BrakeRequest_fip</Element-Ref> <Name>BrakeRequest_fip</Name> <Box> <xPos>140</xPos> <yPos>630</yPos> <zPos>0</zPos> <Size x="20" y="30"/> <Color r="0" g="0" b="0"/> <Outline>true</Outline> </Box> </Element> <Element> <Element-Ref>/EASTADLExtensionElements/DependabilityPackage/Dependability2/GlobalBrakeController_EMT/DriverReqTorqueIn_fip</Element-Ref> <Name>DriverReqTorqueIn_fip</Name> <Box> <xPos>140</xPos> <yPos>680</yPos> <zPos>0</zPos> <Size x="20" y="30"/> <Color r="0" g="0" b="0"/> <Outline>true</Outline> </Box> </Element> <Element> <Element-Ref>/EASTADLExtensionElements/DependabilityPackage/Dependability2/GlobalBrakeController_EMT/WheelSpeed_FLIn_fip</Element-Ref> <Name>WheelSpeed_FLIn_fip</Name> <Box> <xPos>140</xPos> <yPos>730</yPos> <zPos>0</zPos> <Size x="20" y="30"/> <Color r="0" g="0" b="0"/> <Outline>true</Outline> </Box> </Element> <Element> <Element-Ref>/EASTADLExtensionElements/DependabilityPackage/Dependability2/GlobalBrakeController_EMT/WheelSpeed_FRIn_fip</Element-Ref> <Name>WheelSpeed_FRIn_fip</Name> <Box> <xPos>140</xPos> <yPos>780</yPos> <zPos>0</zPos>
120
<Size x="20" y="30"/> <Color r="0" g="0" b="0"/> <Outline>true</Outline> </Box> </Element> <Element> <Element-Ref>/EASTADLExtensionElements/DependabilityPackage/Dependability2/GlobalBrakeController_EMT/WheelSpeed_RLIn_fip</Element-Ref> <Name>WheelSpeed_RLIn_fip</Name> <Box> <xPos>140</xPos> <yPos>830</yPos> <zPos>0</zPos> <Size x="20" y="30"/> <Color r="0" g="0" b="0"/> <Outline>true</Outline> </Box> </Element> <Element> <Element-Ref>/EASTADLExtensionElements/DependabilityPackage/Dependability2/GlobalBrakeController_EMT/WheelSpeed_RRIn_fip</Element-Ref> <Name>WheelSpeed_RRIn_fip</Name> <Box> <xPos>140</xPos> <yPos>880</yPos> <zPos>0</zPos> <Size x="20" y="30"/> <Color r="0" g="0" b="0"/> <Outline>true</Outline> </Box> </Element> <Element> <Element-Ref>/EASTADLExtensionElements/DependabilityPackage/Dependability2/GlobalBrakeController_EMT/BrakeTorqueFL_fop</Element-Ref> <Name>BrakeTorqueFL_fop</Name> <Box> <xPos>340</xPos> <yPos>630</yPos> <zPos>0</zPos> <Size x="20" y="30"/> <Color r="0" g="0" b="0"/> <Outline>true</Outline> </Box> </Element> <Element> <Element-Ref>/EASTADLExtensionElements/DependabilityPackage/Dependability2/GlobalBrakeController_EMT/BrakeTorqueFR_fop</Element-Ref> <Name>BrakeTorqueFR_fop</Name> <Box> <xPos>340</xPos> <yPos>680</yPos> <zPos>0</zPos> <Size x="20" y="30"/> <Color r="0" g="0" b="0"/> <Outline>true</Outline>

121
</Box> </Element> <Element> <Element-Ref>/EASTADLExtensionElements/DependabilityPackage/Dependability2/GlobalBrakeController_EMT/BrakeTorqueRL_fop</Element-Ref> <Name>BrakeTorqueRL_fop</Name> <Box> <xPos>340</xPos> <yPos>730</yPos> <zPos>0</zPos> <Size x="20" y="30"/> <Color r="0" g="0" b="0"/> <Outline>true</Outline> </Box> </Element> <Element> <Element-Ref>/EASTADLExtensionElements/DependabilityPackage/Dependability2/GlobalBrakeController_EMT/BrakeTorqueRR_fop</Element-Ref> <Name>BrakeTorqueRR_fop</Name> <Box> <xPos>340</xPos> <yPos>780</yPos> <zPos>0</zPos> <Size x="20" y="30"/> <Color r="0" g="0" b="0"/> <Outline>true</Outline> </Box> </Element> <Element> <Element-Ref>/DesignLevelElements/FCN/GlobalBrakeController</Element-Ref> <Name>GlobalBrakeController</Name> <Box> <xPos>600</xPos> <yPos>560</yPos> <zPos>0</zPos> <Size x="200" y="320"/> <Color r="200" g="255" b="200"/> <Outline>true</Outline> </Box> </Element> <Element> <Element-Ref>/DesignLevelElements/FCN/GlobalBrakeController/BrakeRequest</Element-Ref> <Name>BrakeRequest</Name> <Box> <xPos>590</xPos> <yPos>580</yPos> <zPos>0</zPos> <Size x="20" y="30"/> <Color r="0" g="0" b="0"/> <Outline>true</Outline> </Box> </Element> <Element> <Element-Ref>/DesignLevelElements/FCN/GlobalBrakeController/DriverReqTorqueIn</Element-Ref> <Name>DriverReqTorqueIn</Name>
122
<Box> <xPos>590</xPos> <yPos>630</yPos> <zPos>0</zPos> <Size x="20" y="30"/> <Color r="0" g="0" b="0"/> <Outline>true</Outline> </Box> </Element> <Element> <Element-Ref>/DesignLevelElements/FCN/GlobalBrakeController/WheelSpeed_FLIn</Element-Ref> <Name>WheelSpeed_FLIn</Name> <Box> <xPos>590</xPos> <yPos>680</yPos> <zPos>0</zPos> <Size x="20" y="30"/> <Color r="0" g="0" b="0"/> <Outline>true</Outline> </Box> </Element> <Element> <Element-Ref>/DesignLevelElements/FCN/GlobalBrakeController/WheelSpeed_FRIn</Element-Ref> <Name>WheelSpeed_FRIn</Name> <Box> <xPos>590</xPos> <yPos>730</yPos> <zPos>0</zPos> <Size x="20" y="30"/> <Color r="0" g="0" b="0"/> <Outline>true</Outline> </Box> </Element> <Element> <Element-Ref>/DesignLevelElements/FCN/GlobalBrakeController/WheelSpeed_RLIn</Element-Ref> <Name>WheelSpeed_RLIn</Name> <Box> <xPos>590</xPos> <yPos>780</yPos> <zPos>0</zPos> <Size x="20" y="30"/> <Color r="0" g="0" b="0"/> <Outline>true</Outline> </Box> </Element> <Element> <Element-Ref>/DesignLevelElements/FCN/GlobalBrakeController/WheelSpeed_RRIn</Element-Ref> <Name>WheelSpeed_RRIn</Name> <Box> <xPos>590</xPos> <yPos>830</yPos> <zPos>0</zPos> <Size x="20" y="30"/> <Color r="0" g="0" b="0"/> <Outline>true</Outline>
123
</Box> </Element> <Element> <Element-Ref>/DesignLevelElements/FCN/GlobalBrakeController/BrakeTorqueFL</Element-Ref> <Name>BrakeTorqueFL</Name> <Box> <xPos>790</xPos> <yPos>580</yPos> <zPos>0</zPos> <Size x="20" y="30"/> <Color r="0" g="0" b="0"/> <Outline>true</Outline> </Box> </Element> <Element> <Element-Ref>/DesignLevelElements/FCN/GlobalBrakeController/BrakeTorqueFR</Element-Ref> <Name>BrakeTorqueFR</Name> <Box> <xPos>790</xPos> <yPos>630</yPos> <zPos>0</zPos> <Size x="20" y="30"/> <Color r="0" g="0" b="0"/> <Outline>true</Outline> </Box> </Element> <Element> <Element-Ref>/DesignLevelElements/FCN/GlobalBrakeController/BrakeTorqueRL</Element-Ref> <Name>BrakeTorqueRL</Name> <Box> <xPos>790</xPos> <yPos>680</yPos> <zPos>0</zPos> <Size x="20" y="30"/> <Color r="0" g="0" b="0"/> <Outline>true</Outline> </Box> </Element> <Element> <Element-Ref>/DesignLevelElements/FCN/GlobalBrakeController/BrakeTorqueRR</Element-Ref> <Name>BrakeTorqueRR</Name> <Box> <xPos>790</xPos> <yPos>730</yPos> <zPos>0</zPos> <Size x="20" y="30"/> <Color r="0" g="0" b="0"/> <Outline>true</Outline> </Box> </Element> <Connector> <From x="350" y="110"/> <To x="600" y="110"/> </Connector> <Connector>

124
<From x="350" y="330"/> <To x="600" y="330"/> </Connector> <Connector> <From x="350" y="525"/> <To x="600" y="500"/> </Connector> <Connector> <From x="350" y="770"/> <To x="600" y="720"/> </Connector> </Diagram>
125
Appendix D – I Interview
Presentation Slides
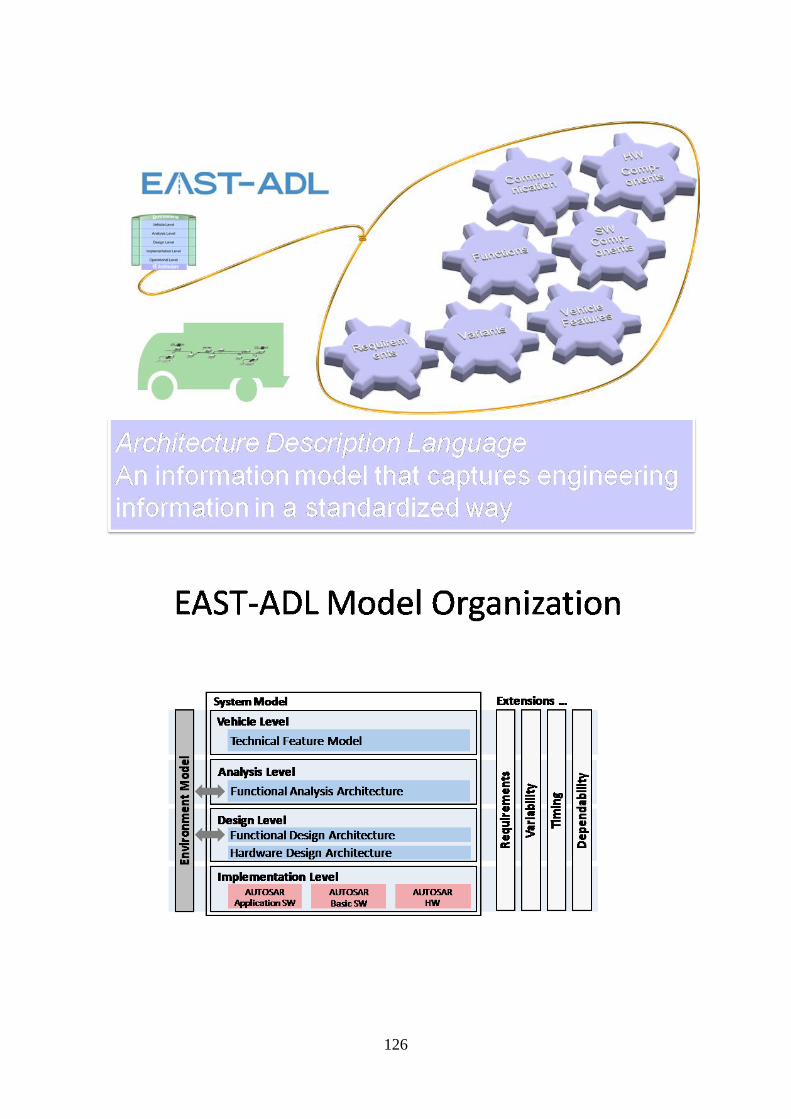
126
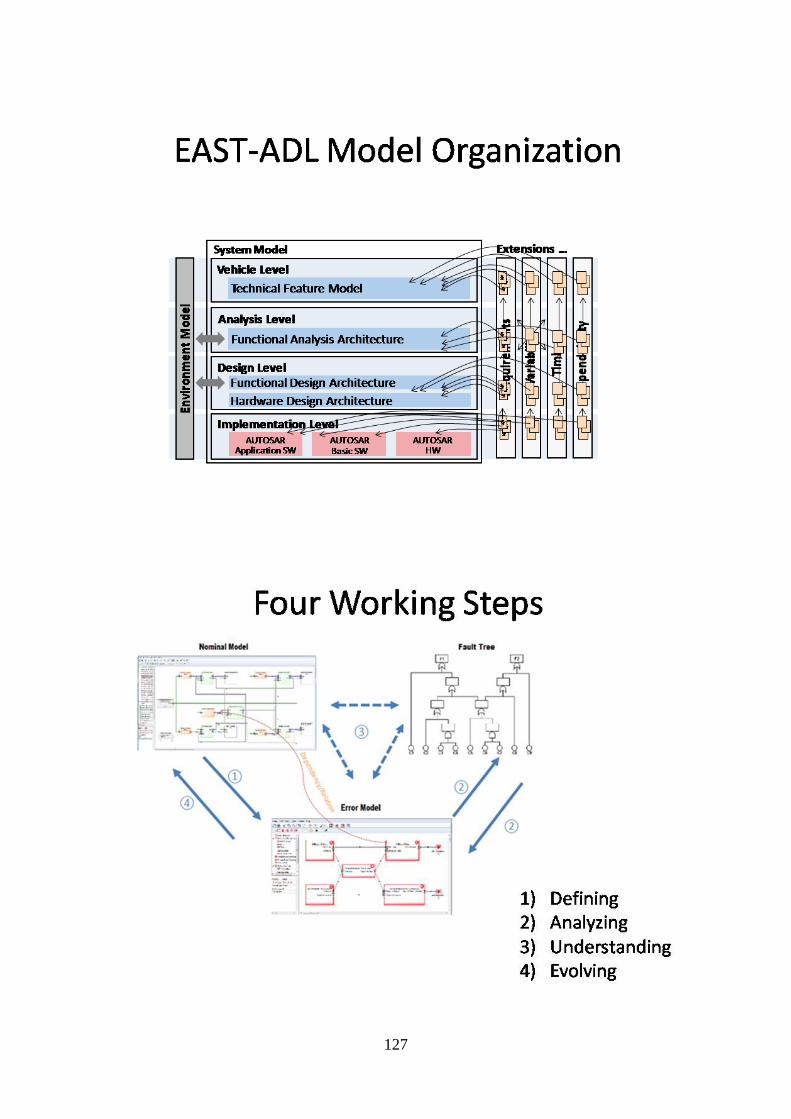
127
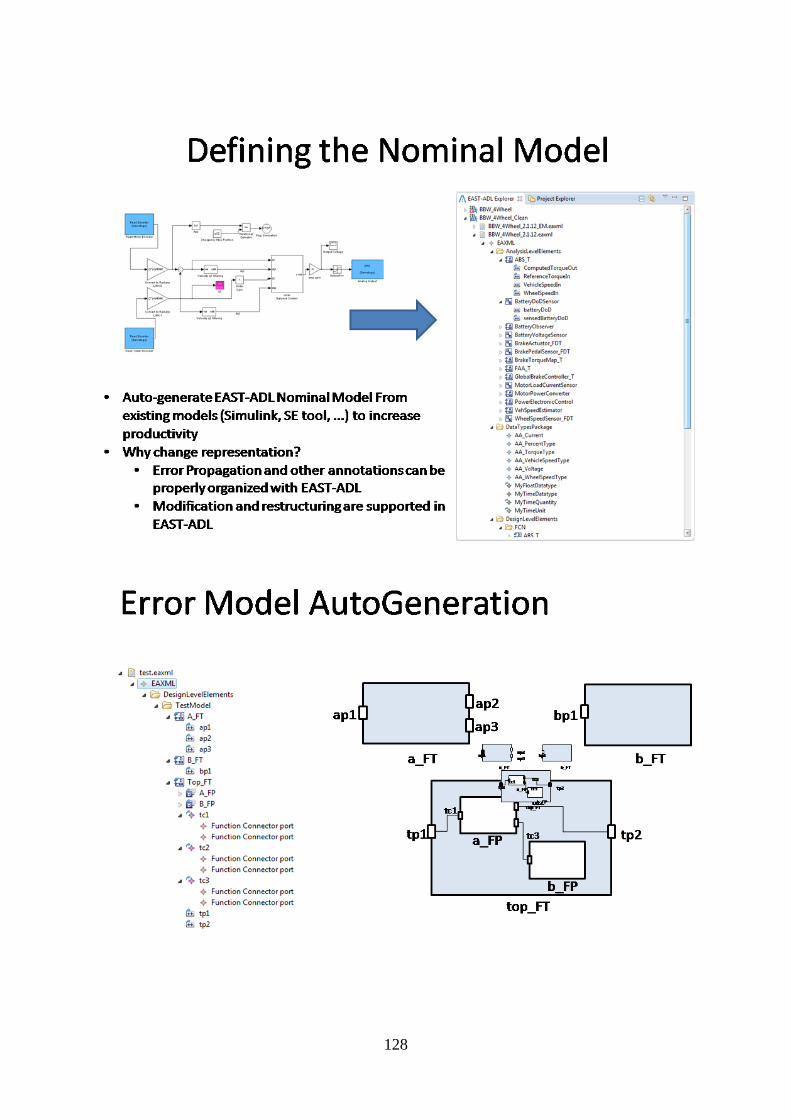
128
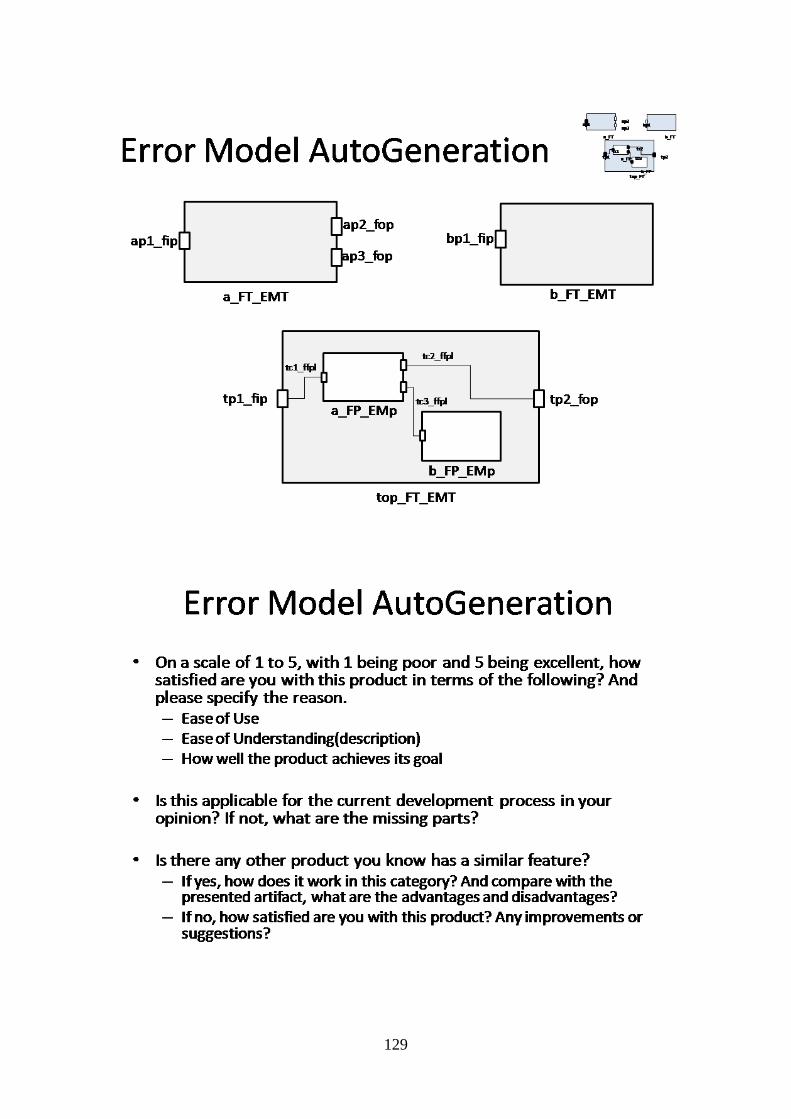
129
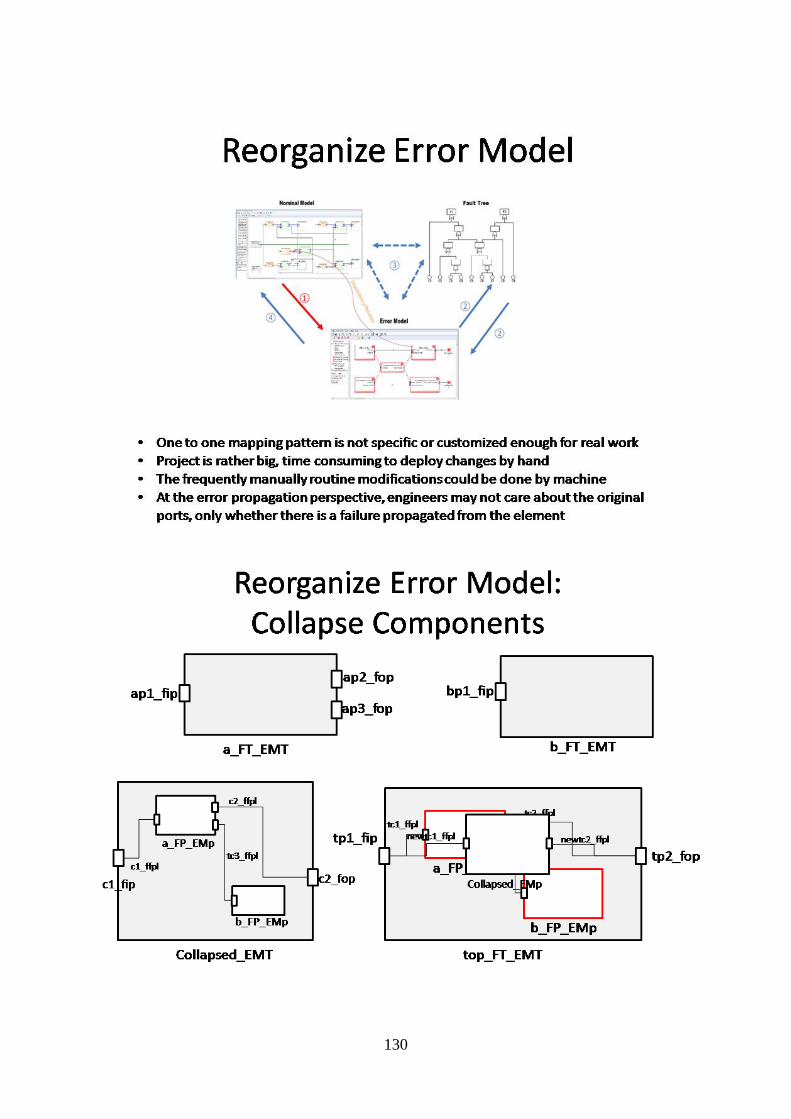
130
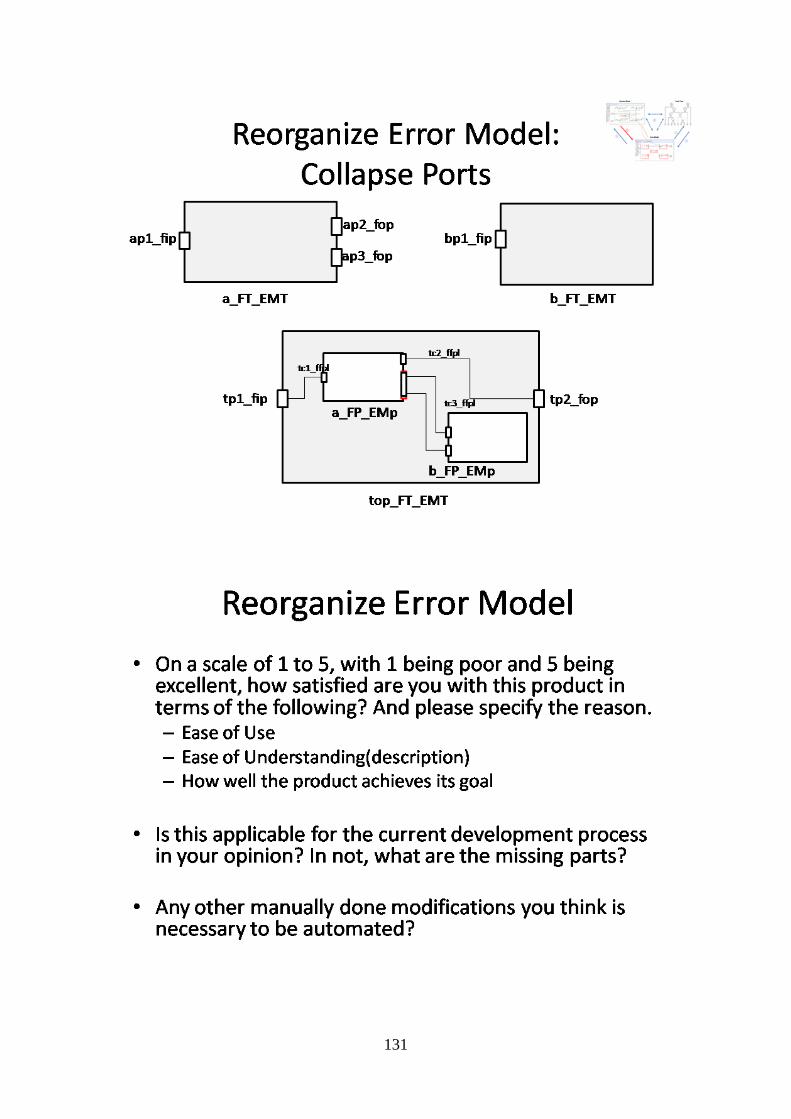
131
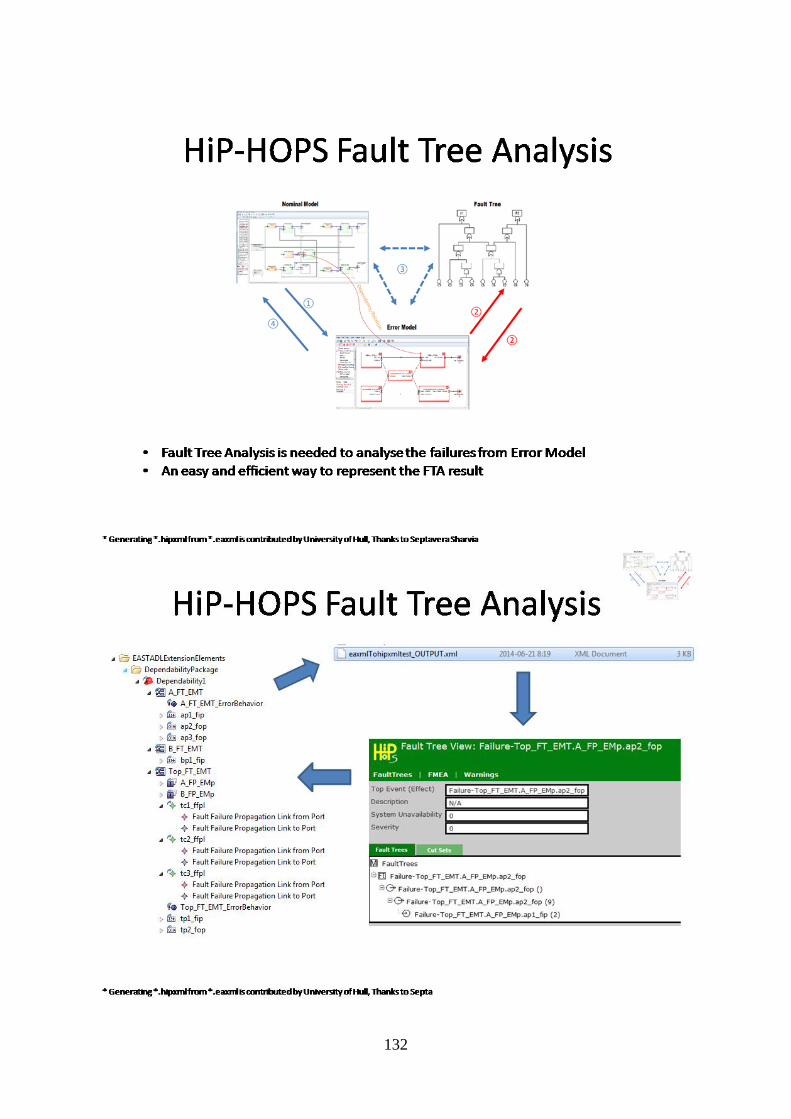
132
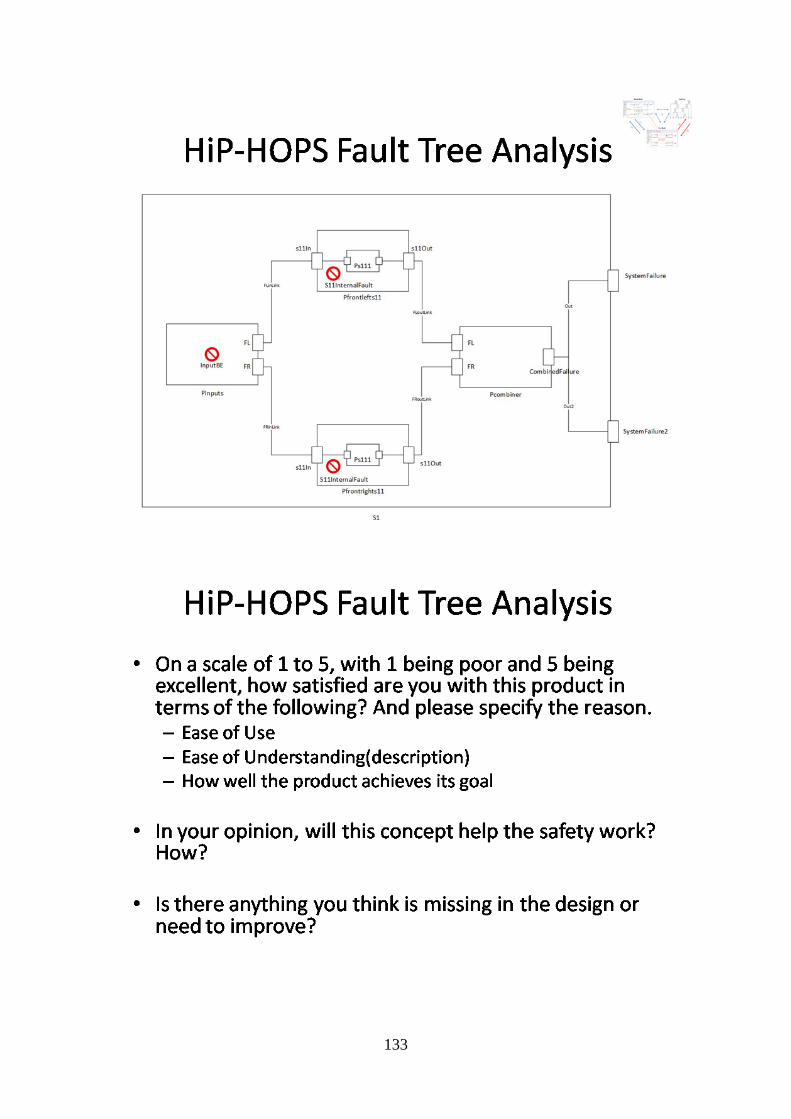
133
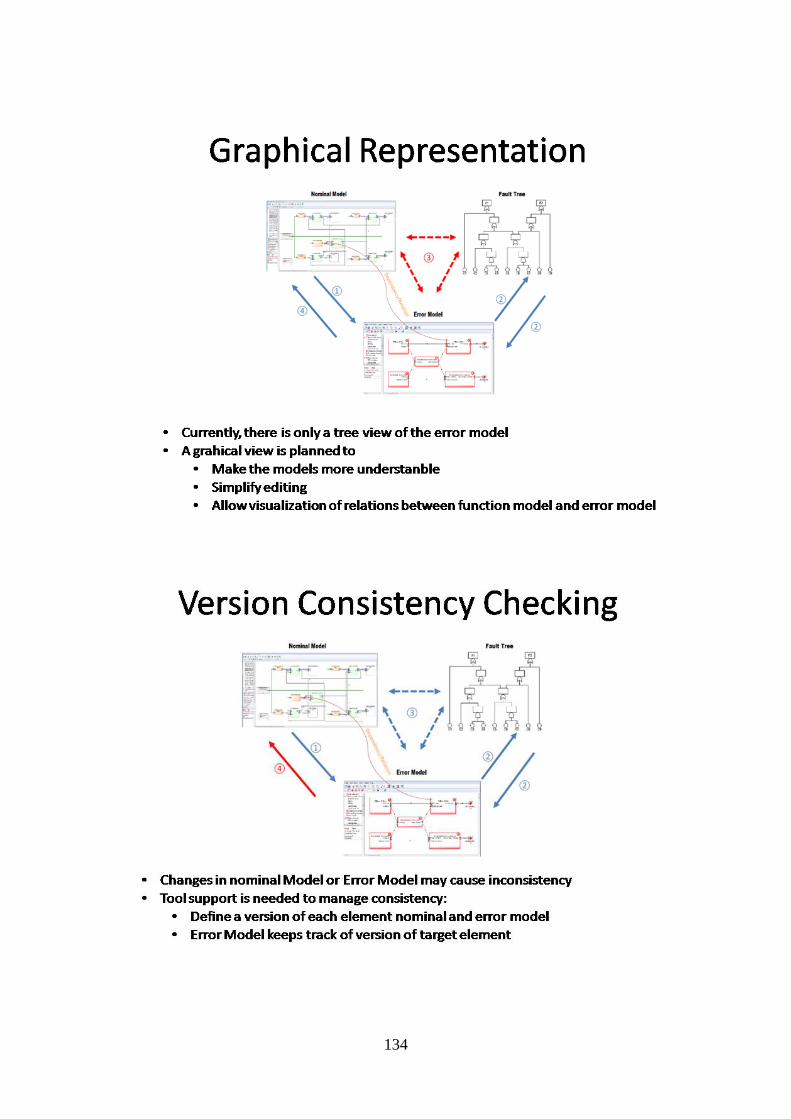
134
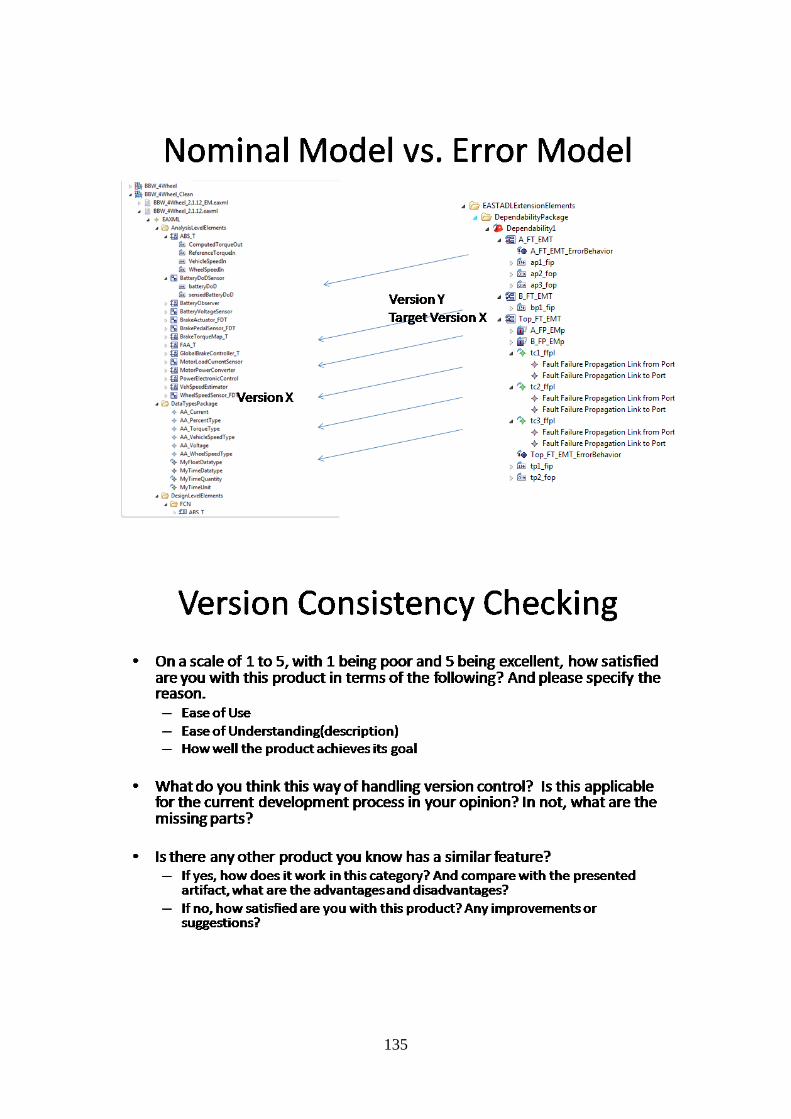
135
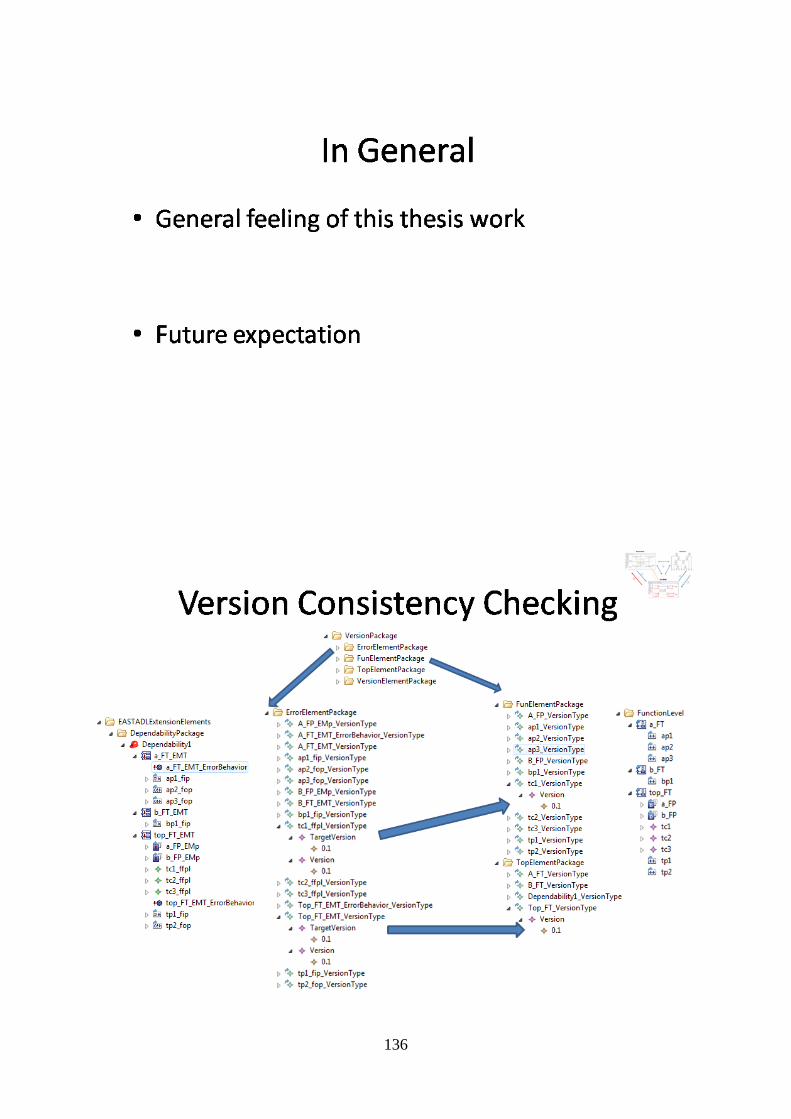
136
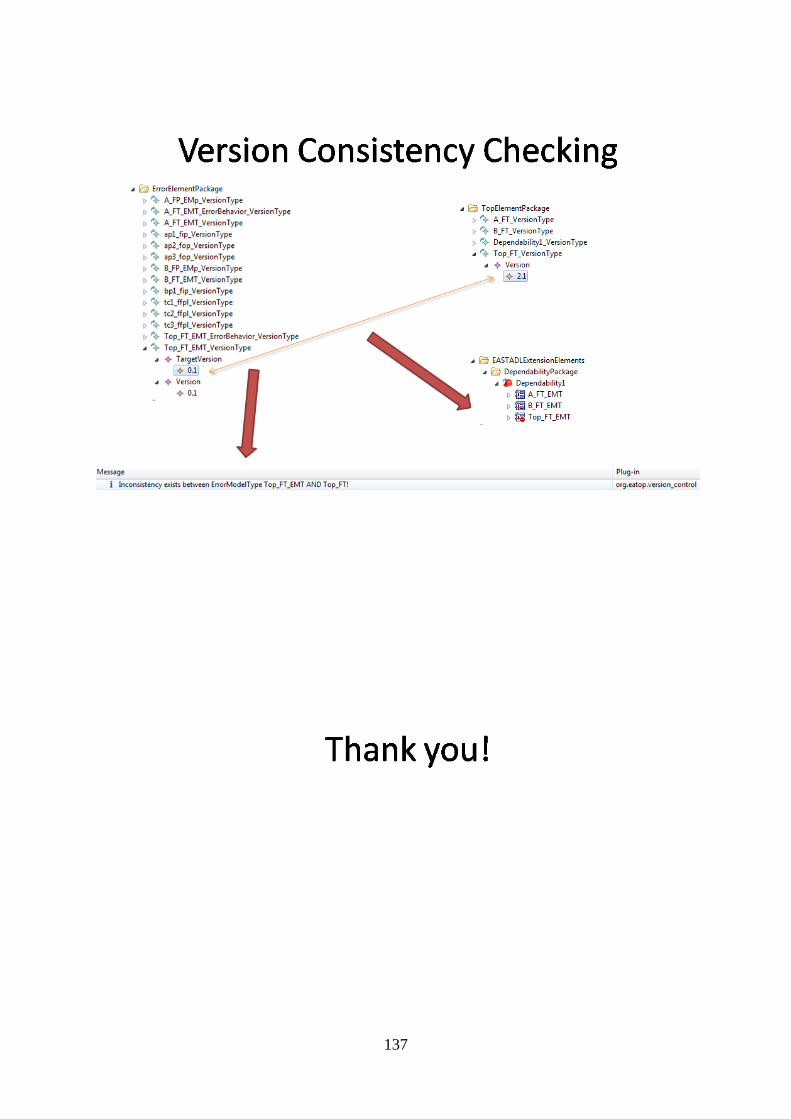
137

138
Appendix D – II Interview
Questionaire Date: Participant:
Question : Error Model Auto Generation
• On a scale of 1 to 5, with 1 being poor and 5 being excellent, how satisfied are you
with this product in terms of the following? And please specify the reason.
– Ease of Use
– Ease of Understanding(description)
– How well the product achieves its goal
• Is this applicable for the current development process in your opinion? If not, what are
the missing parts?
• Is there any other product you know has a similar feature?
– If yes, how does it work in this category? And compare with the presented
artifact, what are the advantages and disadvantages?
– If no, how satisfied are you with this product? Any improvements or
suggestions?
Question : Re-organize Error Model
• On a scale of 1 to 5, with 1 being poor and 5 being excellent, how satisfied are you
with this product in terms of the following? And please specify the reason.
– Ease of Use
– Ease of Understanding(description)
– How well the product achieves its goal
• Is this applicable for the current development process in your opinion? In not, what are
the missing parts?
• Any other manually done modifications you think is necessary to be automated?
Question : HiP-HOPS Fault Tree Analysis
• On a scale of 1 to 5, with 1 being poor and 5 being excellent, how satisfied are you
with this product in terms of the following? And please specify the reason.
– Ease of Use
– Ease of Understanding(description)
– How well the product achieves its goal
139
• In your opinion, will this concept help the safety work? How?
• Is there anything you think is missing in the design or need to improve?
Question : Consistency Checking
• On a scale of 1 to 5, with 1 being poor and 5 being excellent, how satisfied are you
with this product in terms of the following? And please specify the reason.
– Ease of Use
– Ease of Understanding(description)
– How well the product achieves its goal
• What do you think this way of handling version control? Is this applicable for the
current development process in your opinion? In not, what are the missing parts?
• Is there any other product you know has a similar feature?
– If yes, how does it work in this category? And compare with the presented
artifact, what are the advantages and disadvantages?
– If no, how satisfied are you with this product? Any improvements or
suggestions?
Question : General
• General feeling of this thesis work
• Future expectation