Embed Size (px)
Citation preview
The author(s) shown below used Federal funds provided by the U.S. Department of Justice and prepared the following final report:
Document Title: Safe Kids, Safe Schools: Evaluating the Use of Iris Recognition Technology in New Egypt, NJ
Author(s): Craig D. Uchida ; Edward R. Maguire ; Shellie E. Solomon ; Megan Gantley
Document No.: 208127
Date Received: December 2004
Award Number: 2002-RD-CX-K002
This report has not been published by the U.S. Department of Justice. To provide better customer service, NCJRS has made this Federally-funded grant final report available electronically in addition to traditional paper copies.
Opinions or points of view expressed are those of the author(s) and do not necessarily reflect
the official position or policies of the U.S. Department of Justice.

Consulting on Crime and Public Policy
Dr. Craig D. Uchida President
Safe Kids, Safe Schools: Evaluating the Use of Iris Recognition Technology
in New Egypt, NJ
Executive Summary
21st
21st
st
P.O. Box 12279 Silver Spring, MD 20908
(301) 438-3132 Fax: (301) 438-3134
Email: [email protected] Website: l i
Craig D. Uchida Century Solutions, Inc.
Edward R. Maguire Crime and Justice Analysts &
George Mason University
Shellie E. Solomon Century Solutions, Inc.
Megan Gantley Crime and Justice Analysts &
George Mason University
The research described in this report was made possible through grant number 2002-RDCX-K002 from the National Institute of Justice (NIJ), U.S. Department of Justice. Any errors of fact, omission, or interpretation are those of the authors and are not the responsibility of the Plumsted Township School District, the National Institute of Justice or the U.S. Department of Justice. Copyright © by Craig D. Uchida and 21 Century Solutions, Inc. The U.S. Department of Justice reserves a royalty-free, nonexclusive, and irrevocable license to reproduce, publish or otherwise use, and to authorize others to use, this document for Federal Government purposes. No part of this document may be reproduced in any forms, by any means (including electronic, photocopying, recording or otherwise) without the prior written permission of the U.S. Department of Justice and the authors.
www.e-21stCenturySo ut ons.com
This document is a research report submitted to the U.S. Department of Justice. This report has not been published by the Department. Opinions or points of view expressed are those of the author(s) and do not necessarily reflect the official position or policies of the U.S. Department of Justice.

Safe Kids, Safe Schools: Evaluating the Use of Iris Recognition Technology in New Egypt, NJ
Executive Summary
Introduction
This executive summary describes the implementation and impact of iris
recognition technology in three schools in Plumsted Township, New Jersey. In
September 2002, the Plumsted Township School District received a federal grant in the
amount of $293,360 from the National Institute of Justice’s Office of Science and
Technology to purchase and deploy iris recognition technology in its three schools: New
Egypt Elementary School (NEES), New Egypt Middle School (NEMS), and New Egypt
High School (NEHS). The project was named T-PASS: Teacher-Parent Authorization
Security System.
Plumsted Township’s Board of Education partnered with New Jersey Business
Systems of Robbinsville, NJ, an authorized New Jersey state contract vendor, to develop,
deploy, and implement iris recognition technology and software. Together, they selected
the iris recognition technology developed by Iridian Technologies of Moorestown, NJ.
This identification technology was then combined with an Entry Access Control system
developed by Biometric Solutions Group of Charleston, SC. These two sets of
technologies were designed to identify teachers and staff seeking to enter the schools,
make a decision about whether to grant entry, and to unlock the doors if the person was
approved. A second application was used as an identification system for parents who
wanted to pick up their children before the end of the school day at the elementary
school. Parents voluntarily participated to have their irises scanned rather than signing in
21st Century Solutions, Inc. i
This document is a research report submitted to the U.S. Department of Justice. This report has not been published by the Department. Opinions or points of view expressed are those of the author(s) and do not necessarily reflect the official position or policies of the U.S. Department of Justice.

and showing identification to the office staff.
NIJ’s Office of Research and Evaluation provided a grant to 21st Century
Solutions, Inc. to conduct an independent evaluation of the project. 21st Century
Solutions, Inc., a Maryland-based consulting and research company, was awarded a
cooperative agreement in September 2002 for $148,997 to carry out the evaluation.
This executive summary presents the findings of the comprehensive evaluation.
The evaluation answered a number of questions: Does the technology work in a school
setting? What is the impact of iris technology in the school district? Do faculty, staff,
and parents feel safer or more secure? What are the unintended consequences of the
technology? What lessons can be learned for implementing it in other schools? In what
ways might it be improved?
The Setting: Plumsted Township, NJ
Plumsted Township is located in Ocean County, New Jersey in the geographical
center of the state. New Egypt, where the three schools in this study are located, lies
within Plumsted Township.
Plumsted Township is racially homogeneous; only 6.1% of its residents are
nonwhite, compared with 27.4% for New Jersey and 24.9% for the United States as a
whole. It also had a higher median household income in 2000 than both New Jersey and
the United States. Plumsted Township’s median household income was $61,357,
compared with $55,146 for New Jersey, and $41,994 for the United States (Census,
2000). Plumsted Township also has fewer than half the proportion of renter occupied
housing units than the averages for New Jersey and the United States, lower population
21st Century Solutions, Inc. i
This document is a research report submitted to the U.S. Department of Justice. This report has not been published by the Department. Opinions or points of view expressed are those of the author(s) and do not necessarily reflect the official position or policies of the U.S. Department of Justice.

mobility, fewer individuals and families living beneath the poverty line, a lower
unemployment rate, a higher proportion of high school graduates, but a lower proportion
of people with a Bachelor’s degree or higher.
The Plumsted Township School District is comprised of three schools ranging
from grades K–12, and was responsible for educating more than 1,700 students in the
2002-2003 school year. The District has one elementary school, one middle school, and
one high school. The elementary school houses special education pre-kindergarten
through fourth grade. The middle school houses fifth through eighth grade, and the high
school houses ninth through twelfth grade. Both the middle school and the high school
were built within the past seven years. In September 2004 a new primary school for pre-
K to first grade will open, which will alleviate some of the crowding at the elementary
school.
Iris Recognition Technology
Iris recognition technology uses a video camera to take a picture of a person’s
eyes and then compares the images to information in a computer database. A stored
image of the iris and personal information are included in the database. Like fingerprints,
the human iris is unique to each individual. Unlike other technologies, however, iris
recognition does not require physical contact with the individual. It is, therefore, one of
the least intrusive technologies currently available. It has been proven to work with
people wearing glasses and contact lenses and in the identification of all ethnic groups.
In addition, research has shown that the likelihood of a false negative (an
authorized person is denied access) and/or a false positive (an unauthorized person is
21st Century Solutions, Inc. i
This document is a research report submitted to the U.S. Department of Justice. This report has not been published by the Department. Opinions or points of view expressed are those of the author(s) and do not necessarily reflect the official position or policies of the U.S. Department of Justice.

given access) is much lower for iris recognition than for other biometric technologies,
including fingerprints, hand geometry, and facial recognition. False negatives occur in
only .1% to .2% of cases, while false positives occur once in approximately 1.2 million
cases (Iridian Technologies, 2002). These are only estimates of course, especially when
considering that there is a compensatory relationship between false negatives and false
positives – the sensitivity level of the iris scanning software can be adjusted to suit the
needs of its application.1
The Evaluation
From October 2002 to July 2003, staff from 21st Century Solutions, Inc.
conducted a process and impact evaluation of iris recognition in New Egypt’s
elementary, middle, and high schools. The evaluation relied on a number of different
research methods, including both qualitative and quantitative approaches. The research
team visited New Egypt on numerous occasions to interview teachers, staff, parents,
visitors, and other stakeholders; we observed the use of the iris scanners, informally and
formally, using systematic social observation methods; we administered surveys to
parents and teachers; and we collected “official” data on school visitation patterns. All of
these methods were intended to shed light on two key issues: what was the experience of
the schools in implementing iris recognition technology, and what was the overall impact
of the technology.
1 In a prison setting, for instance, one would adjust the software to ensure that the chances of a false positive are negligible; to do otherwise would be to increase the probability of an escape. Doing so, however, would result in a higher false negative rate, which would mean that some people might be “rejected” when in fact they should have been accepted.
21st Century Solutions, Inc. i
This document is a research report submitted to the U.S. Department of Justice. This report has not been published by the Department. Opinions or points of view expressed are those of the author(s) and do not necessarily reflect the official position or policies of the U.S. Department of Justice.

Implementation
The Assistant Superintendent and the Technology Coordinator of the Plumsted
Township School District were responsible for the project. They worked with New
Jersey Business Systems and other vendors to install T-PASS. After careful planning,
purchase, and installation, the group successfully implemented the iris recognition
technology during the 2002-03 school year. Eleven cameras were installed in three
schools. Five cameras were placed outdoors and six cameras were placed in vestibules in
the schools. We found:
¾ Teachers, staff, and parents were enrolled in the T-PASS program with very few problems; only one teacher could not be enrolled.
¾ During the first few days of implementation, some problems with the system arose – the cameras would “freeze up” and become inoperable. Signage regarding the use of the buzzer and iris cameras was confusing to users and some individuals had problems looking into the cameras and gaining access to the buildings. Overall, however, the use of the technology was successful.
¾ During the project period, 78 percent of the transactions were successful; that is, a person seeking entry was validated and allowed to enter. In 5.8 percent of transactions entry was denied because the person was not enrolled and thus not allowed to enter using their irises for validation.
¾ When cameras were placed indoors, the system worked well. In outdoor locations, the glare from the sun and other lighting problems prevented individuals from using the cameras properly.
¾ Teachers using T-PASS believed that it provided more security in schools than in previous years. Over half felt that using T-PASS was more convenient than the buzzer system.
¾ Parents using T-PASS believed that it provided more security than in previous school years. They also believed that it was easier to use than the buzzer system.
¾ Sixty percent of parents who signed out their child from school during school hours and used T-PASS believed that it provided more security than the old process. They also believed it was easier to use than the sign-out method.
21st Century Solutions, Inc. i
This document is a research report submitted to the U.S. Department of Justice. This report has not been published by the Department. Opinions or points of view expressed are those of the author(s) and do not necessarily reflect the official position or policies of the U.S. Department of Justice.

¾ Observations indicated that tailgating (following a person into the building without buzzing or using the scanner) occurred routinely.
Impact Findings
To measure the impact of the iris recognition technology, we conducted surveys
of parents and teachers, observed activities, and interviewed key participants in the
project.
Impact on parents
To determine the impact on parents, two waves of surveys were conducted and
analysis done on the changes that occurred between the first and second waves of the
surveys. We found:
¾ No significant change in perceptions of problems existing at school, perceptions of safety around/in the school, or in the efficiency of the sign-in process;
¾ Perceptions of problems in the neighborhood decreased slightly but this decrease was not statistically significant.
¾ Perceptions of security increased significantly from wave one to wave two;
¾ Perceptions that “getting into the school building without being noticed is easy” and “propping open the doors that are locked is common practice at the school” decreased significantly;
¾ Parents enrolled in the system were able to leave much faster than those parents still waiting to sign themselves out manually;
¾ People who used the iris scanners perceived increases in the number of problems in school and in the neighborhood relative to those using the buzzer.
¾ Changes in perceptions of safety, security, and efficiency were no different for those using the iris scanners than they were for those using the buzzers.
Impact on teachers and staff
We also conducted two waves of surveys of teachers and staff. We found:
21st Century Solutions, Inc. i
This document is a research report submitted to the U.S. Department of Justice. This report has not been published by the Department. Opinions or points of view expressed are those of the author(s) and do not necessarily reflect the official position or policies of the U.S. Department of Justice.

¾ Teachers perceived significantly more problems in the school and in the neighborhood, than parents;
¾ Teachers perceived the school to be safer than parents did;
¾ Teachers and staff in all three schools experienced significant decreases in their perceptions that “getting into the school building without being noticed is easy”;
¾ Perceptions of security at the elementary and middle schools increased significantly;
¾ Teachers and staff at the elementary school experienced a significant decrease in their perception that “propping open the doors that are locked is common practice in the school”; teachers and staff at the other schools showed no change in this perception;
¾ The strongest support for iris technology came from the elementary school secretaries who said that it “significantly cut down on the amount of parents walking around the school trying to find their kids.”
General Recommendations
The following recommendations are general in scope and are intended for those
schools, security directors or managers of buildings, and homeland security experts with
interest in access control devices.
Recommendation 1. Overall, we found that iris recognition technology coupled with the
buzzer system can potentially be an effective way to control access and try during school
hours if coupled with other less expensive and more mundane security measures. Iris
recognition equipment should be one part of a school-wide or system-wide policy on
physical access control and physical security.
Recommendation 2. If iris recognition technology is used in other schools we
21st Century Solutions, Inc. i
This document is a research report submitted to the U.S. Department of Justice. This report has not been published by the Department. Opinions or points of view expressed are those of the author(s) and do not necessarily reflect the official position or policies of the U.S. Department of Justice.

recommend that school administrators and security personnel pay close attention to
tailgating and to include policies that will prevent doors from being propped open or
unlocked.
Our security surveys found certain doors open or unlocked routinely. One doorway had a
brick, used to prop open the doors, located in the foyer throughout the evaluation period.
Students and teachers were routinely willing to open doors for us when we would try to
open locked doors during our security surveys. Teachers propped open one side entrance
at the high school when the iris scanners malfunctioned. The electrical room in the high
school was left unlocked; from it, one could shut down all the power in both the middle
school and the high school, which would shut down all the iris scanners and lock all the
exterior doors. Iris scanners cannot work effectively in an environment where other,
sometimes simple, elements of physical access control are not taken into account.
Recommendation 3. The efficacy of iris scanning as a physical access control measure
can be improved by taking into account the architectural features of its environment. For
many years, police, security experts, and criminologists have been aware of the role that
the physical environment can play in security, crime, and violence. Crime prevention
through environmental design, or CPTED, is the term used to describe efforts to improve
security and safety through changes in the physical environment. Several members of the
research team, including one elementary school teacher with experience in several
jurisdictions, were surprised by the design of the entrance to New Egypt Elementary
School. With just a few parents or visitors in the main office, the office staff has an
21st Century Solutions, Inc. i
This document is a research report submitted to the U.S. Department of Justice. This report has not been published by the Department. Opinions or points of view expressed are those of the author(s) and do not necessarily reflect the official position or policies of the U.S. Department of Justice.

obscured view of the main lobby. When the office is crowded, it would be very easy for
somebody to tailgate their way through the front doors and enter the school without being
seen. Iris scanners, therefore, should be implemented together with architectural
planning that takes into account the ability for office staff to see clearly all who enter.
Recommendation 4. Iris scanners and/or appropriate housing devices need further
development before being installed outdoors. We found significant camera error rates for
the outdoor cameras. Glare from the sun seemed to be a primary problem, though we
also documented significant failures on overcast days and in installations that were not in
direct light. A method needs to be designed for installing the cameras outside that shields
them from the elements, protects them from vandalism, but still permits them to work as
intended.
Recommendation 5. Future field evaluations of iris recognition and other biometric
access control measures should address tailgating, should adopt a longer evaluation time
frame, and should test the technology in a setting with a higher base rate of crime and
disorder and a more heterogeneous population.
Recommendation 6. School security technologies, including iris recognition, appear to
have the twin effects of increasing perceptions of security and increasing the number of
perceived problems. These effects need to be anticipated, studied, and addressed by
evaluators and school authorities.
21st Century Solutions, Inc. i
This document is a research report submitted to the U.S. Department of Justice. This report has not been published by the Department. Opinions or points of view expressed are those of the author(s) and do not necessarily reflect the official position or policies of the U.S. Department of Justice.

Specific Recommendations for the Plumsted Township School District
In addition to the general recommendations noted above and based on our
findings and observations we make the following specific recommendations to the
Plumsted Township School District:
Recommendation 1. Because of the overall success of specific cameras in specific
locations, we recommend that the iris cameras located in enclosed entryways or
vestibules should remain in use. Cameras located in outdoor areas where the success rate
was less than 75% should be re-located.
Recommendation 2. Iris scanning can significantly reduce the work of front office staff
if it is complemented by software designed to automatically print labels for each
incoming visitor. Asking visitors who have already been admitted via iris recognition to
sign-in and make a label for themselves is inefficient, when a label could be waiting for
them upon arrival in the front office. This is particularly true during peak periods of
activity when the front office becomes congested with visitors. Using labels may also
reduce the number of tailgaters, as labels would only be printed if a visitor has used the
scanner.
Recommendation 3. With strong support of the iris recognition technology in the
sample of parents at the New Egypt Elementary School, we recommend that it be used
for all parents to obtain release of their child/children during school hours. With the
construction of the New Egypt Primary School, we recommend that the school district
enroll parents in a similar fashion at the primary school.
21st Century Solutions, Inc. i
This document is a research report submitted to the U.S. Department of Justice. This report has not been published by the Department. Opinions or points of view expressed are those of the author(s) and do not necessarily reflect the official position or policies of the U.S. Department of Justice.

Recommendation 4. Iris recognition cameras should be moved from the current outdoor
locations that are ineffective to the New Egypt Primary School for use by parents and
school staff. In addition, we recommend that the buzzer system and video cameras be
placed at entrances at the primary school.
Recommendation 5. Video camera images of the entrances should be on computer
screens at all times. We found that staff did not use the video images because their
computers would work slower and less efficiently. We recommend that separate
computer monitors be used for video camera images only and should be located near the
intercoms on desks of staff in the front offices of each school.
Recommendation 6. Appropriate staff at each school should receive training to enroll
new teachers and employees in iris recognition technology.
Recommendation 7. Training in the use of iris recognition technology should be
provided to all school staff prior to the beginning of the school year.
Recommendation 8. Training in the purpose and use of iris recognition technology
should be provided to all parents at the New Egypt Elementary and Primary Schools.
21st Century Solutions, Inc. i
This document is a research report submitted to the U.S. Department of Justice. This report has not been published by the Department. Opinions or points of view expressed are those of the author(s) and do not necessarily reflect the official position or policies of the U.S. Department of Justice.

Recommendation 9. Policies and procedures should be provided to all school staff and
parents regarding iris recognition technology, the use of buzzers, general security
measures (such as keeping doors locked and not tailgating) and other safety precautions
21st Century Solutions, Inc. i
This document is a research report submitted to the U.S. Department of Justice. This report has not been published by the Department. Opinions or points of view expressed are those of the author(s) and do not necessarily reflect the official position or policies of the U.S. Department of Justice.

Consulting on Crime and Public Policy
Dr. Craig D. Uchida President
Safe Kids, Safe Schools: Evaluating the Use of Iris Recognition Technology
in New Egypt, NJ
21st
21st
P.O. Box 12279 Silver Spring, MD 20908
(301) 438-3132 Fax: (301) 438-3134
Email: [email protected] Website: l i
Craig D. Uchida Century Solutions, Inc.
Edward R. Maguire Crime and Justice Analysts &
George Mason University
Shellie E. Solomon Century Solutions, Inc.
Megan Gantley Crime and Justice Analysts &
George Mason University
Final Report August 2004
www.e-21stCenturySo ut ons.com
This document is a research report submitted to the U.S. Department of Justice. This report has not been published by the Department. Opinions or points of view expressed are those of the author(s) and do not necessarily reflect the official position or policies of the U.S. Department of Justice.

Acknowledgements
A thorough evaluation depends heavily on the time, commitment, energy, and passion of many stakeholders. We are grateful for the assistance and contributions of the people of Plumsted Township and New Egypt, NJ.
We thank the Plumsted Township School District Board of Education and Superintendent Dr. Gerald Woehr for allowing us to conduct our study and giving us unlimited access to their schools.
We thank Plumsted Township’s former Assistant Superintendent, Philip J. Meara, for his objectivity, support, and assistance throughout the evaluation. Phil was recently appointed as Superintendent of the nearby Freehold Borough School District. We wish him well.
Michael Dean, the school district’s technology coordinator, deserves our gratitude for making this project work. He served as a guide, facilitator, and friend as he fulfilled our many requests for information and arranging access to people, places, and data.
Thanks to Ray Bolling, Vice President of New Jersey Business Systems, for his assistance with the implementation and the evaluation.
We thank the Principal of New Egypt Elementary School, Jean Morgan, for her continued support and assistance with the evaluation and for allowing the evaluation team to assemble in and observe her school many times. The faculty and staff at the school also were very helpful in discussing issues and concerns about the iris technology.
We thank Anita McIntyre and Melinda Bowden for providing information and assistance to the evaluation team. Mrs. McIntyre and Mrs. Bowden took time away from their busy jobs in the main office of New Egypt Elementary School to provide us with needed information and assist our visits to their school.
We thank the principals, teachers, staff, parents, and visitors who contributed to the project by filling out surveys and granting interviews. Their contributions to this study are immeasurable, but greatly appreciated.
We thank Ray Downs, former program manager at the National Institute of Justice for his faith in our ability to conduct this project. His successor, Steve Schuetz, gave us guidance and continued to provide support throughout the project. Finally, we thank Winnie Reed our evaluation program manager who always had a kind word and gave us great advice about our surveys and other methods.
The research described in this report was made possible through grant number 2002-RDCX-K002 from the National Institute of Justice (NIJ), U.S. Department of Justice. Any errors of fact, omission, or interpretation are those of the authors and are not the responsibility of the Plumsted Township School District, the National Institute of Justice or the U.S. Department of Justice.
Copyright © by Craig D. Uchida and 21st Century Solutions, Inc. The U.S. Department of Justice reserves a royalty-free, nonexclusive, and irrevocable license to reproduce, publish or otherwise use, and to authorize others to use, this document for Federal Government purposes. No part of this document may be reproduced in any forms, by any means (including electronic, photocopying, recording or otherwise) without the prior written permission of the U.S. Department of Justice and the authors.
Craig D. Uchida Edward R. Maguire
Shellie E. Solomon Megan Gantley
August 2004
This document is a research report submitted to the U.S. Department of Justice. This report has not been published by the Department. Opinions or points of view expressed are those of the author(s) and do not necessarily reflect the official position or policies of the U.S. Department of Justice.

Table of Contents
List of Exhibits
Chapter 1: Background and Overview -Edward R. Maguire, Kathryn Simmons, and Craig D. Uchida
Chapter 2: Security and Safety in Schools -Craig D. Uchida, Edward R. Maguire, and Kathryn Simmons
Chapter 3: The Evaluation -Edward R. Maguire, Craig D. Uchida, and Shellie E. Solomon
Chapter 4: Implementing the Iris Recognition Technology -Craig D. Uchida, Edward R. Maguire, Shellie E. Solomon and Megan Gantley
Chapter 5: Impact Findings -Edward R. Maguire, Craig D. Uchida, Shellie E. Solomon, Megan Gantley, and Kevin Daniels
Chapter 6: Findings and Recommendations -Craig D. Uchida and Edward R. Maguire
References
Exhibits
Appendices
This document is a research report submitted to the U.S. Department of Justice. This report has not been published by the Department. Opinions or points of view expressed are those of the author(s) and do not necessarily reflect the official position or policies of the U.S. Department of Justice.
Exhibits
Exhibit 1-1: Selected Demographic, Social, and Economic Characteristics
Exhibit 1-2: Official Crime Statistics, 2000
Exhibit 2-1: A Timeline of Recent School Shootings in the United States
Exhibit 3-1: Response Information for Teachers and Staff surveys
Exhibit 3-2: Response Information for Parent Surveys
Exhibit 4-1: Descriptive Statistics on 11 Iris Scanners
Exhibit 4-2: Elementary School Camera Locations
Exhibit 4-3: Middle School Camera Locations
Exhibit 4-4: High School Camera Locations
Exhibit 4-5: Frequency of Parent T-PASS Usage
Exhibit 4-6: Frequency of Entry Scenarios
Exhibit 4-7: Frequency of Tailgating Scenarios
Exhibit 4-8: Frequency of “Other” Scenarios
Exhibit 5-1: Aggregate Indicators of Program Impact Among NEES Parents
Exhibit 5-2: Perceptions of Security Among Parents
Exhibit 5-3: Are Parents Perceptions Influenced by Treatment/Control Status?
Exhibit 5-4: Explaining Changes in Parents’ Perceptions
Exhibit 5-5: Aggregate Indicators of Program Impact Among NEES Teachers and Staff
Exhibit 5-6: Aggregate Indicators of Program Impact Among NEMS Teachers and Staff
Exhibit 5-7: Aggregate Indicators of Program Impact Among NEHS Teachers and Staff
Exhibit 5-8: Perceptions of Security Among Teachers and Staff
Exhibit 5-9: NEES Visitor Sign-Ins and Iris Scan Entries
This document is a research report submitted to the U.S. Department of Justice. This report has not been published by the Department. Opinions or points of view expressed are those of the author(s) and do not necessarily reflect the official position or policies of the U.S. Department of Justice.

CHAPTER 1
BACKGROUND AND OVERVIEW
Edward R. Maguire, Kathryn Simmons, and Craig D. Uchida
Over the last five years, the Nation has turned its collective attention to school
crime, safety, and security. Shootings in Columbine High School and other schools led
parents, teachers, students, policymakers, school administrators, law enforcement, and
community groups to seek ways to reduce crime and fear of crime. In addition, the tragic
events of September 11, 2001, have raised concerns about the vulnerability of schools to
terrorist activities and weapons of mass destruction. To combat these fears, increase
safety, and reduce crime, schools across the country have begun to experiment with a
variety of security technologies (Green, 1999). Yet, little is known about the
effectiveness of these tools and their impact on students, teachers, parents, and the school
environment generally.
This report discusses the implementation and impact of iris recognition
technology in three schools in Plumsted Township, New Jersey. In September 2002, the
Plumsted Township Board of Education received a federal grant in the amount of
$293,360 from the National Institute of Justice’s Office of Science and Technology to
purchase and deploy iris recognition technology in its three schools: New Egypt
Elementary School, New Egypt Middle School, and New Egypt High School. The
project was named T-PASS: Teacher-Parent Authorization Security System.
After receiving the grant, Plumsted Township’s Board of Education partnered
with New Jersey Business Systems of Robbinsville, NJ, an authorized New Jersey state
21st Century Solutions, Inc. 1-1
This document is a research report submitted to the U.S. Department of Justice. This report has not been published by the Department. Opinions or points of view expressed are those of the author(s) and do not necessarily reflect the official position or policies of the U.S. Department of Justice.

contract vendor, to develop, deploy, and implement iris recognition technology and
software. Together, they selected the iris recognition technology developed by Iridian
Technologies of Moorestown, NJ. This identification technology was then combined
with an Entry Access Control system developed by Biometric Solutions Group of
Charleston, SC. These two sets of technologies were designed to identify the individual
seeking to enter the schools, make a decision about whether to grant entry, and to unlock
the doors if the person was approved. A second application was used as an identification
system for parents who wanted to pick up their children before the end of the school day
at the elementary school. Parents voluntarily participated to have their irises scanned
rather than signing in and showing identification to the office staff.
Although iris-scanning technology has been tested extensively in a laboratory
setting, we are only aware of one careful evaluation of its use in a natural setting
(Coventry, De Angeli, and Johnson, 2003).1 In that case, iris scanning was used to
replace pin numbers to identify automatic teller machine users in Britain, an application
of the technology that is very different from the school entrances of New Egypt, NJ. To
our knowledge, this project represents the first effort to implement iris-scanning
technology as a security measure in a school. Because field tests of the technology are
rare, and because it has not been implemented in schools, the National Institute of Justice
(NIJ) provided a grant to 21st Century Solutions, Inc. to conduct an independent
evaluation of the project. 21st Century Solutions, Inc., a Maryland-based consulting and
research firm, was awarded a cooperative agreement in September 2002 for $148,997 to
carry out the evaluation.
1 Another field evaluation of iris scanning is currently underway at the Naval Consolidated Brig in Charleston, SC. In that site, iris scanning is being used to track and monitor inmate traffic within a correctional facility (Wilson and Mastrofski, 2003).
21st Century Solutions, Inc. 1-2
This document is a research report submitted to the U.S. Department of Justice. This report has not been published by the Department. Opinions or points of view expressed are those of the author(s) and do not necessarily reflect the official position or policies of the U.S. Department of Justice.

This report presents the findings from a comprehensive evaluation of the
implementation and impact of iris recognition technology in Plumsted Township. This
evaluation is designed to answer a number of questions. Does the technology work in a
school setting? Does the technology contribute to a reduction in perceptions of violence,
or disorder? Do faculty, staff, and parents feel safer? What are the unintended
consequences of the technology? In what ways might it be improved? This report
attempts to answer these and many other important questions.
Plumsted Township, NJ
Plumsted Township is located in Ocean County, New Jersey in the geographical
center of the state. New Egypt, where the three schools in this study are located, lies
within Plumsted Township. The political and geographic subdivisions of New Jersey,
with overlapping cities, towns, boroughs, villages, townships, and counties, can be quite
confusing to those who are not familiar with the state. To orient the reader, we will
briefly review how these different entities -- Ocean County, Plumsted Township, and
New Egypt -- fit together.
In the language of the Census Bureau, New Jersey townships constitute “Minor
Civil Divisions,” which are defined as “the primary governmental or administrative
divisions of a county” (U.S. Census Bureau, 2000a, p. A13). Plumsted Township, like
the other 246 New Jersey townships, has an actively functioning local government (U.S.
Census Bureau, 1994). New Egypt, on the other hand, is designated by the Census
Bureau as a “Census Designated Place,” which means that it is a statistical entity, not a
legal or administrative entity. According to the Census Bureau, “statistical geographic
21st Century Solutions, Inc. 1-3
This document is a research report submitted to the U.S. Department of Justice. This report has not been published by the Department. Opinions or points of view expressed are those of the author(s) and do not necessarily reflect the official position or policies of the U.S. Department of Justice.

entities usually evolve from practice, custom, usage, or need… in contrast to the legal
and administrative entities, whose existence and boundaries are officially prescribed,
statistical entities are appropriate in situations where the geographic coverage of the legal
areas is incomplete, inadequate, or inconsistent over time, or is nonexistent” (U.S. Census
Bureau, 1994, p. 2-2). New Egypt does not have an active local government and does not
provide services to its residents; it is an entity that evolved out of tradition and history.
Ocean County is the second largest county in New Jersey with a population of just
over 510,000 people. It is proximate to two major metropolitan areas: New York City to
the north and Philadelphia to the west. The eastern edge of the County borders the
Atlantic Ocean. Plumsted Township occupies approximately 40 square miles in the
northwest portion of the County. Its population, according to the 2000 census was 7,275
people, and it is one of 33 municipalities in Ocean County with an active local
government. A Township Committee of five elected members who serve a three-year
term governs Plumsted Township. Each year, the Committee appoints from among its
members a Mayor, a deputy Mayor, and one liaison for each of three administrative
departments: the Road Department, the Police Department, and the Recreation
Department. New Egypt, with a population of 2,519 people, is located within Plumsted
Township, and though it is important for its historical significance, it has no “official”
status as a governmental unit.
Plumsted Township derives its name from the Plumsted family, who played an
important role in its early development. Clement Plumsted, a London Quaker, was
granted the 2,700-acre parcel in 1699. His son then sold the land to a Philadelphia
relative also named Clement Plumsted. The latter Plumsted was a three-time Mayor of
21st Century Solutions, Inc. 1-4
This document is a research report submitted to the U.S. Department of Justice. This report has not been published by the Department. Opinions or points of view expressed are those of the author(s) and do not necessarily reflect the official position or policies of the U.S. Department of Justice.
Philadelphia. When the Township was established in 1845, it became known as
Plumsted Township to honor its proprietor, Clement Plumsted of Philadelphia (Mount,
1979).
The area now known as New Egypt was once two separate settlements: Newport
(later known as Snuff Mill) and Kimmons Mills. In the early 1700’s, farmers in the
region encountered several seasons of failing grain crops. However, Cowperthwaite
Kimmons, proprietor of Kimmons Mills, had carefully stocked his storage bins when
crops were plentiful. “Farmers nearby and from distant points traveled to Kimmons Mills
for grain pointing out that the famine had forced them to come to Kimmons Mills for
corn just as the people of Biblical times had been obliged to go to Egypt for corn”
(Mount, 1979, p. 1). The name stuck, and for about a century, the area was known as
Egypt. Sometime in the early 1800’s it became known as New Egypt.
According to Dorothy Mount (1979, p. 93), the principal historian of the area:
“It has been stated that in the year of 1850, all roads led to New Egypt and that the rest of
the county was sparsely inhabited and in a primeval state excepting a few roads along the
coastline.” New Egypt “was a thriving community from the 1850s to the early 1900s
with beautiful Lake Oakford used for summer recreation by prosperous Philadelphians”
(Dean, 2000). The early 1900s brought a series of changes which one observer attributes
to a lack of vision (Mount, 1979). A new road connecting Philadelphia with the coastal
areas of central New Jersey meant that New Egypt “lost the advantage of being on a main
throughway” (Mount, 1979, p. 93). When Fort Dix (then Camp Dix) was built rapidly
during World War I, inadequate sewage planning led to the pollution of Lake Oakford,
thereby bringing an end to boating, fishing, and swimming on the lake (Mount, 1979).
21st Century Solutions, Inc. 1-5
This document is a research report submitted to the U.S. Department of Justice. This report has not been published by the Department. Opinions or points of view expressed are those of the author(s) and do not necessarily reflect the official position or policies of the U.S. Department of Justice.

Furthermore, according to Dean (2000, p. 1), New Egypt became known as a home for
‘Pineys,’ so-called “because the township borders the federally protected Pine Barrens.
Pineys earned a reputation of being low income, non-educated people.”
Although Plumsted remains somewhat isolated, some residents now view it as a
serene escape from the major metropolitan areas of Philadelphia, New York and northern
New Jersey. Plumsted is about 45 miles from Philadelphia, about 60 miles from Newark,
and about 70 miles from New York City. The opening of the New Jersey Turnpike in
1952 and the Garden State Parkway in 1954 provided:
“access to a large amount of undeveloped and inexpensive land within commuting distance of the labor markets of New York and northern New Jersey. The County also became a desired location for people who wanted to retire away from the more industrial areas to the north. A primarily rural County with a population of 37,675 in 1940, the County’s population increased to 433,200 persons by 1990. As evidenced by each of the decennial Censuses during this fifty-year period, Ocean County was the fastest growing county in the State. Almost all of this growth was due to in-migration, rather than the natural increase of the population” (Ocean County Government, 2003).
From 1980 to 1990, the Township grew by 1,331 people. From 1990 to 2000, it
grew by another 1,270 people, to 7,275.
At the same time, Plumsted Township has made significant efforts to resist rapid
growth. Most of the Township was recently rezoned to permit “only one home for every
5 acres of land” (Dancer, 2003). The County’s Farmland Preservation program has
preserved more than 1,580 acres of active farmland in Plumsted Township. The
Township was also awarded a “Smart Growth” grant by the Association of New Jersey
Environmental Commissions (Dancer, 2003). While trying to limit residential growth,
the Township also supports efforts to improve connectedness within the region. At a
public forum held in Toms River, NJ in December 2002, Mayor Dancer spoke in support
21st Century Solutions, Inc. 1-6
This document is a research report submitted to the U.S. Department of Justice. This report has not been published by the Department. Opinions or points of view expressed are those of the author(s) and do not necessarily reflect the official position or policies of the U.S. Department of Justice.

of the proposed Monmouth-Ocean-Middlesex passenger rail line that would connect the
region to the Northeast Corridor line (Blay, 2002).
Plumsted’s social climate is still distinctly rural. Its population density is the
second lowest in the county. It has a downtown area dotted with family owned
businesses and has been designated by the state’s Department of Community Affairs as
one of 18 “Main Street New Jersey” communities (New Jersey Department of
Community Affairs, 2003). American flags and yellow ribbons signifying support for the
American troops in Iraq and Afghanistan line the streets. It is a town where the schools
are the center of the community – numerous activities are held in classrooms, in the
auditoriums, and the playing fields during non-school hours. With the recent
construction of its first high school, the local football game has become a social event.
The town’s website lists the Mayor’s home telephone number and invites residents
wishing to speak with the Mayor to request a home visit.
Plumsted is also home to several civic organizations, the largest of which is the
Elks, with 400 members. It is also home to eight churches and religious organizations,
the largest of which is the Roman Catholic Church of the Assumption with more than
1,100 families. According to the local library:
“As the community grows, differences in income, education, career and standards become more prevalent. However, the population of Plumsted is still unified in the community’s feelings about being part of a small country town, the clean air, the friendliness and low taxes. The community cares about its town, its families, friends and neighbors.”
It appears to be a place where families can reside within reasonable proximity to
major metropolitan areas, while still enjoying the serenity of a pastoral, agricultural, rural
environment. As we demonstrate later, these community characteristics play an
21st Century Solutions, Inc. 1-7
This document is a research report submitted to the U.S. Department of Justice. This report has not been published by the Department. Opinions or points of view expressed are those of the author(s) and do not necessarily reflect the official position or policies of the U.S. Department of Justice.

important role in the implementation and impact of iris scanning technology in the
schools.
Statistical Portrait
Exhibit 1-1, containing data from the 1990 and 2000 Censuses, highlights some of
the demographic, social and economic characteristics of Plumsted Township in
comparison with the state of New Jersey and the United States.
–EXHIBIT 1-1 ABOUT HERE–
As Exhibit 1-1 shows, compared with New Jersey and the United States as a
whole, Plumsted Township is racially homogeneous; only 6.1% of its residents are
nonwhite, compared with 27.4% for New Jersey and 24.9% for the United States as a
whole. It also had a higher median household income in 2000 than both New Jersey and
the United States. Plumsted Township’s median household income was $61,357,
compared with $55,146 for New Jersey, and $41,994 for the United States (Census,
2000). Plumsted Township also has fewer than half the proportion of renter occupied
housing units than the averages for New Jersey and the United States, lower population
mobility, fewer individuals and families living beneath the poverty line, a lower
unemployment rate, a higher proportion of high school graduates, but a lower proportion
of people with at least a Bachelor’s degree.
Exhibit 1-2, containing data from the FBI’s 2000 Uniform Crime Reports for
2000, demonstrates that Plumsted Township is a safe community relative to the averages
for the State of New Jersey and the United States as a whole. Its rates of violent,
21st Century Solutions, Inc. 1-8
This document is a research report submitted to the U.S. Department of Justice. This report has not been published by the Department. Opinions or points of view expressed are those of the author(s) and do not necessarily reflect the official position or policies of the U.S. Department of Justice.

property, and total crime are less than a third the average rates for the New Jersey and the
United States. Furthermore, its police department clears more than 63% of offenses with
an arrest, compared with 31.7% for New Jersey, and 20.5% for the United States.
–EXHIBIT 1-2 ABOUT HERE–
The Fort Dix Shooting2
Despite its placid environment and relative safety from crime and violence, the
region’s peace and serenity were shattered on October 12, 2001 when a soldier from
nearby Fort Dix went on a shooting rampage. Pending the outcome of a psychological
exam, Army Reservist Loren J. Janeczko, 29, was relieved of his duties. While collecting
his belongings, Janeczko pulled out a personal .38 caliber pistol and fired, missing his
two escorts. He then fled the barracks and shot and wounded two other soldiers before
stealing a military police vehicle and fleeing Fort Dix. Janeczko then led police on a
chase through several townships. During the chase, Janeczko shot and wounded
Chesterfield Patrolman Kyle Wilson before stealing Officer Wilson’s police vehicle.
After abandoning the second stolen vehicle, Janeczko fled on foot and encountered
Mansfield Township Police Lt. William Kerr. Janeczko shot and wounded Lt. Kerr
several times before being fatally shot by police.
While none of these incidents took place within Plumsted Township, the various
shootings were all close enough to alarm Plumsted residents. Fort Dix is about six miles
from the New Egypt Elementary School. As news and rumors of the shootings began to
circulate in Plumsted, panicking parents flooded the main offices of the schools in an
effort to remove their children. The fear surrounding the shootings led school officials to
Information on the Fort Dix shooting is derived from Baratta (2001).
21st Century Solutions, Inc. 1-9
2
This document is a research report submitted to the U.S. Department of Justice. This report has not been published by the Department. Opinions or points of view expressed are those of the author(s) and do not necessarily reflect the official position or policies of the U.S. Department of Justice.

think more systematically about school safety issues, one outcome of which was the
decision to apply for a grant to implement iris recognition technology.
Plumsted Township Schools
For the first few decades of the 1900s, Plumsted’s public education was
conducted in a small one-room school (Mount, 1979). In the 1930s, the Township built
an elementary school, but the remaining children attended school at the Allentown High
School in what is now the Upper Freehold Regional School District (Dean, 2000). In
1995, Plumsted Township built the New Egypt Middle School (Dean, 2000), but high
school students continued to attend Allentown High School. Problems between the two
districts led Plumsted Township to build its own high school, which opened its doors to
its first freshman class in September 1999. Students who were in grades 10-12 when the
school opened continued to attend Allentown High School, with the new high school
accepting a new class of freshmen students each year. The high school continued to
increase in size, with the 2002-2003 school year marking the first time it has had four full
grade levels. In June 2003, New Egypt High School celebrated its first graduating senior
class.
The Plumsted Township School District is comprised of three schools ranging
from grades K–12, and was responsible for educating more than 1,700 students in the
2002-2003 school year. The District has one elementary school, one middle school, and
one high school. The elementary school houses special education pre-kindergarten
through fourth grade. The middle school houses fifth through eighth grade, and the high
school houses ninth through twelfth grade. Both the middle school and the high school
were built within the past seven years.
21st Century Solutions, Inc. 1-10
This document is a research report submitted to the U.S. Department of Justice. This report has not been published by the Department. Opinions or points of view expressed are those of the author(s) and do not necessarily reflect the official position or policies of the U.S. Department of Justice.

Due to continuing growth in the community, residents passed a $17.9 million
referendum in March of 2002 to build a new school and make renovations to the existing
schools. Under the plan, to be completed in Spring 2004, the high school and the
elementary school are both undergoing limited renovations. In addition, a new primary
school is being built to accommodate special education pre-school students, a full-day
kindergarten, and first grade. Once the primary school is completed, the elementary
school will then teach students in grades 2-5, the middle school will teach students in
grades 6-8, and the high school will teach students in grades 9-12.
The Iris Technology Grant
This report discusses the implementation and impact of iris recognition
technology in three schools in Plumsted Township: New Egypt Elementary School, New
Egypt Middle School, and New Egypt High School. The project was named T-PASS:
Teacher-Parent Authorization Security System.
The project had two major components. First, it involved implementing and
evaluating iris recognition technology as a method for enabling parents, vendors, and
school system employees to access buildings they were permitted to enter. Importantly,
to alleviate privacy concerns, only those who actively volunteered to use the technology
would be required to do so. Those who chose not to participate could still gain entry by
“buzzing in.” Second, it involved developing a software application that would integrate
iris recognition technology into an existing student management database application to
ensure that only authorized parents or family members could pick-up children in the
elementary school prior to the end of the school day.
21st Century Solutions, Inc. 1-11
This document is a research report submitted to the U.S. Department of Justice. This report has not been published by the Department. Opinions or points of view expressed are those of the author(s) and do not necessarily reflect the official position or policies of the U.S. Department of Justice.

The project involved a number of vendors, the use of off-the-shelf and custom
hardware and software, and technical challenges. Chapters Four and Five, which
describe the findings of both our implementation and impact evaluations, discuss these
elements of the project in more detail. Here we present the bare details to provide a brief
roadmap of the project.
First, the District selected and purchased the iris recognition technology
developed by Iridian Technologies of Moorestown, NJ. Iridian’s “KnoWho” software
has two components: a data component that stores iris images, and a processing
component that performs database searches and comparisons.
Second, the project team purchased 11 single-eye LG Electronics IrisAccess 2200
iris recognition cameras. Six cameras were positioned within enclosed vestibules in three
schools, and five were positioned outdoors within protective enclosures. The cameras
communicated over a TCP/IP network to a server running Iridian’s KnoWho program.
Third, enrollment and door control software was developed specifically for the
project by Biometrics Solutions Group (BSG) with New Jersey Business Systems (NJBS)
of Robbinsville, NJ, serving as intermediary between the BSG and Plumsted Township
School District. NJBS and the School District’s Technology Coordinator built custom
iris control units (ICU) that served as the interface between an iris camera and the iris
database server.
Fourth, NJBS developed the software that interfaced with the iris database used
by the access control portion of the program and enabled the elementary school staff to
verify the identity of parents picking up children before the close of the school day. This
software, known as T-PASS (Teacher-Parent Authorization Security System), enabled
21st Century Solutions, Inc. 1-12
This document is a research report submitted to the U.S. Department of Justice. This report has not been published by the Department. Opinions or points of view expressed are those of the author(s) and do not necessarily reflect the official position or policies of the U.S. Department of Justice.

parents to enter the school and then approved the release of children to them once they
entered the main office.
Fifth, the project team installed video cameras at each location where the iris
scanning cameras were installed. Staff at each of the three schools could view
individuals who requested access into the school on a video feed that appeared on their
computers.
Sixth, the project team installed a buzzer system (including an intercom) at each
door to allow non-participants an alternative method for gaining access to the schools.
The video cameras, buzzers, and intercoms allowed staff at the three schools to identify
visitors, teachers, staff, students, and parents who needed to gain entry to the schools.
The video cameras were linked to the central computer system
Finally, the District willingly agreed to allow an outside research team to evaluate
the implementation process and determine the impact of the project on perceptions of
safety and security in the schools. 21st Century Solutions, Inc., a Maryland-based
consulting and research firm, was chosen to conduct the evaluation.
The Evaluation
During the 10-month project period, we conducted a process evaluation and an
impact evaluation. A process evaluation describes and assesses the content and dosage of
program interventions. In the process evaluation, we focused on collecting data
pertaining to the following three areas: 1) documenting and analyzing the implementation
process; 2) describing and measuring the intervention strategy; and 3) identifying and
21st Century Solutions, Inc. 1-13
This document is a research report submitted to the U.S. Department of Justice. This report has not been published by the Department. Opinions or points of view expressed are those of the author(s) and do not necessarily reflect the official position or policies of the U.S. Department of Justice.

describing intervening variables and assessing their potential impact on project outcomes.
Each of these areas is discussed below.
Documenting and analyzing the implementation process. One of the major goals
of this project was to learn more about how a school district implements biometric
technology and how the technology fits into overall safety issues. If the project is to be
replicated in other communities it is essential that we provide a careful description of the
implementation process. This will allow other researchers and communities to
understand how the technology was developed and used. Additionally, it will allow
others to understand how project plans and objectives are translated into an operational
strategy.
As part of the process evaluation we conducted interviews regarding
implementation. In particular, we focused on such issues as:
¾ What is the openness or reluctance of the parents, students, faculty, staff, and residents to various types of technology?
¾ Are students, parents, and faculty receptive to biometric technology? What are their limits?
¾ How does technology ‘fit’ into the safe school context?
Describing and measuring the intervention strategy. Measuring the content and
dosage of the program intervention is important for several reasons. Perhaps the most
important reason is that it is essential to know that the intervention has been fully carried
out. Without activities being carried out it cannot be stated for sure that the success or
failure of the program can be attributed to the intervention. Another reason for
describing and measuring the intervention is that treatments can be administered in an
uncontrolled and unstandardized manner. This in turn can result in the project having
varying impacts on different populations. Thus, it is important to measure the dosage of
21st Century Solutions, Inc. 1-14
This document is a research report submitted to the U.S. Department of Justice. This report has not been published by the Department. Opinions or points of view expressed are those of the author(s) and do not necessarily reflect the official position or policies of the U.S. Department of Justice.

an intervention to fully understand its impact. Lastly, program failure is often the
consequence of the wrong treatment being administered. Describing the qualities (and
quantity) of an intervention can help the researchers understand the impact of the
intervention. Therefore, it is essential to monitor and measure the delivery of the
intervention so that problems can be identified and others do not repeat mistakes in the
future. As part of the process evaluation we observed activities, conducted interviews,
administered surveys, and collected official data on the content and dosage of the
intervention. In particular, we gathered information about such issues as:
¾ Did the iris scanners work as envisioned? If not, what barriers or obstacles prevented parts or all of the activity from being executed?
¾ How many individuals volunteered for the iris scanning? ¾ How many successful scans were done? How many failures? ¾ How long did the iris recognition-scanning take? That is, when a person was
scanned, how many seconds passed before approval was given? Did the individual perceive this as ‘too long’?
¾ Did the system allow entry into school buildings easily? ¾ Were there problems in identifying individuals correctly? How accurate was the
recognition process (measure the false positives and false negatives)?
Identifying and describing intervening variables and assessing their potential
impact on project outcomes. Intervening variables can have a significant impact on
program outcomes. Here, intervening variables refer to the numerous and varied factors
and events that can modify the effectiveness of a program. Some of the most common
types of intervening variables are related to the environment in which the project takes
place. It has long been shown that such factors as socio-demographic characteristics,
environmental design, and neighborhood conditions can have a significant impact on
crime and delinquency. Accordingly, if we are to fully understand the impact of the
program on a specified problem it is essential that we have a thorough understanding of
21st Century Solutions, Inc. 1-15
This document is a research report submitted to the U.S. Department of Justice. This report has not been published by the Department. Opinions or points of view expressed are those of the author(s) and do not necessarily reflect the official position or policies of the U.S. Department of Justice.

the factors that are known to have an impact on outcome measures. In this project we
attempted to describe and account for such intervening variables as:
¾ Socio-demographic characteristics of the school population and the surrounding neighborhood.
¾ Perceptions of crime and disorder around the school district and within the surrounding neighborhood.
Impact Evaluation
A major goal of the evaluation was to identify program effects. For the impact
evaluation we asked: What is the impact of technology and T-PASS in Plumsted
Township School District? How does technology contribute to a reduction in perceptions
of violence, disorder, and/or other unwanted behavior? Do parents, faculty, and staff feel
safer? What are the unintended consequences of technology?
We want to know whether changes in outcomes occurred and, if so, whether these
changes can be attributed to the project. Program effects can be either indirect or direct.
Direct program effects are those that occur as a direct consequence of the program. In
some cases, the technology may have a direct effect on some outcomes, and indirect
effects on others. For instance, a program may reduce crime (direct), which in turn
reduces fear of crime. Indirect effects sometimes include unanticipated consequences of
the intervention (e.g., crime type displacement or increase in student and faculty
satisfaction). It is important to consider both direct and indirect effects in any impact
evaluation.
Overview of this Report
This report is divided into six chapters. Chapter Two discusses security and
safety in schools. It attempts to map out where iris scanning and other biometric
21st Century Solutions, Inc. 1-16
This document is a research report submitted to the U.S. Department of Justice. This report has not been published by the Department. Opinions or points of view expressed are those of the author(s) and do not necessarily reflect the official position or policies of the U.S. Department of Justice.

technologies fit into the broader array of security and safety measures being implemented
in schools. Chapter Three discusses the evaluation design, including a detailed
description of the data we collected, the analytical methods we employed, and the
principal research questions we sought to answer. Chapters Four and Five discuss the
findings of the process evaluation and the impact evaluation, respectively. Chapter Six
outlines the principal conclusions and recommendations from the evaluation. It makes a
series of recommendations not only to Plumsted Township, but also to a broader audience
of potentially interested readers, including technology vendors who develop school safety
solutions, and other school districts who may be considering the use of biometric security
measures.
21st Century Solutions, Inc. 1-17
This document is a research report submitted to the U.S. Department of Justice. This report has not been published by the Department. Opinions or points of view expressed are those of the author(s) and do not necessarily reflect the official position or policies of the U.S. Department of Justice.

CHAPTER 2
SECURITY AND SAFETY IN SCHOOLS
Craig D. Uchida, Edward R. Maguire, and Kathryn Simmons
Crime, safety, and security have become nationwide concerns in the United
States. Shootings in school districts all over the country have led parents, teachers,
students, policymakers, school administrators, criminologists, police agencies, and
community groups to seek ways to reduce crime and fear of crime. The tragic events of
September 11, 2001 have widened broadened these concerns to include the vulnerability
of schools to terrorist activities and weapons of mass destruction. To combat these fears,
increase safety, and reduce crime, American schools have developed a variety of
programmatic, strategic, and technological solutions to reduce crime and fear and
increase safety and security. Nationally, these various measures look like a country quilt,
comprised of very different components often sewn together haphazardly. In this
chapter, we review the state of crime, fear, security, and safety in American schools,
together with policies, programs, and other measures designed to reduce crime and fear
and increase security and safety. We place iris recognition technology and other
biometrics within the broader patchwork of efforts currently taking place. This sets a
clear context for the evaluation of iris scanning in Plumsted Township’s schools.
21st Century Solutions, Inc. 2-1
This document is a research report submitted to the U.S. Department of Justice. This report has not been published by the Department. Opinions or points of view expressed are those of the author(s) and do not necessarily reflect the official position or policies of the U.S. Department of Justice.

Crime and Safety in Schools
What we know about crime and safety in schools is derived primarily from survey
research. A number of Federal agencies and private entities1 have all sponsored surveys
of students, teachers, principals, or victims of crime. These studies provide useful
information about the school environment, victimization of teachers and students, and
disciplinary action. From these national surveys we know that crime is declining in
schools: between 1995 and 2001, the percentage of students who reported being victims
of crime at school decreased from 10 percent to 6 percent (Devoe, et al., 2003: v). We
also know that of crimes reported to police during the 1996-97 school year, 10 percent of
all public schools reported one or more serious violent crimes to law enforcement.
Another 47 percent of public schools reported at least one less serious or nonviolent
crime to police; the remaining 43 percent did not report any of these crimes to the police
(Annual Report on School Safety, 1998:3).
We know that school-associated violent deaths are rare (Small and Tetrick, 2001).
The School-Associated Violent Deaths Study indicates that less than 1 percent of the
more than 1,350 children who were murdered in the first half of the 1998-1999 school
year were killed at school. In the entire school year of 1998-99, 34 incidents occurred in
which a child or adult was murdered or committed suicide at the school, resulting in 50
deaths. Of these, 34 were students. Small and Tetrick also point out that the number of
multiple-victim homicides at school has declined from six incidents in the 1997-98
school year to two in the 1998-99 school year. Exhibit 2-1 provides a glimpse of recent
1 These include: the National Center for Education Statistics, the Centers for Disease Control, the Bureau of Justice Statistics, the National Institute of Justice, the Joyce Foundation, the American School Health Association, the American Medical Association, and the Survey Research Center at the University of Michigan.
21st Century Solutions, Inc. 2-2
This document is a research report submitted to the U.S. Department of Justice. This report has not been published by the Department. Opinions or points of view expressed are those of the author(s) and do not necessarily reflect the official position or policies of the U.S. Department of Justice.
school shootings in the United States. One pattern is clear: Since most of these
shootings did not involve unauthorized access into a school building, access control
measures, like iris scanning, would probably not have prevented them.
-EXHIBIT 2-1 ABOUT HERE-
Nonfatal crimes of theft, rape, sexual assault, robbery, aggravated assault, and
simple assault against students at school declined from 144 per 1,000 students in 1992 to
101 per 1,000 students in 1998. Students are less likely to be victimized at school than
away from school. Data indicate that both violent crimes and nonfatal violent crimes are
less likely at school than elsewhere. But more students have been victims of theft at
school than away from school. Taken together, the research evidence suggests that
students in school are vulnerable to a host of minor victimization types, but that major
forms of violence are rare.
Data also show that teachers in urban schools are “more vulnerable to crime at
school than are those in suburban schools” (Small and Tetrick, 2001). For example,
teachers in urban schools were more likely to be the victims of violent crimes (40 of
every 1,000) than were teachers in suburban or rural schools (24 out of every 1,000).
Teachers, like students, are also victims of theft. Iris scanning and other access control
measures are unlikely to have a large impact on many forms of victimization in schools.
What Works in Schools?
We know that some school-based prevention efforts are effective. Dr. Denise
Gottfredson found positive effects on measures of crime and delinquency for programs
that were aimed at building school capacity to initiate and sustain innovation. She also
21st Century Solutions, Inc. 2-3
This document is a research report submitted to the U.S. Department of Justice. This report has not been published by the Department. Opinions or points of view expressed are those of the author(s) and do not necessarily reflect the official position or policies of the U.S. Department of Justice.

found that programs were successful if they were aimed at establishing school rules and
improving the consistency of enforcement and if they communicated norms through
school-wide campaigns. Positive effects were also found if comprehensive instructional
programs focused on a range of social competency skills (Gottfredson, 1997: 5-55).
Gottfredson noted that with the exception of DARE evaluations, “the evaluations of
school-based prevention programs funded by [the Office of Justice Programs] are
generally too weak to justify conclusions about the effectiveness of the programs.” This
suggests that school-based prevention programs that include a law enforcement or legal
intervention have not been adequately examined in rigorous empirical and especially
experimental research.
Problem Solving Strategies in Schools
While a number of studies on police in schools have been conducted, only one
looks at the effects of the problem-solving model and the collaborative partnership
between police and schools. Kenney and Watson (1998) used a quasi-experimental
design in Charlotte-Mecklenburg (NC) to determine the success of problem solving. The
authors found that students in West Mecklenburg High (treatment school) reported
experiencing less fear of specific areas of the school campus and reported far fewer
incidents of having to fight to protect themselves. Teachers felt safer in the school and
more willing to confront misbehaving students. School administrators reported a
significant reduction in incidents requiring student supervision with the largest reduction
being “student-student conflict” suspensions. The authors also reported that the students
at West Mecklenburg High became empowered through the problem-solving model.
21st Century Solutions, Inc. 2-4
This document is a research report submitted to the U.S. Department of Justice. This report has not been published by the Department. Opinions or points of view expressed are those of the author(s) and do not necessarily reflect the official position or policies of the U.S. Department of Justice.

Though this study showed positive results, it is unclear whether those same results can be
replicated in other locations.
Through a cooperative agreement from the COPS Office, researchers at 21st
Century Solutions, Inc. conducted a national assessment of the School-Based Partnership
grant program. As part of the assessment evaluators examined a number of locations in
close detail to determine the effectiveness of the problem solving strategy. In Seattle,
WA, for example, Uchida, et al. (2002) found that truancy rates appear to have decreased
as a result of interventions used by the school and the police during the course of the
project. Using the SARA model (Scanning, Analysis, Response, and Assessment), police
and school officials were able to carefully analyze the truancy problem and direct their
resources effectively. Similarly, in Colorado Springs, CO (Uchida and Putnam, 2001)
school resource officers in five high schools used the model to deal with problems of
assaults, drugs, disputes, and loitering. In Spartanburg, SC (Maguire, et al., 2002) and
Redlands, CA (Katz, et al, 2002), however, the school-based partnership team members
did not complete the SARA process and the effects could not be determined.
Research on school safety and delinquency prevention implies that general
planning, program development, and problem-solving activities hold the most potential
for crime prevention and school safety (see, for example, Emmer, 1992; D. Gottfredson,
Gottfredson, and Skroban, 1998; G. Gottfredson and Gottfredson, 1987).
Effective programs to reduce disorder have been demonstrated in schools with
multiple problems. In one of these (D. Gottfredson, 1988), a structured planning and
problem-solving method (G. Gottfredson, 1984) was applied in a three-year effort to
reduce disorder in a troubled Baltimore City school. The program designed and
21st Century Solutions, Inc. 2-5
This document is a research report submitted to the U.S. Department of Justice. This report has not been published by the Department. Opinions or points of view expressed are those of the author(s) and do not necessarily reflect the official position or policies of the U.S. Department of Justice.

implemented interventions to increase the predictability of responses to disciplinary
infractions, increase rewards for appropriate behavior, and increase social support. The
program reduced disorder. The same problem solving and planning method was applied
in programs in seven secondary schools (D. Gottfredson, 1988) to develop school-
specific plans for improvement. The effort increased the clarity and consistency of
school rules, student success, and attachment; and by reducing problem behavior it
improved staff morale. In another study, eight schools participated in a program to
increase the clarity of school rules and to promote their application in a fair, firm, and
consistent way (D. Gottfredson, G. Gottfredson, and Hybl, 1993). Again, in the context
of a planning and problem-solving framework, mechanisms for attending to and
responding to student behavior were improved. Evaluation showed that the program’s
effectiveness differed from school to school in approximate proportion to the quality of
program implementation, and it was effective in reducing conduct problems in high
implementation schools.
These studies indicate that careful planning and implementation have positive
effects on reducing problems in schools. There is very little research on the effects of
access control technologies on school safety. Because most of the “normal crimes” that
characterize daily life in America’s schools are committed by people who are supposed to
be there, access control technologies might have a limited impact on these outcomes.
The access control technologies are really targeted toward keeping out those who are not
supposed to be in the building. Since these people constitute a small minority of people
who commit crime in schools, the impact of these technologies might be difficult to
detect. Such technologies should not constitute the bulk of a school’s overall safety plan,
21st Century Solutions, Inc. 2-6
This document is a research report submitted to the U.S. Department of Justice. This report has not been published by the Department. Opinions or points of view expressed are those of the author(s) and do not necessarily reflect the official position or policies of the U.S. Department of Justice.
but discussing these technologies as one element of an overall school strategy appears
worthy of research and evaluation. We now turn briefly to a discussion of personnel and
technology.
Increased Personnel and Technology
The use of security technology and security personnel in schools has increased
dramatically over the last 20 years. The National Academy of Sciences panel on juvenile
crime (McCord, et al., 2000) noted that in 1968 the New York City public school system
did not employ any security guards. Thirty years later, in 1998, there were more than
3,200 security guards, more officers than in the Boston Police Department. Similarly,
police departments are placing ‘cops in schools’ at higher rates than ever before. This
trend continues throughout the country. For instance, the National Association of School
Resource Officers, first established in 1990, now has more than 10,000 members.2
In addition to increases in security and law enforcement, schools have added a
multitude of security devices including surveillance equipment, metal detectors, entry
control technologies, alarm devices, and biometrics (Green, 1999). Yet only a handful of
studies have attempted to evaluate the effects of technology to reduce school crime or
fear of crime. In one study, Ginsberg and Loffredo (1993) surveyed a representative
sample of New York City high school students in schools with and without metal
detectors. The researchers found that students in both settings were equally likely to
report having been threatened or involved in a dispute at or away from school. There was
also little difference between the two groups of students in self-reported weapon carrying
in the prior month. Differences occurred between the two groups of students regarding
http://www.nasro.org/membership.asp
21st Century Solutions, Inc. 2-7
2
This document is a research report submitted to the U.S. Department of Justice. This report has not been published by the Department. Opinions or points of view expressed are those of the author(s) and do not necessarily reflect the official position or policies of the U.S. Department of Justice.

the prevalence of carrying a weapon to school. Students in schools with metal detectors
were half as likely to report carrying a weapon to or from school as students in schools
without metal detectors.
Other studies are currently underway and should be completed shortly. At a
school safety conference sponsored by NIJ, the Department of Education, the COPS
Office, George Mason University and Sandia National Laboratory in January 2002, Mary
Green (from Sandia) moderated a panel with three school administrators. Raymond
Carter, Assistant Principal, Newcomb High School, in New Mexico, Joseph Moscaritolo,
Assistant Director, Madison Technical Vocational High School in Boston, MA and
Tommie Robinson, Assistant Principal, Permian High School in Odessa, TX described
the variety of technologies currently used in their schools. The three administrators
indicated that technology (surveillance cameras and identification cards in particular) is
assisting in the decrease in crime and disorder.
We have much to learn about the effects of technology in schools. We also have
much to learn about how technology fits into the overall safety program of schools.
Technology is often though of as a solution to school safety problems, but it is not often
evaluated.
Technology in Schools
A number of technologies are available and used in schools. In her report, The
Appropriate and Effective Use of Security Technologies in U. S. Schools, Mary Green
classifies security technologies currently being used by schools in the following four
categories: Video Surveillance Systems, Metal Detectors, Entry- Control Technologies
21st Century Solutions, Inc. 2-8
This document is a research report submitted to the U.S. Department of Justice. This report has not been published by the Department. Opinions or points of view expressed are those of the author(s) and do not necessarily reflect the official position or policies of the U.S. Department of Justice.

and Duress Alarm Devices. Finally, as Green notes, an evolving technology for school
safety is the use of geo-positioning systems and geographic information systems.
Currently these systems appear too costly for school applications but may provide
important solutions, especially for use in problem-solving applications, and as a test that
can be used in crisis situations.
For our purposes, we focus on entry/exit devices including swipe cards and
biometric devices. These technologies basically focus on limiting unauthorized persons
from being in the school building. “These trespassers can include a school’s own
suspended or expelled students, students from rival schools, irate parents seeking revenge
against a student or employee, gang members, or even drug dealers” (Green, 1999: 103).
Entry/Exit Devices include fences, card swipes, keypads or biometric devices for feature
recognition. Card technologies for schools include bar codes or magnetic strips for card-
swipe readers (such as those used for most credit cards) or passive or active radio
frequency (RF) cards for proximity readers, which can validate a card several inches to
several feet away (depending on the cost of the system). Biometric devices verify the
identity of a person through the use of a personal attribute—such as hand or finger shape,
fingerprint, voiceprint, signature dynamics, retinal pattern, or iris recognition patterns.
All of these advanced access control technologies are gaining prominence in the physical
security industry. They are just beginning to be adopted in schools.
Iris Recognition Technology
Iris recognition technology uses a video camera to take a picture of a person’s
eyes and then compares the images to information in a computer database. A stored
21st Century Solutions, Inc. 2-9
This document is a research report submitted to the U.S. Department of Justice. This report has not been published by the Department. Opinions or points of view expressed are those of the author(s) and do not necessarily reflect the official position or policies of the U.S. Department of Justice.

image of the iris and personal information are included in the database. Like fingerprints,
the human iris is unique to each individual. Unlike other technologies, however, iris
recognition does not require physical contact with the individual. It is, therefore, one of
the least intrusive technologies currently available. It has been *shown* to work with
people wearing glasses and contact lenses and in the identification of all ethnic groups.
In addition, research has shown that the likelihood of a false negative (an
authorized person is denied access) and/or a false positive (an unauthorized person is
given access) is much lower for iris recognition than for other biometric technologies,
including fingerprints, hand geometry, and facial recognition. False negatives occur in
only .1% to .2% of cases, while false positives occur once in approximately 1.2 million
cases (Iridian Technologies, 2002). These are only estimates of course, especially when
considering that there is a compensatory relationship between false negatives and false
positives – the sensitivity level of the iris scanning software can be adjusted to suit the
needs of its application.3
Taking into account the strengths and weaknesses of a variety of access control
technologies, the Plumsted Township School District and its partners agreed to use iris
recognition technology on a voluntary basis for faculty and parents to access buildings.
3 In a prison setting, for instance, one would adjust the software to ensure that the chances of a false positive are negligible; to do otherwise would be to increase the probability of an escape. Doing so, however, would result in a higher false negative rate, which would mean that some people might be “rejected” when in fact they should have been accepted.
21st Century Solutions, Inc. 2-10
This document is a research report submitted to the U.S. Department of Justice. This report has not been published by the Department. Opinions or points of view expressed are those of the author(s) and do not necessarily reflect the official position or policies of the U.S. Department of Justice.

CHAPTER 3
THE EVALUATION
Edward R. Maguire, Craig D. Uchida, and Shellie E. Solomon
From October to July 2003, we conducted a process and impact evaluation of iris
recognition in New Egypt’s elementary, middle, and high schools. The evaluation relied on a
number of different research methods, including both qualitative and quantitative approaches.
The research team visited New Egypt on numerous occasions to interview teachers, staff,
parents, visitors, and other stakeholders; we observed the use of the iris scanners, both casually
or informally, and formally, using systematic social observation methods; we administered
surveys to parents and teachers; and we collected “official” data on school visitation patterns.
All of these methods were intended to shed light on two key issues: what was the experience of
the schools in implementing iris recognition technology, and what was the overall impact of the
technology. In this chapter, we describe the evaluation design and the various data sources used
during the evaluation. We show how the data and methods can be used to answer important
questions about the implementation and impact of the technology.
Research Questions: Implementation and Process
A process evaluation is a systematic appraisal of the extent to which a program or policy
has been implemented as planned. Our process evaluation divided the implementation of iris
scanning and other school security measures in New Egypt into three phases: (1) planning, (2)
purchasing and installation, and (3) using the technology. Within each implementation phase are
a series of specific research questions. We outline those research questions below.
21st Century Solutions, Inc. 3-1 1
This document is a research report submitted to the U.S. Department of Justice. This report has not been published by the Department. Opinions or points of view expressed are those of the author(s) and do not necessarily reflect the official position or policies of the U.S. Department of Justice.

1. Planning
• What was the planning process?
• Who was involved? What was the nature of their involvement?
2. Purchase and Installation
a. Who was involved in purchasing and installing the hardware and software?
b. How was the system installed?
c. What was the project’s timeline?
• How long did it take to make the iris scanners work from time of
purchase?
• What problems and delays were encountered?
d. What were the technical issues for the project?
• What type of hardware and software were required for the scanners?
e. What was done to prepare administrators, teachers, staff, and parents for the
implementation of the scanners?
• What objections were there to the implementation of the Iris Scanner?
• Were there privacy concerns, financial issues or health questions?
f. What were the obstacles to implementation?
• Were there technical glitches, time delays, or philosophical
disagreements?
g. What type of support was available for implementation? What was the contribution of
the school district to the project?
3. Using the Technology
21st Century Solutions, Inc. 3-2 2
This document is a research report submitted to the U.S. Department of Justice. This report has not been published by the Department. Opinions or points of view expressed are those of the author(s) and do not necessarily reflect the official position or policies of the U.S. Department of Justice.

• What was the process for using the system for entry into the schools?
• What was the process for allowing parents to ‘check out’ their children at
the elementary school?
• How were teachers, staff, and parents enrolled in the system?
• How difficult was this process?
• What type of training was given?
• Were there policies and procedures for using the system?
• Does the system work?
• Does it function as originally intended?
• What are the differences among schools and within the schools?
• Did the persons using the iris scanner find the technology easy to use?
• What were the perceptions of teachers, staff and parents regarding
technology?
• Was it easier to use in some locations than others? Why?
• What were the unintended consequences?
Research Questions: Impact
While a process evaluation focuses on the process of implementing new programs or
policies, an impact evaluation focuses on outcomes. An impact evaluation is a systematic
appraisal of the extent to which a program or policy has produced the intended effects. Below,
we outline four generic questions about the impact of iris scanning technology and other new
security measures in New Egypt’s schools.
1. What were the changes in the perceptions of parents?
21st Century Solutions, Inc. 3-3 3
This document is a research report submitted to the U.S. Department of Justice. This report has not been published by the Department. Opinions or points of view expressed are those of the author(s) and do not necessarily reflect the official position or policies of the U.S. Department of Justice.

2. What were the changes in the perceptions of teachers and staff?
3. What were the “other” impacts on teachers, staff, and parents?
4. Did the iris recognition technology improve the efficiency with which the schools
processed visitors and parents?
Original Research Design
At the outset of the project we hoped to conduct an experiment to determine the effects of
the iris recognition technology. The idea was to randomly select adults to receive the treatment
(i.e., use the iris recognition technology) and compare that group to a control group (one that did
not use the technology). Teachers, administrators, and staff at all three schools were recruited to
participate in the project. In addition, parents in the elementary school were recruited to
participate in the project, to test whether the iris recognition technology could be used to identify
parents who wished to take their children out of school during the school day. Parents who
volunteered to participate in the project would be randomly assigned to a treatment and control
group. The school district includes almost 200 teachers and staff in three schools. In the
elementary school, about 850 students are enrolled in K-5. Over 700 families/households are
part of the elementary school.
To recruit teachers and staff, the evaluators, the Assistant Superintendent, and the
Technology Coordinator explained the project in October and November to groups of teachers
and staff at each of the schools. Consent forms were distributed during the meetings. In
December and January, the Technology Coordinator and Project Director followed up with
individual or group meetings to sign up as many teachers and staff as possible.
21st Century Solutions, Inc. 3-4 4
This document is a research report submitted to the U.S. Department of Justice. This report has not been published by the Department. Opinions or points of view expressed are those of the author(s) and do not necessarily reflect the official position or policies of the U.S. Department of Justice.

To enlist parents in the project, the Assistant Superintendent suggested that we contact
them during the three-day period of teacher/parent conferences at the New Egypt Elementary
School. We agreed and made a site visit from Nov. 13-15, 2002. Prior to the conferences, the
Assistant Superintendent distributed an information flyer to all parents alerting them to the
project and encouraging them to participate in the experiment. During the conferences we set up
an information table at the front of the school with a prototype of the technology. As parents
entered the school, the project director and the Technology Director for New Egypt School
District approached them about volunteering for the project. After hearing a brief explanation,
the parents would agree or not agree to participate. For those who agreed, a research associate
collected their address information and consent forms and advised them that at least two surveys
would be mailed to their residence as part of the study. 275 parents, from 230 households1,
signed up as a result of these recruitment efforts.
Teachers, administrators, and staff in the Plumsted Township School District were treated
as one entity and randomly assigned to a treatment and control group. Everyone was enrolled in
the iris technology system, with the treatment group allowed access to all doors. Parents who
agreed to participate were randomly assigned to a treatment and control group and could use the
front entrance of the elementary school and would be able to check out their children during
school hours by using the iris scanner rather than showing identification and writing out the
names of their children on a log sheet. Teachers, administrators, staff and parents were randomly
assigned to their respective groups by using a computer-generated random numbers program.
As the project unfolded, one of the major shifts that occurred was the decision to install a
buzzer system and surveillance cameras as alternatives to the iris technology for entry into the
1 There was one volunteer in 186 households, two volunteers in 43 households; and three volunteers in
21st Century Solutions, Inc. 3-5 5
This document is a research report submitted to the U.S. Department of Justice. This report has not been published by the Department. Opinions or points of view expressed are those of the author(s) and do not necessarily reflect the official position or policies of the U.S. Department of Justice.
schools. Because the schools would be “locked down” during the school day, administrators
believed that they needed another way for teachers and staff to get into the building. They
rightly believed that teachers and staff would not want to use only one entrance (the front doors)
to get into the buildings during schools hours. This meant that there were now two treatments,
the iris recognition technology and the buzzer system. This confounded the experimental
design, as there was no true “control group.”
Another issue that emerged during the process was: Is there a difference between the
parents who enrolled in the experiment and those who did not? That is, were there parents who
did not participate because they were concerned about privacy issues, health matters, or just did
not hear about the project? About 424 households (of 708 total households) did not participate in
the experiment at the New Egypt Elementary School. To answer these questions we decided to
send another survey to a systematic sample of these households. We sent 106 surveys (every
fourth household). Unfortunately, the response rate was low -- only 30 responses were received
(28 percent). Thus, we could not measure differences between the parents who enrolled and
those who did not.
Ultimately because of these factors, instead of a true experimental design we have a
quasi-experiment with pre- and post intervention measures. We present the details of the quasi-
experiment in Chapter 5.
Data Collection Strategies
one household. 21st Century Solutions, Inc. 3-6
6
This document is a research report submitted to the U.S. Department of Justice. This report has not been published by the Department. Opinions or points of view expressed are those of the author(s) and do not necessarily reflect the official position or policies of the U.S. Department of Justice.

To answer the many research questions posed in this project, the evaluation team relied
on a number of qualitative and quantitative data collection methods and evaluation strategies. In
this section, we describe these different data sources and methods in detail. To begin, we relied
on the following data collection strategies:
Teacher Surveys
We conducted two waves of teacher surveys in all three schools. The first wave was
conducted on March 6-7, 2003, about one month prior to the implementation of iris scanning.
The second wave was conducted on June 12, 2003 as the end of the school year approached.
To conduct the surveys of teachers and staff in New Egypt Elementary School and New
Egypt Middle School, we requested that the Principals call an all-staff meeting prior to the
school day. The first survey was conducted on March 6 and 7, 2003 in the Middle School and
Elementary School, respectively. The Technology Coordinator and Assistant Superintendent
opened the meeting by explaining the status of the T-PASS project, including enrollment dates.
They also answered general questions about technology issues in the school. 21st Century
Solutions’ staff disseminated the survey while explaining the treatment and control groups and
the purpose of the survey. We requested that teachers and staff fill out the surveys while we
waited. Time to complete the survey was approximately 10-15 minutes. For staff who could not
attend the meeting or who had to leave early, we asked them to return the surveys to the
secretary for the Assistant Superintendent. She forwarded them to us by mail. On June 12,
2003, 21st Century Solutions’ staff returned and repeated this survey process with these teachers,
administering the second survey.
21st Century Solutions, Inc. 3-7 7
This document is a research report submitted to the U.S. Department of Justice. This report has not been published by the Department. Opinions or points of view expressed are those of the author(s) and do not necessarily reflect the official position or policies of the U.S. Department of Justice.

Because of scheduling issues in the High School, an all staff meeting was not feasible to
conduct the survey. Instead, 21st Century Solutions, Inc. staff approached the teachers and staff
individually during the school study hall, the teacher’s break, and the lunch hours. The Vice
Principal guided 21st Century Solutions’ staff in locating the teachers in the staff lounge, and two
main wings of the building. We went from classroom to classroom, disseminating the survey,
explaining it and collecting it. This process took approximately three hours each time. The front
office secretaries helped us to identify which teachers and staff we missed due to absences. We
left extra surveys and the secretaries followed up to collect these surveys. On June 12, 2003 21st
Century Solutions’ staff returned to the high school and repeated the survey process of going
classroom to classroom with the high school teachers and staff to administer the second survey.
Overall, across the three schools, 132 (66%) of 199 teachers and staff provided responses
to the first survey. For the second survey, 128 (64 %) of teachers and staff responded. Exhibit
3-1 contains response notes for the teacher and staff surveys.
-EXHIBIT 3-1 ABOUT HERE-
Parent Surveys
We conducted two waves of parent surveys in New Egypt Elementary School. Wave one
surveys were mailed in the month before the technology was installed and wave two surveys at
the end of the school year.
Wave one survey materials were mailed to the households on February 27, 2003. Each
package contained a cover letter reviewing the purpose of the survey, and the specifics of the
study methodology; two copies of the survey; and an extra consent form for other caretakers,
such as a spouse. (We hoped to recruit spouses/partners to participate in the project, so we sent
21st Century Solutions, Inc. 3-8 8
This document is a research report submitted to the U.S. Department of Justice. This report has not been published by the Department. Opinions or points of view expressed are those of the author(s) and do not necessarily reflect the official position or policies of the U.S. Department of Justice.

an extra survey and consent form.) The wave one survey instrument for parents was six pages
long, with 92 questions.
Parents began the actual enrollment process into the T-PASS system during the first week
of March 2003. Parents who wanted to enroll in T-PASS, but had not previously volunteered
were allowed to do so until the end of March. Seventy-nine additional parents enrolled in T
PASS and received surveys. At the kick-off date (April 3, 2003), 284 households received
surveys.
By March 9, 2003 131 households returned 201 surveys (70 households returned two
surveys.) We mailed a follow-up letter and a second copy of the survey to the households that
enrolled in T-PASS but had not returned surveys. In total, 163 households responded, with 78
households returning two surveys, and 85 returning one survey, for a total of 241 individual
surveys.
On June 9, we mailed the wave two parents’ survey to the 163 households that returned
the first survey. By June 18, we had received approximately 80 surveys. We mailed a postcard
reminder on July 1, 2003 to the 163 households. In total, 106 households responded, with 32
households returning two surveys, and 74 returning one survey. Exhibit 3-2 contains response
rate information for the parent surveys.
-EXHIBIT 3-2 ABOUT HERE-
Casual Observations
During site visits to Plumsted Township, the research team conducted casual observations
of iris scanning and visitation patterns in all three schools. We spoke with administrators,
21st Century Solutions, Inc. 3-9 9
This document is a research report submitted to the U.S. Department of Justice. This report has not been published by the Department. Opinions or points of view expressed are those of the author(s) and do not necessarily reflect the official position or policies of the U.S. Department of Justice.

teachers, other school staff members, parents, visitors, vendors, and reporters. We observed the
conditions of the schools, the grounds, and the community.
We tested/used all of the iris scanners, viewed recorded video images of each entrance
via remote playback, and viewed live video footage at each entrance remotely. We recorded our
observations in detailed field notes, which served as a useful source of data for the evaluation.
Systematic Observations.
Furthermore, we conducted “systematic social observation” (SSO) of iris scanning and
visitation patterns at the main entrance of the New Egypt Elementary School. SSO is a research
technique in which trained observers use detailed research protocols and structured coding sheets
to record their observations of some phenomenon (Mastrofski, et al., 1998). These coded
observations can then be entered into a database and analyzed systematically to uncover patterns
and make estimates about the phenomenon under study. We conducted these observations on
five days during two site visits: April 16-17, 2003, and June 4-6, 2003. During that period, we
completed a coding sheet for 445 separate transactions in which parents and other visitors
attempted to enter the main entrance of elementary school. Some used the iris scanner, some
used the buzzer, and some used other methods, which we will describe in more detail in the next
chapter.
Unstructured Interviews
During our many site visits, we conducted dozens of unstructured interviews
(conversations) with administrators, teachers, other school staff members, parents, visitors,
vendors, and reporters. Because these interviews were exploratory, meant to help us learn the
21st Century Solutions, Inc. 3-10 10
This document is a research report submitted to the U.S. Department of Justice. This report has not been published by the Department. Opinions or points of view expressed are those of the author(s) and do not necessarily reflect the official position or policies of the U.S. Department of Justice.

lay of the land, we did not rely on a structured interview protocol. We recorded pertinent
information from these interviews in detailed field notes, which served as a useful source of data
for the evaluation.
Structured Interviews
In addition to the unstructured interviews, we also conducted a series of 27 structured
interviews with parents and visitors to New Egypt Elementary School from June 4-6, 2003.
These interviews were based on a brief, structured questionnaire meant to elicit the respondents’
opinions about the iris recognition technology. The data from these interviews were entered into
a database.
Official Data
In addition to the other forms of “original” data which we collected ourselves during the
evaluation, we also relied heavily on “official” data from the schools. Two primary sources of
official data were useful for this evaluation: visitor sign-in sheets from New Egypt Elementary
School, and the electronic logs generated by the iris scanners each time somebody had their irises
scanned to gain entry. We obtained visitor sign-in sheets listing all 4,120 visitors entering the
elementary school between February 11 and June 23, 2003. We then entered all of this
information into a database. We obtained electronic logs listing each time somebody attempted
to have their irises scanned at any of the schools. Altogether, the log contains 9,446 transactions
from April 3 to June 24, 2003. Both sources of data are useful for understanding how iris
scanning influenced visitation patterns.
21st Century Solutions, Inc. 3-11 11
This document is a research report submitted to the U.S. Department of Justice. This report has not been published by the Department. Opinions or points of view expressed are those of the author(s) and do not necessarily reflect the official position or policies of the U.S. Department of Justice.

Security Surveys
During every site visit to New Egypt, members of the research team conducted physical
security assessments at each school. We checked for unlocked doors, attempted to gain access to
buildings via other means, and attempted to identify points of vulnerability in each school. Once
again, the data from these security surveys were recorded in detailed field notes.
Media Accounts
Finally, the implementation of iris scanning in a small community like Plumsted
generated a lot of media attention. Since many of these reporters conducted their own interviews
and observations, we tracked these various media accounts carefully and treated them as an
additional source of data.
Summary of Data Collection Strategies
Overall, the evaluation strategy focused on two elements: implementation and impact.
We collected a variety of data from multiple sources. The goal is to conduct a comprehensive
evaluation that helps shed light on the implementation of iris scanning technology as a security
measure in a school, together with the impacts of that technology. Using those multiple data
sources, we hope the findings of the evaluation will provide crucial information to schools,
researchers, and policy makers interested in enhancing school safety through biometric
technology.
21st Century Solutions, Inc. 3-12 12
This document is a research report submitted to the U.S. Department of Justice. This report has not been published by the Department. Opinions or points of view expressed are those of the author(s) and do not necessarily reflect the official position or policies of the U.S. Department of Justice.

CHAPTER 4
IMPLEMENTING THE IRIS RECOGNITION TECHNOLOGY
Craig D. Uchida, Edward R. Maguire, Shellie E. Solomon, and Megan Gantley
Our process evaluation divided the implementation of iris scanning and other school
security measures in New Egypt into three phases: (1) planning, (2) purchasing and installation,
and (3) using the technology. Within each implementation phase are a series of specific research
questions. This chapter describes the implementation of security measures within each of these
three phases.
PLANNING
Most of the planning for the use of iris recognition technology in the New Egypt schools
was conducted during the proposal writing stage. The Assistant Superintendent and the
Technology Coordinator saw the NIJ solicitation regarding school safety in March 2002 and
decided to apply for the grant. This was their first attempt at putting together a proposal for the
Department of Justice. They began with the premise of insuring the safety and security of
employees and students at all three schools in the district. Two concerns emerged during their
early discussions – the first was the problem of the “swipe card” system that was in place at all
three schools. Teachers, staff, and administrators used swipe cards to obtain entry into the
schools, but at times the cards were lost or non-functional and doors were propped open. In
addition, no policies were in place with respect to access to the schools and front doors were
unlocked during school hours. The second concern was ensuring the safety of children when
they were picked up by their parents at the elementary school. The principal and staff at the
elementary school were concerned about some parents who were involved in custody disputes as 21st Century Solutions, Inc. 4-1
This document is a research report submitted to the U.S. Department of Justice. This report has not been published by the Department. Opinions or points of view expressed are those of the author(s) and do not necessarily reflect the official position or policies of the U.S. Department of Justice.

a result of a separation or divorce. They were worried that students would be picked up by the
“wrong” parent and wanted a system that would prevent uncomfortable situations between the
parents and the elementary school staff.
In essence, the Assistant Superintendent and Technology Coordinator began to look
closely at entry control devices for the schools, focusing particularly on biometrics. As part of
their research, they found that iris recognition technology appeared to be the best fit for their
needs and was unique in that no other schools in the country had used the technology. In
addition, the developer of the technology, Iridian Technologies, Inc., was located within a short
distance of New Egypt and one of the school district’s vendors, New Jersey Business Systems,
could assist with the installation of the equipment. Furthermore, they found that the technology
was almost entirely non-invasive – there were no lasers, strong lights or any kind of harmful
beams and no physical contact was required to enroll subjects. When they met with
representatives from Iridian Technologies, Inc. they were convinced that iris recognition
technology would work in their schools.
During the planning phase, the Assistant Superintendent and Technology Coordinator
requested approval from the Plumsted Township School District Superintendent and School
Board for submission of the proposal to NIJ and for the project itself. To assuage concerns about
privacy issues, they explained the details of the iris technology and noted that it was non
invasive. In addition, the Assistant Superintendent explained that enrollment in the use of the
technology was voluntary and that no one would be coerced into using it. Approval was granted
by the Superintendent and the Board and the proposal was sent to NIJ. After notification of the
grant award in September 2002, approval was sought and received from the Board for
acceptance of the grant. 21st Century Solutions, Inc. 4-2
This document is a research report submitted to the U.S. Department of Justice. This report has not been published by the Department. Opinions or points of view expressed are those of the author(s) and do not necessarily reflect the official position or policies of the U.S. Department of Justice.

PURCHASE AND INSTALLATION
The Technology Coordinator and his staff had primary responsibility for purchase and
installation of the equipment and technology. In addition, the representative from New Jersey
Business Systems assisted with the selection and installation of various aspects of the equipment.
Hardware and Software
For Plumsted’s three schools, the developers (the Technology Coordinator and
representative from New Jersey Business Systems) purchased and used eleven LG Electronics'
single-eye IrisAccess 2200 iris recognition cameras, first manufactured in 1998. Six cameras
were positioned within enclosed areas in three schools. Five cameras were positioned outdoors.
Exhibits 4-2, 4-3, and 4-4, positioned later in this chapter, show the placement of the cameras at
each of the schools.
The program developers relied upon the “KnoWho” server and software purchased from
Iridian Technologies for authentication of irises of the teachers, staff, and parents. The software
accepts iris images created with Iridian’s “Private ID” software from a workstation camera. The
software has two components – a data component which stores records, and a processing engine
that enrolls “Iriscode” records and performs real-time matching. The server enrolls the iris
image into a database while also establishing links to an information database.
Hewlett Packard, Dell, and Compaq donated servers for the project -- one SQL server for
Iridian Technology's KnoWho server for building access, another SQL server for the T-PASS
application for positively identifying parents who pick up children from the elementary school,
and a video server to digitally record surveillance cameras positioned at each of the entrances.
The iris cameras communicated over a TCP/IP network to the Hewlett Packard server 21st Century Solutions, Inc. 4-3
This document is a research report submitted to the U.S. Department of Justice. This report has not been published by the Department. Opinions or points of view expressed are those of the author(s) and do not necessarily reflect the official position or policies of the U.S. Department of Justice.

(Proliant DL370) running Iridian’s KnoWho program on Windows 2000 Server with Microsoft
SQL 2000 server. The enrollment and door control software was developed specifically for the
project by Biometrics Solutions Group (BSG) with New Jersey Business Systems (NJBS) of
Robbinsville, NJ, serving as intermediary between the BSG and Plumsted Township School
District.
New Jersey Business Systems and the Technology Coordinator built the iris control units
(ICU) that served as the interface between an iris camera and the iris database server. The ICUs
were installed above the drop ceiling of an interior wall near the door. The ICUs are similar to a
computer ‘motherboard’ whose operating system is Embedded Windows XP running on a 128
megabyte compact flash card.
The ICU was activated when a person pressed a green button mounted next to the LG
2200 iris recognition camera. The ICU would send a message to the iris server indicating that it
was ready to capture an image of a person's iris. The server would respond to the ICU indicating
that it was ready for the images. The ICU, in turn, sends a message to the LG 2200 to capture
two iris images, which it does and sends them to the ICU. The ICU then sends these images to
the iris server for verification. If a match is found or not, the iris database server sends a message
to the ICU. If a positive match was found and appropriate permission is authorized, the ICU
simultaneously sends a message to the camera to activate the voice indicating a successful
identification and a signal to the door access control device that completes a low-voltage
electrical circuit to release the door lock. If a positive match is not found or appropriate
permission is not authorized, the door remains locked and the camera sends a message to activate
a voice that indicates authorization to open the door is not given.
21st Century Solutions, Inc. 4-4
This document is a research report submitted to the U.S. Department of Justice. This report has not been published by the Department. Opinions or points of view expressed are those of the author(s) and do not necessarily reflect the official position or policies of the U.S. Department of Justice.

Timing, Obstacles, and Glitches
The project coincided with the school-year calendar, as it began in September 2002 and
ended in June 2003. Delays of about three months occurred in the installation of the iris
recognition scanners. Reasons for the delays are described in this section.
When Plumsted Township School District officials selected Biometric Solutions and
Iridian Technologies, Inc. for the iris recognition technology, they knew that Iridian held the
patent for the technology. During their meeting with both organizations in September 2002, they
were led to believe, according to several people we interviewed, that the scanners could be used
outdoors and for access into buildings. In January 2003, they learned from Iridian that the
equipment was not designed for use outdoors. Delays in installation occurred because the
scanners had to be fitted and housed within a waterproof enclosure. As the equipment was
installed, they also learned that the speaker within the unit could not be heard clearly through the
waterproof housing unit. So the system was re-wired to a small speaker located outside of the
housing unit.
Other problems occurred with software. Originally, the program developers at Plumsted
believed that the iris recognition technology included the door release software. However, this
was the first time that Biometrics Solutions Group had ever used the technology for access
control. That is, they had not attempted to link the iris scanners to locks on doors. Thus, it
became a challenge to write a computer program that would allow for the door lock to be
released when irises were verified. Additionally, NJBS developed the software that interfaced
with the iris database used by the access control portion of the program and enabled the school
district to verify the identity of parents picking up children. Writing these programs delayed the
implementation phase by about a month. 21st Century Solutions, Inc. 4-5
This document is a research report submitted to the U.S. Department of Justice. This report has not been published by the Department. Opinions or points of view expressed are those of the author(s) and do not necessarily reflect the official position or policies of the U.S. Department of Justice.

Another issue was the use of a buzzer system to gain access to the building. Plumsted
Township School District officials believed that the ‘swipe card’ system was no longer a viable
option for security purposes. Because they were not sure if the iris scanners would function
properly, administrators installed a buzzer system with surveillance cameras. In addition,
administrators believed that teachers and staff would not agree to enter the school buildings at
only one entrance, so two new systems were installed at all three schools – the iris recognition
technology and a buzzer/surveillance system.
On March 21, 2003, Biometric Solutions and the program developers began the physical
installation of the cameras and Iris Control Units (ICUs) at the three schools. The ICUs were
basic computer operating systems that work on a computer chip with MS Works. Biometric
Solutions was the developer of the unit. Two weeks later the cameras were operational and ready
for use.
Overall, six months passed from the time of the grant award in September 2002 to the
initial use of the system on April 3, 2003.
Preparing to use the Technology
In preparation for the installation of the iris recognition technology, the Assistant
Superintendent and Technology Coordinator informed and educated teachers, staff and parents
throughout the fall and winter months. During general faculty meetings at each school, the
Technology Coordinator set up a camera prototype and explained its functionality. Flyers were
sent home with each elementary school student so that all parents were aware of the upcoming
implementation of the new technology. During the teacher/parent conferences described below,
the evaluation team and the Technology Coordinator briefly explained the technology and the 21st Century Solutions, Inc. 4-6
This document is a research report submitted to the U.S. Department of Justice. This report has not been published by the Department. Opinions or points of view expressed are those of the author(s) and do not necessarily reflect the official position or policies of the U.S. Department of Justice.

evaluation to parents and to faculty. As installation of the equipment drew closer, the director
of the evaluation team and the Technology Coordinator met with small groups of teachers who
had questions about the equipment and the research. Lastly, the evaluation team convened a
“Public Safety Committee,” comprised of 11 parents from the elementary school to serve as a
sounding board for issues and to review survey questions.
What objections were there to the implementation of the iris scanner? Were there privacy
concerns, financial issues or health questions? We anticipated that teachers, staff, and parents
would have some objections to the iris scanners based on general perceptions of technology and
biometrics. Movies like “Minority Report,” starring Tom Cruise, depict a future where citizens’
irises/retinas are used by the federal government for tracking and identifying individual citizens.
This raises issues of privacy – how will the information be used? Will it be used beyond its
original purposes for securing entry into the schools? Will the iris data be linked to other
databases? We also thought there might be health concerns – that enrollees might be worried
about the effects of the recognition on their eyes.
Overall we found that teachers, staff, and parents did not raise many objections to the
equipment. During our pre-implementation meetings, teachers and staff were more concerned
about their ability to obtain entry into the schools and the inconvenience of being locked out
during school hours. Only two parents with whom we talked raised privacy concerns and said
they would not participate in the project. A large number of parents were excited about the
prospect of using the technology. It is likely that part of the reason for this overwhelming level
of support is New Egypt’s small town culture. All available evidence suggests that it is a
homogenous community with strong social ties. The technology may inspire more objections in
larger, more heterogeneous environments. 21st Century Solutions, Inc. 4-7
This document is a research report submitted to the U.S. Department of Justice. This report has not been published by the Department. Opinions or points of view expressed are those of the author(s) and do not necessarily reflect the official position or policies of the U.S. Department of Justice.

Enrolling Teachers, Staff and Parents
The evaluation team observed the enrollment process for teachers, staff and parents on
two separate occasions. Basically, the enrollment process involved two steps for teachers and
staff: The subject fills out a form that includes his/her name, address, phone number, driver’s
license, and signature. The person enrolls both eyes – the camera takes four pictures of each iris
– three of the four pictures have to be accurate before the software “accepts” the iris. For the
parents, the sign up process includes filling out a form similar to the teacher/staff form but also
asks for the names of children. In addition, a full picture of the parent is taken and entered into
the system as another form of verification.
For an unknown reason, one teacher out of 199 could not be enrolled. The Technology
Coordinator made at least a dozen attempts but could not get the scanner to accept the picture of
the irises. On the other hand, all of the parents were successfully enrolled. One parent
commented that he had one blind eye (lazy eye) and was surprised that the technology accepted
both of his eyes. Iridian estimates the “failure to enroll” rate to be about .5 percent, or one in two
hundred enrollees. Thus, the failure to enroll rate in this setting was lower than expected.
April 3, 2003 – Opening Day
After several months of delays, T-PASS became operational on Thursday, April 3, 2003.
Teachers, staff, administrators, and parents began to use the system. While the New Egypt
Elementary School (NEES) had begun its “lock down” (doors were locked during school hours)
on Monday, March 31, this was the first day that the iris recognition technology would be used
by parents and teachers there. In the New Egypt Middle School and New Egypt High School,
the lock down, use of scanners, and buzzer system officially began on April 3. Because these 21st Century Solutions, Inc. 4-8
This document is a research report submitted to the U.S. Department of Justice. This report has not been published by the Department. Opinions or points of view expressed are those of the author(s) and do not necessarily reflect the official position or policies of the U.S. Department of Justice.

three changes were implemented simultaneously, the impact evaluation was unable to isolate
the impact of iris scanning. Instead, the impact evaluation focuses on a package of school
security reforms, including the lockdown policy, the iris scanning technology, and the buzzer
system.
During this first day, the director of the evaluation team (Dr. Uchida) tested the scanners
at all three schools, observed activities, talked with the Assistant Superintendent, and with each
of the staff who were responsible for buzzing teachers, students, and parents into the schools.
The iris cameras “froze up” or were inoperable at the front door and north entrance of the
elementary school just before the start of the school day at 9 a.m. Repairs were made by
unplugging and re-starting the system at each of the ICUs. Throughout the day, the evaluation
director, the Technology Coordinator, and the representative from New Jersey Business Systems
tested the system to see whether the “freeze up” would occur again. At the front door, freeze ups
were relatively rare events. At the north entrance, freeze-ups occurred regularly. The rear and
side kindergarten doors were less likely to freeze up compared with the north entrance door.
At the middle school, the iris camera froze up at the front door. Apparently, 3-4 staff
members tried to test the system and overloaded it. The side and rear doors were not operable
for most of the day. The maintenance man was designated as a “trouble shooter” for the day and
carried a step ladder around the school to unplug and re-plug the system as the freeze-ups would
occur.
At the high school, the front door scanners also froze up in the morning. The rear door
scanner had locked up when Dr. Uchida arrived, but was fixed by the trouble shooter shortly
thereafter. The camera froze up at the side door entrance where the Board of Education gains
access. This was not remedied until late afternoon. 21st Century Solutions, Inc. 4-9
This document is a research report submitted to the U.S. Department of Justice. This report has not been published by the Department. Opinions or points of view expressed are those of the author(s) and do not necessarily reflect the official position or policies of the U.S. Department of Justice.

According to the Technology Coordinator, the systems froze because of a glitch in the
computer program. The programmers did not anticipate that multiple users would cause
problems in the system. But when one person used the system and then another person used it
(either simultaneously or within seconds after the first person), the system would “forget” that
the first user had entered his/her irises. This interruption caused the system to malfunction and
freeze. The Technology Coordinator and the representative from New Jersey Business Systems
determined that this was the cause of the problem by simultaneously entering their irises into the
system while the programmer observed the activity on-line.
A Glitch or a False Positive?
During the first day, Dr. Uchida observed parents and teachers as they came to the front
door to gain entry or to test the system. One parent, who was a member of the Public Safety
Committee, tried the iris recognition system a number of times before it allowed her in. Later
that day, she tried it again, but was consistently denied entry. The Technology Coordinator
suggested that she re-enroll her irises. When he and the parent went to the computer to re-enroll,
he discovered that she was in the control group and not in the treatment group. This explained
her inability to gain access most of the time, but did not explain how she was able to gain entry
on one occasion. From our assessment of this incident, it appears that this was a false positive,
though the Technology Coordinator was uncertain if it was a false positive or a glitch in the
computer program. In either case, had Dr. Uchida not witnessed the event, there would be no
way to determine that it occurred at all – there was no record of the incident in the database.
21st Century Solutions, Inc. 4-10
This document is a research report submitted to the U.S. Department of Justice. This report has not been published by the Department. Opinions or points of view expressed are those of the author(s) and do not necessarily reflect the official position or policies of the U.S. Department of Justice.

Surveillance Cameras and the Buzzer
Surveillance cameras were mounted above the entry ways at each iris camera location.
The cameras and videotape were initiated whenever physical motion occurred. Thus, the tapes
are not running all of the time; only when someone comes near the door. Each school has one
video server to record the motions, and the computer keeps a log of those motions – date and
time are automatically recorded. The ‘tapes’ can be downloaded to a CD-ROM for viewing by
an observer. The cameras were used primarily by secretaries who could determine who was at
the door requesting entry or pushing the buzzer button. From their vantage point, the secretaries
could view all cameras at one time on their computer screens.
Signage issues
Dr. Uchida noted that at each location the signs and information regarding the buzzer and
iris scanners was somewhat confusing. Field notes from other members of the evaluation team
also support this conclusion. There was a considerable amount of visual clutter in the vestibule
of the elementary school. Numerous signs were posted to remind parents to sign in at the main
office upon entry. Additional signs included warnings about parking along the curb outside the
building. In total, during one of our visits the vestibule displayed 16 signs. As a result of this
signage clutter, many of the parents, students, faculty, and vendors were confused about how to
gain entry into the school. One visitor was so confused that, in response to the signs insisting
upon having ‘Identification Ready’, she proceeded to wave her driver’s license in front of the iris
scanner in an attempt to unlock the doors. This confusion was experienced by those seeking to
enter all three of the New Egypt schools. For instance, students who needed to gain entry to the
high school would press the iris scanner button (which is green and says ‘push’) rather than the 21st Century Solutions, Inc. 4-11
This document is a research report submitted to the U.S. Department of Justice. This report has not been published by the Department. Opinions or points of view expressed are those of the author(s) and do not necessarily reflect the official position or policies of the U.S. Department of Justice.

white button for the intercom to get buzzed in. Students also constantly pushed the green iris
scanner button to see what would happen.
Parents and vendors who needed to gain entry at the high school and middle school were
also confused and did not know how to gain entry. Dr. Uchida suggested that more specific
signs be placed at the buzzer (e.g., a small label that says ‘buzz here’) and at the iris scanners.
USING THE TECHNOLOGY
For the 11 iris recognition stations, a total of 9,412 transactions occurred during our study
period of April 3 to June 23, 2003. During this time, school was in session 50 days and the iris
scanning system was used about 188 times each day at all three schools.
Of the 9,412 transactions, 78 percent (7,300 transactions) were successful, meaning that
the individual seeking entry was validated and permitted to enter. In approximately 16 percent of
the transactions, enrolled individuals were denied entry due to a camera error.
In 5.8 percent of transactions entry was denied because the individual was not enrolled
and thus not allowed to enter using their irises for validation. These are the cases that
demonstrated the system kept individuals out of the schools, until their identity could be
validated through other means. Looking more closely at three schools and individual cameras,
we can examine the reliability of the cameras under different operating situations. Six cameras
were placed in vestibules at the schools, while five were placed in lock boxes outside of the
schools. In general, those inside the vestibules performed better. Exhibit 4-1 provides
descriptive statistics on the traffic at the 11 iris scanners.
-EXHIBIT 4-1 ABOUT HERE-
Four iris scanning stations were installed in the elementary school, as shown in Exhibit 421st Century Solutions, Inc. 4-12
This document is a research report submitted to the U.S. Department of Justice. This report has not been published by the Department. Opinions or points of view expressed are those of the author(s) and do not necessarily reflect the official position or policies of the U.S. Department of Justice.

2. Almost 40 percent (or 3,695) of the transactions for the entire school system occurred at the
main entrance station for the elementary school. On average this meant about 74 transactions per
day. This station allowed access to the elementary school by parents as well as teachers and
staff.
-EXHIBIT 4-2 ABOUT HERE-
At the main entrance of the elementary school, nearly 79 percent of the transactions were
successful, meaning that entry into the school was allowed by the iris scanning device. Ten
percent of the time, entry was denied, and 11 percent of the time, there was a camera error.
At the other three entrances to the elementary school, the iris scanner was situated
outdoors in a lock box. Because of their position outdoors and exposure to direct sunlight, these
cameras had lower rates of successful entry into the school as indicated by the data in Exhibit 4
1. For example, at the South Front entrance, about 36 percent of the transactions were
successful, while 63 percent constituted camera errors. At the North Entrance, 39 percent were
successful, while 59.5 percent of the transactions constituted camera errors.
The New Egypt Middle School had three iris scanning stations, as shown in exhibit 4-3.
Traffic patterns at these stations were similar to those in the elementary school. The camera
located at the main entrance inside the vestibule processed 575 transactions, of which 80 percent
were successful. The station located outside of the north entrance yielded the highest camera
error, with 80 percent of the transactions failing. In part, because of the high failure rate, this
station was the least used, having the fewest number of total transactions at 148.
-EXHIBIT 4-3 ABOUT HERE-
As shown in Exhibit 4-4, the four iris scanning stations for the high school were placed
inside vestibules. All of them performed well. Seventy-seven percent of transactions at the main 21st Century Solutions, Inc. 4-13
This document is a research report submitted to the U.S. Department of Justice. This report has not been published by the Department. Opinions or points of view expressed are those of the author(s) and do not necessarily reflect the official position or policies of the U.S. Department of Justice.

door were successful while 95 percent of transactions at the other entry doors were successful.
-EXHIBIT 4-4 ABOUT HERE-
The majority of transactions for each school occurred at the main door. The main door of
the high school experienced a slightly higher camera error rate of 16.7 percent than the camera
error rates for the elementary school (11.3 percent) and the middle school (14.0 percent). The
denial rate for the elementary school was slightly higher at 10.1 percent than for the other two
schools, at 5.2 percent for the middle school, and 6.5 percent for the high school. As we noted
earlier, we did not advise parents of their status in the control or treatment group and that may
have encouraged more parents to attempt to enter when they were not enrolled to use the iris
scanning technology. In addition, during our observations, we witnessed high school students
who attempted to use the scanner even though they were not enrolled.
Implementation: Teachers’ and Staff Responses
As part of the second wave of surveys of teachers and staff, we asked 19 questions about
entry into the school buildings and eight questions about the use of T-PASS. Over 68 percent of
119 teachers and staff responding to the survey reported leaving the school building during
school hours at least once a day.1 The majority of those exiting during the school day, 58.3
percent, reported that they left to retrieve an item from their car. Fifty-three percent reported
they left for other reasons, while 21 percent left to attend meetings at other locations2.
Almost 60 percent of those responding to the survey reported that they used the iris
recognition technology to enter a New Egypt School building on at least one occasion. Of those
1 31 percent report exiting once per day during school hours, 18 percent twice, 17 percent three to five times and two percent exiting six to ten times per day. Twelve and half percent report that they never exit the school during
21st Century Solutions, Inc. 4-14
This document is a research report submitted to the U.S. Department of Justice. This report has not been published by the Department. Opinions or points of view expressed are those of the author(s) and do not necessarily reflect the official position or policies of the U.S. Department of Justice.

who reported using T-PASS, 83 percent believed that T-PASS provided more security in New
Egypt schools than in previous school years; none felt that it provided less security, although 16
percent felt it provided the same level of security as in previous years.
Over half felt that using T-PASS was more convenient than using the buzzer system to
enter the building; the remaining 46 percent were evenly split in their perception of whether T
PASS was as convenient as or less convenient than the buzzer system. Less than half of
respondents, 45.3 percent, believed that T-PASS was more convenient than using the swipe card
system to enter the building. However, 26.7 percent perceived it was as convenient to use T
PASS as the swipe card. A minority of respondents, 28 percent believed that the swipe card
system was a more convenient way to enter the building.
Using T-PASS presented problems to 82.2 percent of the 73 respondents using the iris
scanning technology on at least one occasion. Forty-five respondents reported that the camera
would not read their irises on the first attempt. Other complaints included: doesn’t activate when
pushing the button (2), could only use the iris scanner at the front door (3), machine kept telling
me to step back (2); machine did not work (13); and outdoor machines did not work (8). One
respondent commented that once the machine authorized entry, the door would not open. Ten
respondents reported that they were carrying materials and were unable to use the machine
without setting everything down.
As noted in the previous comments, the iris scanners located outdoors appeared to have
presented the most problems. We asked the teachers/staff to indicate which door they had
problems entering by marking the door on a diagram of the school. These teacher/staff responses
school hours, while 8.6 percent exit once a week and 10 percent report leaving once a month. 2 Percentages exceed 100 percent because respondents were able to choose multiple response options. 21st Century Solutions, Inc. 4-15
This document is a research report submitted to the U.S. Department of Justice. This report has not been published by the Department. Opinions or points of view expressed are those of the author(s) and do not necessarily reflect the official position or policies of the U.S. Department of Justice.

validated the data from the iris scanning database. Survey respondents reported the north
entrance (27 notations), south back entrance (23) and the south front entrance (14) of the
elementary school, and the north entrance (12) of the middle school, as the most troublesome
doors. All of these stations were outdoors with lock boxes exposed to direct sunlight.
Eighty-nine respondents reported they used the buzzer system to enter a New Egypt
school building on at least one occasion. Of 114 respondents, three-quarters believed that the
buzzer system provided more security in New Egypt schools than in the previous semester.
Sixty percent believed that the buzzer provided the same level of security as T-PASS. Twenty-
one percent believed that the buzzer provided more security than T-PASS. On the other hand, 19
percent perceived that T-PASS provided more security than the buzzer.
Unlike T-PASS, the buzzer presented fewer problems when entering the school. Only
14.2 percent reported having any problems with the buzzer. Of the 19 respondents who reported
a problem, almost half attributed the problem to the fact that no one responded to the buzzer.
Other respondents said they were carrying materials and were unable to use the buzzer without
setting everything down, or that the release time for the door was not long enough, requiring the
person to re-buzz before entering.
Fifty respondents reported that they entered the building by other means than the T-PASS
or buzzer during school hours. Some respondents answered ‘yes’ to specific survey response
options describing potential means of entering (i.e.: the door was propped open) and also
responded ‘yes’ to the ‘other’ scenario, in which they elaborated their means of entry. As a
result of this double answering, 81 instances of entry other than the T-PASS/Buzzer system were
recorded. Those 81 responses were as follows:
� 27 responded that the door was held open for them 21st Century Solutions, Inc. 4-16
This document is a research report submitted to the U.S. Department of Justice. This report has not been published by the Department. Opinions or points of view expressed are those of the author(s) and do not necessarily reflect the official position or policies of the U.S. Department of Justice.

� 25 entered when someone else used T-PASS or the buzzer system � 10 reported that the door was propped open � 9 have keys to the doors � 6 used the swipe card when it was reactivated � 4 reported they pulled the door and it was not locked
Implementation: Parents’ Responses
In the second wave of parents’ surveys, we asked 23 questions about entry into the school
buildings during school hours and/or use of the iris recognition technology. Almost three
quarters of parents responding to the survey reported picking up their child during school hours.
Half of parents reported picking up their child during school hours between one and four times
during the school year. The majority of those picking up the child during school hours reported
that the reason was the school was having an event (63.1 percent), the child had a doctor’s
appointment (59.2 percent) and/or the child was ill (36.9 percent).
Sixty-eight parents reported using T-PASS to enter New Egypt School on at least one
occasion. More than half of parent respondents reported they used T-PASS between one and
four times to pick up their child during school hours, as shown in Exhibit 4-5.
-EXHIBIT 4-5 ABOUT HERE-
Of those using T-PASS, 79.7 percent believed that T-PASS provided more security in
New Egypt schools than in previous school years. Only 2.9 percent felt it provided less security.
Almost 60 percent believed that T-PASS was easier to use than the buzzer system to enter the
New Egypt Elementary School while 33.8 percent believed that using T-PASS was as easy to use
as the buzzer system.
Unlike the teachers and staff, only 50 percent reported having problems using T-PASS.
Problems included: 21st Century Solutions, Inc. 4-17
This document is a research report submitted to the U.S. Department of Justice. This report has not been published by the Department. Opinions or points of view expressed are those of the author(s) and do not necessarily reflect the official position or policies of the U.S. Department of Justice.

� 21 parents (56.8 %) reported that the machine would not read their irises on the first attempt.
� 11 were in the control group and were therefore ineligible to gain access using the machine.
� 2 parents (5.4 %) reported that they were carrying materials and were unable to use the machine without setting everything down.
Sixty-six percent of responding parents reported using the buzzer system to enter the
New Egypt Elementary School on at least one occasion. Of this group, 42.6 percent believed
that the buzzer provided the same level of security as T-PASS. 20.6 percent believed that the
buzzer provided more security than T-PASS; on the opposite side, 36.8 percent perceived T
PASS provided more security than the buzzer.
As the teachers and staff reported, the buzzer presented fewer problems for those seeking
to enter the school. Only 11.3 percent of parent responders reported having any problems with
the buzzer. Of the eight respondents who reported a problem, all reported problems
understanding the instructions from the intercom system. Other respondents said they were
carrying materials and were unable to use the buzzer without setting everything down.
Only 28.7 percent of parents reported that they entered the school building during school
hours by a means other than T-PASS or the buzzer. In the majority of these cases, someone
opened or held the door open for them. Fifteen parents entered with someone else who used T
PASS or the buzzer system. One parent did note that the kitchen door was left open on a number
of occasions yet no one seemed to be delivering items.
We also asked parents about their experiences using the T-PASS to sign their child out of
school. Forty percent reported that they had signed their children out on at least one occasion.3
Almost sixty percent of 39 parents believed that T-PASS provided more security in the child sign
21st Century Solutions, Inc. 4-18
This document is a research report submitted to the U.S. Department of Justice. This report has not been published by the Department. Opinions or points of view expressed are those of the author(s) and do not necessarily reflect the official position or policies of the U.S. Department of Justice.

out process than the identification and roster sign out process. Over one-third believed it
provided the same level of security while only 5.1 percent believed it was less secure than the
identification and roster sign out process.
Almost the same percentage, 57.9 percent of parents, believed that using T-PASS was
easier than the identification and roster child sign out process. Forty-two percent believed it was
as easy as the identification and roster child sign out process. No one reported that T-PASS was
more difficult than the identification and roster child sign out process.
However, 30.2 percent reported that they had problems using T-PASS to sign out their
child. Nine parents reported that the machine would not read their irises on the first attempt and
three parents reported that the office staff was not familiar with T-PASS so they could sign their
child out. For example one respondent reported that he used T-PASS to enter the building but
then was asked to sign the child out by roster. Another reported that she used both T-PASS and
the identification and roster sign-out because staff did not tell her that only T-PASS was needed.
Using the Iris Recognition Technology: Direct Observations
During the course of the project, we observed the comings and goings of parents,
teachers, and staff at all three schools. Our observations mirrored the results from the surveys.
In particular, we found that some parents and teachers entered the schools by “tailgating” –
following a person into the building without buzzing or using the scanner. To learn more
systematically about the sequences through which people entered New Egypt Elementary
School’s front doors, we relied on systematic social observation, a research technique in which
3 Thirty-seven percent reported doing so on two occasions, 29 percent on one occasion, 13 percent on three occasions and 18 percent on four or more occasions. 21st Century Solutions, Inc. 4-19
This document is a research report submitted to the U.S. Department of Justice. This report has not been published by the Department. Opinions or points of view expressed are those of the author(s) and do not necessarily reflect the official position or policies of the U.S. Department of Justice.

trained observers record their observations systematically on detailed coding sheets (Mastrofski,
et al., 1998). We stationed our observers in the vestibule of the elementary school and asked
them to record each instance in which an individual attempted to gain access to the school
through the front doors. The actions of every individual entering through the front vestibule of
the school, regardless of their means of entry, was recorded on a separate coding sheet. We pilot
tested an initial draft of the coding form on April 16 and 17. That pilot test illustrated some
weaknesses in the original form, so we revised the form and conducted a second round of
observations from June 4 to 6.
Our systematic observations revealed that parents and visitors enter the front doors of the
school through a number of possible sequences. Some may enter the vestibule, try the door and
find it locked, and then use the buzzer system to gain access. Others may attempt to use the iris
scanner, get rejected, and then enter via an open door when another person leaves. Exhibit 4-6
lists the various means of entry, together with their frequencies. The most frequent scenario
included individuals who went directly to the buzzer.
-EXHIBIT 4-6 ABOUT HERE-
Tailgating was the second most frequent means of entry, with 109 of the 445 (24.5%)
individuals entering the school in this way. Tailgating included any entry in which the individual
did not personally use either the scanner or buzzer to gain entry. Tailgating occurred in a variety
of ways. The coding sheet contained four specific tailgating scenarios: following behind
individuals who had gained access via the buzzer (51%), following behind individuals who had
gained access via the scanner (29%), and entering when someone who is exiting holds the door
open (19%). There was only one instance of a fourth tailgating scenario. One individual, who
had been using the iris scanner throughout the day, saw students lined up inside the front of the 21st Century Solutions, Inc. 4-20
This document is a research report submitted to the U.S. Department of Justice. This report has not been published by the Department. Opinions or points of view expressed are those of the author(s) and do not necessarily reflect the official position or policies of the U.S. Department of Justice.

main entrance, and knocked on the door to have a student open the door for him. Exhibit 4-7
indicates the frequency with which each of the tailgating scenarios occurred. Of the 109
tailgaters, 88 entered behind someone who had either used the scanner or buzzer to gain entry.
Specifically, 52 tailgaters entered behind someone using the buzzer, making this scenario the
most frequent conduit to tailgating.
-EXHIBIT 4-7 ABOUT HERE-
The “other” category includes instances in which the means of entry was unique, separate
from any of the previously described sequences. Some of the “other” means of entry contained
elements of the original list of sequences. For instance, individuals may have needed assistance
first, and then went straight to the buzzer. This was the most frequent “other” scenario. The
remaining “other” scenarios were isolated incidents. Descriptions and frequencies of each
scenario are presented in Exhibit 4-8. A majority of the “other” scenarios included individuals
who needed assistance before gaining entry via the buzzer or iris scanner.
-EXHIBIT 4-8 ABOUT HERE-
Using the Iris Recognition Technology: Other Perspectives
Information from the site visit notes and visitor interviews also provides insight about
how the technology was used. Analysis of these qualitative data sources indicates problems with
the accessibility of the outdoor iris scanners. Parents, faculty, staff, and members of the research
team reported problems with these scanners. The main source of complication appeared to be
light reflecting off the camera. Sunlight reflecting off the camera lenses made it difficult for the
scanner to accurately read individual irises.
Another recurring problem concerns the accessibility of side entrances not equipped with 21st Century Solutions, Inc. 4-21
This document is a research report submitted to the U.S. Department of Justice. This report has not been published by the Department. Opinions or points of view expressed are those of the author(s) and do not necessarily reflect the official position or policies of the U.S. Department of Justice.

iris scanners. These doors are supposed to be kept locked at all times under the schools’
lockdown policy. However, site visit notes taken prior to the implementation of the scanner
indicate that doors were left propped open regularly. After implementation, propped or unlocked
doors were still evident, though not as commonplace. Regardless of frequency, such occurrences
undermine the anticipated effects of the iris scanning technology. The technical difficulties
associated with the outdoor scanners may be one reason why faculty and staff chose to prop open
doors or leave them unlocked. However, this reasoning does not alleviate the security concerns
inherent in leaving school entrances accessible to anyone choosing to enter. One observer also
noted during several visits that the door to the electrical control room in the high school was left
unlocked and unsupervised. He lingered there for 15 minutes without being questioned and
determined that he could shut down the power to the middle and high schools. This again
represents a security risk and should be rectified.
CONCLUSION
The implementation of iris recognition technology in New Egypt public schools is similar
in many ways to other organizations’ efforts to implement new technologies. In other ways,
however, the story is unique. As with other technologies, implementation occurred as a result of
a handful of influential individuals who recognized a problem, identified a potential solution, and
made the necessary arrangements to implement that solution. At the same time, the
implementation process experienced some obstacles. Some of them concerned communications
and relationships with technology vendors, while others concerned integrating new technologies
with existing ones. Again, these experiences are common. In New Egypt, however, the
implementation of iris recognition technology occurred within a brief period of time and was 21st Century Solutions, Inc. 4-22
This document is a research report submitted to the U.S. Department of Justice. This report has not been published by the Department. Opinions or points of view expressed are those of the author(s) and do not necessarily reflect the official position or policies of the U.S. Department of Justice.

subjected to a rigorous evaluation. Although new technologies are often studied to make sure
they function as intended in the laboratory, they often take longer to implement in the field,
particularly with human subjects. In addition, they are not often subjected to rigorous
examinations of their implementation. We congratulate and thank all of the people who made
the evaluation possible. At the same time, we ask their indulgence as we point out some of the
bumps in the road that might not have been so obvious, or at least not written about, had they not
agreed to allow us to observe the implementation process so closely. By documenting these
experiences in New Egypt we hope to provide other people in other jurisdictions or other settings
with important information.
Overall, we found that the New Egypt School District planned, installed and implemented
the iris recognition technology within a relatively brief period of time, within budget, and with
sensitivity to the nuances of the interrelationships between technology and people. All things
considered, even with the challenges of installing a new and untested technology, the Assistant
Superintendent, the Technology Coordinator, New Jersey Business Systems, and their workers
made sure that the project would be completed on time and within the budget provided by the
National Institute of Justice. When they realized that they needed more equipment, the
Technology Coordinator initiated discussions with vendors to obtain donations of computer
servers and software. When delays in implementation occurred because of a misunderstanding
with the vendors, they overcame the problems and worked 18-hour days to install the equipment.
This allowed us to conduct the evaluation during the spring semester of 2003. Had they not
completely installed the equipment by the end of March, we would have run into serious
measurement problems because the school year was about to end. The testing period would have
been too short to determine the effects of the technology on parent and teacher perceptions. 21st Century Solutions, Inc. 4-23
This document is a research report submitted to the U.S. Department of Justice. This report has not been published by the Department. Opinions or points of view expressed are those of the author(s) and do not necessarily reflect the official position or policies of the U.S. Department of Justice.

The team involved in the project was also mindful of the ways in which parents, teachers
and staff might react to the new technology. In particular, the Assistant Superintendent
continually educated people about the iris scanners, buzzer system, and addressed problems and
issues as they arose. He recognized that another staff person was needed at the elementary
school to assist the secretary in registering parents into the system, in monitoring the surveillance
cameras, and in allowing people into the building during school hours. Without this additional
person, the secretary would have been overwhelmed with additional responsibilities.
Lessons Learned
Through the evaluation, we were able to draw other conclusions about the use of the iris
recognition technology as it relates to school security and building security, generally.
Our primary concern about the application of the technology as a school security measure
is tailgating. Tailgating was the second most frequent means of entry into the New Egypt
Elementary School during days we conducted our observations. Because we did not conduct
observations of tailgating before implementation, we do not know whether it changed in nature
or frequency. However, if iris recognition technology is to be taken seriously as an access
control measure, it needs to account for this most basic element of human behavior: politeness.
People consider it impolite not to hold a door open for somebody who is behind them. New
technologies are emerging within the access control field more generally to detect and defeat
tailgating. For instance, some products use infrared sensors to detect when more than one
individual passes through an access control point.4 One solution may be to couple iris
recognition with these technologies so that when a tailgater attempts to enter behind someone
21st Century Solutions, Inc. 4-24
This document is a research report submitted to the U.S. Department of Justice. This report has not been published by the Department. Opinions or points of view expressed are those of the author(s) and do not necessarily reflect the official position or policies of the U.S. Department of Justice.

who has successfully gained entry via iris scanning, an alarm sounds. Of course, in a school-
based setting, allowances would need to be made for “acceptable” or “permissible” tailgating by
small children accompanying parents, delivery personnel, classes, etc.
Furthermore, a substantial investment in iris recognition technology presupposes that
other, more mundane security measures, have been taken into account. One of the doors at the
high school was routinely either unlocked or propped open with a brick. The electrical room at
the high school was unlocked and unsupervised every time we checked it, potentially enabling an
outsider to cut off all the power to the middle and high schools, therefore shutting down iris
scanners, video cameras, computers, etc… At the elementary school, we found the exterior door
just outside the library open or unlocked frequently. When members of the evaluation team
conducted security surveys around the schools, students would routinely open the doors for us
even though they did not know who we were. These basic security measures need to be taken
into account first before making a substantial investment in expensive access control technology
like iris recognition.
At the same time, the implementation of iris recognition technology in New Egypt
represents a substantial victory. Despite miscommunications with the vendors, hardware and
software glitches, and the technical challenges of integrating new and old technologies, the New
Egypt schools were able to get the technology up and running in an amazingly short time. There
were no major objections to the technology from its pool of potential users. Although we have
identified some challenges regarding how the technology interacts with human behavior (e.g.,
tailgating, propping doors open, etc.), from a purely technological standpoint, it works well.
Nearly every person who attempted to enroll his or her irises did so successfully. With only one
http://www.designedsecurityinc.com/optical_turnstiles.htm 21st Century Solutions, Inc. 4-25 4
This document is a research report submitted to the U.S. Department of Justice. This report has not been published by the Department. Opinions or points of view expressed are those of the author(s) and do not necessarily reflect the official position or policies of the U.S. Department of Justice.

exception, the system kept out those who didn’t belong. There were numerous instances in
which the system failed to let in people who did belong, but this is the “preferred” error in access
control (over letting in those who do not belong). These false negatives were the result of
several issues, chief among them that the technology works poorly outside. Even this result
represents an important lesson learned in this evaluation.
Our findings in this chapter provide a challenge to at least three different audiences:
program evaluators, technology vendors, and schools. For evaluators, the challenge is to study
patterns in security-related behaviors over a longer time period using more comprehensive
outcome measures. Due to time constraints, we had difficulty in studying the way people
entered the schools before iris recognition was implemented. Therefore we were unable to draw
inferences about how various behaviors (such as tailgating) changed. Furthermore, our
evaluation ended only a few months after implementation, therefore we were unable to witness
how the technology folded into the everyday lives of its users after the newness wore off. Doing
so would be beneficial. Furthermore, testing the technology in a more urban setting where more
useful outcome measures could be collected would also be useful. Data on potential breaches of
security, access control failures, crimes, or other incidents committed by outsiders would also
improve the evaluation.
For technology vendors, there are two primary challenges necessary to advance iris
recognition as an access control measure. First, the product lines should be augmented for use
outdoors. They should be developed and tested within secure, waterproof enclosures that enable
users to hear the instructions provided by the devices, while at the same time filtering out the
deleterious effects of sunshine and rain. Second, vendors should begin to explore methods for
pairing iris recognition with anti-tailgating technologies. No matter how well iris recognition 21st Century Solutions, Inc. 4-26
This document is a research report submitted to the U.S. Department of Justice. This report has not been published by the Department. Opinions or points of view expressed are those of the author(s) and do not necessarily reflect the official position or policies of the U.S. Department of Justice.

works in the laboratory, in the field it is no match for the politeness or fear of social rebuke that
led many people to defeat the technology by holding doors open.
For schools, the challenge is to implement iris recognition or other biometric access
control technologies within the context of an overall school security strategy. This strategy
should take into account not only technology, but also human behavior. Smokers, for instance,
tend to prop open doors for smoking breaks. They sometimes forget to close or lock the doors
afterwards. Students, faculty, and staff need to be instructed not to open the doors for people
they don’t know. Rooms where people with bad intentions can easily do bad things – such as
electrical rooms- should be closed and locked at all times. Iris recognition and other biometric
access control measures can be an important component of an overall security strategy, but as we
have shown in this chapter, they are only one component. In Chapter 2 we reviewed some of the
research findings on “what works” in school-based crime prevention; these programs and
policies should also constitute an important part of an overall school security strategy.
21st Century Solutions, Inc. 4-27
This document is a research report submitted to the U.S. Department of Justice. This report has not been published by the Department. Opinions or points of view expressed are those of the author(s) and do not necessarily reflect the official position or policies of the U.S. Department of Justice.

CHAPTER 5
FINDINGS: IMPACT EVALUATION
Edward R. Maguire, Craig D. Uchida, Shellie E. Solomon, Megan Gantley, and Kevin Daniels
Our evaluation of the impact of iris scanning technology and other school security
measures adopted in New Egypt’s schools focused on four general areas: (1) changes in the
perceptions of parents (2) changes in the perceptions of teachers and staff (3) “Other” impacts
on teachers, staff, and parents, and (4) efficiency in processing visitors and parents. This chapter
explores the findings from our impact evaluation in each of these areas.
The data used to analyze program impact in these four substantive areas are drawn from a
variety of sources, as described in Chapter 3. These sources included site visit notes, surveys of
teachers, surveys of parents, interviews, and data from our systematic observation of entrances
into the front doors of New Egypt Elementary School. As the following paragraphs sift through
the evidence from our impact evaluation, the interconnected nature of these four substantive
areas will become more apparent. Taken as a whole, this chapter represents a systematic effort
to examine the effectiveness of iris scanning technology and other security measures in New
Egypt’s public schools.
1. CHANGES IN THE PERCEPTIONS OF PARENTS
One of the major potential benefits of the school security measures implemented in New
Egypt is a change in the perceptions of parents. We computed various measures of parents’
perceptions from surveys conducted before and after implementation. The survey instrument
contained dozens of questions concerning perceptions of problems in the schools, problems in
21st Century Solutions, Inc. 5-1
This document is a research report submitted to the U.S. Department of Justice. This report has not been published by the Department. Opinions or points of view expressed are those of the author(s) and do not necessarily reflect the official position or policies of the U.S. Department of Justice.

the neighborhood, and safety, security, and efficiency in the schools. Our general approach was
to construct a series of composite measures to reflect parental perceptions. For example, to
measure perceptions of problems existing in the school, we combined the twenty questions
measuring these perceptions into a single composite measure that can range from 0 (no
problems) to 20 (many problems). We then conducted statistical tests to determine whether the
change in the composite scores from wave one to wave two represented a statistically significant
difference. This approach seems the most parsimonious considering the large number of survey
questions. This section outlines the methodology surrounding the construction of these indexes
and discusses the aggregate data obtained about program impact on parents at New Egypt
Elementary School. It is important to note that only parents of students attending the elementary
school were surveyed, not parents of students at the middle school or high school.
We created five indexes measuring separate dimensions of parental perceptions to
explore the impact on parents at NEES.
• Perceptions of problems existing at school
• Perceptions of safety around/in school
• Perceptions of problems in neighborhood around school
• Perceptions of security at NEES
• Efficiency of sign-in process
Appendix A lists the individual items used to construct each index used in this analysis.
-EXHIBIT 5-1 ABOUT HERE-
Exhibit 5-1 presents summary information describing each index, including descriptive
statistics for both waves of data from the New Egypt Elementary School parent surveys. All of
21st Century Solutions, Inc. 5-2
This document is a research report submitted to the U.S. Department of Justice. This report has not been published by the Department. Opinions or points of view expressed are those of the author(s) and do not necessarily reflect the official position or policies of the U.S. Department of Justice.

the scales are reliable according to the Cronbach’s alpha coefficients presented in Exhibit 5-1.
These aggregate indicators of program impact show no significant change in three of the five
indices we examined. These three indices include:
• Perceptions of Problems Existing at School
• Perceptions of Safety Around/In School
• Efficiency of Sign-in Process
Perceptions of problems in the neighborhood around the school decreased slightly, but not
enough to constitute a statistically significant decrease at the conventional threshold of p < .05.
We highlight this finding because small sample sizes sometimes result in substantively
significant findings becoming statistically insignificant. Consistent with our expectations,
perceptions of security at NEES increased significantly from wave 1 to wave 2.
In addition to the aggregate indices we have just presented, two of the individual survey
questions are also worth exploring separately. Exhibit 5-2 lists these two individual questions
along with the mean values of the responses for parents at both wave one and wave two of the
surveys. These response options were ordinal in format, with a possible range of 1 (strongly
disagree) to 4 (strongly agree). The analysis indicates that parents experienced a statistically
significant decrease in their perceptions that getting into the school building without being
noticed is easy. Parents also exhibited a statistically significant decrease in their perceptions that
propping open the doors that are locked is common practice at the school.
Taken together, the findings from two waves of parent surveys suggest that parents’
perceptions of safety and problems in and around the school did not change significantly, nor did
perceptions of efficiency in the sign-in process. However, perceptions of security related to
access control -keeping out those who don’t belong- appear to have improved substantially.
21st Century Solutions, Inc. 5-3
This document is a research report submitted to the U.S. Department of Justice. This report has not been published by the Department. Opinions or points of view expressed are those of the author(s) and do not necessarily reflect the official position or policies of the U.S. Department of Justice.

-EXHIBIT 5-2 ABOUT HERE-
Explaining Changes in Parents’ Perceptions
So far, we have only presented an aggregate analysis of change, exploring whether
parents’ overall perceptions of safety and security changed from the pre-intervention to the post-
intervention phase. The next stage of the analysis examines the factors responsible for change in
individual perceptions from time one to time two.
Initially we sought to conduct such an analysis using a classic experimental design. The
most basic analysis in an experimental design looks at the effect of treatment/control group status
on changes in scores before and after program implementation. As we have argued earlier,
however, there are several reasons to doubt the internal validity of the intended experimental
design in this study. Even though those assigned to the control group were not able to use the
iris scanners, they were still exposed to the scanners in several ways: they still had their irises
“enrolled”, they attended a discussion about the technology, and many (if not all) were exposed
to stories about the technology appearing in both local and national media. The media attention
was substantial and significant for residents of a small town like New Egypt. These various
forms of “exposure” provide good reasons to suspect randomization failure, a common threat to
the internal validity of experiments. In this case, both the treatment and control groups received
some level of exposure to the treatment, which makes it much more difficult to detect a treatment
effect.
We begin our individual-level impact assessment by examining the effect of assignment
to the treatment or control group (hereafter called “group assignment”) on the five scale scores.
Recall that those assigned to the control group had to use the buzzer, while those assigned to the
treatment group were allowed to use the iris scanner. Exhibit 5-3 presents the findings from a
21st Century Solutions, Inc. 5-4
This document is a research report submitted to the U.S. Department of Justice. This report has not been published by the Department. Opinions or points of view expressed are those of the author(s) and do not necessarily reflect the official position or policies of the U.S. Department of Justice.

series of independent sample t-tests comparing the scale scores for the two groups. The first
column describes the content of the scale, and the second column lists its range of possible
scores. The third column lists t-values and significance levels for differences between the
treatment and control groups at wave one. The final column lists t-values and significance levels
for the differences between the treatment and control groups in change scores from wave one to
wave two.1
-EXHIBIT 5-3 ABOUT HERE-
Two findings are evident from Exhibit 5-3. First, group assignment did not have a
statistically significant effect on parent’s perceptions at wave one. In other words, the treatment
and control groups appear to have had similar perceptions of safety and security prior to the
implementation of the new security measures. This suggests that the initial randomization
procedure was successful. Second, group assignment had only one effect on changes in
perceptions of security and safety from wave one to wave two: the treatment group perceived an
increase in the number of problems in the neighborhood around the school, while the control
group perceived a decrease. We have no ready explanation for this peculiar finding. Group
assignment had no effect on changes in the other four perceptual dimensions.
If we were not suspicious about problems with internal validity, this weak set of effects
might represent convincing evidence that the school security measures implemented in New
Egypt Elementary School did not improve parents’ perceptions of security and safety in and
around the school. As we have argued above, however, we do have concerns about internal
There are two approaches to estimating two wave panel models like the one we use here. One approach is to use the wave two score as the dependent variable and use the wave one score as an independent variable. The second approach, and the one we use here, involves computing the difference between the wave one and two scores and using it as the dependent variable. The use of change scores (also known as difference scores or gain scores) has been considered controversial in the past, but recent research supports this approach (Allison, 1990; Maris, 1998).
21st Century Solutions, Inc. 5-5
1
This document is a research report submitted to the U.S. Department of Justice. This report has not been published by the Department. Opinions or points of view expressed are those of the author(s) and do not necessarily reflect the official position or policies of the U.S. Department of Justice.

validity. As a result, we find it prudent to step back from the classic experimental design we
originally hoped to conduct, and select a different form of impact assessment.
Experimental designs implemented in the real world, outside the controlled atmosphere
of a laboratory, often fall victim to a variety of design threats. In such cases, it is usually both
possible and prudent to modify the design, falling back on a family of evaluation methods known
as quasi-experiments. There are many kinds of quasi-experiments; the one we have chosen to
use here is known as a “statistical controls” design. Essentially, we will explore the effect of a
series of independent variables on changes in parent’s perceptions of safety and security in and
around the schools before and after program implementation. This method allows us to assess
the factors that influence those perceptions of safety and security and to determine whether they
are related to the security measures implemented by the school.
Our analysis explores the impact of two “classes” of independent variables: the first set
contains a variety of individual-level background characteristics that are essentially unrelated to
the schools and the security measures implemented there. They include demographic features
like age, marital status, employment status, education, home ownership, and how long the person
has lived within the community. We also include a composite measure of comfort with
technology to test the hypothesis that people who are more comfortable with technology in
general will be more apt to react positively to the new security technologies implemented in the
schools. In addition, we include several program-related factors: group assignment (treatment
or control), a composite measure of the extent to which the individual was exposed to media
stories about the iris scanning technology, whether the individual has used the iris scanners to
enter the school, whether he/she has used the iris scanners to check a child out of school, and
whether he/she has used the buzzer system to enter the school. Overall, we have confidence that
21st Century Solutions, Inc. 5-6
This document is a research report submitted to the U.S. Department of Justice. This report has not been published by the Department. Opinions or points of view expressed are those of the author(s) and do not necessarily reflect the official position or policies of the U.S. Department of Justice.

the statistical controls design we have just described will have greater validity than the classic
experimental design we first sought to conduct.
Our general approach is to build a regression model to explore the effects of the
independent variables we have just described on changes in the five scale scores from wave one
to wave two. We can hopefully discern from that analysis some information about the factors
that influenced changes in parents’ perceptions. Exhibit 5-4 contains the results of the regression
analyses for each of the five scales.
-EXHIBIT 5-4 ABOUT HERE-
The results demonstrate that only three of 55 regression coefficients are statistically
significantly different from zero. Recall that at the conventional threshold of statistical
significance used by social scientists (p<.05), one of every twenty coefficients will be significant
by chance alone. By just that criterion, the set of independent variables included in these models
does not appear to have a robust effect on changes in parents’ perceptions.
Three of the models that have a change score as the dependent variable are non
significant. These same models become statistically significant when we alter the specification
so that the time two scale score is the dependent variable and the time one scale score is included
in the model as a covariate. Two of the models that have a change score as the dependent
variable are significant: perceptions of problems existing at school, and perceptions of problems
in the neighborhood around the school. Group assignment to the treatment group has a
significant positive effect in both of these significant models: treatment group participants
perceived there to be more problems both in school and around the school after implementation.
One other “nuisance” finding emerges from the covariates: people who used the iris scanner to
sign out their child perceive fewer problems in the school, but this coefficient was insignificant
21st Century Solutions, Inc. 5-7
This document is a research report submitted to the U.S. Department of Justice. This report has not been published by the Department. Opinions or points of view expressed are those of the author(s) and do not necessarily reflect the official position or policies of the U.S. Department of Justice.

in the model with the time 2 scale scores as the dependent variable and only borderline
significant in the change score model. It is important to point out that people who used the iris
scanner did not, for the most part, perceive the school as safer or more secure.2 Further, those in
the treatment group perceived more problems after implementation.
These findings, while important, need to be interpreted with caution. We were only able
to match about 65-70 of the cases across the wave one and wave two surveys. The models were
therefore somewhat unstable, with too few cases and too many independent variables. Statistical
power to detect significant effects is weak under such conditions. Alternative models that we
estimated using only a subset of these independent variables produced similar results, however.
Overall, the analyses presented in this section make it difficult to conclude with any confidence
that people in the treatment group or people using the iris scanner felt safer or more secure. In
fact, there is evidence that people in the treatment group may actually have experienced a
“boomerang” effect whereby they perceived a larger number of problems in school and in the
neighborhoods around the school after program implementation. One possibility may be that the
implementation of the iris scanners served as a potent reminder of the problems in and around
the school. Although the regression analysis was unable to attribute changes in perceptions of
security to any of the independent variables included in the model, it is important to remember
that these perceptions increased significantly from wave 1 to wave 2. Though using the iris
scanner or being in the treatment group did not influence this change, it is still an important
finding. Perhaps the media attention to the implementation of iris scanning led to an across-the-
2 In one of the models, using the iris scanner to check out a child from school resulted in decreased estimate of the number of problems in school. This effect was significant in the change score model, but nonsignificant in the covariate model. Therefore, we view the effect as unstable. 21st Century Solutions, Inc. 5-8
This document is a research report submitted to the U.S. Department of Justice. This report has not been published by the Department. Opinions or points of view expressed are those of the author(s) and do not necessarily reflect the official position or policies of the U.S. Department of Justice.

board increase in perceptions of security among parents, even those who didn’t use the
technology personally.
2. Changes in the Perceptions of Teachers and Staff
Teacher and Staff Survey Data
Another potential impact of the school security measures implemented in New Egypt
were changes in the perceptions of teachers and staff. Two waves of surveys were administered
to teachers and staff at New Egypt’s elementary, middle, and high schools. We used the same
methodology to analyze the teacher survey data that we used to analyze the parent survey data
(i.e., composite indices were constructed to measure different perceptual domains). These were
essentially the same perceptions we measured among parents: problems in the school, problems
in the neighborhood, school safety, and school security (see Exhibit 5-1). Teachers do not
participate in the sign-in and sign-out process. As a result, their perceptions of the efficiency of
this process were not assessed.
Exhibit 5-5 presents each index, its possible range, Cronbach’s alpha values, and
descriptive statistics for both waves of data from the New Egypt Elementary School teacher and
staff surveys. The final column contains statistical significance levels computed using
independent sample t-tests for the two waves of data.3 The alpha coefficients, which serve as
one indicator of the reliability of a measure, suggest that three of the four indices are internally
consistent. The fourth index, perceptions of security, has a problem with measurement error at
wave 1. Together, these aggregate indicators of program impact demonstrate mixed effects.
This method of testing for differences between waves is not ideal because the samples are not truly “independent.” Because we were unable to link the wave 1 and wave 2 survey data for teachers, this approach was the only available option. 21st Century Solutions, Inc. 5-9
3
This document is a research report submitted to the U.S. Department of Justice. This report has not been published by the Department. Opinions or points of view expressed are those of the author(s) and do not necessarily reflect the official position or policies of the U.S. Department of Justice.
Three of the four scales did not change at a statistically significant level from wave one to wave
two. Consistent with our findings from the parent surveys, however, perceptions of security
among teachers and staff at NEES increased significantly.
-EXHIBIT 5-5 ABOUT HERE-
There are some interesting contrasts to note between parents and teachers at the onset of
the evaluation at New Egypt Elementary School. In general, teachers perceived significantly
more problems, both in the school, and in the neighborhood, than parents. However, teachers
also perceived the school to be safer than parents did.
Exhibit 5-6 presents each index, its possible range, and descriptive statistics for both
waves of data from the New Egypt Middle School teacher and staff surveys. Once again, there
were no statistically significant changes in three of the four scales. Teacher and staff perceptions
of security at NEMS increased significantly, however, from wave one to wave two.
-EXHIBIT 5-6 ABOUT HERE-
Exhibit 5-7 presents each index, its possible range, and descriptive statistics for both
waves of data from the New Egypt High School teacher and staff survey. New Egypt High
School is an anomaly in that it represents the only school that experienced decreased perceptions
of safety and increased perceptions of problems following program implementation.
Meanwhile, perceptions of problems in the neighborhood around school, and perceptions of
security at school did not change significantly. It is important to keep in mind that access control
technology was not the only important change that occurred in New Egypt High School during
the study period. As we noted in Chapter One, it was the first year that the high school had four
complete grades and a graduating senior class. Changes in teachers’ perceptions of problems
21st Century Solutions, Inc. 5-10
This document is a research report submitted to the U.S. Department of Justice. This report has not been published by the Department. Opinions or points of view expressed are those of the author(s) and do not necessarily reflect the official position or policies of the U.S. Department of Justice.

may have been a product of this important change, rather than, or in addition to changes in
access control measures.
-EXHIBIT 5-7 ABOUT HERE-
In addition to the aggregate measures we have just explored, two individual survey
questions are also very helpful for exploring program impact. The questions contain ordinal
response options ranging from 1 to 4, with higher scores representing less security. These results
are presented in Exhibit 5-8. Teachers and staff in all three schools experienced significant
decreases in their perceptions that getting into the school building without being noticed is easy.
At the same time, when asked whether propping open the doors that are locked is common
practice as the school, only teachers and staff at NEES experienced a significant decrease from
wave one to wave two. The findings for the middle school and high school are consistent with
our observation that doors are propped open regularly, particularly at the high school. Though
we observed propped doors at the elementary school as well, the teachers and staff perceived a
significant decrease. This finding suggests that the teachers and staff in New Egypt’s schools
viewed the new access control measures as effective at keeping people out who do not belong.
-EXHIBIT 5-8 ABOUT HERE-
3. “Other” Impacts on Teachers, Staff, and Parents
Every member of the research team who visited New Egypt during the course of the
evaluation maintained detailed site visit notes. These notes contained a listing of the researcher’s
daily activities; observations about the community, the school, and the technology; and
21st Century Solutions, Inc. 5-11
This document is a research report submitted to the U.S. Department of Justice. This report has not been published by the Department. Opinions or points of view expressed are those of the author(s) and do not necessarily reflect the official position or policies of the U.S. Department of Justice.

complaints, praise, comments, and other impressions from school faculty, staff, visitors, parents,
and others. Detailed notes were taken throughout the project, including two separate visits in
April 2003, one visit in May 2003, and two visits in June 2003. In addition to these site visit
notes, members of the research team also conducted a series of structured and unstructured
interviews with parents, faculty, staff, and visitors. These interviews explored a number of
topics, some related to the process of implementation, and some related to program impact. The
site visit notes, combined with the interview data, provide a glimpse of the project’s impact on
teachers, staff, and parents.
The strongest support for the iris scanning technology came from New Egypt Elementary
School’s (NEES) secretaries. Both of the secretaries we interviewed commented that as a result
of the school security measures, they have felt much more secure in their efforts to process all
NEES visitors. In particular, one secretary noted that the iris scanner has “significantly cut down
on the amount of parents walking around the school trying to find their kids.” This sentiment
was reiterated in a number of other interviews. Faculty and staff have directly benefited from a
reduction in unsupervised visitors, while parents indirectly benefit with an enhanced peace of
mind.
Similarly, employees of New Egypt High School (NEHS) remarked that parents were no
longer able to enter the school without first gaining proper clearance. In fact, of the 27
respondents interviewed within the vestibule of NEES, 19 indicated they felt the iris scanner had
increased the safety of New Egypt schools. One concrete example provided by a NEHS
secretary illustrates the benefit of T-PASS on faculty, staff, and students. A young girl was
being stalked, and the police approached the school with a picture of the suspect. School
administrators were told to call the police if the suspect made an appearance on school grounds.
21st Century Solutions, Inc. 5-12
This document is a research report submitted to the U.S. Department of Justice. This report has not been published by the Department. Opinions or points of view expressed are those of the author(s) and do not necessarily reflect the official position or policies of the U.S. Department of Justice.
While the stalker never showed up on school grounds, the secretary felt that she was secure in
her ability to help police, if necessary, as the result of the iris scanning technology. Comments
such as these, where faculty and parents expressed an increased feeling of security, were
abundant. However, the perceived benefits of the technology were not only limited to a feeling
of increased security.
During the initial phase of implementation, several observers noted that T-PASS made it
faster for parents to sign-out their children. Observations showed that parents enrolled in the
system were able to leave much faster than those parents still waiting to manually sign
themselves out. Furthermore, as participants become more comfortable with the iris scanning
process, it is likely that this efficiency will increase.
While negative impacts were also reported, they were mostly isolated to incidents of
technological glitches in T-PASS. Interviews conducted with parents and faculty demonstrated
that most complaints concerned the sporadic and inconsistent nature of the iris scanner. For
example, a number of parents, teachers, and staff indicated that on rare occasions the scanner
would deny appropriate authorization. More frequently, the scanner would require multiple
attempts on some occasions and only one attempt on others. While these inconsistencies may be
attributed to user error, they were the most frequently reported complaints.
In addition, a few of the interview respondents acknowledged that despite the increase in
security, people were still able to enter the school building when they wanted. In fact, two
respondents specifically addressed the issue of tailgating. One parent, for example, commented
that she “felt guilty” turning people away who were attempting to follow behind her. These
concerns constitute the sum of problems and concerns associated with the impact of the iris
scanning technology. The technology may in some cases make the processing of visitors more
21st Century Solutions, Inc. 5-13
This document is a research report submitted to the U.S. Department of Justice. This report has not been published by the Department. Opinions or points of view expressed are those of the author(s) and do not necessarily reflect the official position or policies of the U.S. Department of Justice.

efficient, and in many cases enhance feelings of security in both parents and faculty. On the
other hand, tailgating and technical glitches might limit the anticipated benefits of the
technology.
4. Efficiency in Processing Visitors and Parents
One of the perceived benefits of the iris scanning technology was to enhance the
efficiency of office staff in processing parents and visitors. Each school requires parents and
visitors to sign in upon entering, and sign out upon leaving the school. Implementation of the iris
scanning technology could conceivably improve upon the efficiency of both the sign-in and sign-
out process. To evaluate whether or not efficiency increased, we analyzed multiple data sources,
including the site visit notes, interviews, electronic data from the iris scanner’s transactions log,
paper files of visitor sign-ins at NEES, and results from the survey of parents.
The parent survey directly addressed the subject of efficiency through a series of
questions with likert-scale response options. Recall that we formed the responses to these
questions into a composite index. As reported earlier in the chapter, parents’ perceptions of
efficiency did not change significantly from wave 1 to wave 2.
The field notes, on the other hand, provide support for the notion that the iris scanning
process increased efficiency. Initially, parents, faculty, and visitors were confused about how to
gain entry into the school buildings. However, data from the surveys, interviews, and
observations suggest that this confusion subsided as people became more familiar with the new
security measures. One parent told us that she slowly became more familiar with and
accustomed to the technology. Furthermore, when the iris scanners were first installed, the
vestibule of the elementary school was cluttered with signs addressing the use of the iris scanner
21st Century Solutions, Inc. 5-14
This document is a research report submitted to the U.S. Department of Justice. This report has not been published by the Department. Opinions or points of view expressed are those of the author(s) and do not necessarily reflect the official position or policies of the U.S. Department of Justice.

and parking issues. The signs were so numerous that in strong likelihood they led to much of the
confusion experienced by parents, faculty, staff, and visitors. However, as the number of signs
was reduced in the following weeks, so too did the amount of confusion. After a significant
adjustment period, the reactions of parents, faculty, staff, and visitors became much more
positive.
Interviews conducted with New Egypt Elementary School secretaries also support a
finding that iris scanning increased efficiency in processing visitors. Specifically, the secretaries
noted that they were more likely to process every person entering the building as a result of the
new security measures. Furthermore, they felt that visitors were less likely to enter the building
without following procedure. The most concrete examples of increased efficiency are
encountered when analyzing the process by which parents sign out their children. NEES
secretaries stated that they were impressed with the increased efficiency of parents lining up to
take their children out of school. One observer noted the following example, which directly
highlights the benefits experienced as a result of the new security measures. As buses full of
parents and children arrived back to NEES at the end of the school day, the parent chaperones
proceeded to sign out their children. Those who were registered for the iris scanner were able to
breeze by non-registered parents and sign out their children in a more timely fashion. Examples
like this add to the notion that the iris scanning system has helped to create a more efficient
visitor processing system. Much of the increased perceptions of security can likely be attributed
to increased perceptions of efficiency.
One final analysis can also shed light on potential improvements in efficiency. We
obtained electronic records of all iris scanner traffic from the transaction logs. We also obtained
paper copies of all visitor sign-in sheets from February 11 (about 7 weeks before
21st Century Solutions, Inc. 5-15
This document is a research report submitted to the U.S. Department of Justice. This report has not been published by the Department. Opinions or points of view expressed are those of the author(s) and do not necessarily reflect the official position or policies of the U.S. Department of Justice.

implementation) until the end of the school year. We then created a database in which each row
constituted a school day and contained entries for total iris scanner entries and total visitors
manually signed-in at the office on that day. Exhibit 5-9 contains a graph illustrating these two
measures.
-EXHIBIT 5-9 ABOUT HERE-
If the iris scanners truly improved efficiency, an increase in iris scanning should produce
a decrease in manually processed visitor sign-ins. A series of regression analyses on the data in
Exhibit 5-9 revealed that iris-scanning and visitor sign-ins were not related. We questioned the
secretaries at NEES about this finding and they reported that those who gain entry via iris
scanning still need to sign-in manually and obtain a visitor badge. The only difference is that
they do not need to show their identification on signing in.
This onerous process represents a clear under-utilization of the technology. As Exhibit 5
9 shows, the number of visitors each day can be substantial. One way to improve efficiency is to
have an inexpensive label-maker installed in the main office at NEES. When visitors enter via
iris-scanning, they are creating an electronic record in a database that contains their name, the
date, the time, the school, and the door where they entered. This information could be used to
have a label generated automatically and waiting for them when they enter. Furthermore, since
an electronic record already exists, we do not understand the need for them to sign-in manually.
Although our structured interviews and impromptu conversations with parents and office
staff suggest that the new security measures produced improvements in efficiency, our
quantitative evidence suggests no such effect. We believe that implementing our
recommendations may produce improvements in efficiency.
21st Century Solutions, Inc. 5-16
This document is a research report submitted to the U.S. Department of Justice. This report has not been published by the Department. Opinions or points of view expressed are those of the author(s) and do not necessarily reflect the official position or policies of the U.S. Department of Justice.

CONCLUSION
Overall, the implementation of new security measures within the New Egypt schools
appears to have resulted in a number of benefits. At the same time, the evaluation also
uncovered a number of null effects in which perceptions did not change and a small handful of
“boomerang effects” in which perceptions of conditions actually worsened. Although the
evaluation clarified a number of impacts, the research design made it difficult to uncover others.
We review the impacts of the new security measures on parents, followed by the impacts on
teachers. We conclude by reviewing some evaluation design issues and their effect on our
assessment of program impact.
Impact on Parents
The impact on parents was mixed; some impacts were negative, some neutral, and some
positive. Our aggregate analysis found that there was no significant change in perceptions of
problems existing at school, perceptions of safety around/in school, or the efficiency of the sign-
in process. Interestingly, parents’ perceptions of problems in the neighborhood decreased
slightly following implementation of the technology, but the decrease was borderline statistically
insignificant. Our quasi-experimental analysis showed that parents in the treatment group may
actually have experienced a boomerang effect whereby they perceived a larger number of
problems in school and in the neighborhoods around the school after program implementation.
The strength of this finding is tempered by the fact that we were only able to match about 65-70
of the cases across the wave one and wave two surveys. Finally, although our interviews
detected a perception among parents of improved efficiency, our analysis of visitor sign-in and
iris scanning log data demonstrated that iris scanning did not significantly alter the visitor sign-in
21st Century Solutions, Inc. 5-17
This document is a research report submitted to the U.S. Department of Justice. This report has not been published by the Department. Opinions or points of view expressed are those of the author(s) and do not necessarily reflect the official position or policies of the U.S. Department of Justice.

process. Furthermore, our analysis of parent survey data was also unable to detect improvements
in perceptions of efficiency.
Our analysis also uncovered some positive changes among parents, though we did not
find that these changes were caused by the implementation of iris scanning. Our aggregate
analysis showed that parents’ perceptions of security increased significantly from wave one to
wave two. These changes were experienced across-the-board however, among both treatment
(iris scan) and control (buzzer) group members. Parents also experienced a statistically
significant decrease in their perceptions that getting into the school building without being
noticed is easy and that propping open the doors that are locked is common practice at the
school. Overall, we are left with an interesting set of findings: perceptions of problems and
perceptions of security both increased. Our interpretation is that new security technologies make
people feel more secure, while simultaneously reminding them of the problems that surround
them.
Impact on Teachers and Staff
As with the parents, changes among teachers and staff were mixed. In general, teachers
perceived significantly more problems, both in the school, and in the neighborhood, than parents.
However, teachers also perceived the school to be safer than parents did. New Egypt High
School is an anomaly in that it represents the only school that experienced decreased perceptions
of safety among teachers and staff and increased perceptions of problems following program
implementation. When asked whether propping open the doors that are locked is common
practice in the school, only teachers and staff at NEES experienced a significant decrease from
wave one to wave two. Complaints from teachers and staff mainly focused on the sporadic and
21st Century Solutions, Inc. 5-18
This document is a research report submitted to the U.S. Department of Justice. This report has not been published by the Department. Opinions or points of view expressed are those of the author(s) and do not necessarily reflect the official position or policies of the U.S. Department of Justice.

inconsistent nature of the iris scanners: sometimes they worked and sometimes they did not.
When the scanners failed to work, teachers and staff would sometimes prop open doors, thus
defeating the original purpose for the technology.
The evaluation also uncovered a variety of positive impacts on teachers and staff. For
instance, perceptions of security at NEES and NEMS increased significantly. Teachers and staff
in all three schools experienced significant decreases in their perceptions that getting into the
school building without being noticed is easy. The strongest support for the iris scanning
technology came from the NEES secretaries, who told us that the new security measures
“significantly cut down on the amount of parents walking around the school trying to find their
kids.” The secretaries noted that they were more likely to process every person entering the
building as a result of the new security measures. NEES secretaries stated that they were
impressed with the increased efficiency of parents lining up to take their children out of school.
Lastly, of the 27 respondents interviewed within the vestibule of NEES, 19 (70%) indicated they
felt the iris scanner had increased the safety of New Egypt schools.
Evaluation Design Issues
The impact evaluation described in this report proceeded rapidly. We completed the
evaluation quickly so that we could provide expeditious feedback to the school district and the
funding agency on the efficacy of iris scanning technology as a security measure. This rapid
evaluation schedule, coupled with other factors such as human subjects concerns about
conducting research on children, meant that we were not able to fulfill all of the research
activities that we originally planned. It is important to discuss these issues for two reasons.
First, our findings should be interpreted with the limitations of the study in mind. Second,
21st Century Solutions, Inc. 5-19
This document is a research report submitted to the U.S. Department of Justice. This report has not been published by the Department. Opinions or points of view expressed are those of the author(s) and do not necessarily reflect the official position or policies of the U.S. Department of Justice.

funding agencies, vendors, and evaluators should use this study as a foundation for examining
iris recognition technology or other biometric security measures in the future.
The issue of “tailgating” is one of the most important considerations in assessing the
impact of iris scanning technology and other biometric approaches on physical security and
access control in schools and other settings. Prior to the implementation of iris recognition, the
New Egypt school district used “swipe cards” for access control purposes. Unfortunately, there
was no measure of tailgating at the time the swipe cards were in use. Therefore, it was
impossible to measure whether tailgating increased or decreased with the use of the iris scanner.
Although we were unable to determine whether tailgating increased or decreased, the fact that it
was so prevalent suggests that iris recognition technology alone might have limited utility as an
access control measure. Future studies should conduct careful, systematic social observation of
patterns of entry before and after the implementation of new access control technologies. This
will permit a more refined analysis of the extent to which access control measures alter traffic
into a building.
Another one of the presumed or implied benefits of iris scanning technology is a decrease
in crime, particularly those kinds of offenses committed by outsiders who are not supposed to be
in the schools. Fortunately, such offenses are rare in schools, particularly elementary schools.
They are even rarer in communities like New Egypt. Doing criminological evaluations in “low
base rate” communities like New Egypt presents special challenges. For these reasons, we chose
not to use any “official” measures of crime. While the number of “index” crimes reported to the
FBI for its Uniform Crime Reports was probably zero both before and after implementation, we
know that a large amount of petty crime in and around schools goes unreported. Without any
measure of crime, there is no way to assess whether or not the iris scanner effectively reduced
21st Century Solutions, Inc. 5-20
This document is a research report submitted to the U.S. Department of Justice. This report has not been published by the Department. Opinions or points of view expressed are those of the author(s) and do not necessarily reflect the official position or policies of the U.S. Department of Justice.

crime. But nobody seriously expects the technology to affect the kinds of “normal crime” that
occur frequently in schools (such as simple thefts, bullying, etc.). Likewise, there were no
records of the effectiveness of previous security measures at preventing crime; therefore it is
difficult to determine how much of an improvement was inculcated by the new security
measures.
Third, as we noted in Chapter 1, Plumsted Township is unlike many cities and towns in
New Jersey and the rest of the country in terms of demography. It is a homogeneous
community, with 6.1% of its residents non-white and a higher median household income than
New Jersey and the United States as a whole. In addition, it has lower population mobility, fewer
individuals living in poverty, and a lower unemployment rate. Our findings and observations
show that Plumsted Township residents were very receptive to the technology and did not show
much concern for privacy issues as we had originally expected. Additional studies in more
diverse neighborhoods, schools or cities might show different attitudes and thus, different
outcomes.
Finally, due to human subject concerns, we did not conduct a survey of students. In our
attempt to maximize evaluation resources, we chose not to survey parents at New Egypt Middle
School and New Egypt High School. Both of these populations might have provided additional
insights.
In summary, future evaluations of biometric and other access control technologies should
attempt to account for tailgating, both before and after implementation. They should also
attempt, as much as possible, to isolate a true “control” group to test the effectiveness of the
“treatment.” They should attempt to examine a more diverse population and survey as much of
the affected group as possible, especially students and parents, teachers and staff. Only through
21st Century Solutions, Inc. 5-21
This document is a research report submitted to the U.S. Department of Justice. This report has not been published by the Department. Opinions or points of view expressed are those of the author(s) and do not necessarily reflect the official position or policies of the U.S. Department of Justice.

careful observation and analysis in a natural setting can we truly explore the efficacy of new
security technologies.
21st Century Solutions, Inc. 5-22
This document is a research report submitted to the U.S. Department of Justice. This report has not been published by the Department. Opinions or points of view expressed are those of the author(s) and do not necessarily reflect the official position or policies of the U.S. Department of Justice.
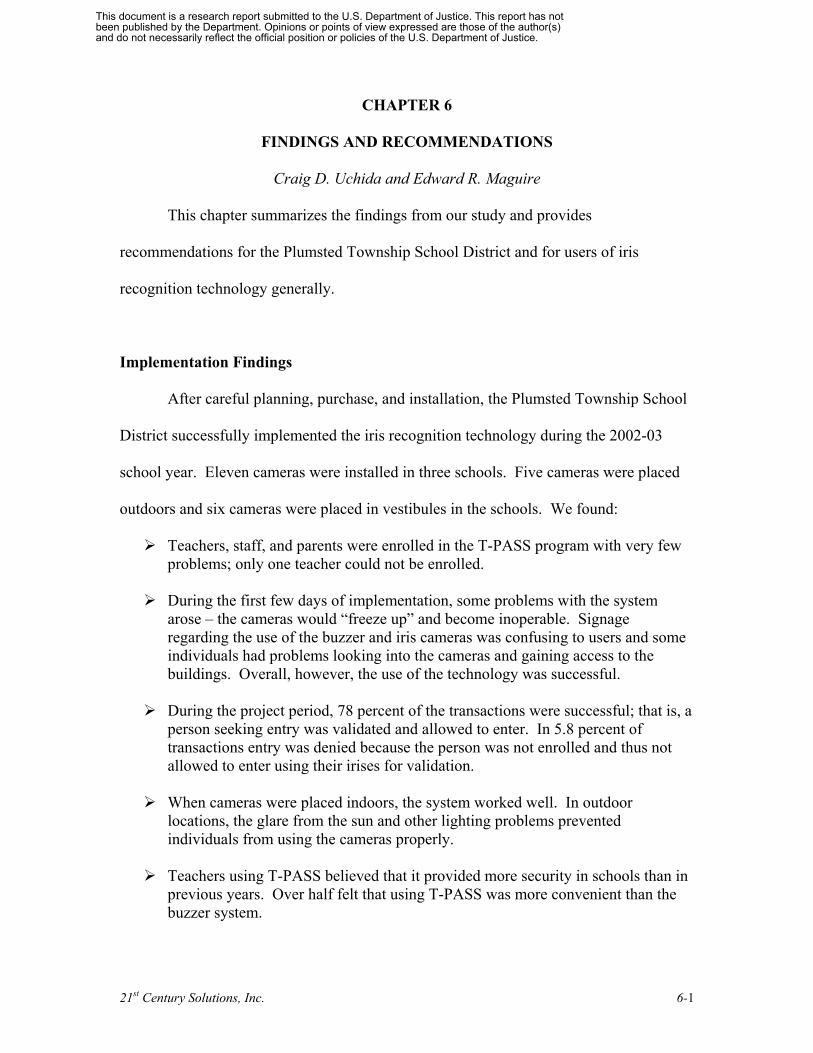
CHAPTER 6
FINDINGS AND RECOMMENDATIONS
Craig D. Uchida and Edward R. Maguire
This chapter summarizes the findings from our study and provides
recommendations for the Plumsted Township School District and for users of iris
recognition technology generally.
Implementation Findings
After careful planning, purchase, and installation, the Plumsted Township School
District successfully implemented the iris recognition technology during the 2002-03
school year. Eleven cameras were installed in three schools. Five cameras were placed
outdoors and six cameras were placed in vestibules in the schools. We found:
¾ Teachers, staff, and parents were enrolled in the T-PASS program with very few problems; only one teacher could not be enrolled.
¾ During the first few days of implementation, some problems with the system arose – the cameras would “freeze up” and become inoperable. Signage regarding the use of the buzzer and iris cameras was confusing to users and some individuals had problems looking into the cameras and gaining access to the buildings. Overall, however, the use of the technology was successful.
¾ During the project period, 78 percent of the transactions were successful; that is, a person seeking entry was validated and allowed to enter. In 5.8 percent of transactions entry was denied because the person was not enrolled and thus not allowed to enter using their irises for validation.
¾ When cameras were placed indoors, the system worked well. In outdoor locations, the glare from the sun and other lighting problems prevented individuals from using the cameras properly.
¾ Teachers using T-PASS believed that it provided more security in schools than in previous years. Over half felt that using T-PASS was more convenient than the buzzer system.
21st Century Solutions, Inc. 6-1
This document is a research report submitted to the U.S. Department of Justice. This report has not been published by the Department. Opinions or points of view expressed are those of the author(s) and do not necessarily reflect the official position or policies of the U.S. Department of Justice.

¾ Parents using T-PASS believed that it provided more security than in previous school years. They also believed that it was easier to use than the buzzer system.
¾ Sixty percent of parents who signed out their child from school during school hours and used T-PASS believed that it provided more security than the old process. They also believed it was easier to use than the sign-out method.
¾ Observations indicated that tailgating (following a person into the building without buzzing or using the scanner) occurred routinely.
Impact Findings
To measure the impact of the iris recognition technology, we conducted surveys
of parents and teachers, observed activities, and interviewed key participants in the
project.
Impact on parents
To determine the impact on parents, two waves of surveys were conducted and
analysis done on the changes that occurred between the first and second waves of the
surveys. We found:
¾ No significant change in perceptions of problems existing at school, perceptions of safety around/in the school, or in the efficiency of the sign-in process;
¾ Perceptions of problems in the neighborhood decreased slightly but this decrease was not statistically significant.
¾ Perceptions of security increased significantly from wave one to wave two;
¾ Perceptions that “getting into the school building without being noticed is easy” and “propping open the doors that are locked is common practice at the school” decreased significantly;
¾ Parents enrolled in the system were able to leave much faster than those parents still waiting to sign themselves out manually;
¾ People who used the iris scanners perceived increases in the number of problems in school and in the neighborhood relative to those using the buzzer.
21st Century Solutions, Inc. 6-2
This document is a research report submitted to the U.S. Department of Justice. This report has not been published by the Department. Opinions or points of view expressed are those of the author(s) and do not necessarily reflect the official position or policies of the U.S. Department of Justice.

¾ Changes in perceptions of safety, security, and efficiency were no different for those using the iris scanners than they were for those using the buzzers.
Impact on teachers and staff
We also conducted two waves of surveys of teachers and staff. We found:
¾ Teachers perceived significantly more problems in the school and in the neighborhood, than parents;
¾ Teachers perceived the school to be safer than parents did;
¾ Teachers and staff in all three schools experienced significant decreases in their perceptions that “getting into the school building without being noticed is easy”;
¾ Perceptions of security at the elementary and middle schools increased significantly;
¾ Teachers and staff at the elementary school experienced a significant decrease in their perception that “propping open the doors that are locked is common practice in the school”; teachers and staff at the other schools showed no change in this perception;
¾ The strongest support for iris technology came from the elementary school secretaries who said that it “significantly cut down on the amount of parents walking around the school trying to find their kids.”
General Recommendations
The following recommendations are general in scope and are intended for those
schools, security directors or managers of buildings, and homeland security experts with
interest in access control devices.
Recommendation 1. Overall, we found that iris recognition technology coupled with the
buzzer system can potentially be an effective way to control access and try during school
hours if coupled with other less expensive and more mundane security measures. Iris
21st Century Solutions, Inc. 6-3
This document is a research report submitted to the U.S. Department of Justice. This report has not been published by the Department. Opinions or points of view expressed are those of the author(s) and do not necessarily reflect the official position or policies of the U.S. Department of Justice.

recognition equipment should be one part of a school-wide or system-wide policy on
physical access control and physical security.
Recommendation 2. If iris recognition technology is used in other schools we
recommend that school administrators and security personnel pay close attention to
tailgating and to include policies that will prevent doors from being propped open or
unlocked.
Our security surveys found certain doors open or unlocked routinely. One doorway had a
brick, used to prop open the doors, located in the foyer throughout the evaluation period.
Students and teachers were routinely willing to open doors for us when we would try to
open locked doors during our security surveys. Teachers propped open one side entrance
at the high school when the iris scanners malfunctioned. The electrical room in the high
school was left unlocked; from it, one could shut down all the power in both the middle
school and the high school, which would shut down all the iris scanners and lock all the
exterior doors. Iris scanners cannot work effectively in an environment where other,
sometimes simple, elements of physical access control are not taken into account.
Recommendation 3. The efficacy of iris scanning as a physical access control measure
can be improved by taking into account the architectural features of its environment. For
many years, police, security experts, and criminologists have been aware of the role that
the physical environment can play in security, crime, and violence. Crime prevention
through environmental design, or CPTED, is the term used to describe efforts to improve
21st Century Solutions, Inc. 6-4
This document is a research report submitted to the U.S. Department of Justice. This report has not been published by the Department. Opinions or points of view expressed are those of the author(s) and do not necessarily reflect the official position or policies of the U.S. Department of Justice.

security and safety through changes in the physical environment. Several members of the
research team, including one elementary school teacher with experience in several
jurisdictions, were surprised by the design of the entrance to New Egypt Elementary
School. With just a few parents or visitors in the main office, the office staff has an
obscured view of the main lobby. When the office is crowded, it would be very easy for
somebody to tailgate their way through the front doors and enter the school without being
seen. Iris scanners, therefore, should be implemented together with architectural
planning that takes into account the ability for office staff to see clearly all who enter.
Recommendation 4. Iris scanners and/or appropriate housing devices need further
development before being installed outdoors. We found significant camera error rates for
the outdoor cameras. Glare from the sun seemed to be a primary problem, though we
also documented significant failures on overcast days and in installations that were not in
direct light. A method needs to be designed for installing the cameras outside that shields
them from the elements, protects them from vandalism, but still permits them to work as
intended.
Recommendation 5. Future field evaluations of iris recognition and other biometric
access control measures should address tailgating, should adopt a longer evaluation time
frame, and should test the technology in a setting with a higher base rate of crime and
disorder and a more heterogeneous population.
21st Century Solutions, Inc. 6-5
This document is a research report submitted to the U.S. Department of Justice. This report has not been published by the Department. Opinions or points of view expressed are those of the author(s) and do not necessarily reflect the official position or policies of the U.S. Department of Justice.

Recommendation 6. School security technologies, including iris recognition, appear to
have the twin effects of increasing perceptions of security and increasing the number of
perceived problems. These effects need to be anticipated, studied, and addressed by
evaluators and school authorities.
Specific Recommendations for the Plumsted Township School District
In addition to the general recommendations noted above and based on our
findings and observations we make the following specific recommendations to the
Plumsted Township School District:
Recommendation 1. Because of the overall success of specific cameras in specific
locations, we recommend that the iris cameras located in enclosed entryways or
vestibules should remain in use. Cameras located in outdoor areas where the success rate
was less than 75% should be re-located.
Recommendation 2. Iris scanning can significantly reduce the work of front office staff
if it is complemented by software designed to automatically print labels for each
incoming visitor. Asking visitors who have already been admitted via iris recognition to
sign-in and make a label for themselves is inefficient, when a label could be waiting for
them upon arrival in the front office. This is particularly true during peak periods of
activity when the front office becomes congested with visitors. Using labels may also
reduce the number of tailgaters, as labels would only be printed if a visitor has used the
scanner.
21st Century Solutions, Inc. 6-6
This document is a research report submitted to the U.S. Department of Justice. This report has not been published by the Department. Opinions or points of view expressed are those of the author(s) and do not necessarily reflect the official position or policies of the U.S. Department of Justice.

Recommendation 3. With strong support of the iris recognition technology in the
sample of parents at the New Egypt Elementary School, we recommend that it be used
for all parents to obtain release of their child/children during school hours. With the
construction of the New Egypt Primary School, we recommend that the school district
enroll parents in a similar fashion at the primary school.
Recommendation 4. Iris recognition cameras should be moved from the current outdoor
locations that are ineffective to the New Egypt Primary School for use by parents and
school staff. In addition, we recommend that the buzzer system and video cameras be
placed at entrances at the primary school.
Recommendation 5. Video camera images of the entrances should be on computer
screens at all times. We found that staff did not use the video images because their
computers would work slower and less efficiently. We recommend that separate
computer monitors be used for video camera images only and should be located near the
intercoms on desks of staff in the front offices of each school.
Recommendation 6. Appropriate staff at each school should receive training to enroll
new teachers and employees in iris recognition technology.
Recommendation 7. Training in the use of iris recognition technology should be
provided to all school staff prior to the beginning of the school year.
21st Century Solutions, Inc. 6-7
This document is a research report submitted to the U.S. Department of Justice. This report has not been published by the Department. Opinions or points of view expressed are those of the author(s) and do not necessarily reflect the official position or policies of the U.S. Department of Justice.

Recommendation 8. Training in the purpose and use of iris recognition technology
should be provided to all parents at the New Egypt Elementary and Primary Schools.
Recommendation 9. Policies and procedures should be provided to all school staff and
parents regarding iris recognition technology, the use of buzzers, general security
measures (such as keeping doors locked and not tailgating) and other safety precautions.
21st Century Solutions, Inc. 6-8
This document is a research report submitted to the U.S. Department of Justice. This report has not been published by the Department. Opinions or points of view expressed are those of the author(s) and do not necessarily reflect the official position or policies of the U.S. Department of Justice.

References
Allison, Paul D. (1990). "Change scores as dependent variables in regression analysis." Pp. 93-114 in Clifford Clogg (ed.), Sociological Methodology 1990. Oxford: Basil Blackwell.
Annual Report on School Safety (1998). Washington, DC: U.S. Department of Justice and U.S. Department of Education.
Army Reservist Killed After Base Shooting Spree. (2001, October 13). Retrieved April 6, 2003, from http://www.cnn.com/2001/US/10/12/fort.dix.shooting
Associated Press. (2003, April 22). School District Tests Eye-Recognition Security System [Electronic Version]. Retrieved April 23, 2003, from: http://www.thebakersfieldchannel.com/ education/2149977/detail.html.
Baratta, K. (2001, October, 18). Shooting Prompts Rumors, Concern. Reservist Wounds 4 Before Being Killed in Burlington County [Electronic Version]. Tri-Town News. Retrieved April 6, 2003, from http://tritown.gmnews.com/News/2001/1018/Front_Page/001.html
Blay, Joyce (2002). Ocean Meeting Produces Split Opinions on Rail Line. Brick Township Bulletin (December 18 edition), p. 1.
Carter, S. (2001). Surrounded by Safety: A Crime Prevention Through Environmental Design (CPTED) Concept for Youth. Retrieved April 7, 2003, from http://www.ycwa.org.
Coventry, L., De Angeli, A., & Johnson, G. (2003, April). Usability and biometric verification at the ATM interface. Proceedings of the conference on Human Factors in Computing Systems.
Crowe, T. (1990). Designing Safer Schools. Los Angeles, CA: National School Safety Center.
Dancer, Ron (2003). Zoning Reduces New Homes. Town Talk newsletter, 7/21/03 [Electronic version]. Retrieved July 23, 2003 from: http://www.mainstreetsusa.com/township/towntalk/towntalk072103.htm
Dean, Michael B. (2000). An Analysis and Evaluation of the Technology Program at Plumsted Township School District, New Egypt, NJ. Master’s Thesis Proposal. Central Michigan University, Maguire Air Force Base.
DeVoe, Jill F., Katharin Peter, Phillip Kaufman, Sally A. Ruddy, Amanda K. Miller, Mike Planty, Thomas D. Snyder, and Michael R. Rand (2003). Indicators of School Crime and Safety: 2003. Washington, DC: National Center for Education
This document is a research report submitted to the U.S. Department of Justice. This report has not been published by the Department. Opinions or points of view expressed are those of the author(s) and do not necessarily reflect the official position or policies of the U.S. Department of Justice.

Statistics and the Bureau of Justice Statistics.
Emmer, E. (1992). Recommendations for Needed Research – Goal Six: Creating Safe, Disciplined, and Drug Free Schools. Austin, TX: University of Texas.
Federal Bureau of Investigation (2001). Crime in the United States, 2000. Washington, DC: U.S. Department of Justice.
Gaustad, J. (1999). Fundamentals of School Security. (ERIC Digest No. 132). Eugene, OR: ERIC Clearinghouse on Educational Management. (ERIC Document Reproduction Service No. ED436814)
Gavin, T. (2000). Bringing SARA to School. American School Board Journal, 187, 3: 36-39.
Ginsberg, C. and L. Loffredo (1993). “Violence-related Attitudes and Behaviors of High School Students—New York City, 1992.” Journal of School Health, 63:438.
Gottfredson, D. C. (1988). “An Evaluation of An Organization Development Approach to Reducing School Disorder,” Evaluation Review, 11, 739-763.
Gottfredson, D. C. (1997). “School-Based Crime Prevention.” In L.W. Sherman, D. Gottfredson, D. McKenzie, J. Eck, P. Reuter, and S. Bushway (eds.). Preventing Crime: What Works, What Doesn’t, What’s Promising: A Report to the United States Congress. Washington, DC: National Institute of Justice.
Gottfredson, D. C. (2001). Schools and Delinquency. Cambridge, U.K.: Cambridge University Press.
Gottfredson, D.C., G. Gottfredson, and L. Hybl (1993). Managing Adolescent Behavior: A Multi-Year, Multi-School Study. American Educational Research Journal, 30, 179-215.
Gottfredson, D.C., G. Gottfredson, and S. Skroban (1998). “Can Prevention Work Where It is Needed Most?” Evaluation Review, 22, 315-140.
Gottfredson, G. D. (1984). “A Theory-Ridden Approach to Program Evaluation: A Method for Stimulating Researcher-Implementer Collaboration,” American Psychologist, 39, 1101-1112.
Gottfredson, G. D., T. Gore, and E. Jones (1998). Developing School Capacity for Guardianship: An Assessment. Ellicott City, MD: Gottfredson Associates.
Gottfredson, G. D. and D. Gottfredson (1985). Victimization in Schools. NY: Plenum.
Gottfredson, G. D. and D. Gottfredson (1987). Using Organization Development to
This document is a research report submitted to the U.S. Department of Justice. This report has not been published by the Department. Opinions or points of view expressed are those of the author(s) and do not necessarily reflect the official position or policies of the U.S. Department of Justice.

Improve School Climate (Report No. 17). Baltimore, MD: Johns Hopkins University, Center for Research on Elementary and Middle Schools.
Green, Mary W. (1999). The Appropriate and Effective Use of Security Technologies in U.S. Schools: A Guide for Schools and Law Enforcement Agencies. Washington, DC: National Institute of Justice.
Iridian Technologies (2002). Biometric Side-by-Side Comparison Chart.
Jeffrey, C.R. (1971). Crime Prevention Through Environmental Design. Beverly Hills, CA: Sage Publications.
Katz, Charles M., David R. Schaefer, and Craig D. Uchida (2002). “Exploring the Gang Problem in Redlands, CA: An Evaluation of a Problem-Solving Partnership.” Silver Spring, MD: 21st Century Solutions, Inc.
Kennedy, M. (2000, February). Balancing School Security and Learning. American School and University, SS8-SS10.
Kenney, D. and Watson, T.S. (1998). Crime in Schools: Reducing Fear and Disorder with Student Problem Solving. Washington, DC: Police Executive Research Forum.
Maguire, Edward R., Shellie E Solomon, and Craig D. Uchida (2003). “Reducing Disputes in Spartanburg, SC: An Evaluation of a Problem-Solving Partnership.” Silver Spring, MD: 21st Century Solutions, Inc.
Maris, E. (1998). Covariance adjustment versus gain scores - Revisited. Psychological Methods, 3, 309-327.
Mastrofski, Stephen D., Roger B. Parks, Albert J. Reiss, Jr., Robert E. Worden, Christina DeJong, Jeffrey B. Snipes, and William Terrill (1998). Systematic Observation of Public Police: Applying Field Research Methods to Policy Issues. National Institute of Justice Research Report. Washington, DC: U.S. Department of Justice.
McCord, J., C.S. Widom, M.I. Bamba, and N.A. Crowell, eds. (2000). Education and Delinquency, Summary of a Workshop Washington, DC: National Academy Press.
Morgan, S. (2003, April 10). Plumsted Schools Get Iris Scanner [Electronic Version]. The Messenger-Press. Retrieved April 11, 2003, from, http://www.zwire.com/site/news
Mount, D. (1979). A Story: New Egypt and Plumsted Township. Burlington, NJ: Heidelberg Press.
This document is a research report submitted to the U.S. Department of Justice. This report has not been published by the Department. Opinions or points of view expressed are those of the author(s) and do not necessarily reflect the official position or policies of the U.S. Department of Justice.

National Institute of Justice. (1999). The Appropriate and Effective Use of Security Technologies in U.S. Schools: A guide for Schools and Law enforcement Agencies (NCJ No. 178265). Washington, D.C.: Green, M.
New Jersey Department of Community Affairs (2003). Main Street New Jersey: Designated MSNJ Communities [WWW document]. Retreieved on July 24, 2003 from: http://www.state.nj.us/dca/dhcr/mstowns.htm
Newman, O. (1972). Defensible Space: Crime Prevention through Urban Design. New York: Macmillan.
Ocean County Government (2003). Overview of Ocean County [WWW document]. Retrieved on July 22, 2003 from: http://www.oceancountygov.com/history/overview.htm.
Office of Juvenile Justice and Delinquency Prevention. (2002). Safe and Secure: Guides to Creating Safer Schools (Guide 4). Ensuring Quality School Facilities and Security Technologies. Washington, D.C.: Schneider, T.
Reichstetter, R. (2000). Wake County Safe Schools/ Healthy and Learning. Year Two Mid-Year Performance (E & R Report No. 01.46). Raleigh, NC: Department of Evaluation and Research. (ERIC Document Reproduction Service No. ED457226)
Richards, G. (1997). Making Safe Schools Safer. American School Board Journal, 184, 4: 38-39.
Rossi, P. and Freeman, H. (1993). Evaluation: A Systematic Approach, 5th Edition. Newbury Park, CA: Sage.
Santi, A. (2003, April 21). N.J. Schools Testing Eye Recognition [Electronic Version]. The Washington Post. Retrieved April 22, 2003, from, http://www.washingtonpost.com/wp-dyn/ articles/A5208-2003Apr21.html
Santi, A. (2003, April 11). Rural Plumsted Tests Innovative School Security System. Associated Press. Retrieved May 6, 2003, from LexisNexis database.
Sapia, Joseph. (2003, April 4). An Eye on School Security. Asbury Park Press, pp. A1, B2.
Schneider, T. (2001). Safer Schools Through Environmental Design. (ERIC Digest No. 144). Eugene, OR: ERIC Clearinghouse on Educational Management. (ERIC Document Reproduction Service No. ED449549)
Schneider, T. (2001). Newer Technologies for School Security. (ERIC Digest No. 145).
This document is a research report submitted to the U.S. Department of Justice. This report has not been published by the Department. Opinions or points of view expressed are those of the author(s) and do not necessarily reflect the official position or policies of the U.S. Department of Justice.

Eugene, OR: ERIC Clearinghouse on Educational Management. (ERIC Document Reproduction Service No. ED449550)
Small, M. and K. Tetrick (2001). “School Violence: An Overview.” Juvenile Justice, Vol. VIII, No. 1, June: 3-12.
Stephens, R. (1998). Ten Steps to Safer Schools. American School Board Journal, 185, 3: 30, 32-33.
A Time Line of Recent Worldwide School Shootings. (n.d) Retrieved June 12, 2003, from http://www.infoplease.com/ipa/AO777958.html
Trump, K. (1998). Practical School Security. Thousand Oaks, CA: Corwin Press.
Uchida, Craig D. and Carol Putnam (2001). “Evaluating Problem-Solving in Colorado Springs: The 1999 School-Based Partnership Project.” Silver Spring, MD: 21st
Century Solutions, Inc.
Uchida, Craig D., Ted Welser, Josh Sadow, Timothy S. Bynum, and T. Dave Chavez, Jr. (2002). “The Truancy Reduction Program in Seattle: Evaluating the Problem- Solving Partnership.” Silver Spring, MD: 21st Century Solutions, Inc.
U.S. Census Bureau (1994). Geographic Areas Reference Manual. Washington, DC: U.S. Department of Commerce.
U.S. Census Bureau (2000). Census 2000 Geographic Terms and Concepts. Washington, DC: U.S. Department of Commerce.
Virginia Department of Education. (n.d). Checklist for the Safety and Security of Buildings and Grounds. Retrieved April 7, 2003, from, http://www.pen.k12.va.us/VDOE/Instruction/schoolsafety/checklis.html
Wilson, David B. and Mastrofski, Stephen D. (2003, July). Biometric Tracking System Evaluation at the Consolidated Navy Brig, Charleston, South Carolina: Interim Report. Unpublished report. Manassas, VA: George Mason University, Center for Justice Leadership and Management.
Zucker, J. (2003, April 23). The Today Show [Television broadcast]. New York: York Broadcasting Company.
This document is a research report submitted to the U.S. Department of Justice. This report has not been published by the Department. Opinions or points of view expressed are those of the author(s) and do not necessarily reflect the official position or policies of the U.S. Department of Justice.

Exhibit 1-1:
Selected Demographic, Social and Economic Characteristics
Plumsted Township New Jersey United States
1990 2000 1990 2000 1990 2000
% Black 2.7% 2.3% 13.4% 13.6% 12.1% 12.3%
% White 95.6% 93.9% 79.3% 72.6% 80.3% 75.1%
% Other Race 1.7% 3.8% 7.3% 13.8% 7.7% 12.6%
% Owner Occupied Housing Units 81.0% 85.0% 64.9% 65.6% 64.2% 66.2%
% Renter Occupied Housing Units 19.0% 15.0% 35.1% 34.4% 35.8% 33.8%
% Living in Same Home as 5 Years Ago 54.3% 63.9% 60.1% 59.8% 53.3% 54.1%
% Households with Single Mother Families 8.4% 9.3% 12.1% 12.6% 7.6% 7.2%
Median Household Income $40,799 $61,357 $40,927 $55,146 $30,056 $41,994
Median Family Income $44,111 $62,255 $47,589 $65,370 $35,225 $50,046
% Persons Below Poverty Level 4.1% 5.0% 7.6% 8.5% 13.1% 12.4%
% Families Below Poverty Level 2.3% 4.3% 5.6% 6.3% 10.0% 9.2%
% Unemployed 3.0% 2.3% 3.8% 3.7% 4.1% 3.7%
% HS Graduate or Above 76.2% 84.2% 76.7% 82.1% 75.2% 80.4%
% Bachelor’s Degree or Above 11.1% 17.4% 24.9% 24.9% 29.8% 24.4%
This document is a research report submitted to the U.S. Department of Justice. This report has not been published by the Department. Opinions or points of view expressed are those of the author(s) and do not necessarily reflect the official position or policies of the U.S. Department of Justice.

Exhibit 1-2:
Official Crime Rates per 1,000 Inhabitants
Plumsted Township, NJ
New Jersey United States
Violent Crime per Capita 1.0a 3.8 c 5.1 d
Property Crime per Capita 7.4a 27.8 c 36.2 d
Total Index Crimes per Capita 8.4a 31.6 c 41.2 d
% of Offenses Cleared by Arrest 63.3%b 31.7%b 20.5%e
Notes
(a) Source: 2000 Uniform Crime Reports; New Jersey State Police Crime Reports and Statistics, available at http://www.state.nj.us/lps/njsp/info/ucr2000/sect7a15.html
(b) Source: Computed directly from 2000 Uniform Crime Reports data.
(c) Source: 2000 Uniform Crime Reports; New Jersey State Police Crime Reports and Statistics, available at http://www.state.nj.us/lps/njsp/info/ucr2000/sec2_2000.htm
(d) Source: 2000 Uniform Crime Reports
(e) Source: 2000 Uniform Crime Reports, pg. 207, Table 25
This document is a research report submitted to the U.S. Department of Justice. This report has not been published by the Department. Opinions or points of view expressed are those of the author(s) and do not necessarily reflect the official position or policies of the U.S. Department of Justice.

Exhibit 2-1:
A Timeline of Recent School Shootings in the United States
Date Location School Victim(s) Perpetrator(s) Could Iris Scanner Have Helped?
4/24/2003 Red Lion, PA Red Lion Area Principal killed 14 year male No Junior High and perpetrator student School killed himself
4/14/2003 New Orleans, John McDonogh One student killed, Five male non- Yes LA High School three students students ranging
wounded from age 17 to 19 11/12/2001 Caro, MI Caro Learning Perpetrator killed 17 year old male No
Center himself student 3/30/2001 Gary, IN Lew Wallace
High School One student killed 17 year old male
student No
3/22/2001 Granite Hill, CA
Granite Hills High School
One teacher, three students, and
18 year old male student
No
perpetrator wounded
3/7/2001 Williamsport, Bishop Neumann One student 14 year old female No PA High School wounded student
3/5/2001 Santee, CA Santana High Two killed and 13 15 year old male No School wounded student
1/17/2001 Baltimore, MD Outside of Lake One student killed Four male non- No Clifton Eastern students High School
9/26/2000 New Orleans, Woodson Middle Two students One male student No LA School wounded and one male non
student 5/26/2000 Lake Worth, FL Lake Worth One teacher killed 13 year old male No
Middle School student 3/10/2000 Savannah, GA Outside of Beach Two students 19 year old male No
High School killed non-student 2/29/2000 Mount Morris Buell Elementary One student killed Six year old male No
Township, MI School student 12/6/1999 Fort Gibson, Fort Gibson Four students 13 year old male No
OK Middle School wounded student 11/19/1999 Deming, NM Deming Middle
School One student killed 12 year old male
student No
This document is a research report submitted to the U.S. Department of Justice. This report has not been published by the Department. Opinions or points of view expressed are those of the author(s) and do not necessarily reflect the official position or policies of the U.S. Department of Justice.

Exhibit 3-1:
Response Information for Teachers and Staff Surveys
l ( l
%
/ (
88 88 60 73 le 60 58 35 29
51 51 36 26 l
TotaEnrolled
in TPASS
% Enrolled Enrol ed in
TPASS/
Responded to Survey: W ave I, March 6-7, 2003
Wave I to Survey I
Responded to Survey: W ave
II, June 12, 2003
% Responding II Responded
Survey II/ Elementary 100% 68.2% 83.0%
Midd 97% 60.3% 50.0% High 100% 70.6% 51.0% Tota 199 197 99% 131 66.5% 128 65.0%
This document is a research report submitted to the U.S. Department of Justice. This report has not been published by the Department. Opinions or points of view expressed are those of the author(s) and do not necessarily reflect the official position or policies of the U.S. Department of Justice.
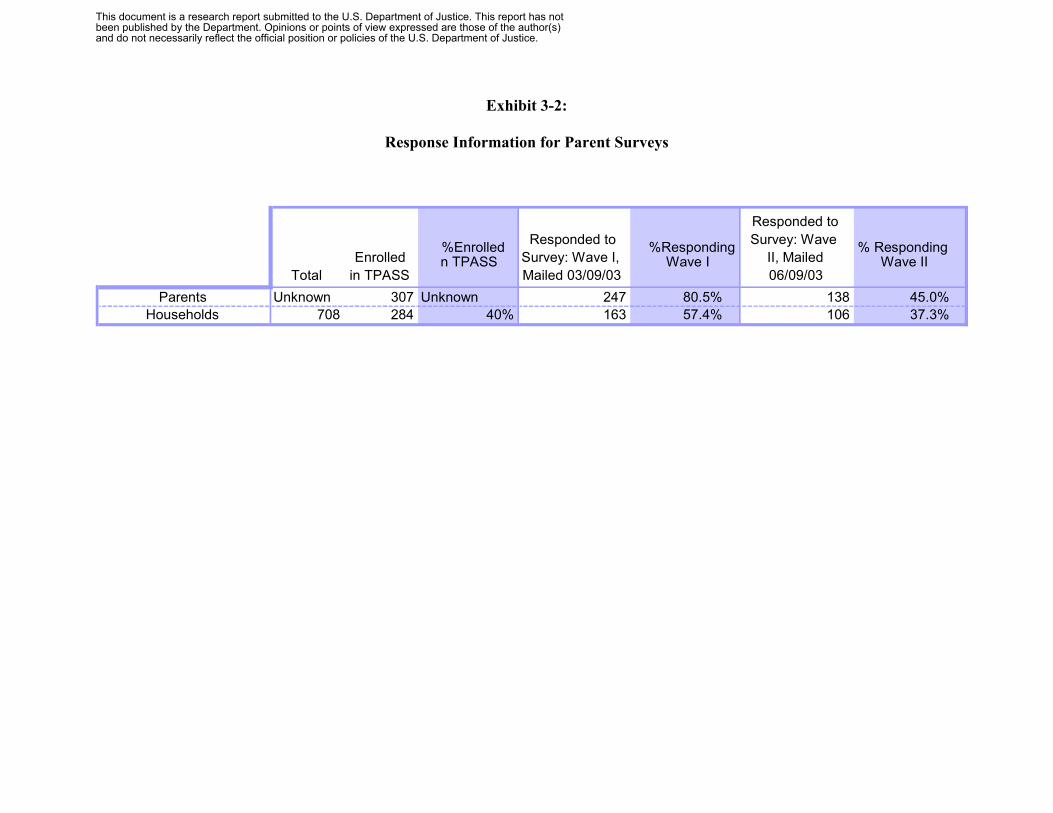
Exhibit 3-2:
Response Information for Parent Surveys
Total 06/ /03 247 138
708 284 40% 163 106
Enrolled in TPASS
%Enrolled n TPASS
Responded to Survey: Wave I, Mailed 03/09/03
%Responding Wave I
Responded to Survey: Wave
II, Mailed 09
% Responding Wave II
Parents Unknown 307 Unknown 80.5% 45.0% Households 57.4% 37.3%
This document is a research report submitted to the U.S. Department of Justice. This report has not been published by the Department. Opinions or points of view expressed are those of the author(s) and do not necessarily reflect the official position or policies of the U.S. Department of Justice.

Exhibit 4-1:
Iris Scanner Traffic
Camera School Location Desc. %Allowed Entry
%Camera Error
%Denied Entry
Total Transactions
1 Elementary Main Entrance
Inside Vestibule
78.6 11.3 10.1 3,695
2 Elementary North Entrance
Outside in lock box
38.7 59.5 1.71 351
3 Elementary South Back Entrance
Outside in lock box
61.3 34.7 4.0 222
4 Elementary South Front Entrance
Outside in lock box
35.7 63.0 1.3 238
5 * Middle Main Entrance
Inside Vestibule
80.0 14.8 5.2 575
6 Middle North Entrance
Outside in lock box
12.8 80.4 6.8 148
7 Middle South Entrance
Outside in lock box
59.5 39.4 1.1 439
8 High Main Entrance
Inside Vestibule
76.7 16.7 6.5 1,010
9 High 100 Wing Inside Vestibule
95.3 3.4 1.3 975
10 High Back Parking Lot
Inside Vestibule
93.7 3.4 2.9 618
11 High BOE Entrance
Inside Vestibule
95.5 3.5 1.0 1,141
* The database is missing some entries for this entrance.
This document is a research report submitted to the U.S. Department of Justice. This report has not been published by the Department. Opinions or points of view expressed are those of the author(s) and do not necessarily reflect the official position or policies of the U.S. Department of Justice.

Exhibit 4-2:
Elementary School Camera Locations
This document is a research report submitted to the U.S. Department of Justice. This report has not been published by the Department. Opinions or points of view expressed are those of the author(s) and do not necessarily reflect the official position or policies of the U.S. Department of Justice.

Exhibit 4-3:
Middle School Camera Locations
This document is a research report submitted to the U.S. Department of Justice. This report has not been published by the Department. Opinions or points of view expressed are those of the author(s) and do not necessarily reflect the official position or policies of the U.S. Department of Justice.

Exhibit 4-4:
High School Camera Locations
This document is a research report submitted to the U.S. Department of Justice. This report has not been published by the Department. Opinions or points of view expressed are those of the author(s) and do not necessarily reflect the official position or policies of the U.S. Department of Justice.

Exhibit 4-5:
Frequency of Parent T-Pass Usage
V58a. Approximately how many times did you use T-PASS to enter New Egypt Elementary School? Please indicate an estimated number of times.
Number of Times % Cumulative %
0 4.5% 4.5% 1 18.2% 22.7% 2 12.1% 34.8% 3 16.7% 51.5% 4 9.1% 60.6% 5 12.1% 72.7% 6 3.0% 75.7% 7 3.0% 78.7% 8 3.0% 81.7%
10 7.6% 89.3% 15 3.0% 92.3% 17 1.5% 93.8% 30 1.5% 95.3% 50 1.5% 96.6% 60 3.0% 99.6%
This document is a research report submitted to the U.S. Department of Justice. This report has not been published by the Department. Opinions or points of view expressed are those of the author(s) and do not necessarily reflect the official position or policies of the U.S. Department of Justice.

Exhibit 4-6:
Frequency of Entry Scenarios
Sequence Frequency Percent
1. Straight to Buzzer 190 42.7%
2. Iris Scanner to Buzzer 26 5.8%
3. Straight to Iris Scanner 89 20.0%
4. Tailgating 109 24.7%
5. Other Scenario 31 6.7%
Total 445 100%
This document is a research report submitted to the U.S. Department of Justice. This report has not been published by the Department. Opinions or points of view expressed are those of the author(s) and do not necessarily reflect the official position or policies of the U.S. Department of Justice.

Exhibit 4-7:
Frequency of Tailgating Scenarios
Incidents of Tailgating Frequency Percent
Person used buzzer and held door open 56 50.9%
Person used scanner and held door open 32 29.1%
Person exiting held door open 21 19.1%
Individual registered for scanner knocks on door and has student provide entry 1
1.0%
This document is a research report submitted to the U.S. Department of Justice. This report has not been published by the Department. Opinions or points of view expressed are those of the author(s) and do not necessarily reflect the official position or policies of the U.S. Department of Justice.

Exhibit 4-8:
Frequency of “Other” Scenarios
Other Scenario Frequency Percent
1. Straight to buzzer (needed assistance) 21 70.0%
2. Two girls try door and turn around and leave 1 3.3%
3. Tried scanner with assistance then went to buzzer 1 3.3%
4. Straight to scanner (needed assistance) 3 10.0%
5. Secretary recognizes individual on camera and unlocks door 1 3.3%
6. Person entering using scanner allows class of 25 high school art students to follow behind 1
3.3%
7. Tried to catch closing door before using scanner 1 3.3%
8. Tried to enter through back door first, then went straight to scanner 1 3.3%
This document is a research report submitted to the U.S. Department of Justice. This report has not been published by the Department. Opinions or points of view expressed are those of the author(s) and do not necessarily reflect the official position or policies of the U.S. Department of Justice.

Exhibit 5-1:
Aggregate Indicators of Program Impact Among NEES Parents
Index Number of Items
Possible Range
Wave 1 (Cronbach’s α)
Wave 2 (Cronbach’s α)
Wave 1 (Mean)
Wave 2 (Mean)
p
Perceptions of Problems Existing at School 20 0-20 .783 .732 1.75 1.81 .742
Perceptions of Safety Around/In School 13 0-39 .959 .932 28.00 28.00 .415
Perceptions of Problems in Neighborhood Around School
13 0-39 .885 .807 3.90 3.19
.078
Perceptions of Security at NEES 5 0-15 .805 .776 6.91 8.14 .001
Efficiency of Sign-In Process 7 0-21 .844 .806 13.92 13.72 .736
This document is a research report submitted to the U.S. Department of Justice. This report has not been published by the Department. Opinions or points of view expressed are those of the author(s) and do not necessarily reflect the official position or policies of the U.S. Department of Justice.

Exhibit 5-2:
Perceptions of Security Among Parents
Question Possible Range
Wave 1 (Mean)
Wave 2 (Mean)
p
Getting into the school building without being noticed is easy.
1-4 2.81 2.27 .00
Propping open the doors that are locked is common practice at the school.
1-4 2.12 1.87 .02
This document is a research report submitted to the U.S. Department of Justice. This report has not been published by the Department. Opinions or points of view expressed are those of the author(s) and do not necessarily reflect the official position or policies of the U.S. Department of Justice.

Exhibit 5-3
Are Parents’ Perceptions Influenced by Treatment/Control Status?
Index Possible Range
Wave 1 Score
t (sig.)
Change Score1
t (sig.)
Perceptions of Problems Existing at School 0-20 0.70 (.481) -1.56 (.124)
Perceptions of Safety Around/In School 0-39 1.71 (.090) -0.51 (.611)
Perceptions of Problems in Neighborhood Around School 0-39 -0.22 (.830) -3.09 (.003)
Perceptions of Security at NEES 0-15 .033 (.974) 0.10 (.918)
Efficiency of Sign-In Process 0-21 0.72 (.473) 0.39 (.697)
*Table contains the results of independent samples t-tests without the assumption of equal variances across groups.
1 The “change score” for each scale is the difference between the scores at wave 1 and wave 2.
This document is a research report submitted to the U.S. Department of Justice. This report has not been published by the Department. Opinions or points of view expressed are those of the author(s) and do not necessarily reflect the official position or policies of the U.S. Department of Justice.

Exhibit 5-4:
Explaining Changes in Parents’ Perceptions
Problems in School
Safety at School
Problems in Neighborhood
Security at School
Efficiency of Sign-In
Treatment group + 0 + 0 0
Technology exposure scale 0 0 0 0 0
Homeowner? 0 0 0 0 0
Married or live with a partner?
0 0 0 0 0
Unemployed? 0 0 0 0 0
College degree? 0 0 0 0 0
Local resident at least 5 years?
0 0 0 0 0
Media exposure scale 0 0 0 0 0
Used iris scanner to enter school?
0 0 0 0 0
Used iris scanner to sign out child?
- / 02 0 0 0 0
Used buzzer system to enter school?
0 0 0 0 0
Model significant? Yes No Yes No No
Explained variance (Adjusted R2)
22.8% -7.9% 23.4% -0.9% -4.9%
*This table provides a summary of regression coefficients for five models, each one with a different change score computed by subtracting the time 1 scale score from the time 2 scale score. We also ran the model with the time 2 scale score as the dependent variable and the time 1 scale score as a covariate. In that case, every model was statistically significant and every time 1 score was a statistically significant predictor of the time 2 score.
2 This variable was statistically significant in the model that included a change score as the dependent variable, but borderline nonsignificant in the model that included the time 2 scale score as the dependent variable and the time 1 scale score as a covariate.
This document is a research report submitted to the U.S. Department of Justice. This report has not been published by the Department. Opinions or points of view expressed are those of the author(s) and do not necessarily reflect the official position or policies of the U.S. Department of Justice.

Exhibit 5-5:
Aggregate Indicators of Program Impact Among NEES Teachers and Staff
Index Possible Range
Wave 1 (Cronbach’s α)
Wave 2 (Cronbach’s α)
Wave 1 (Mean)
Wave 2 (Mean)
p
Perceptions of Problems Existing at School 0-20 .756 .803 5.16 4.96 .713
Perceptions of Safety Around/In School 0-36 .933 .958 28.51 28.89 .689
Perceptions of Problems in Neighborhood Around School 0-39 .876 .883 8.30 7.64 .331
Perceptions of Security at NEES 0-15 .448 .677 5.92 8.51 .000
This document is a research report submitted to the U.S. Department of Justice. This report has not been published by the Department. Opinions or points of view expressed are those of the author(s) and do not necessarily reflect the official position or policies of the U.S. Department of Justice.

Exhibit 5-6:
Aggregate Indicators of Program Impact Among NEMS Teachers and Staff
Index Possible Range
Wave 1 (Cronbach’s α)
Wave 2 (Cronbach’s α)
Wave 1 (Mean)
Wave 2 (Mean)
p
Perceptions of Problems Existing at School 0-20 .810 .880 9.37 9.07 .799
Perceptions of Safety Around/In School 0-36 .924 .927 27.3 28.41 .403
Perceptions of Problems in Neighborhood Around School 0-39 .928 .913 9.26 9.78 .755
Perceptions of Security at NEMS 0-15 .787 .626 7.17 8.79 .024
This document is a research report submitted to the U.S. Department of Justice. This report has not been published by the Department. Opinions or points of view expressed are those of the author(s) and do not necessarily reflect the official position or policies of the U.S. Department of Justice.

Exhibit 5-7:
Aggregate Indicators of Program Impact Among NEHS Teachers and Staff
Index Possible Range
Wave 1 (Cronbach’s α)
Wave 2 (Cronbach’s α)
Wave 1 (Mean)
Wave 2 (Mean)
p
Perceptions of Problems Existing at School 0-20 .768 .797 8.89 12.25 .000
Perceptions of Safety Around/In School 0-36 .948 .948 30.62 28.17 .044
Perceptions of Problems in Neighborhood Around School 0-39 .821 .888 8.58 10.64 .171
Perceptions of Security at NEHS 0-15 .610 .635 8.16 9.30 .101
This document is a research report submitted to the U.S. Department of Justice. This report has not been published by the Department. Opinions or points of view expressed are those of the author(s) and do not necessarily reflect the official position or policies of the U.S. Department of Justice.

Exhibit 5-8:
Perceptions of Security Among Teachers and Staff
Question School
Possible Range
Wave 1 (Mean)
Wave 2 (Mean)
p
Getting into the school building without being noticed is easy.
NEES 1-4 2.98 2.29 .000
NEMS 1-4 2.86 2.00 .000
NEHS 1-4 2.73 2.13 .002
Propping open the doors that are locked is common practice at the school. NEES
1-4 2.69 2.28 .006
NEMS 1-4 2.69 2.28 .205
NEHS 1-4 2.19 2.18 .972
This document is a research report submitted to the U.S. Department of Justice. This report has not been published by the Department. Opinions or points of view expressed are those of the author(s) and do not necessarily reflect the official position or policies of the U.S. Department of Justice.

Exhibit 5-9:
NEES Visitor Sign-Ins and Iris Scan Entries
0
50
100
150
200
250 4/3: Fi
5/8: Kil
5/29: Cl l6/5: Bi i
6/18:Cl il
Explanation of Peaks st Day of Iris Scan
4/16:Spring Parties ndergarten Registration
5/22: Day Before Memoria Day ass P ay
g Brother & S ster Luncheon 6/11: Tea
ass Activ ties 6/23: Last Day of Schoo
2/11
/03
2/18
/03
2/25
/03
3/4/
03
3/11
/03
3/18
/03
3/25
/03
4/1/
03
4/8/
03
4/15
/03
4/22
/03
4/29
/03
5/6/
03
5/13
/03
5/20
/03
5/27
/03
6/3/
03
6/10
/03
6/17
/03
Visitors Signing In Iris Scan Entries
This document is a research report submitted to the U.S. Department of Justice. This report has not been published by the Department. Opinions or points of view expressed are those of the author(s) and do not necessarily reflect the official position or policies of the U.S. Department of Justice.

APPENDIX A - CONSTRUCTION OF SCALES (PARENTS)
The following tables represent the survey questions used to analyze the change in perceptions of parents. Also included are the numerical values given to each possible answer. These numerical values were used in creating the composite indices presented in the report.
1. Perceptions of Problems Existing at School
Please put a check mark in the box indicating whether you have heard of the problem occurring in New Egypt Elementary School during the first semester of the 2002-2003 school year.
Responses
Q# Question No Yes
4 Student tardiness 0 1
5 Student absenteeism/cutting class 0 1
6 Pushing/shoving among students 0 1
7 Bullying by students 0 1
8 Hitting and fighting among students 0 1
9 Students threatening others 0 1
10 Robbery or theft of items over $10 0 1
11 Vandalism of school property 0 1
12 Vandalism of personal property (e.g. car) 0 1
13 Student alcohol use 0 1
14 Student drug use 0 1
15 Student tobacco use 0 1
16 Student possession of weapons 0 1
17 Trespassing 0 1
18 Verbal abuse of teachers by students 0 1
19 A student yelling at a teacher? 0 1
20 A teacher yelling at a student? 0 1
21 A student hitting a teacher? 0 1
22 A teacher hitting a student? 0 1
23 Seeing a weapon at school? 0 1
Possible Scale Range 0 To 20
This document is a research report submitted to the U.S. Department of Justice. This report has not been published by the Department. Opinions or points of view expressed are those of the author(s) and do not necessarily reflect the official position or policies of the U.S. Department of Justice.

2. Perceptions of Safety In and Around the School
The following questions pertain to your perceptions of safety in and around the school.
Responses
Q# Question Strongly Disagree Disagree Agree
Strongly Agree
24 My child feels safe at school 0 1 2 3
25 I feel safe at school 0 1 2 3
26 My child is safe walking to and from school 0 1 2 3
27 My child is safe in and around the bus stop 0 1 2 3
28 Teachers care about the safety of my child 0 1 2 3
29 School administrators care about the safety of my child 0 1 2 3
30 My child feels safe in his/her classroom 0 1 2 3
31 My child feels safe in the hallways at school 0 1 2 3
32 My child feels safe in the bathrooms 0 1 2 3
33 My child feels safe at the school bus stops 0 1 2 3
34 My child feels safe on the school playground 0 1 2 3
35 I feel safe in the neighborhood that surrounds the school 0 1 2 3
36 My child feels safe in the neighborhood that surrounds the school 0 1 2 3
Possible Scale Range 0 To 39
This document is a research report submitted to the U.S. Department of Justice. This report has not been published by the Department. Opinions or points of view expressed are those of the author(s) and do not necessarily reflect the official position or policies of the U.S. Department of Justice.

3. Perceptions of Problems in the Neighborhood Around School
Please put a check mark in the box indicating to what extent, if any, each of the following has been a problem in the neighborhood around the New Egypt Elementary School in the last six months.
Responses
Q# Question Not a problem
Minor Moderate Serious
37 Robbery or theft of items over $10 0 1 2 3
38 Vandalism of private property 0 1 2 3
39 Drug trafficking/use 0 1 2 3
40 Alcohol Use 0 1 2 3
41 Sexual Assault 0 1 2 3
42 Simple Assault 0 1 2 3
43 Burglary 0 1 2 3
44 Loitering 0 1 2 3
45 Domestic violence 0 1 2 3
46 Child abuse and neglect 0 1 2 3
47 Trash 0 1 2 3
48 Abandoned vehicles 0 1 2 3
49 Traffic problems 0 1 2 3
Possible Scale Range 0 To 39
This document is a research report submitted to the U.S. Department of Justice. This report has not been published by the Department. Opinions or points of view expressed are those of the author(s) and do not necessarily reflect the official position or policies of the U.S. Department of Justice.

4.
Q# Disagree Disagree Agree Agree
78 noticed is easy. 3 2 1 0
79 3 2 1 0
80 / 0 1 2 3
81 / 0 1 2 3
82 0 1 2 3
0 15
Perceptions of Problems of Security at School
Please read each statement and determine whether you strongly disagree, disagree, agree or strongly agree.
Responses
Question Strongly Strongly
Getting into the school building without being
Propping open the doors that are locked is common practice at the school
When entering the building, other parents always follow the sign in out process
When entering the building other visitors, such as vendors, always follow the sign in out process.
If visitors enter the building without stopping at the front office, teachers or staff will stop the person to find out their purpose in the building
Possible Scale Range To
This document is a research report submitted to the U.S. Department of Justice. This report has not been published by the Department. Opinions or points of view expressed are those of the author(s) and do not necessarily reflect the official position or policies of the U.S. Department of Justice.

5. How Efficient is the Sign-In Process?
Responses
Q# Question Strongly Disagree Disagree Agree
Strongly Agree
58 The sign-in policy is applied consistently to all visitors to the school 0 1 2 3
59 The process for signing out a child during school hours operates efficiently. 0 1 2 3
60 The process for signing out a child is convenient in emergency situations. 0 1 2 3
61
The process for signing out a child is appropriate in situations where I cannot personally pick up my child. 0 1 2 3
62 On busy days, such as snow days or Halloween, I feel the sign in policy becomes overburdening. 3 2 1 0
63
On busy days, such as snow days or Halloween, I feel the sign in policy is effective in securing the safety of children at the school. 0 1 2 3
64 I always follow the sign in/out process 0 1 2 3
Possible Scale Range 0 To 21
This document is a research report submitted to the U.S. Department of Justice. This report has not been published by the Department. Opinions or points of view expressed are those of the author(s) and do not necessarily reflect the official position or policies of the U.S. Department of Justice.