Embed Size (px)
Citation preview

Opinion Research Services The Strand, Swansea SA1 1AF
Safe Drive, Stay Alive Campaign Survey
2007
Draft Report for Surrey Fire and Rescue Service
Date of Issue: 15th February 2008
Opinion Research Services
Spin-out Company of the University of Wales Swansea

Surrey Fire and Rescue Service: Safe Drive, Stay Alive Campaign Survey 2007 Page 2
Contents
Executive Summary ................................................................................................ 4
Survey ................................................................................................................ 4
Results ............................................................................................................... 4
1. Project Overview ......................................................................................... 6
The Survey ......................................................................................................... 6
2. Your Views on Driving .................................................................................. 8
Driving Test ........................................................................................................ 8
Driving Awareness ............................................................................................... 9
Distractions Whilst Driving .................................................................................. 14
Accident Likelihood ............................................................................................ 19
Peer Pressure .................................................................................................... 27
3. About the Event ......................................................................................... 28
Safe Drive Event................................................................................................ 28
Future Events.................................................................................................... 31
Improving the Event .......................................................................................... 35
Additional Comments ......................................................................................... 36
Giveaway Preference ......................................................................................... 37
Table of Figures .................................................................................................... 38

Surrey Fire and Rescue Service: Safe Drive, Stay Alive Campaign Survey 2007 Page 3
The ORS Project Team
Project Design and Management
Abigail Little
Fieldwork Management
Joanne McCarley
Kirsty Millbank
Data Services
David Jeremiah
Data Analysis
Jonathan Clarke
Colin Crumpler
Michael Davies
Aled Evans
Text Analysis
Carla Chatfield
Report Authors
Carla Chatfield
Abigail Little

Surrey Fire and Rescue Service: Safe Drive, Stay Alive Campaign Survey 2007 Page 4
Executive Summary
Survey
1. Opinion Research Services (ORS) was commissioned by Surrey Fire and Rescue Service (SFRS) to undertake a survey into the effectiveness of its Safe Drive, Stay Alive Campaign 2007.
2. The event itself included video presentations and guest speakers on the subject of driving safely. The event was attended by school and college groups (primarily those between 16 and 19 years old) who were asked to fill in a questionnaire following the event. 3,885 completed questionnaires were returned.
3. The results of the survey in 2007 are directly comparable to those of the 2006 survey and relatively comparable to the 2005 survey. Tables showing the results of 2005 and 2006 for comparison can be found throughout.
Results
4. The majority of respondents (80%) aged seventeen and over report that they have not passed their driving test. Of those aged seventeen and over who have not passed their driving test, 62% report that they are currently learning to drive.
5. An overwhelming majority of respondents feel that it is important for drivers to be aware of pedestrians, other vehicles and the speed limit, keep within the speed limit, be aware of cyclists, keep a safe distance from the car in front and check mirrors.
6. Respondents feel that it is important for drivers to keep to the speed limit in all areas, although female respondents are more likely than male respondents to think it is „very important‟ to keep within the specified speed limit in all areas.
7. Respondents selected using a mobile whilst driving, bad weather conditions and eating whilst driving as the three factors (from a list of nine factors) most likely to affect a person‟s ability to drive safely. Further key factors identified (in text comments) as affecting someone‟s ability to drive safely included substance misuse (alcohol and drugs), health (mainly tiredness/fatigue) and distractions (mainly children/babies).
8. Males and females aged 17-24 years are considered to be the most likely to be involved in an accident whilst driving. It was also thought likely that males aged 25-44 and male and female drivers aged over 70 would be involved in an accident. Text comments identified young drivers‟ inexperience and older drivers‟ reaction speeds/health as the key reasons why they would be likely to be involved in an accident.
9. 93% of respondents agree with the statement that “Peer pressure can sometimes lead to young people being „egged on‟ to drive more recklessly”.
10. Respondents are generally very positive about the Safe Drive, Stay Alive event they attended. The vast majority (between 95% and 97%) agree that the information provided was clearly presented, easy to understand and the event was informative.

Surrey Fire and Rescue Service: Safe Drive, Stay Alive Campaign Survey 2007 Page 5
11. Importantly, the vast majority also agree that the event will influence the way in which they drive in the future, has had an influence on what they consider to be safe driving and will make the young people who attended safer drivers.
12. 90% of respondents agreed that the length of the event was about right.
13. 97% of respondents report that they would recommend the event to others. Text comments indicate that a great number of respondents feel that the event has made a lasting impact on them. Most feel that the event was informative, thought provoking and raised awareness of consequences/dangers.
14. 42% of respondents agree that the event was enjoyable, but 28% disagree with this statement. As one would expect, text comments suggest that the event, although incredibly effective, was considered extremely shocking and hard hitting by many respondents.
15. 17% of respondents feel that the event could be improved in some way. Text comments suggest a number of ways in which the event could be improved including a talk from a younger person who has been involved in an accident, more true life stories told from a variety of perspectives (parents, friends, old people, young people), practical advice as to how to drive safely (not just the consequences of not driving safely) and increased audience participation.
16. Respondents were asked to rank three giveaways in order of their preference. The most popular was a wristband, followed by a keyring and then the pen.

Surrey Fire and Rescue Service: Safe Drive, Stay Alive Campaign Survey 2007 Page 6
1. Project Overview
The Survey
1.1 Opinion Research Services (ORS) was commissioned by Surrey Fire and Rescue Service (SFRS) to undertake a survey into the effectiveness of its Safe Drive, Stay Alive Campaign 2007.
1.2 SFRS deal with the consequences of road traffic accidents on a daily basis and recognise the importance of attempting to reduce the number of such accidents. Of all driver types, young drivers are most likely to be involved in accidents. Over the last three years, 4,642 young drivers have been involved in injury collisions in Surrey. Of these, 37 individuals have been killed, whilst 20 of their passengers have been killed. Possibly the most telling statistic is that 20% of all drivers crash within their first year of driving.
1.3 With this in mind, SFRS and its partners (Surrey County Council, Surrey Police, South East Coast Ambulance, The Royal Surrey Hospital and Roadpeace) and sponsors (ExxonMobil, Air Products, esure.com and Mercedes World) have organised Safe Drive, Stay Alive events. The events included video presentations and guest speakers.
1.4 In order to explore and improve the impact of this event, SFRS have commissioned ORS to survey participants who attended this event. The event itself was attended by school and college groups (primarily those between 16 and 19 years old) who were asked to fill in a questionnaire following the event. 3,885 completed questionnaires were returned.
1.5 The Safe Drive, Stay Alive Campaign was also carried out by ORS for SFRS in 2006 and 2005 and throughout this report tables have been included showing the results from previous years. Many of the results are very similar between the three years, however, caution should be applied when comparing 2007 and 2006 results with 2005. In 2005, questions were asked with a four point scale which did not include a „middle ground‟ option but this was updated in 2006 in accordance with Office of National Statistics guidance and Government research methodology.
1.6 Research on a similar campaign was also conducted by ORS for SFRS in 2004. However, the format of the research in 2007, 2006 and 2005 is different from that in 2004 and therefore the results are not directly comparable.
1.7 The 2007 survey contained questions on the following topics:
Your Views on Driving
About the Event
About You
1.8 Figures 1 and 2, overleaf, show the profiles of the respondents to the survey. Please note that the columns may not sum to 100% due to rounding.

Surrey Fire and Rescue Service: Safe Drive, Stay Alive Campaign Survey 2007 Page 7
Gender – All Respondents
Number of cases Valid %
Male 1652 44%
Female 2078 56%
Not Known 155 -
Figure 1: Gender by all respondents
Age –
All Respondents Number of cases Valid %
Fifteen 73 2%
Sixteen 2029 55%
Seventeen 1179 32%
Eighteen 285 8%
Nineteen to twenty four 104 3%
Twenty five and over 49 1%
Not Known 166 -
Figure 2: Age by all respondents
1.9 The numbers which appear on the charts represent the percentage of respondents who appear in the relevant category. Anyone who did not respond to a question, or answered „don‟t know‟, has been omitted from the results unless otherwise stated.
1.10 Where appropriate, the colours used in the charts reflect a traffic light system with green representing a positive response, yellow being neither positive nor negative responses and red representing a negative response. More extreme responses, for example „strongly agree‟ or „strongly disagree‟, are denoted by brighter colours.
1.11 For the majority of the questions there is little difference in responses between the different groups within the sample. Therefore, the data reported in the charts is for the whole sample, but any large discrepancies between different groups are noted in the text.

Surrey Fire and Rescue Service: Safe Drive, Stay Alive Campaign Survey 2007 Page 8
2. Your Views on Driving
Driving Test
2.1 The majority of all respondents (91%) report that they have not passed their driving test. Only 29% of those who have not passed their driving test report that they are currently learning to drive. However, bearing in mind that young people cannot drive until they are seventeen anyway, the figures alter if one removes those aged sixteen and under. These results (see Figure 3 below) show that 80% have not passed their driving test whilst 62% are currently learning to drive.
2.2 Both sets of results suggest that many respondents would have had little personal experience of driving before attending the event.
Figure 3: Have you passed your driving test? By all respondents aged seventeen or over and
Are you currently learning to drive? By all respondents who have not passed their driving test and are aged seventeen or over
2007 2006 2005*
Passed driving test 20% 23% 10%
Learning to drive 62% 63% 69%
* Please note that 2005 figures did not take into account age groups, nor have they removed those aged under seventeen. Please also see note 1.5 in Project Overview.
Figure 4: Have you passed your driving test? And of those who answered no, are you learning to drive? 2007, 2006 and 2005
Yes20%
No80%
Have you passed your driving test?
By all respondents aged seventeen or over
Yes62%
No38%
Are you currently learning to
drive? By all respondents who have not
passed their driving test and are aged seventeen or over

Surrey Fire and Rescue Service: Safe Drive, Stay Alive Campaign Survey 2007 Page 9
Driving Awareness
2.3 Respondents were questioned about the importance of several aspects of driving. Figure 5, overleaf, shows that the overwhelming majority of respondents feel that it is important for drivers to:
Be aware of pedestrians
Be aware of other vehicles
Be aware of the speed limit
Keep within the speed limit
Be aware of cyclists
Keep a safe distance from the vehicle in front
Check mirrors
2.4 For each of the 7 listed options in the question, female respondents are significantly more likely to state it is „very important‟ than male respondents. Respondents aged 18 and over are significantly more likely than respondents aged 16 and under to state it is „very important‟ to be aware of the specified speed limit; to keep a safe distance from the vehicle in front; to check mirrors; to be aware of cyclists and to be aware of pedestrians. Respondents who have passed their test or are learning to drive are significantly more likely than respondents with no driving experience to state it is „very important‟ to keep a safe distance from the vehicle in front and to check mirrors.

Surrey Fire and Rescue Service: Safe Drive, Stay Alive Campaign Survey 2007 Page 10
Figure 5: Please indicate for each of the following, how important or unimportant you feel it is for drivers…? By all respondents
Please note if figure not shown value is less than 3%
0% 20% 40% 60% 80% 100%
To check mirrors
To keep a safe distance from the vehicle
in front
To be aware of cyclists
To keep within the speed limit
To be aware of the specified speed limit
To be aware of other vehicles
To be aware of pedestrians
73
74
83
76
80
86
87
24
24
14
22
19
13
12
Very important Fairly important
Neither important nor unimportant Fairly unimportant
Very unimportant

Surrey Fire and Rescue Service: Safe Drive, Stay Alive Campaign Survey 2007 Page 11
2007 2006 2005*
Important Unimportant Important Unimportant Important Unimportant
To be aware
of other vehicles
99% 0% 98% 1% 99% 1%
To be aware of
pedestrians
99% 0% 98% 1% 99% 2%
To be aware of cyclists
97% 1% 97% 1% 98% 2%
To be aware
of speed limit 99% 0% 98% 2% 99% 2%
To keep safe
distance from vehicle in
front
98% 0% 97% 1% 98% 2%
To keep within the
speed limit
98% 0% 97% 2% 97% 3%
To check mirrors
97% 0% 96% 1% 97% 3%
* Please see note 1.5 in Project Overview.
Figure 6: How important or unimportant do you feel the following are for drivers? 2007,
2006 and 2005

Surrey Fire and Rescue Service: Safe Drive, Stay Alive Campaign Survey 2007 Page 12
2.5 Respondents were asked a series of questions concerning speed limits. Figure 7 illustrates the respondents‟ views on keeping to the speed limit. The majority of respondents feel that it is very important for drivers to keep to the speed limit in all areas. Keeping to the speed limit in residential areas is considered most important by respondents, whilst keeping to the speed limit on motorways is considered least important.
2.6 Female respondents are more significantly more likely than male respondents to think it is „very important‟ to keep within the specified speed limit for each of the options listed in the question. Respondents aged 18 and over are significantly more likely than those aged 16 and under to state it is „very important‟ to keep within the speed limit when in towns. Similarly, respondents who have passed their test or are learning to drive are significantly more likely than those without driving experience to feel it is „very important‟ not to speed in towns.
Figure 7: How important or unimportant do you think it is for drivers to keep within the specified speed limit when…? By all respondents
Please note if figure not shown value is less than 3%
0% 20% 40% 60% 80% 100%
On motorways
On major roads
In towns
In city centres
In residential areas
56
68
83
86
87
34
27
16
13
12
7
4
3
Very important Fairly important
Neither important nor unimportant Fairly unimportant
Very unimportant

Surrey Fire and Rescue Service: Safe Drive, Stay Alive Campaign Survey 2007 Page 13
2007 2006 2005*
Important Unimportant Important Unimportant Important Unimportant
In residential areas
99% 0% 99% 1% 99% 1%
In city centres
99% 0% 97% 1% 98% 2%
In towns 99% 0% 98% 0% 99% 1%
On major roads
95% 1% 92% 3% 95% 5%
On
motorways 90% 4% 85% 6% 88% 12%
* Please see note 1.5 in Project Overview.
Figure 8: How important or unimportant do you think it is for drivers to keep within the
specified speed limit when…? 2007, 2006 and 2005

Surrey Fire and Rescue Service: Safe Drive, Stay Alive Campaign Survey 2007 Page 14
Distractions Whilst Driving
2.7 Respondents were asked to indicate how likely they thought certain factors are to affect a person‟s ability to drive safely. Figure 9, overleaf, illustrates that 96% of respondents feel that using a mobile whist driving is likely to affect a person‟s ability to drive safely. Bad weather conditions, eating, drinking a non-alcoholic drink and operating dashboard mounted stereo/CD controls were also considered by over three quarters of respondents as being likely to affect safe driving. Less than half of all respondents thought that talking to a passenger (41%) or listening to music (37%) are likely to affect the ability to drive safely.
2.8 For each of the options in the question, respondents aged 18 and over are significantly more likely than those aged 16 and under to state „very likely‟. For each of the options apart from „drinking a non-alcoholic drink and „talking to a passenger‟, respondents who have passed their test or are learning to drive are significantly more likely to state „very likely‟ than respondents with no driving experience.
2.9 Female respondents are significantly more likely than male respondents to state it is „very likely‟ for the following options: using a mobile; drinking non-alcoholic drink; smoking; operating car stereo/CD with dashboard controls; operating car stereo/CD with steering wheel controls and bad weather conditions whilst driving.
2.10 Male respondents are significantly more likely than female respondents to state it is „very unlikely‟ for the following options: eating; drinking non-alcoholic drink; smoking; listening to music; operating car stereo/CD with dashboard controls; operating car stereo/CD with steering wheel controls and talking to a passenger whilst driving.

Surrey Fire and Rescue Service: Safe Drive, Stay Alive Campaign Survey 2007 Page 15
Figure 9: How likely or unlikely are the following factors to affect a person’s ability to drive safely? By all respondents
Please note if figure not shown value is less than 3%
0% 20% 40% 60% 80% 100%
Listening to music whilst
driving
Talking to a passenger
whilst driving
Operating a car stereo/CD
player using steering
wheel mounted controls whilst driving
Smoking whilst driving
Operating a car stereo/CD
player using dashboard
mounted controls whilst driving
Drinking (a non-alcoholic
drink) whilst driving
Eating whilst driving
Bad weather conditions
Using a mobile whilst
driving
10
11
21
29
34
37
31
48
68
27
30
32
44
43
41
50
40
28
32
31
23
18
16
15
14
9
21
20
16
6
6
4
4
10
8
7
3
Very likely Fairly likely Neither likely nor unlikely Fairly unlikely Very unlikely

Surrey Fire and Rescue Service: Safe Drive, Stay Alive Campaign Survey 2007 Page 16
2007 2006 2005*
Likely Unlikely Likely Unlikely Likely Unlikely
Using a mobile whilst driving
96% 2% 94% 2% 96% 4%
Bad weather
conditions 88% 3% 87% 3% 92% 8%
Drinking (a non-
alcoholic drink)
whilst driving
78% 6% 76% 8% 81% 19%
Operating a car
stereo/CD player using dashboard
mounted controls whiles
driving
77% 7% 74% 8% 82% 18%
Eating whilst driving
81% 5% 79% 7% 83% 17%
Smoking whilst
driving 73% 9% 69% 12% 70% 30%
Operating a car
stereo/CD player using steering
wheel mounted
controls whilst driving
53% 23% 48% 26% 53% 46%
Talking to a passenger whilst
driving
41% 28% 36% 32% 44% 56%
Listening to music whilst
driving
37% 31% 31% 34% 37% 63%
* Please see note 1.5 in Project Overview.
Figure 10: How likely or unlikely are the following factors to affect a person’s ability to drive
safely? 2007, 2006 and 2005

Surrey Fire and Rescue Service: Safe Drive, Stay Alive Campaign Survey 2007 Page 17
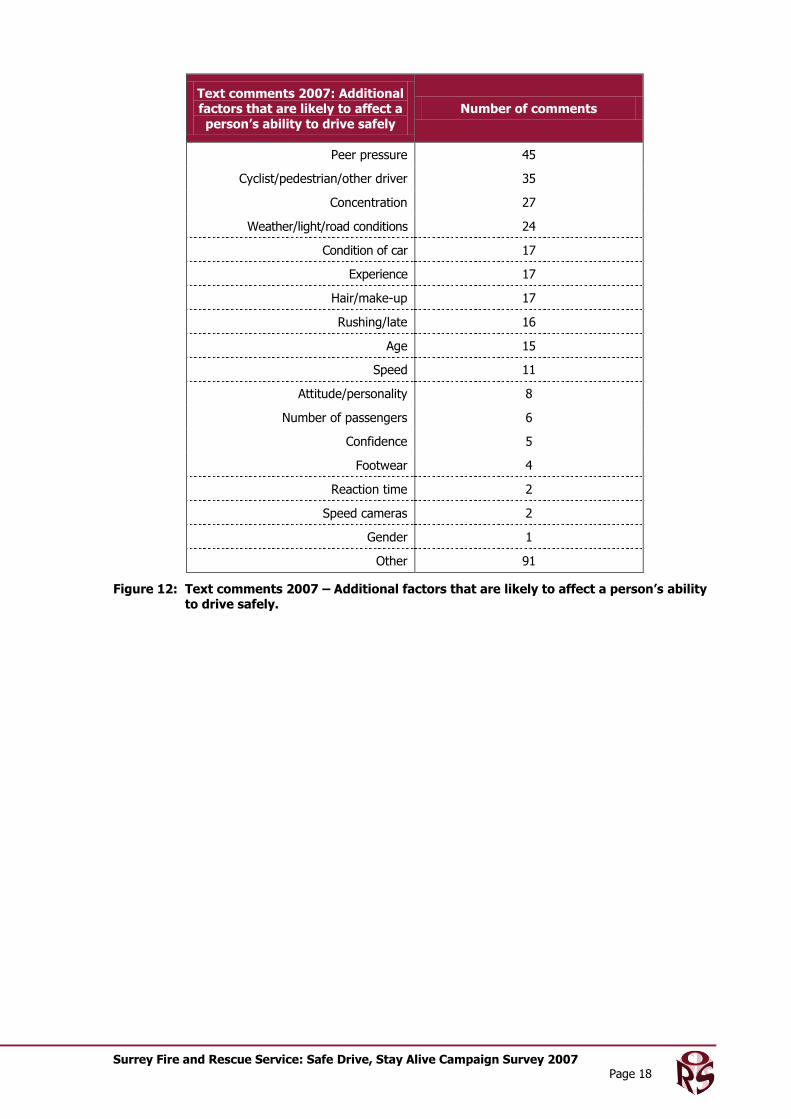
2.11 Other factors which are likely to affect a person‟s ability to drive safely were also identified by respondents, without prompting, in text comments. 1,732 comments were made in total, of which 924 were comments specifically relating to factors inside the car, 95 specifically referenced factors outside the car and 21 comments were specific to the condition of the car itself. Of those relating to inside the car, 500 were specifically relating to the driver and 139 specifically to the passengers.
2.12 Of the 1,732 comments, the most common issues relate to substance misuse (747 comments), health (406 comments) and distractions (236 comments). A detailed breakdown of these text comments can be found in Figure 11, whilst additional comments can be found in Figure 12.
Text comments 2007: Factors
that are likely to affect a person’s ability to drive safely – substance
misuse, health and distractions
Number of comments
Substance misuse
Alcohol 396
Drugs 343
Other 8
Health
Tiredness/fatigue 216
Emotional 97
Eyesight/blindness 40
Sickness/illness/injury 26
Disability 9
Coughing/sneezing 6
Hearing 2
Other 10
Distractions
Children/babies 48
Noise 28
Argument 21
MP3/music 15
Phones 9
Pets 8
Map/GPS 8
Familiar people 5
Reading 4
Other 90
Figure 11: Text comments 2007 – Factors that are likely to affect a person’s ability to drive safely – substance misuse, health and distractions.
Surrey Fire and Rescue Service: Safe Drive, Stay Alive Campaign Survey 2007 Page 18
Text comments 2007: Additional factors that are likely to affect a
person’s ability to drive safely
Number of comments
Peer pressure 45
Cyclist/pedestrian/other driver 35
Concentration 27
Weather/light/road conditions 24
Condition of car 17
Experience 17
Hair/make-up 17
Rushing/late 16
Age 15
Speed 11
Attitude/personality 8
Number of passengers 6
Confidence 5
Footwear 4
Reaction time 2
Speed cameras 2
Gender 1
Other 91
Figure 12: Text comments 2007 – Additional factors that are likely to affect a person’s ability to drive safely.

Surrey Fire and Rescue Service: Safe Drive, Stay Alive Campaign Survey 2007 Page 19
Accident Likelihood
2.13 Figure 13 shows that 93% of respondents feel that males aged 17-24 years are likely to be involved in an accident whilst driving. 89% of respondents also consider females aged 17-24 years to be likely to be involved in an accident. Males aged 25-44 and both males and females aged over 70 were also thought likely to be involved in an accident. Females aged 45-64 are considered the least likely to be involved in an accident.
2.14 When concentrating on the respondents‟ own age group, essentially 17-24, there is no real difference by gender for the likelihood for females aged 17-24 to be involved in an accident. However, female respondents are significantly more likely than male respondents to state that it is „very likely‟ for males aged 17-24 to be involved in an accident. Similarly male respondents are significantly more likely than female respondents to answer „very unlikely‟ for this option.
2.15 Respondents aged 18 and over are significantly more likely than those aged 16 and under to state „very likely‟ for both options of males aged 17-24 and females aged 17-24. Respondents with driving experience are also significantly more likely to state „very likely‟ for both options than those without driving experience.

Surrey Fire and Rescue Service: Safe Drive, Stay Alive Campaign Survey 2007 Page 20
Figure 13: How likely or unlikely are the following to be involved in an accident whilst
driving? By all respondents
Please note if figure not shown value is less than 3%
0% 20% 40% 60% 80% 100%
Females aged 45 - 64
Males aged 45-64
Males aged 65 - 70
Females aged 25 - 44
Females aged 65 - 70
Males aged over 70
Females aged over 70
Males aged 25 - 44
Females aged 17 - 24
Males aged 17 - 24
12
12
21
16
23
41
42
30
52
74
29
36
37
45
38
30
32
46
37
19
41
41
27
31
24
15
14
18
9
6
15
10
12
7
11
7
7
4
3
3
7
6
Very likely Fairly likely Neither likely nor unlikely Fairly unlikely Very unlikely

Surrey Fire and Rescue Service: Safe Drive, Stay Alive Campaign Survey 2007 Page 21
2007 2006 2005*
Likely Unlikely Likely Unlikely Likely Unlikely
Males aged 17 to 24
93% 2% 91% 3% 96% 4%
Females aged
17 to 24 89% 2% 88% 2% 94% 5%
Males aged 25
to 44 76% 5% 74% 7% 83% 17%
Females aged over 70
74% 13% 70% 15% 74% 26%
Males aged over 70
71% 14% 66% 16% 72% 29%
Females aged
25 to 44 61% 8% 56% 9% 66% 34%
Females aged 65 to 70
61% 14% 57% 17% 64% 36%
Males aged 65 to 70
58% 15% 58% 18% 60% 39%
Males aged 45
to 64 48% 12% 43% 14% 55% 45%
Females aged
45 to 64 41% 17% 38% 20% 45% 55%
* Please see note 1.5 in Project Overview.
Figure 14: How likely or unlikely are the following to be involved in an accident whilst
driving? 2007, 2006 and 2005

Surrey Fire and Rescue Service: Safe Drive, Stay Alive Campaign Survey 2007 Page 22
2.16 Text comments explaining the reasons why certain age groups/genders are thought likely to be involved in an accident can be found in Figure 15, Figure 16, Figure 17 and Figure 18 below.
2.17 Comments identified young drivers‟ inexperience, the desire to show off and the desire to drive fast/speed and older drivers‟ slow reactions and poor health as the key reasons why they would be likely to be involved in an accident.
2.18 Young males are thought to speed/race and show off (47 comments), whereas young females are thought to lack experience/be nervous (4 comments). However, young females were also identified as being sensible and safe drivers (4 comments). Old drivers are considered to be more experienced /wiser (47 comments), although most comments relate to poor health/lack of concentration and slow reactions (584 comments). Middle aged drivers are seen as experienced, responsible drivers.
2.19 Comments relating to males (no specified age) show they are believed to drive fast/speed, show off and drive recklessly/dangerously (202 comments). Females are seen to be careful and safe drivers (21 comments). Ten comments relate to women not being able to drive.
2.20 New drivers are considered to lack experience and be more likely to crash (42 comments). New male drivers are seen by some as likely to crash, speed and show off. Comments relating to experienced drivers suggest they have fewer accidents and are safe and careful drivers (8 comments).
2.21 91 comments relate to the belief that there are no differences based on age or gender when it comes to having an accident. More importantly, 241 comments recognise that everyone is at risk of being involved in an accident.

Surrey Fire and Rescue Service: Safe Drive, Stay Alive Campaign Survey 2007 Page 23
Text comments 2007: Likelihood Key Comments, Young People
Number of comments
Young Males
Fast/speeding/racing/boy racer 47
Show off 47
Reckless/Careless 24
Crash propensity (likely) 15
Peer pressure/impress 15
Distracted 1
Drinking driving/alcohol 1
Young Female
Lack experiences/new driver/lack
confidence/nervous 4
Safe/sensible 4
Show off/influenced 2
Slow 1
Crash propensity (likely) 1
Drink driving/alcohol 1
Young - Both/Either
Lack experience 303
Show off 133
Crash propensity (likely) 107
Fast/race 94
Lack attention 68
Just past test 67
Speed 58
Over confident/dangerous/silly/take risks/make mistakes
56
Lack awareness/slow reaction/lack
concentration 51
Reckless 46
Careless 43
Peer pressure/impress/road
rage/influenced 42
Drink driving/alcohol 39
Distraction/Accessories 24
Figure 15: Text comments 2007 – Likelihood to be involved in an accident - Young People

Surrey Fire and Rescue Service: Safe Drive, Stay Alive Campaign Survey 2007 Page 24
Text comments 2007: Likelihood Key Comments, Middle Aged and
Old People
Number of comments
Middle Age - Either
Experienced 22
Safe/careful/sensible/take less
risks/good driver/responsible 11
Concentrate/more aware 4
Less accidents 4
Mature 4
Bad habits/over confident/less cautious
3
Are confident 1
Old - Both/Either
Slow reactions 330
Poor health 152
Lack concentration/less aware/distracted
103
Crash propensity (likely) 79
Experienced/wiser 47
Can‟t drive/worse/bad driver 40
Slow (neutral) 39
Slow (negative) 34
Safe/careful/cautious 33
Don‟t drive 13
Careless/reckless 8
Speeding 1
Figure 16: Text comments 2007 – Likelihood to be involved in an accident – Middle Age and
Old People

Surrey Fire and Rescue Service: Safe Drive, Stay Alive Campaign Survey 2007 Page 25
Text comments 2007: Likelihood Key Comments, Male and Female
Number of comments
Male
Fast/speeding/racing 79
Showing off 77
Reckless/dangerous/take risks/careless
46
Crash propensity (likely) 21
Better drivers 19
Peer pressure/impress 16
Boy racer 5
Drink driving/alcohol 4
Distracted 4
Boy Racer
Boy racer (non specific) 21
Female
Safe 11
Can‟t drive 10
Careful 10
Careless/reckless 3
Speeding/racing 2
Showing off 1
Figure 17: Text comments 2007 – Likelihood to be involved in an accident – Male and Female

Surrey Fire and Rescue Service: Safe Drive, Stay Alive Campaign Survey 2007 Page 26
Text comments 2007: Likelihood Key Comments, New and
Experienced Drivers
Number of comments
New Male
Crash propensity (likely) 4
Fast/speeding 4
Showing off 2
Lack experience 1
Less aware 1
Are confident 1
Less cautious 1
New Female
Lack experience 1
New - Both/Either
Crash propensity 26
Lack experience 16
Showing off 8
Careless/reckless 4
Fast 3
Experienced - Either
Less accidents 4
Safe/careful/more aware 4
Cautious 1
Take risks 1
Are confident 1
Everyone/Anyone
No difference based on age or gender 91
All at risk
All at risk 241
Figure 18: Text comments 2007 – Likelihood to be involved in an accident – New and Experienced Drivers

Surrey Fire and Rescue Service: Safe Drive, Stay Alive Campaign Survey 2007 Page 27
Peer Pressure
2.22 93% of respondents (compared with 93% in 2006 and 95% in 2005) agree with the statement that “peer pressure can sometimes lead to young people being „egged on‟ to drive more recklessly”. This highlights the importance of events such as Safe Drive, Stay Alive to attempt to influence the views of young adults.
2.23 Female respondents, respondents aged 18 and over and respondents with driving experience are significantly more likely to „strongly agree‟ with the statement than male respondents, respondents aged 16 and under and respondents without driving experience. Male respondents are significantly more likely to „strongly disagree‟ with the statement than female respondents.
2.24 Text comments include many references for the need to change the views young adults have about driving and praise the Safe Drive, Stay Alive event for the impact it has made on their attitudes towards driving.
Figure 19: To what extent do you agree or disagree that peer pressure can sometimes lead to young people being ‘egged on’ to drive more recklessly? By all respondents
Strongly agree55%
Tend to agree38%
Neither agree nor disagree
6%
Tend to disagree1%
Strongly disagree1%

Surrey Fire and Rescue Service: Safe Drive, Stay Alive Campaign Survey 2007 Page 28
3. About the Event
Safe Drive Event
3.1 Respondents are generally positive about the Safe Drive, Stay Alive event they attended, as illustrated overleaf in Figure 20. The vast majority agree that the information provided was clearly presented, easy to understand and the event was informative. 93% also agree that the event will influence the way in which they drive in the future whilst 91% agree the event has had an influence on what they consider to be safe driving. 85% agree that the event will make the young people who have attended safer drivers.
3.2 90% of respondents (compared to 89% in 2006 and 90% in 2005) feel that the length of the event was about right. 6% thought it was too long whilst 4% thought it was too short.
3.3 42% of respondents agree that the event was enjoyable, but 28% disagree with this statement. Text comments suggest that the „hard hitting‟ nature of the event, although effective, was considered extremely shocking and upsetting by many respondents. However many respondents also mentioned that they agree that the method had a powerful impact on them and changed they way they think about driving.
3.4 Female respondents are significantly more likely than male respondents to „strongly agree‟ that the event has had an influence on what they consider to be safe driving, that the event will influence the way in which they drive in the future and that the event will make the young people who have attended safer drivers.

Surrey Fire and Rescue Service: Safe Drive, Stay Alive Campaign Survey 2007 Page 29
Figure 20: Do you agree or disagree with the following statements about the Safe Drive event
you attended? By all respondents
Please note if figure not shown value is less than 3%
0% 20% 40% 60% 80% 100%
The event was enjoyable
The event will make
the young people
who have attended safer drivers
The event has had an
influence on what I consider to be safe
driving
The event will
influence the way in
which I drive in the future
The event was informative
The information
provided was easy to
understand
The information
provided was clearly
presented
17
50
70
70
72
75
78
25
35
21
23
23
22
19
30
12
7
6
4
15 13
Strongly agree Tend to agree Neither agree nor disagree
Tend to disagree Strongly disagree

Surrey Fire and Rescue Service: Safe Drive, Stay Alive Campaign Survey 2007 Page 30
2007 2006 2005*
Agree Disagree Agree Disagree Agree Disagree
The information
provided was
clearly presented
97% 0% 97% 0% 100% 0%
The information provided was
easy to understand
97% 0% 97% 0% 100% 0%
The event was
informative 95% 1% 94% 2% 98% 2%
The event has
had an influence
on what I consider to be
safe driving
91% 2% 90% 3% 96% 5%
The event will
influence the
way in which I drive in the
future
93% 3% 90% 3% 97% 4%
The event will
make the young people who
have attended
safer drivers
85% 3% 83% 3% 92% 8%
The event was
enjoyable 42% 28% 41% 30% 57% 43%
* Please see note 1.5 in Project Overview.
Figure 21: Do you agree or disagree with the following statements about the Safe Drive event
you attended? 2007, 2006 and 2005

Surrey Fire and Rescue Service: Safe Drive, Stay Alive Campaign Survey 2007 Page 31
Future Events
3.5 Figure 22 shows that 97% of respondents report that they would recommend the event to others whilst 83% cannot think of anything that could be done to improve future events. Text comments (Figure 24 overleaf) indicate that many respondents feel that the event was informative, thought provoking and will raise awareness, helping to encourage young people to change their views on driving.
Figure 22: Would you recommend the event to others, and is there anything you think could
be done to improve future events? By all respondents
2007 2006 2005*
Yes No Yes No Yes No
Would
recommend the event to others
97% 3% 95% 5% 97% 3%
Anything that
could be done to improve
future events
17% 83% 18% 82% 17% 83%
* Please see note 1.5 in Project Overview.
Figure 23: Would you recommend the event to others, and is there anything you think could
be done to improve future events? 2007, 2006 and 2005
Yes97%
No3%
Would you recommend the event to others?
No83%
Yes17%
Is there anything you think that could be done to improve future
events?

Surrey Fire and Rescue Service: Safe Drive, Stay Alive Campaign Survey 2007 Page 32
3.6 Of 2,851 comments in total, 512 comments stated that respondents would recommend the event because they felt it was informative, whilst 499 stated it was thought provoking. 569 comments show that respondents would recommend the event because it raises awareness. 178 comments stated that the event was shocking/horrific/graphic but comments show that it is this method that helps get the message across.
Text comments 2007: Why respondents would recommend the event to others
Number of specific category comments
Informative 512
Thought provoking 499
Raising awareness of consequences/dangers 300
Raising awareness 269
Shocking/horrific/graphic 178
Moving/touching 165
Educational 160
Real-life cases 137
Reality/truthful 130
Good 127
Powerful 119
Useful 106
Hard-hitting 105
Effective 105
Emotional 74
Safety 73
Changing views 71
Insightful 61
Influential 59
Understandable 57
Important 49
Upsetting 42
Scary 28
Saves lives 26
Memorable 24
Enjoyable 22
Strong/valued points 20
Worthwhile 15
Clear 12
Encouraging 12
Brilliant/excellent 10
Quality of event 9
Perspective 9
Figure 24: Text comments 2007 – Reasons why respondents would recommend the event to others.

Surrey Fire and Rescue Service: Safe Drive, Stay Alive Campaign Survey 2007 Page 33
3.7 Some selected comments as to why people would recommend the event include:
“Even if this information only gets through to 1 person it is worth it” “It could save lives” “It was very worthwhile because it really made you think about road safety as a driver, passenger or pedestrian like nothing else does or can” “Presented in a very reasonable, easy to understand manner; very persuasive will definitely turn dare devil drivers around” “Eye opener to reckless driving, reality check” “Because it would make the road safer” “Because it made you think twice and it shocked everyone and it made you want to drive safe”
3.8 Female respondents are significantly more likely to state they would recommend the event than male respondents.

Surrey Fire and Rescue Service: Safe Drive, Stay Alive Campaign Survey 2007 Page 34
3.9 Of the small minority of respondents (3%) that would not recommend the event, 80 text comments were made. From these comments explaining why people would not recommend the event, the main reasons given were that the event was too upsetting/distressing (16 comments); it was emotional (8 comments); that they felt that the event would not change people‟s views (7 comments) or that is was boring (7 comments). A breakdown of selected key comments can be found in Figure 25.
Text comments 2007: Why
respondents would recommend not the event to
others
Number of specific category comments
Upsetting/depressing/distressing 16
Emotional 8
No effect/won‟t change
views/not useful 7
Boring 7
Already know it 5
Too long 4
Horrific/Scary 4
Too shocking 4
No reason 3
Not enjoyable 2
Graphic/disturbing 2
Fainting 2
Not shocking enough 1
Too personal 1
Too much information 1
Figure 25: Text comments 2007 – Reasons why respondents would not recommend the event
to others.

Surrey Fire and Rescue Service: Safe Drive, Stay Alive Campaign Survey 2007 Page 35
Improving the Event
3.10 Figure 22 on page 31 shows that only 17% of respondents feel that the event could be improved in any way.
3.11 Text comments suggest a number of ways in which respondents feel the event could be improved. Key suggestions include:
Young people who have been involved in accidents coming to the event to talk about their experience. It was suggested that using younger people means the audience could relate to them more. “A young person involved, who has been involved in an accident” “Get a child aged 17 who had been in a crash which killed someone”
More real-life stories could be used, but from a number of different perspectives, including victims, friends of victims, parents, other relatives, people who have caused crashes. “Face 2 face with more parents relating videos to real people standing there” “Have the family of the people in the car crash on stage” “Hear young people go up and talk about losing friends and relatives and not just parents or adults” “Dads of victims telling their story” “A few more real life stories from a wider range of people, e.g. 18, 30, 70 years old” “I think hearing from people, our age who‟ve lost friends would make a big impact” “Could get someone who was driving who caused the accident to talk” “Actual victims could be there”
Audience participation/time for audience to ask questions and have them answered. “A chance for audience to ask questions” “A lot more interactive instead of being fed information” “Get the audience more involved” “Questions part at the end so people can ask questions”
More information on the causes of accidents. “I think you could provide more information about what can cause accidents...”
Photographs of accidents - before and after photos. “Photographs of real accidents that have happened” “Photos of before and after”
Provide information on how to be a safe driver. “Actually try to advise about the way to drive (not just drive safe)”

Surrey Fire and Rescue Service: Safe Drive, Stay Alive Campaign Survey 2007 Page 36
Additional Comments
3.12 Respondents were also asked whether they had any other general comments. A few key issues emerged that have not been covered in the analysis of other comments:
Effectiveness of ads. “Adverts at the end hit home most. Much better than anything I‟ve seen on TV” “Why are the adverts shown at the end not shown on television I think they would have a greater impact”
Need for opportunity to talk to those present. “Be good to have the opportunity to talk to the presenters about their experiences. At the start it felt a bit like recruitment for the emergency services”
Thanks for the event and for those who shared stories. “I appreciate the people who made the talk happen because it will be very beneficial for people learning to drive” “I would just like to say to all those who spoke thank you for having the strength and courage to do so, you are amazing people in my eyes” “Thank you for opening my eyes to other people‟s effects and the hard jobs” “Thank you. May have saved my life” “Thanks to everyone it was a hugely brave and selfless thing to do” “I had a lot of respect for the people who spoke and I think this made a difference to the way we will drive in the future” “Hearing real life experiences made the event so much more poignant”
The event did not help/had a negative impact. “It was mostly people talking about accidents rather than giving any useful information, as emotional as these may be they don‟t really help” “I think it stops me from having the confidence to drive” “Made me quite paranoid about taking my nearest and dearest in my car”
Organisation of the event. “The organisation, especially the coaches and journey from „drop off‟ points to venue was greatly improved from last year” “Very well organised, presented and attention grabbing” “Well done - a true inspiration!”
Professionalism of the event. “Very professional”

Surrey Fire and Rescue Service: Safe Drive, Stay Alive Campaign Survey 2007 Page 37
Further suggestions/comments. “Make it more direct to young males I noticed they still thought it wasn‟t aimed at them” “Open this event to more schools as I know some colleagues in other Surrey schools who have never heard of this fantastic and life saving opportunity” “Provide a leaflet afterwards containing a summary of the lecture, with useful facts, so people can remember it...In the goody bag, stickers for the rear windscreen should be placed saying, „I‟m sticking to the speed limit‟ or similar, to tell other drivers to slow down as well” “Saw one two years ago and I thought it has improved a lot”
Giveaway Preference
3.13 Respondents were asked to rank in order of preference their favourable giveaway, choosing between a keyring, pen and wristband.
3.14 The most popular giveaway was the wristband followed by the keyring and then the pen (compared with the wristband, followed by the pen and then the keyring in 2006).

Surrey Fire and Rescue Service: Safe Drive, Stay Alive Campaign Survey 2007 Page 38
Table of Figures
Figure 1: Gender by all respondents 7
Figure 2: Age by all respondents 7
Figure 3: Have you passed your driving test? By all respondents aged seventeen or over and Are you currently learning to drive? By all respondents who have not passed their driving test and are aged seventeen or over 8
Figure 4: Have you passed your driving test? And of those who answered no, are you learning to drive? 2007, 2006 and 2005 8
Figure 5: Please indicate for each of the following, how important or unimportant you feel it is for drivers…? By all respondents 10
Figure 6: How important or unimportant do you feel the following are for drivers? 2007, 2006 and 2005 11
Figure 7: How important or unimportant do you think it is for drivers to keep within the specified speed limit when…? By all respondents 12
Figure 8: How important or unimportant do you think it is for drivers to keep within the specified speed limit when…? 2007, 2006 and 2005 13
Figure 9: How likely or unlikely are the following factors to affect a person‟s ability to drive safely? By all respondents 15
Figure 10: How likely or unlikely are the following factors to affect a person‟s ability to drive safely? 2007, 2006 and 2005 16
Figure 11: Text comments 2007 – Factors that are likely to affect a person‟s ability to drive safely – substance misuse, health and distractions. 17
Figure 12: Text comments 2007 – Additional factors that are likely to affect a person‟s ability to drive safely. 18
Figure 13: How likely or unlikely are the following to be involved in an accident whilst driving? By all respondents 20
Figure 14: How likely or unlikely are the following to be involved in an accident whilst driving? 2007, 2006 and 2005 21
Figure 15: Text comments 2007 – Likelihood to be involved in an accident - Young People 23
Figure 16: Text comments 2007 – Likelihood to be involved in an accident – Middle Age and Old People 24

Surrey Fire and Rescue Service: Safe Drive, Stay Alive Campaign Survey 2007 Page 39
Figure 17: Text comments 2007 – Likelihood to be involved in an accident – Male and Female 25
Figure 18: Text comments 2007 – Likelihood to be involved in an accident – New and Experienced Drivers 26
Figure 19: To what extent do you agree or disagree that peer pressure can sometimes lead to young people being „egged on‟ to drive more recklessly? By all respondents 27
Figure 20: Do you agree or disagree with the following statements about the Safe Drive event you attended? By all respondents 29
Figure 21: Do you agree or disagree with the following statements about the Safe Drive event you attended? 2007, 2006 and 2005 30
Figure 22: Would you recommend the event to others, and is there anything you think could be done to improve future events? By all respondents 31
Figure 23: Would you recommend the event to others, and is there anything you think could be done to improve future events? 2007, 2006 and 2005 31
Figure 24: Text comments 2007 – Reasons why respondents would recommend the event to others. 32
Figure 25: Text comments 2007 – Reasons why respondents would not recommend the event to others. 34

Surrey Fire and Rescue Service: Safe Drive, Stay Alive Campaign Survey 2007 Page 40
Opinion Research Services The Strand Swansea SA1 1AF Tel: (01792) 535300 Fax: (01792) 535301 Safe Drive, Stay Alive Campaign Survey 2007 Report of Findings for Surrey Fire and Rescue Service
© Copyright 2008 Opinion Research Services