Embed Size (px)
Citation preview
Fundamentals of Technical Analysis and Algorithmic Trading
Chapter 4: Consolidation formation
Saeed EbrahimijamSpring 20102- 2013
Faculty of Business and EconomicsDepartment of Banking and Finance
Doğu Akdeniz Üniversitesi
FINA417

Fundamental of Technical Analysis and Algorithmic Trading
2
Flags Pennants Head and shoulders Symmetrical Triangles
Contents
Fundamental of Technical Analysis and Algorithmic Trading
3
While the share price fast up/down trend stops because of supply and demand equilibrium. In this situation one of three states are expected to happen:
1- Reversal trend 2- prices can decline or rise to a support
level before building up steam again. 3- prices can move sideways, and then
continue it’s previous trend (consolidation formation)
When consolidation forms?
Fundamental of Technical Analysis and Algorithmic Trading
4
Consolidation formations occur when security prices move up or down too fast and reach a level at which the demand or supply that produced the move is completely absorbed.
the temporary oscillation of the price during an up/downward trend which stops
Consolidation formations
Fundamental of Technical Analysis and Algorithmic Trading
5
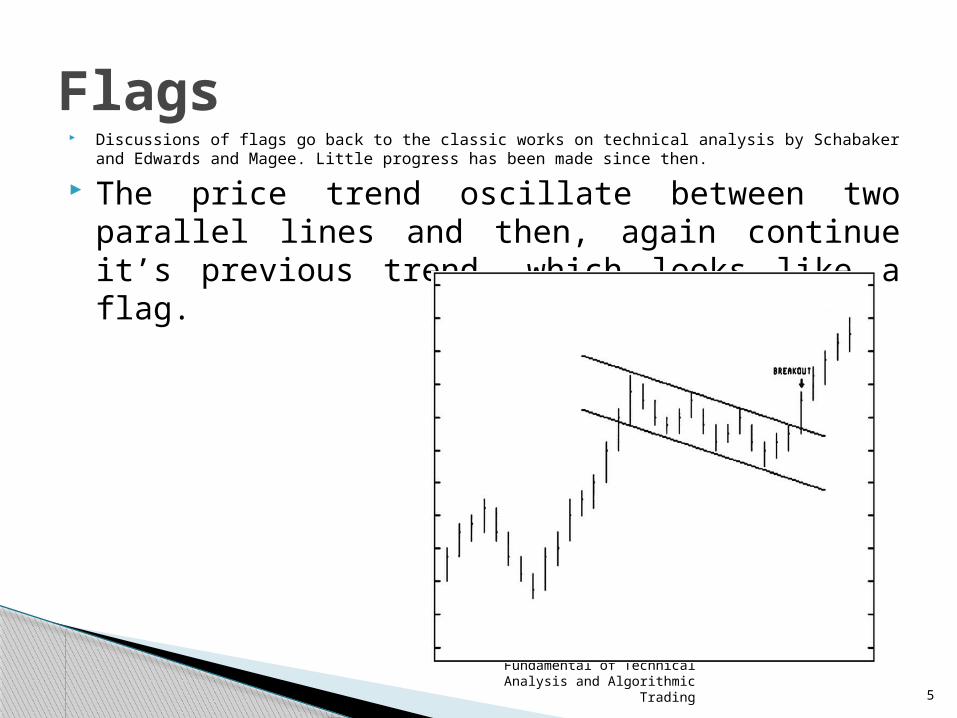
Discussions of flags go back to the classic works on technical analysis by Schabaker and Edwards and Magee. Little progress has been made since then.
The price trend oscillate between two parallel lines and then, again continue it’s previous trend, which looks like a flag.
Flags

Fundamental of Technical Analysis and Algorithmic Trading
6
Flags
Fundamental of Technical Analysis and Algorithmic Trading
7
It represents a pause in a quick, almost vertical, up or down move in prices. Prices move sideways forming a flag like pattern, break out from that pattern, and then continue in the same direction as before.
Typical Price Action A flag pattern,

Fundamental of Technical Analysis and Algorithmic Trading
8
Typical Volume Action Volume is extremely heavy before the flag formation begins. As the pattern develops, volume diminishes to a relatively low level. Finally, volume explodes as prices complete and break out of the flag pattern.
Flags Typical Volume Action Volume

Fundamental of Technical Analysis and Algorithmic Trading
9
Frequency of Occurrence Flags appear regularly on daily charts, but because of the short time they take to develop (typically less than four weeks), they are rarely seen on weekly charts, and are nonexistent on monthly charts.
Frequency of Occurrence Flags
Fundamental of Technical Analysis and Algorithmic Trading
10
typically appear at the halfway point of an up or down move. Therefore, one can expect prices to move about the same distance after the breakout from the flag pattern as they did just prior to the pattern.
Swing traders should learn to identify the flag because it is a highly reliable pattern with very strong profit potential.
Technical Significance Flags
Fundamental of Technical Analysis and Algorithmic Trading
11
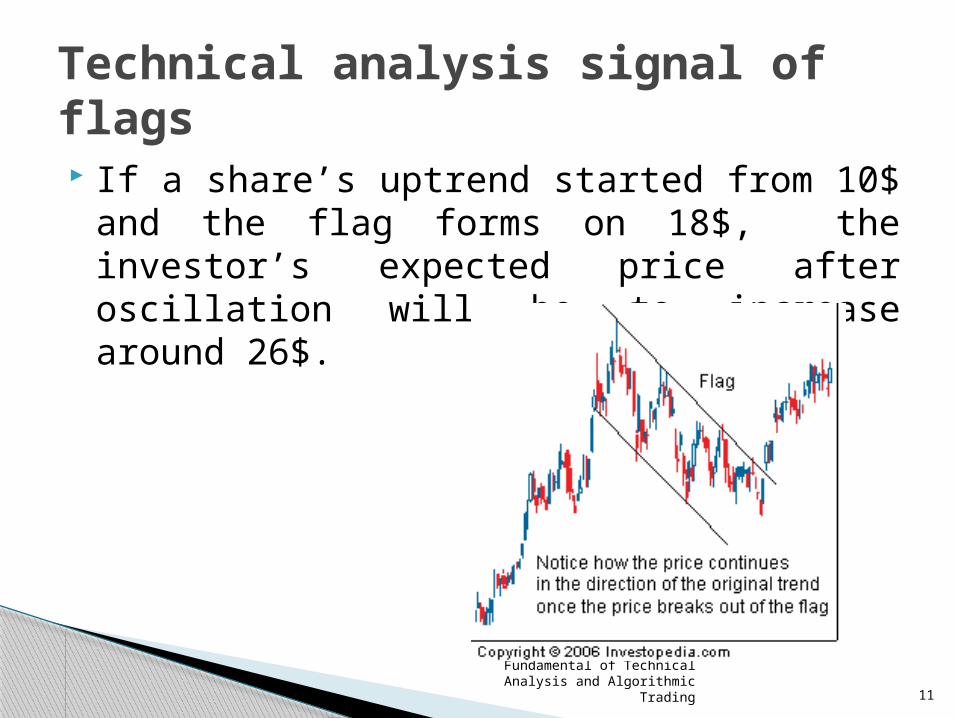
If a share’s uptrend started from 10$ and the flag forms on 18$, the investor’s expected price after oscillation will be to increase around 26$.
Technical analysis signal of flags

Fundamental of Technical Analysis and Algorithmic Trading
12

Fundamental of Technical Analysis and Algorithmic Trading
13
Pennants
Fundamental of Technical Analysis and Algorithmic Trading
14
have the same characteristics of flags, except that a pennant is formed by converging, rather than parallel, boundary lines. Pennants slant down in uptrends and up in downtrends. As with fl ags, pennant consolidations are characteristic of fast up and down moves in prices.
Typical Price Action Pennants

Fundamental of Technical Analysis and Algorithmic Trading
15
Typical Volume Action Volume is extremely heavy before the pennant formation begins. As the pattern develops, volume diminishes to a relatively low level. Finally, volume increases significantly as prices complete and break out of the pennant pattern.
Pennants volume
Fundamental of Technical Analysis and Algorithmic Trading
16
Frequency of Occurrence Pennants should take less than four weeks to complete and
break out. Therefore, like flags, they are more identifiable in daily charts than in weekly charts and never appear on monthly charts. They occur most frequently in the last phase of bull markets and in the second stage of bear markets.
Frequency of Occurrence Pennants

Fundamental of Technical Analysis and Algorithmic Trading
17
typically appear about midway through an up or down move. Therefore, expect prices to move about the same distance after the breakout from the pennant pattern as they did just prior to the pattern appearing.
Technical Significance Pennants

Fundamental of Technical Analysis and Algorithmic Trading
18
Fundamental of Technical Analysis and Algorithmic Trading
19
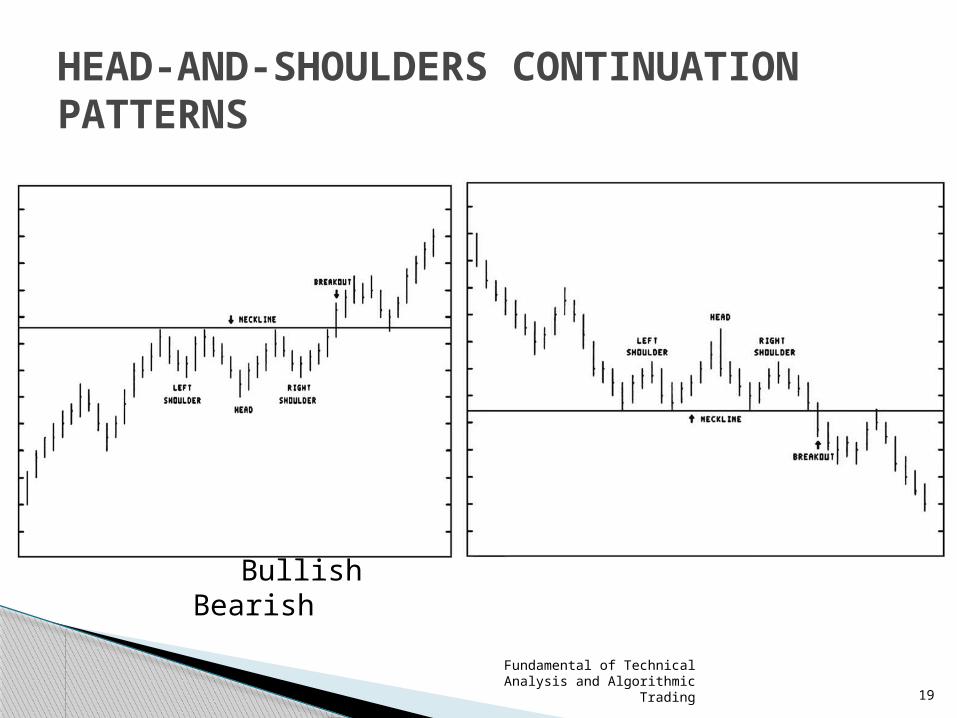
Bullish Bearish
HEAD-AND-SHOULDERS CONTINUATIONPATTERNS
Fundamental of Technical Analysis and Algorithmic Trading
20
Typical Price Action Head-and-shoulders continuation patterns are inverted relative to the direction of the price trend before they appear.
When prices are trending lower, a head-and-shoulders continuation pattern appears similar to a head-and-shoulders top. (Refer to Lesson 3 for a complete description of head-and-shoulders tops and bottoms.)
In an uptrend, a head-and-shoulders continuation pattern appears like a head-and-shoulders bottom.
Typical Price Action Head-and-shoulders continuation patterns

Fundamental of Technical Analysis and Algorithmic Trading
21
volume decreases instead of increasing (as with the head-and-shoulders top) on the left shoulder and head, as well as on the right shoulder. Volume does resemble that of head and- shoulders tops and bottoms on breakout from the continuation patterns; it is relatively heavy.
Typical Volume Action For the head-and-shoulders continuation pattern,
Fundamental of Technical Analysis and Algorithmic Trading
22
Frequency of Occurrence Head-and-shoulders continuation patterns occur occasionally.
Technical Significance The measurement characteristics that apply to head-and shoulders tops and bottoms sometimes work with head-and-shoulders continuation patterns, but not with enough regularity to warrant reliance on them.
Technical significance is limited to notation that prices are continuing an uptrend or downtrend upon a breakout from the head-and-shoulders continuation pattern.
Frequency of Occurrence HS continuation patterns
Fundamental of Technical Analysis and Algorithmic Trading
23
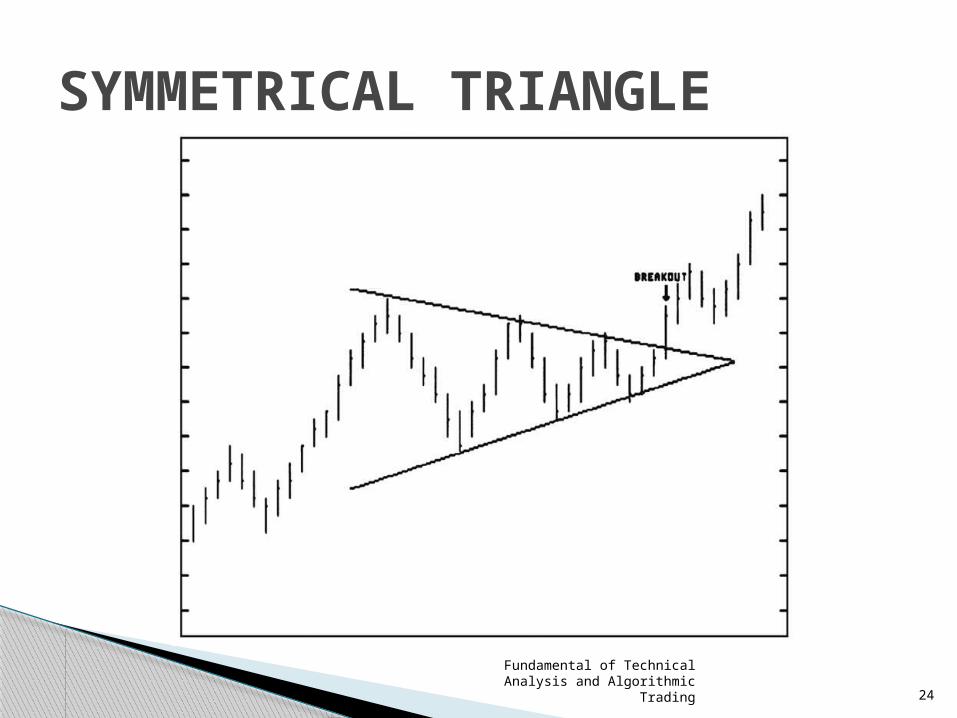
Typical Price Action Prices swing in a narrowing fashion between downslanting upper and upslanting lower boundary lines that are fairly symmetrical. There must be a minimum of four reversal points in the triangle. A breakout can occur at any time between two-thirds of the way to the apex and the apex.
SYMMETRICAL TRIANGLE
Fundamental of Technical Analysis and Algorithmic Trading
24
SYMMETRICAL TRIANGLE
Fundamental of Technical Analysis and Algorithmic Trading
25
Volume diminishes as prices approach the apex of the triangle. On a valid upside breakout, volume is heavy; on a valid downside breakout, volume is often light at first and then picks up significantly after a few days.
Beware of upside breakouts on light volume and downside breakouts accompanied by heavy volume. They could be a warning of false moves. (No break out)
Typical Volume Action
Fundamental of Technical Analysis and Algorithmic Trading
26
Frequency of Occurrence Symmetrical triangles appear regularly on price charts.
Technical Significance On a valid upside breakout, you can expect prices to continue upward until they reach a line drawn parallel to the lower boundary line. The opposite is true for a valid downside breakout.


![Ilch5 12 20102 [Modo De Compatibilidade]](https://img.dokumen.tips/doc/110x75/5487f231b47959e20c8b5620/ilch5-12-20102-modo-de-compatibilidade.jpg)