Embed Size (px)
Citation preview

Fruit and Nut Notes 1 April 2012
SACRAMENTO VALLEY
PRUNE AND ALMOND NEWS
In This Issue:
Prune News Almond News
Crop load assessment and adjustment Nitrogen use efficiency in almonds
When to thin and why Almond pruning wound cankers
Get what you pay for with fertilizers Fungicide efficacy tables
Nickels Field Day – May 3rd
Crop Load Assessment and Adjustment
Bill Krueger, UC Farm Advisor, Glenn County
Richard P. Buchner, UCCE Farm Advisor Tehama County
Matching the crop load with the tree’s ability to size the fruit and achieve the desired fruit
size is the goal. Fruit size at reference date, when the endosperm is visible in 80 to 90%
of the fruit (Figure 1), can be used to estimate fruit dry fruit size at harvest (Table 1.).
Reference date in the Sacramento Valley typically occurs in early May about one week
after the pit tip begins to harden but may be later if cool temperatures persist. At
reference date, a random sample of sound (non-yellow) fruit should be collected and the
number of fruit per pound determined. Sample 20 fruit from 20 trees. Use orchard
history to determine the sizing potential of the block being considered. Unfortunately,
with large crops this procedure may over estimate fruit size. Having a good estimate of
the number of fruit per tree will help avoid this. Estimate the number of fruit per tree by
removing as much of the fruit as possible with a shaker (prune or walnut) from a few representative trees.
Multiple trees will improve accuracy. Three may be a good compromise. Place a tarp under the entire tree
before shaking. The remaining fruit should be removed by hand or estimated. Weigh all the fallen fruit after
removing twigs and leaves. Take a one pound subsample of fallen fruit. Count the sound fruit in that sample,
UCCE Yolo County 70 Cottonwood Street Woodland, CA 95695
530-666-8143 ceyolo.udavis.edu
UCCE Solano County 501 Texas Street,
First Floor Fairfield, CA 94533
707-784-1317 cesolano.ucdavis.edu
Submitted By Carolyn DeBuse
Orchard Systems Farm Advisor Direct 707-784-1320 Cell 530-220-2380
Figure 1. Extracting
endosperm at
reference date.
Fruit and Nut Notes
Serving Solano & Yolo Counties April 2012 - Issue 37

Fruit and Nut Notes 2 April 2012
ignoring any leaves and yellow or shriveled fruit. Multiply the weight of the total fruit removed from the tree
by the sound fruit subsample count per pound to determine the number of sound fruit per tree. Adjust this
number to allow for fruit drop from reference date until harvest to estimate the fruit per tree at harvest. Work
done in the Sutter-Yuba area in the 1970's suggested that approximately 40% of the fruit would drop between
reference date and harvest. More recent work in Glenn and Tehama Counties has suggested that fruit drop may
be closer to 20%. For orchards with an excessive drop history, 40% may be a good estimate but for most
orchards 10 to 20 % is more realistic. For example if the above procedure results in an estimate of 6000 fruit
per tree a drop of 20% would result in 4800 at harvest (6000 X .2 =1200, 6000 -1200=4800).
By dividing the estimated fruit number at
harvest by the estimated or desired dry count
per pound and then multiplying by the
number of trees per acre, you can estimate the
dry pounds per acre (from the example above,
4800/60 count per lb.= 80 lbs./tree X 150
trees/ac. = 12,000 lbs. or 6 tons/ac.) This
number will allow you to judge if the
estimated fruit size at harvest (from Table 1)
is realistic. You can then determine how
many fruit of the desired dry size are
necessary to give the expected dry yield based
on your experience and adjust the number
upward by your estimated drop (ie. 3 dry tons
of 60 count fruit = 6000 lbs/150 trees/ac. = 40
lbs./tree X 60 fruit/lb. = 2400 fruit/tree + 20
% = 2880 fruit desired after thinning). Now
compare the two sets of numbers. If the
number of fruit per tree measured in your
orchard with the estimated drop included
matches the number of fruit per tree at harvest
needed to produce a certain size and tonnage
of fruit with the estimated drop subtracted,
then you don’t need to thin. If the number of
fruit measured in your orchard far exceeds the
needed number of fruit at harvest then you
should thin. For example, if your orchard
trees should carry 2880 fruit to produce a
solid crop of 3 dry tons of 60 count fruit and
your trees have 6,000 fruit/tree at reference
date – regardless of what Table 1 predicts --
you should thin.
Mechanical thinning with the same machinery as is used for harvest can be used to remove the desired amount
of fruit. Shake a tree and, and using the same methodology described above, calculate how much fruit was
removed. Adjust the shaker and repeat the procedure until the desired amount of fruit is removed. Set the shaker
and thin the block. The earlier thinning can be done, the greater effect it will have on fruit size at harvest.
Prune Reference Size Table
Reference Harvest Size (dry) (count/lb)
Size Green Orchard Sizing Potential
(count/lb) Average Good Excellent
50 32 31 30
55 36 34 32
60 39 37 35
65 42 40 38
70 46 43 41
75 49 45 43
80 53 48 46
85 56 51 48
90 60 54 51
95 63 57 54
100 67 60 56
105 70 63 59
110 74 66 61
115 77 68 63
120 81 71 66
125 84 74 68
130 88 77 70
135 92 79 73
140 95 82 75
Table 1. Prune reference date and average harvest dry size table.
Use the reference size fresh count per pound and read across for
orchards with average, good or excellent sizing potential.

Fruit and Nut Notes 3 April 2012
When to Thin and Why Franz Niederholzer, UC Farm Advisor, Colusa/Sutter/Yuba Counties
Shaker thinning of prune trees – when needed – is an essential part of profitable prune growing. Reducing the
number of fruit on a tree (thinning) at the proper timing can increase average fruit size of the remaining crop at
harvest and limit limb breakage and risk of potassium deficiency as the season progresses. But when is the
“proper timing” for thinning? To best answer this question a quick review of how prune fruit grows is needed.
Prune fruit dry weight increases slowly in the spring and takes off in June and July (see Figure 1 below).
However, the biggest, most important changes in fruit growth actually occur in the spring. Fruit growth per unit
weight – fruit growth adjusted for total fruit weight – is most rapid right after petal fall (around 3%) and
decreases steadily until early to mid-May. After mid-May, fruit growth per unit weight is essentially constant
around – 0.2 to 0.3% – until harvest (see Figure 2). [Please note, the fruit growth data in Figures 1 and 2 are
from 2004, a very early season.]
Why is early season fruit growth so important to final fruit weight at harvest? Gains in fruit dry weight early in
the season are amplified later in the season; much like the end value of a savings account, compounded daily, is
influenced by a higher interest rate early in a time interval. An example of this, using a fictitious bank account,
is shown in Figure 3. In that example, a higher interest rate in the first 30 days followed by constant interest
from 31- 150 days produces a bigger final principal than accounts with lower early timing interest rates, even
though all three accounts had the same interest rate for 80% of the time period. This is because early principal
growth is faster with the higher early interest rate. That principal difference is amplified over time after the
interest rate becomes a constant 1%. So, to take this example back to prune orchards, the earlier the fruit is
thinned to allow faster relative growth rates (interest), the sooner the actual fruit weight (the principal) begins to
increase faster and the bigger the fruit at harvest. Once the period of equal fruit growth is reached, usually in
mid to late May for prunes, the chance to improve fruit size by thinning is gone.
So, when is the best time to thin? Thin at reference date if your goal is to improve fruit size. Why then?
Because reference date is the earliest fruit can be removed without excessive shaking and tree damage. Every
day after reference date that you wait to thin reduces the potential for improving fruit size. Reference date is
late in the period of
relatively fast fruit growth
shown in Figure 2. Don’t
delay. Count fruit at or
just after pit hardening so
you are ready to thin – if
needed – at reference date.
Thinning much later than
reference date (after late
May) is OK if you are
only thinning to reduce
tree stress (limb breakage,
potassium deficiency, etc.)
and are not concerned
with increasing fruit size
at harvest.
For details on how to thin,
see the companion article
in this newsletter.
0
1
2
3
4
5
6
7
8
9
0 500 1000 1500 2000Degree-days after bloom
Figure 1. Average fruit dry wt over time 'French' prune trees. 2004
Fru
it d
ry w
eig
ht
April May June July Mar
Fruit and Nut Notes 4 April 2012
0
5
10
15
20
25
30
35
0 500 1000 1500 2000Degree-days after bloom
Figure 2. Fruit growth per unti fruit weight (mg/gm) on 'French' prune trees. 2004
Fru
it r
ela
tive
gro
wth
April May June July Mar
Reference Date, 2004
0
5
10
15
20
25
30
35
40
45
0 50 100 150
Do
llars
Days
Figure 3. Principal growth of three different initial $5 investments with interest rate of 1, 2, or 3% compounded
daily for the first 30 days followed by a constant 1% interest rate compounded daily for an additional 120 days.
1%
2% then 1%
3% then 1%

Fruit and Nut Notes 5 April 2012
Get What You Pay for With Fertilizers Franz Niederholzer, UC Farm Advisor, Colusa/Sutter/Yuba Counties
Costs are up, but the need for fertilizer and other inputs to produce a large, high quality crop remain the same.
Using more efficient materials and practices can help control costs relative to income. However, be careful not
to trim muscle when you are looking to cut out fat. One example of this is in fertilizer materials and rates.
Dried prunes contain roughly 1% potassium (K) and 0.6% nitrogen (N) on a per weight basis. At harvest, a
prune crop can contain 70% of all the potassium in a tree and half the nitrogen. That amounts to the equivalent
of 3+ tons of potassium sulfate and 4+ tons of ammonium sulfate trucked out of a 50 acre orchard in a three dry
ton/acre crop in one year.
To replace this kind of orchard output, substantial amounts of N and K must be available to heavily cropping
prune trees. Potassium is particularly important because of the risk of sunburn and scaffold death following
defoliation due to potassium deficiency. University of California (UC) recommendations for maintenance rates
of K fertilizer include 250-400 lbs of soil applied potassium sulfate/acre/year – depending on irrigation system –
or 100 lbs potassium nitrate/acre/year as a foliar fertilizer. The soil provides significant K, but not enough or at
fast enough rates at certain times of the year to satisfy the needs of a rapidly growing crop while maintaining
leaf health (no deficiency).
The use of reduced potassium application rates from those listed above should be approached very cautiously.
Whether you are considering reducing standard fertilizer rates or using new materials marketed as more
efficient than standard products, be careful not to under fertilize your trees.
Don’t step over a dollar to pick up a dime. For example, a four year UC research study documented that 100 lbs
potassium nitrate/acre/year divided into four to five sprays is as effective in maintaining leaf K levels, fruit size,
and total crop yield as a large maintenance rate of soil applied potassium fertilizer (600 lbs/acre/year potassium
chloride). Replacing a single spray of 20 lb/acre of potassium nitrate (9 lb K2O) with one using one gallon/acre
of 0-0-26 potassium fertilizer (2.9 lbs K2O) reduces the amount of K2O applied in a single spray by 70%. You
would have to repeat the application twice at the same 1 gallon/acre rate -- for a total of 3 applications – to
equal the amount of K2O delivered in a single spray using 20 lb/acre of potassium nitrate. It would take fifteen
(15) applications at a rate of one gallon/acre 0-0-26 liquid material to match the K delivered in 100 lbs/acre
potassium nitrate. You could do it, but I’ll bet it would cost more than the potassium nitrate program. If the 0-
0-26 material (or any other product) is reported to be more efficient than potassium nitrate, check it out in a
small block. Even if the material is more efficient than potassium nitrate, if insufficient K/acre is applied in a
season using the new material, the orchard may become K deficient. You can’t build a 2000 square foot house
with the materials for a 1000 foot house, no matter how good the quality of those materials.
A prune orchard carrying a good crop has high K demands. If enough K doesn’t get into the tree to meet crop K
demands, there is a strong chance of potassium deficiency, leaf drop, small fruit, sunburned limbs and loss of
fruiting wood. New ideas should be considered, but do the math and/or a small test block before committing to
a new nutrient program.
Nitrogen Use Efficiency in Almonds Franz Niederholzer, UCCE Farm Advisor, Colusa/Sutter/Yuba Counties
Nitrogen (N) is a key mineral nutrient in almond production. Nitrogen deficiency reduces kernel yield per acre,
and profitable almond production requires significant N input each year a large crop is set. Nitrogen is also an
environmental contaminant, harmful to both air and water quality.
Efficient N management means matching N inputs (fertilizer, compost, etc.) to orchard N needs through the
season to grow the largest crop in the cleanest way possible. How best to do this? Some practices are known,

Fruit and Nut Notes 6 April 2012
others are the subject of current research. Current work by research teams lead by University of California
Professor Patrick Brown and funded by public (USDA, State of CA) and private (Almond Board of CA,
fertilizer industry) dollars is helping growers and PCA/CCAs get a clearer picture of efficient almond orchard N
management. The study site is a mature, commercial 50% Nonpareil/50% Monterey orchard on Nemaguard
rootstock near Belridge in Kern County. Information on this overall project is available on the web at:
http://ucanr.org/sites/scri/. Click on “Outreach” to see recent presentations and publications on this topic.
For now, growers and PCA/CCAs may want to consider the 4Rs of good nutrient management -- Right
Source, Right Rate, Right Timing and Right Placement – when planning fertilizer use, especially N fertilizer.
Here’s a quick review of these four key factors in nitrogen management in almonds.
Right Source. There a number of N sources available to growers – urea, UAN 32, ammonium sulfate, CAN
17, calcium nitrate as well as composts and organic fertilizers. Liquid materials such as UAN32 and CAN17
are popular. So far, at the Belridge experiment, there has been no difference in yield between equal annual
amounts of N as UAN 32 or CAN17. So, as far as I have seen, material choice is really a function of price per
unit N and local needs. Ammonium sulfate and urea are acid producing, as the ammonium from these materials
is converted to nitrate in the soil. Fertilizer nitrate adds no acid to the soil. Ammonium and urea can be lost as
ammonia gas if applied to the soil surface without rapid (1-2 days, max) incorporation. Nitrate doesn’t
volatilize. Urea and nitrate will move with water during an irrigation event and can be moved below the root
zone with excess water – either from rain or irrigation. Ammonium is less mobile during and shortly after
application – until converted to nitrate. This process usually takes several weeks.
Right Rate. The annual fertilizer rate in a mature, producing orchard is mostly determined by crop size,
although some N is needed to grow new shoots and spurs for future crops. In mature, producing almond trees,
the crop contains the largest percentage of the whole tree nitrogen (and potassium) content. One thousand
pounds of almond kernel yield contains 50-75 pounds of nitrogen, depending on the amount of N supplied to
trees, with higher nut N levels in trees receiving high N rates. A removal rate of 60 lbs N/1000 lb nut meat
yield is suggested by Dr. Brown’s team as the number to use when estimating annual N demand from a crop
load estimate. At the Belridge study site, with excellent irrigation management practices in use, annual
applications of 275 lbs fertilizer N produced 3500-4500 lbs of Nonpareil nut meats/acre in 2009-2011. In those
same years, a higher rate (350 lbs N/acre/year) produced no more nuts, while lower rates (125 or 200 lbs
N/acre/year) produced good crops, but significantly less than the 275 lb N/acre/year rate. Other factors
(weather, summer defoliation, etc.) besides N can limit your production so be sure your applied rate is
appropriate for your crops demand.
Right Timing. Almond nuts and shoots use the most N (80% of annual demand) between bloom and mid-June.
As nut and shoot growth slows, trees use less N in late summer/early fall. Deciduous trees essentially absorb no
N between leaf drop and leaf out. To match fertilizer delivery with tree N use, Dr. Brown’s group recommends
delivering fertilizer N at four different timings and amounts through the season – February or March (20% of
total annual N input), April (30%), June (30%) and September - October (20%). The last application should be
applied as soon as possible postharvest, and potentially skipped if significant leaf loss has occurred at harvest.
Overall, for the best returns and to benefit the environment, Sacramento Valley almond growers should apply
most of their annual fertilizer N input in spring/early summer and do everything possible to limit the amount of
nitrate in the soil as winter -- and the storm season -- approaches.
Right Placement. Fertigation delivers fertilizer to active roots. As long as irrigation is managed to deliver only
needed water, fertigation is a highly efficient method of fertilization. Orchards using flood or solid set sprinkler
irrigation systems should apply fertilizer N in the herbicide strips along the tree row, not as a general broadcast
application. There are more almond tree roots in the tree rows than out in the middles, where competition with
weeds for water and nutrients plus compaction from equipment traffic reduces tree root growth.
Fruit and Nut Notes 7 April 2012
Almond Pruning Wound Cankers Joe Connell, UCCE Farm Advisor, Butte County
Almond pruning wound cankers can become a problem when recent pruning cuts are followed fairly closely by
heavy extended rainfall that spreads fungus spores and creates conditions conducive to infection of the pruning
wounds.
The beginning of January was a great for accomplishing a lot of field work such as pruning first and second leaf
almond trees because conditions were warm and dry. Fieldwork came to a halt on January 19th
when storms
brought heavy rains with over 5 inches of rain falling in the next five days over portions of the Sacramento
Valley. These wet saturated conditions created nearly perfect conditions for the establishment of aerial
phytophthora pruning wound cankers when this rainy period followed freshly made pruning wounds.
Phytophthora syringae was the most common fungus isolated from pruning wound cankers during cool wet
conditions in the early 1980s.
P. syringae is well adapted for growth and development in almond tissue under the common winter conditions
of the Sacramento valley, mild temperatures and high rainfall. In subsequent research, P. syringae was found to
be virulent in branch cankers over a broad range of temperatures from 36o to 68
o F with lower temperatures
resulting in larger cankers. Phytophthora cankers can quickly expand from an infection site at pruning wounds
extending to more than 6 inches within three weeks of infection. As spring progresses, amber colored gum balls
extruding through the bark are frequently seen at the cankers margin.
These cankers die out as temperatures warm during late spring and by June the fungus cannot normally be
isolated. The inability to isolate the fungus later in the season is not surprising since P. syringae will not grow at
80o F or above. This temperature is frequently exceeded during May and June in the central valley.
In subsequent seasons after the cankers have died out and gumming has disappeared, the dead area will appear
as a sunken canker with wound healing occurring from around the canker margins. If these cankers are on larger
wood they may have little impact on the vigor of the branch. If they occur on young trees where competing
scaffolds have been removed or if multiple cankers girdle a larger branch then death of the tree or branch above
the cankers can occur.
Dried gum observed around inactive cankers in June through September can lead to confusion between this
disease and other warm weather canker diseases such as those caused by Ceratocystis fimbriata and
Botryosphaeria dothidea fungi. Both of these fungi have also been documented to occasionally invade pruning
wounds under the right conditions. Cankers caused by these fungi are sometimes slower growing but they can
be perennial cankers that eventually girdle and kill branches. If cankers are on a branch that can be removed by
pruning that is the best way to eliminate the problem. C. fimbriata cankers are usually small diamond shaped
cankers around the pruning wound. B. dothidea cankers have been observed to grow very fast surrounding
pruning wounds made near the crotches of young trees. In recent research, a wide range of fungicide treatments
were applied to B. dothidea trunk cankers and to healthy tree trunks to try and protect them from infection. The
fungicide treatments were not successful in restricting canker size of existing cankers nor did they protect the
healthy trees from new infections during the season when treatments were applied.

Fruit and Nut Notes 8 April 2012
Almond Fungicide Efficacy Tables
2011 Efficacy and Timing of Fungicides, Bactericides, and Biologicals for Deciduous Tree Fruit, Nut,
Strawberry, and Vine Crops (http://ipm.ucdavis.edu)
Jim Adaskaveg, Professor,U C Riverside; Doug Gubler, Extension Plant Pathologist,U C Davis;
Themis Michailides, Plant Pathologist,UC Davis/Kearney Ag Center; and Brent Holtz, Farm Advisor, San Joaquin
County

Fruit and Nut Notes 9 April 2012

Fruit and Nut Notes 10 April 2012

Fruit and Nut Notes 11 April 2012
.
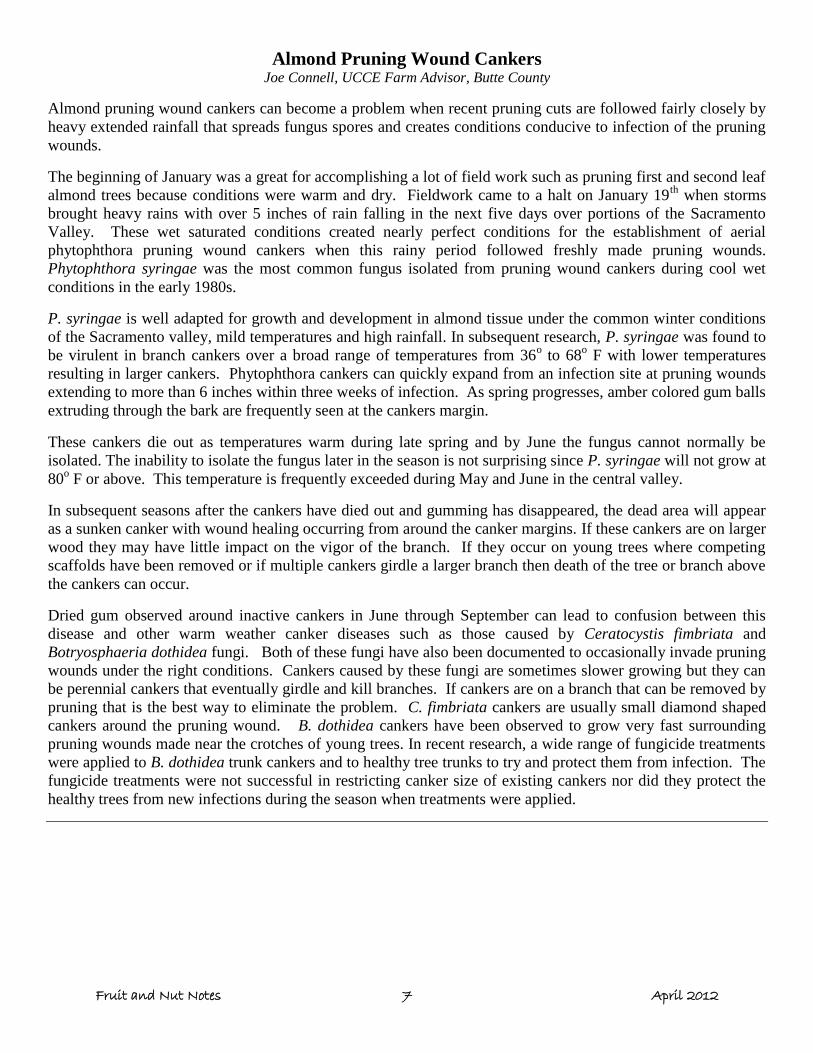
35th Annual Nickels Field Day
Thursday, May 3, 2012
Nickels Soil Lab
Greenbay Avenue, Arbuckle
8:30 a.m. — Registration
Coffee and Danish provided by Farm Credit Services of Colusa-Glenn, ACA
9:00 a.m. — Field Topics:
Hedgerow Chandler walnut pruning trial.
Carolyn DeBuse, UC Farm Advisor, Solano/Yolo Counties
Janine Hasey, UC Farm Advisor, Sutter/Yuba Counties
Howard walnut hedging trial results.
Bruce Lampinen, Extension Specialist, Plant Sciences Department, UC
Davis
Does increasing Nonpareil percentage improve per acre returns?
Joe Connell, UC Farm Advisor and County Director, UCCE Butte Co.
Spraying herbicide in orchard middles.
Brad Hanson, Extension specialist, Plant Sciences Department, UC
Davis
Self-fertile almond varieties.
Tom Gradziel, Professor, Plant Sciences Department, UC Davis
New almond leaf sampling practices.
Sebastian Saa, PhD candidate, Plant Sciences Department, UC Davis
Nonpareil on peach and plum rootstocks.
Bill Krueger, UC Farm Advisor, UCCE Glenn Co.
Introduction to foliar nitrogen sprays in almond.
Franz Niederholzer, UC Farm Advisor, Colusa/Sutter/Yuba Counties
12:15 pm — Lunch by reservation, proceeds to benefit the Pierce FFA Program
Luncheon Speaker - Jeff Sutton, General Manager, Tehama Colusa Canal
Authority.
PCA and CCA credits pending

Fruit and Nut Notes 12 April 2012
Luncheon Reservation Form
Cost: $12.00/person (Prepaid Reservation) $15.00/person at the door Make checks payable to: Arbuckle FFA Mail to: Cooperative Extension P.O. Box 180
Colusa, CA 95932
Name:
Address:
City: State: Zip:
Email: Phone:
Name(s) of Attendees(s):
Total Amount Enclosed: $
Please return this form & your
check by April 27th to receive
the discounted price.
Fruit and Nut Notes 13 April 2012
The University of California prohibits discrimination or harassment of any person on the basis of race, color, national origin, religion, sex, gender identity, pregnancy (including
childbirth, and medical conditions related to pregnancy or childbirth), physical or mental disability, medical condition (cancer-related or genetic characteristics), ancestry, marital status, age,
sexual orientation, citizenship, or status as a covered veteran (covered veterans are special disabled veterans, recently separated veterans, Vietnam era veterans, or any other veterans
who served on active duty during a war or in a campaign or expedition for which a campaign badge has been authorized) in any of its programs or activities. University policy is intended to
be consistent with the provisions of applicable State and Federal laws. Inquiries regarding the University’s nondiscrimination policies may be directed to the Affirmative Action/Staff
Personnel Services Director, University of California, Agriculture and Natural Resources, 300 Lakeside Drive, 6th Floor, Oakland, CA 94612-3550, (510) 987-0096.
Cooperative Extension provides reasonable disability accommodation for those who require such assistance. To make sure your request for accommodation, please call 530-458-0570 at
least two weeks prior to the event.
GREENBAY RD.
To REDDING COLUSA
To YUBA CITY
ARBUCKLE (College City EXIT) Hillgate Ave.
WILLIAMSS
MARINE AVE.
County Line Road
County Line Road EXIT
To Sacramento
Wagner
Wil
dw
oo
d R
d.
2.2
Mil
es
2.3
Mil
es
1
Mil
e
Wil
dw
oo
d R
d.
CA
LIF
OR
NIA
AV
E.
I-5
Road 8
4
N
Nickels Soil Lab