Embed Size (px)
Citation preview
SACLANT RESEA RCI
MEMOUA
SACLANTCEN MEMORANDUM serial no.: SM-255
An analytical study of source localization in shallow
water by matched-field processing of horizontal arrays
D. Abraham
August 1992
The SACLANT Undersea Research Centre provides the Supreme Allied Commander Atlantic (SACLANT) wi th scientific and technical assistance under the terms of i ts N A T O charter, which entered in to force on 1 February 1963. Without prejudice t o this main task - and under the policy direction o f SACLANT - the Centre also renders scientific and technical assistance t o the individual N A T O nations.
Report no. changed (Mar 2006): SM-255-UU
This document is released to a NATO Government a t the direction of SACLANT Undersea Research Centre subject to the following conditions:
The recipient NATO Government agrees to use its best endeavours to ensure that the information herein disclosed, whether or not it bears a secu- rity classification, is not dealt with in any manner ( a ) contrary to the intent, of the provisions of the Charter of the Centre, or (b) prejudicial to the rights of t,he owner thereof to obtain patent , copyright, or other like statutory protection therefor.
If the technica.1 information was originally released to the Centre by a NATO Government subject to restrictions clearly marked on this document the re- cipient NATO Government agrees to use its best en- deavours to abide by the terms of the restrictions so imposed by the releasing Government.
Page count for ShI-2\55 (excluding covers)
Pages
i--vi 1-30
Total
SACLANT Undersea Research Centre Viale San Bartolomeo 400 19138 San Bartolomeo (SP) , Italy
tel: 0187 540 111 fax: 0187 524 600 telex: 271148 SACENT I
N O R T H A T L A N T I C T R E A T Y ORGANIZATION
Report no. changed (Mar 2006): SM-255-UU
An analytical study of source localization in shallow
water by matched-field processing of horizontal arrays
D. Abraham
The content of this document pertains to work performed under Project 02 of the SACLANTCEN Programme of Work. The document has been approved for release by The Director, SACLANTCEN.
Issued by: Systems Research Division
R. Weatherburn Division Chief
Report no. changed (Mar 2006): SM-255-UU

Report no. changed (Mar 2006): SM-255-UU
A n analyt ical s t u d y of source localization i n shallow wa te r by matched-field processing of horizontal a r r ays
D. Abraham
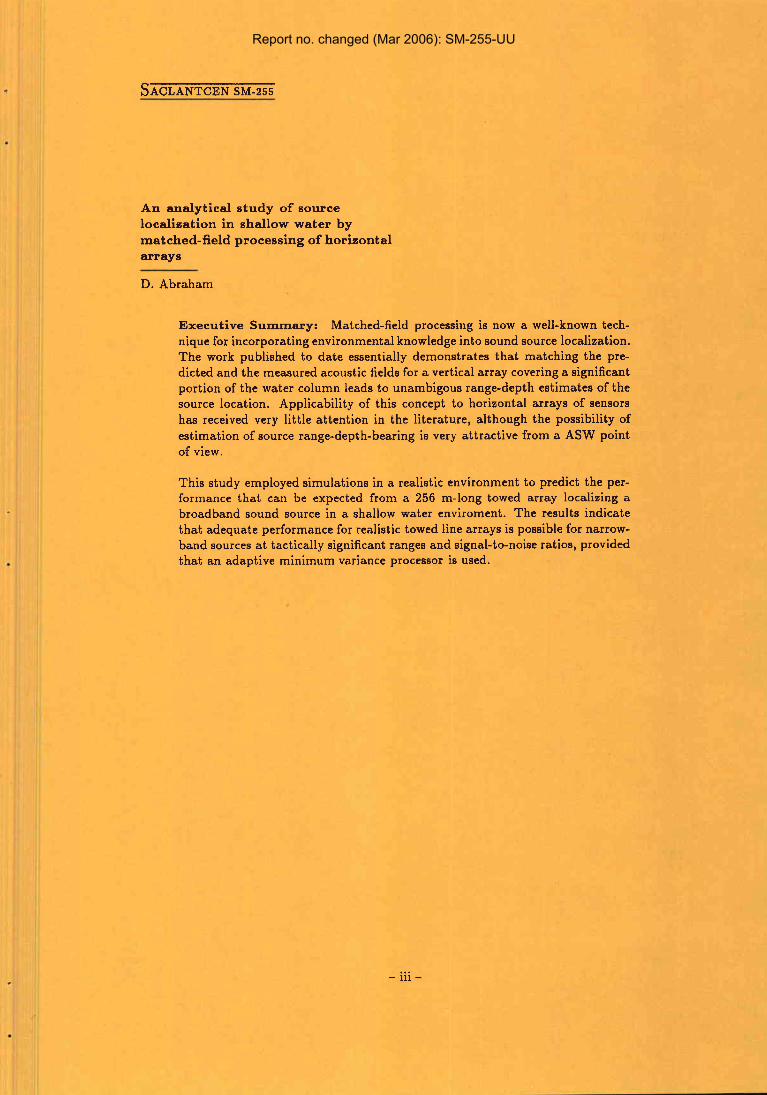
Execut ive Summary: Matched-field processing is now a well-known tech- nique for incorporating environmental knowledge into sound source localization. The work published to date essentially demonstrates that matching the pre- dicted and the measured acoustic fields for a vertical array covering a significant portion of the water column leads to unambigous range-depth estimates of the source location. Applicability of this concept to horizontal arrays of sensors has received very little attention in the literature, although the possibility of estimation of source range-depth-bearing is very attractive from a ASW point of view.
This study employed simulations in a realistic environment to predict the per- formance that can be expected from a 256 m-long towed array localizing a broadband sound source in a shallow water enviroment. The results indicate that adequate performance for realistic towed line arrays is possible for narrow- band sources a t tactically significant ranges and signal-to-noise ratios, provided that an adaptive minimum variance processor is used.
Report no. changed (Mar 2006): SM-255-UU

- ir - intentionally blank page
Report no. changed (Mar 2006): SM-255-UU
A n analyt ical s t u d y of source localization i n shallow water by matched-field processing of horizontal a r rays
D. Abraham
Abstract : Over the last few years a large number of studies have reported re- sults of range-depth localization of sound sources by matched-field processing of vertical arrays in known environments. The performance of matched-field pro- cessing both with and without parameter mismatch has been tested in various types of environments. A few successful results obtained with real data have been reported recently and, from an ASW point of view, there is an obvious interest in extending such methods to horizontal arrays.
This report focuses on the evaluation of the feasibility of matched-field process- ing for source localization using horizontal arrays, under different array, source and frequency processing conditions. The acoustic sound field was simulated using the SACLANTCEN normal mode propagation model (SNAP) in a realis- tic shallow water environment in a no mismatch condition. The results of this study indicate that adequate performance of the minimum-variance matched- field processor can be obtained for realistic array systems and frequencies for sources at bearings from 45' to endfire a t tactically significant source ranges and strengths.
Keywords: horizontal arrays o matched-field processing o range-depth localization o shallow water
Report no. changed (Mar 2006): SM-255-UU
Contents
1 . Introduction . . . . . . . . . . . . . . . . . . . . . . . . . . . . . . . . . . . 1 . . . . . . . . . . . . . . . . . . . . . . . . . . . 2 The matched-field processor 3
. . . . . . . . . . . . . . . 2.1. Bartlett and minimum variance processors 4 . . . . . . . . . . . . . . . . . . . . 2.2. Array/source position description 5
2.3. Propagation model . . . . . . . . . . . . . . . . . . . . . . . . . . . . . 6 . . . . . . . . . . . . . . . . . . . . . . . . . . . . . . . . . . . 3 Basic scenario 7
. . . . . . . . . . . . . . . . . . . . . . . . 3.1. Array/source configuration 7 . . . . . . . . . . . . . . . . . . . . . . . . . 3.2. Environment description 8
. . . . . . . . . . . . . . . . . . . . . . . . . . . 3.3. Frequency processing 9 4 . Simulation results . . . . . . . . . . . . . . . . . . . . . . . . . . . . . . . 11
4.1. Metrics used for comparison . . . . . . . . . . . . . . . . . . . . . . 12 4.2. Canonical case results . . . . . . . . . . . . . . . . . . . . . . . . . . 13 4.3. Performance based on array configuration . . . . . . . . . . . . . . 13 4 . 4 . Performance based on frequency processing . . . . . . . . . . . . . 18 4.5. Performance based on source position . . . . . . . . . . . . . . . . . 20
5 . Conclusions . . . . . . . . . . . . . . . . . . . . . . . . . . . . . . . . . . 28
. . . . . . . . . . . . . . . . . . . . . . . . . . . . . . . . . . . . . References 30
Acknowledgements: This study was completed under the support of the Summer Assistant Programme. I wish to thank the Centre for providing me the opportunity to participate in this programme . I wish also to thank Dr S . Jesus and Dr D . Gingras for the considerable insight and guidance they provided during the conduct of this study .
Report no. changed (Mar 2006): SM-255-UU
Introduction
The concept of including environment specific information in the passive localization of a sound source in the ocean by the use of matched-field processing has been viewed from several perspectives. The method involves the generation of a replica of the acoustic field based on a numerical model describing the propagation effects between a sound source and an array of sensors. The received array sensor data is then bearnformed with the replica field for a series of possible source range-depth positions, yielding an ambiguity surface over the source location parameters. If the replica field correctly represents the propagation effects then the peak of the ambiguity surface is at the location of the source. Inaccurate environment or array position information causes what is known as a mismatch between the replica and received field where the propagation effects are not correctly represented by the replica field. Most of the current literature can be described as either evaluating the processor performance for various environment or system parameters, for error or mismatch between the true and measured environment or system parameters, both through simulation of the received acoustic field, or as applied to real data. References [I-81 provide a small sample of some of the existing literature. Most of the analysis concentrates on line arrays of sensors sampling the ocean vertically in the water column for narrowband sources. Some papers mention or examine line arrays that are placed horizontally in the ocean such as Klernrn [4] where horizontal and vertical line arrays are compared in terms of depth and range localization and the influence of surface fluctuations examined, Heitmeyer et al. [5] where arrays are examined for localization as a function of the tilt, and Ozard [6] where source localization using real data from a fixed horizontal array was performed. Another paper of interest is that of Baggeroer e l al. [I] where matched-field processing of broadband signals is considered.
The intent of this memorandum is to explore the performance of narrowband and broadband matched-field processing on an horizontal array for passive source local- ization in range and depth for a fixed bearing. In practice plane-wave beamforming would be used to isolate a bearing that contained energy and be of interest to per- form matched-field processing for passive range and depth source localization. The analysis will be performed using a simulated array received acoustic field. Both the replica and received acoustic fields are generated using SNAP, the Centre's normal mode model [9], so there exists no mismatch between the replica field and the field received by the array. In a practical sense this is not a realistic assumption since the model only attempts to approximate the actual propagation effects and also because system parameters such as the array sensor position and depth and envi-
Report no. changed (Mar 2006): SM-255-UU
ronrnental parameters such as sound speed, water depth, and bottom characteristics are not always known accurately. This memorandum focuses on evaluating under which array, source, and frequency processing conditions matched-field processing is feasible for source localization using an horizontal array. In comparison to re- cent publications evaluating matched-field processing of horizontal arrays [4-61 for source localization, this analysis evaluates statistical metrics formed from ambiguity surfaces for an extensive set of system and source parameters for narrowband and broadband signals.
Under the no mismatch assumption the peak of the ambiguity surface is correctly located at the position of the source. The quality of the ambiguity surface as a source localizer may be corrupted due to very high sidelobes. In order to quantify the performance of the matched-field processor as a source localizer the following two metrics similar to those of Feuillade e l al. [7] are used: the peak-to-highest side- lobe (PSL) and peak-to-mean background level (PBL) ratios. These metrics provide a means for comparing the performance of the matched-field processors for source localization as system and source parameters are varied. Contour plots of the range- depth ambiguity surface are also used to illustrate certain cases. This memorandum considers two types of processing methods: the Bartlett (BART) or conventional processor and the Minimum Variance Distortionless Response (MVDR) processor. The matched-field processor (MFP) performance (the PSL and PBL metrics) using the BART and MVDR processors is evaluated for changes in system parameters such as: array tilt, sensor spacing, and number of sensors; frequency processing pa- rameters such as: center frequency, and bandwidth; and source parameters such as: range, depth, bearing, and signal-to-noise ratio. For each case this is carried out for a narrowband and two broadband signals. The broadband signals are incoherently averaged in a geometric (decibel) fashion as suggested by Baggeroer et al. [I].
The memorandum is organized as follows: Sect. 2 includes background on matched- field processing, the two processing methods that are evaluated as MFPs, the defini- tion of the positioning of the array and source, and a description of the propagation model used for the simulation. Section 3 discusses the canonical case of the ar- ray, source, environment, and frequency processing. Section 4 describes the metrics used for comparisons and also the performance of the MFPs as system and source parameters are changed from the basic configuration described in Sect. 3. Finally conclusions are drawn describing the results of the performance analysis over the various system and source parameters.
Report no. changed (Mar 2006): SM-255-UU
The matched-field processor
A matched-field processor assumes that under certain conditions the complex nar- rowband pressure received at a sensor due to a point source at a particular range, depth, and bearing may be predicted by the use of a mathematical model. The set of predicted pressures at an array of sensors is formed into a vector and utilized as the expected response vector (in this case called a replica vector) familiar to many array signal processing methods.
The replica vector is used to form an ambiguity surface in range and depth for a fmed bearing. When the replica field used in the processing is a correct repre- sentation of the propagation effects, the peak of the ambiguity surface is at the position in range and depth of the source. The no mismatch assumption is equiv- alent to perfect knowledge of the environment and system parameters. The intent of this memorandum is to evaluate the performance of the MFPs for horizontal and near horizontal arrays with perfect environment and system knowledge. It is well established that performance will degrade when there is environmental or system parameter mismatch [8].
The matched-field processor is implemented as the vector inner product between a processor weight vector, W(T, d, 4, f ), and a frequency data vector, x( f). The frequency data vector is obtained through a Discrete Fourier Transform (DFT) of the time sampled array sensor data, where each element of the single frequency data vector represents one sensor's output. The result is the random ambiguity surface
evaluated at range T , depth d, bearing 4 and frequency f , specified by the weight vector. Throughout this memorandum the superscript H denotes the complex con- jugate transpose operation, bold lowercase letters denote vectors and bold uppercase letters denote matrices.
The frequency data vector is modelled as a complex Gaussian, zero mean random vector with covariance matrix R( f ). The mean MFP output for a &ed or deter- ministic weight vector is thus
Report no. changed (Mar 2006): SM-255-UU
It is this mean ambiguity surface that is evaluated for the peak-to-highest side- lobe and peak-to-mean background level metrics and for the contour plots of the ambiguity surface as described in Subsect. 4.1.
2.1. B A R T L E T T AND MINIMUM VARIANCE PROCESSORS This memorandum focuses on the conventional or Bartlett (BART) processor which is a robust non-adaptive beamformer and also on the higher resolution adaptive Minimum Variance Distortionless Response (MVDR) processor.
The Bartlett processor has a weight vector of the form
where T, d, 4, and f are respectively the range, depth, bearing, and frequency of a hypothesised source and p(r, d, 4, f ) is the replica vector corresponding to these source parameters. The BART weight vector does not require any information about the signals and noise impinging on the array.
The Minimum Variance Distortionless Response processor has weight vector
where P(T, d, 4, f ) is the replica vector and R( f ) is the covariance matrix of the data at frequency f . If the covariance matrix is known this processor minimizes the variance of the output while constraining the output due to a source described by the replica vector p(r, d, 4, f ) to be distortionless. If the covariance matrix is not known it must be estimated from the data causing a degradation in performance. The MVDR processor is an adaptive processor because of its dependence on the covariance matrix of the signals and noise impinging on the array.
For broadband processing, each frequency data vector is processed separately using BART or MVDR MFPs and then averaged geometrically in frequency as suggested by Baggeroer et al. [I]. Under common assumptions of long observation sequences it can be assumed that the frequency data vectors are independent of each other [lo].
The metrics of comparison are applied to the expected ambiguity surfaces of Eq. (2). Assuming a fixed weight vector it is easily seen that the expectation (with respect to the frequency data vectors) of geometrically averaged random ambiguity surfaces of different frequencies (Eq. (1)) is proportional to the geometric average of the expected ambiguity surfaces,
Report no. changed (Mar 2006): SM-255-UU
where Armd(r, d, 4, f;) is the random ambiguity surface for frequency f; and Nf is the number of frequencies being averaged. It can also be shown (via results of [ll]) that if the Maximum Likelihood Estimate (MLE) of the covariance matrix is used in the MVDR processor, the ensemble average of the broadband (geometrically averaged in frequency) ambiguity surface is proportional to that of the MVDR processor when the covariance matrix is known perfectly. The results of this study are then equally valid for the MVDR processor when the MLE of the covariance matrix is used. Independence of the frequency data vectors used to estimate the covariance matrices and those being processed is required for the validity of this result.
2.2. ARRAY/SOURCE POSITION DESCRIPTION
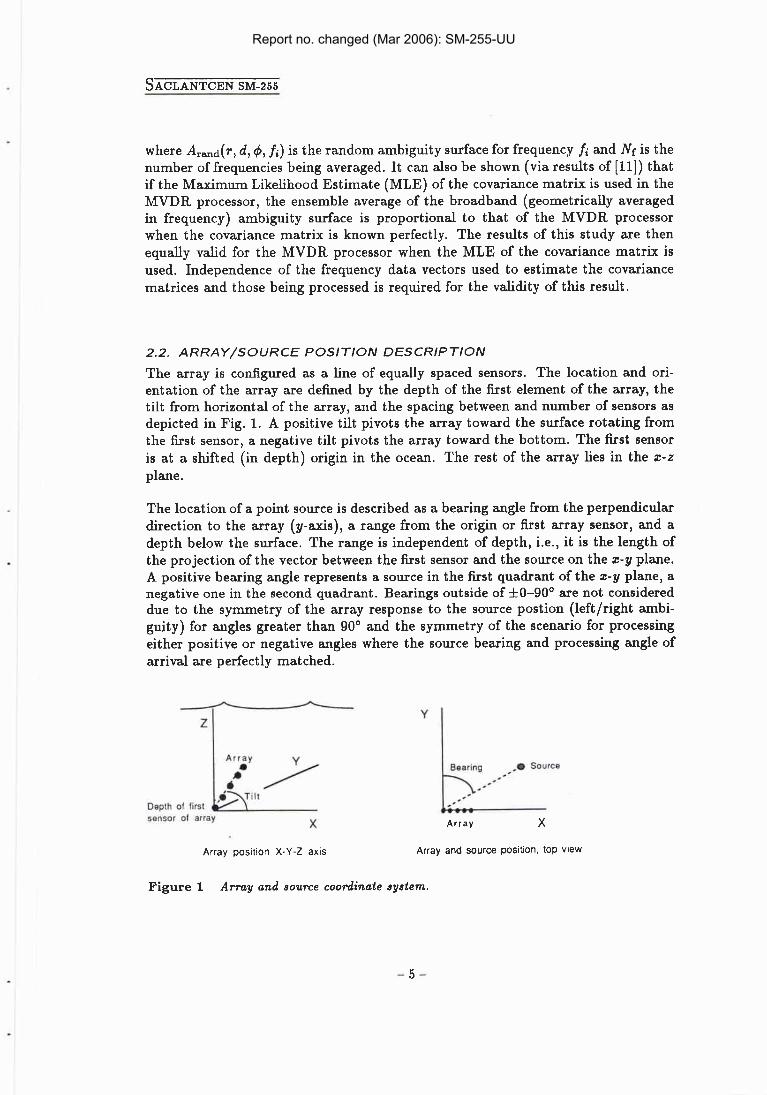
The array is configured as a line of equally spaced sensors. The location and ori- entation of the array are defined by the depth of the f i s t element of the array, the tilt from horizontal of the array, and the spacing between and number of sensors as depicted in Fig. 1. A positive tilt pivots the array toward the surface rotating from the f i s t sensor, a negative tilt pivots the array toward the bottom. The first sensor is at a shifted (in depth) origin in the ocean. The rest of the array lies in the x-z plane.
The location of a point source is described as a bearing angle from the perpendicular direction to the array (y-axis), a range from the origin or first array sensor, and a depth below the surface. The range is independent of depth, i.e., it is the length of the projection of the vector between the f i s t sensor and the source on the x- y plane. A positive bearing angle represents a source in the first quadrant of the 2-y plane, a negative one in the second quadrant. Bearings outside of f 0-90" are not considered due to the symmetry of the array response to the source postion (leftlright arnbi- guity) for angles greater than 90" and the symmetry of the scenario for processing either positive or negative angles where the source bearing and processing angle of arrival are perfectly matched.
sensor 01 array X
Array pos~tion X-Y-Z axis
Array
Array and source position, top view
Figure 1 Array and source coordinate system.
Report no. changed (Mar 2006): SM-255-UU
2.3. PROPAGATION MODEL
A model approximating the propagation effects due to the medium is used to com- pute the replica vector of complex pressures. The range independent SNAP normal mode model developed by Jensen and Ferla [9] is used in this study. According to SNAP the ocean is assumed to be modelled as three layers: the water column, a sediment layer and a semi-infinite subbottom. The model utilizes information about the ocean environment such as the sound speed, density, and compressional wave attenuation for the various layers. The water column and sediment layer can have varying sound speeds where the subbottom has depth independent properties.
The pressure at an array sensor at a depth d due to a point monochromatic sound source at range, TO, and depth, do, is defined by
where w is the radial frequency, p is the density of the water column, M is the number of modes, and urn, k,, and a, are respectively the mth mode amplitude function, wavenumber, and attenuation coefficient.
Both the replica vectors used in the matched-field processing and the source covari- ance matrices of the simulated array data vectors are created using this model so there is no mismatch involved in this simulation.
Report no. changed (Mar 2006): SM-255-UU
Basic scenario
In all cases in Sect. 4 (except where noted otherwise) the PSL and PBL metrics have been computed for the array at several depths and then averaged. This was done to provide an average metric and because the performance did not vary considerably over array depth. The environment is representative of an area north of the island of Elba in the Ligurian Sea with a winter sound-speed profile. Considering the performance of the horizontal array under other environments, i.e., other sound- speed profiles, bottom characteristics, and deep-water cases, may be the subject of further study. The ambiguity surface contour plots are not averaged over array depth.
3.1. ARRAY/SOURCE CONFIGURATION
The canonical horizontal array has 64 sensors equally spaced at 4 m distance at a depth of 60 m (yielding zero tilt). The averaging of the PSL and PBL metrics over array depth is performed for the depths of 10-110 m in 10 m increments for all cases except the array tilt (which for some tilts would cause the array to be out of the water or deep into the bottom). The array depth averaging for the array tilt parameter variation is performed from 30-90 m depth at 5 m spacing.
The canonical vertical array also has 64 sensors spaced at 1.8 m distance with the deepest sensor at 119 m depth. This vertical array spans almost all of the water column.
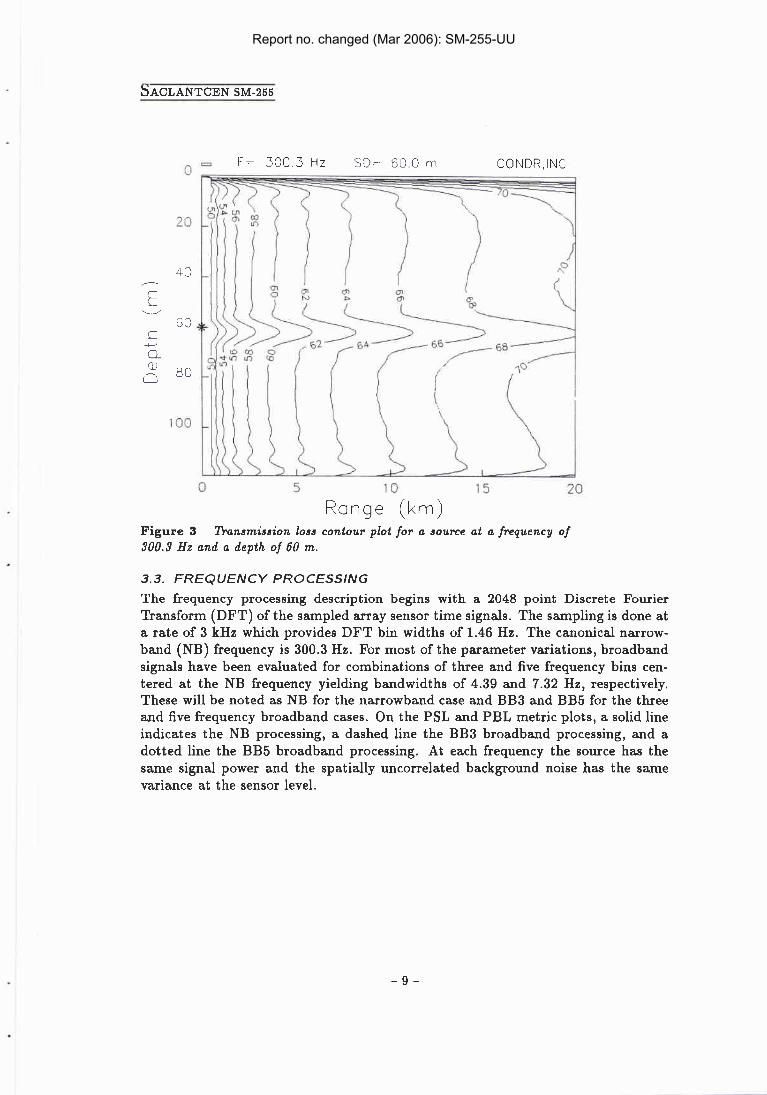
The source is placed at a range of 10 km, a depth of 60 m, a bearing of 90' (endfire) and a strength of 0 dB relative to the background uncorrelated noise at the sensor level. Based on the transmission loss at 300.3 Hz (which can be found in Fig. 3), this would be approximately equivalent to a 64 dB level relative to the background noise at the location of the source.
In all cases the source is placed in spatially uncorrelated background noise. This causes the covariance matrix of the received array data vectors to be of the form
where so( f ) is the source power, p(ro, do, 40, f ) is the normalized replica vector for a point source at the given range, depth, bearing and frequency, u2(f) is the variance
Report no. changed (Mar 2006): SM-255-UU
of the uncorrelated background noise, and I is the identity matrix. The replica vector is normalized so that its norm is equal to f i,
~ ( 7 , d, 4, f ) H ~ ( r , d, 4, f 1 = N ,
where N is the number of sensors.
3.2. ENVIRONMENT DESCRIPTION
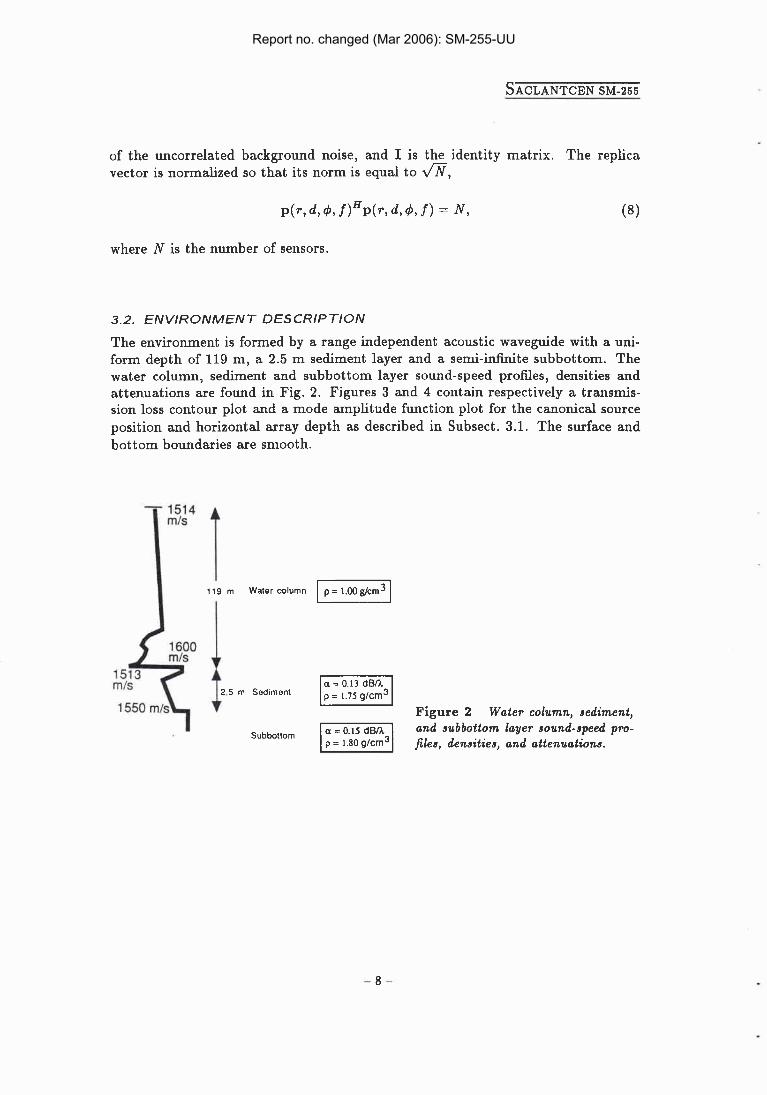
The environment is formed by a range independent acoustic waveguide with a uni- form depth of 119 m, a 2.5 m sediment layer and a semi-infinite subbottom. The water column, sediment and subbottom layer sound-speed profiles, densities and attenuations are found in Fig. 2. Figures 3 and 4 contain respectively a transmis- sion loss contour plot and a mode amplitude function plot for the canonical source position and horizontal array depth as described in Subsect. 3.1. The surface and bottom boundaries are smooth.
i 19 m Water column
2.5 m Sediment I Subbottom
Figure 2 Water column, sediment, and subbottom layer sound-speed pm- files, densities, and attenuations.
Report no. changed (Mar 2006): SM-255-UU
5 10 15 20 Range (km)
Figure 3 Transmission loss contour plot for a source at a frequency of 300.3 Hz and a depth of 60 m.
3.3. FREQUENCY PROCESSING The frequency processing description begins with a 2048 point Discrete Fourier Transform (DFT) of the sampled array sensor time signals. The sampling is done at a rate of 3 kHz which provides DFT bin widths of 1.46 Hz. The canonical narrow- band (NB) frequency is 300.3 Hz. For most of the parameter variations, broadband signals have been evaluated for combinations of three and five frequency bins cen- tered at the NB frequency yielding bandwidths of 4.39 and 7.32 Hz, respectively. These will be noted as NB for the narrowband case and BB3 and BB5 for the three and five frequency broadband cases. On the PSL and PBL metric plots, a solid line indicates the NB processing, a dashed line the BB3 broadband processing, and a dotted line the BB5 broadband processing. At each frequency the source has the same signal power and the spatially uncorrelated background noise has the same variance at the sensor level.
Report no. changed (Mar 2006): SM-255-UU
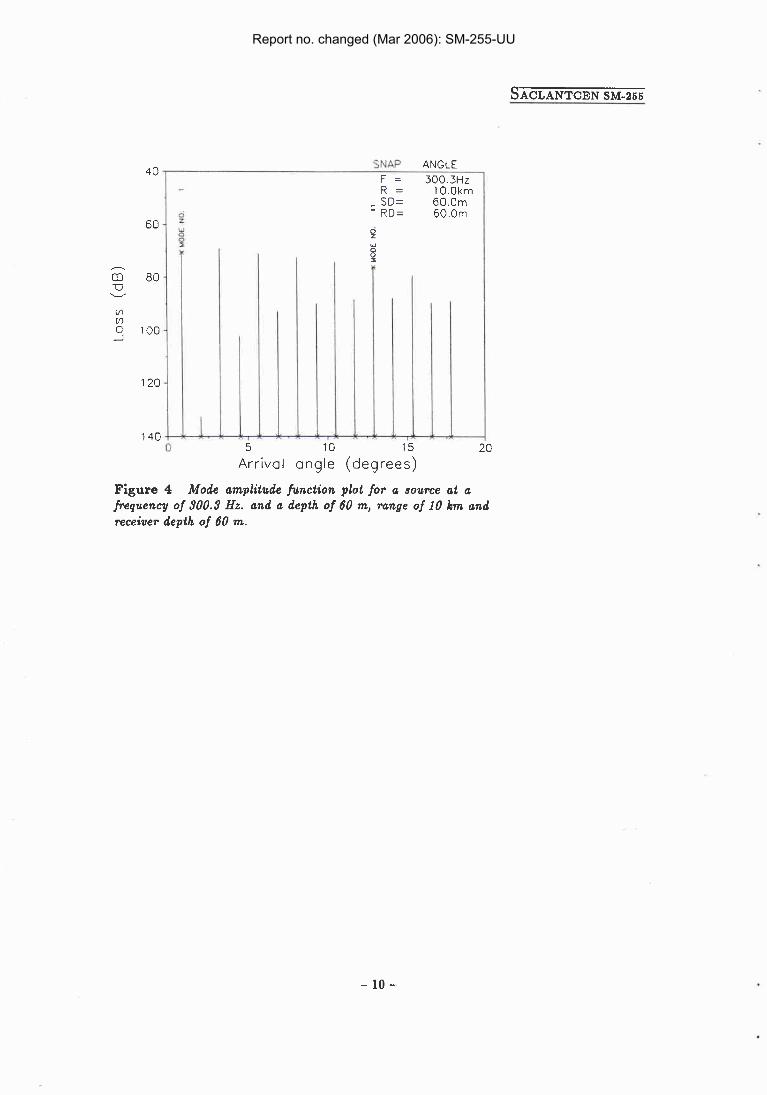
Figure 4 Mode amplitude function plot for a aovrce at a frequency of 300.3 Hz. and a depth of 60 m, range of 10 km and receiver depth of 60 m.
Report no. changed (Mar 2006): SM-255-UU
Sim ulation results
The use of matched-field processing of an array of sensors for the purpose of source localization forces many considerations on the construction of the array and the type of signal processing. The simulations in this section vary array and frequency sig- nal processing parameters in order to show their effect on performance and indicate their value in the construction us performance trade-off issue. For the plane-wave beamformer the performance as a function of array and frequency processing param- eters is well understood. For matched-field processing these issues are not as well understood because the actual propagation characteristics of the channel enter into the performance analysis. The results provided here apply primarily to the specific shallow-water environment discussed in Subsect. 3.2.
Source localization is viewed here as a function of range and depth for a fixed bearing. The performance of matched-field processing of an horizontal array as these source parameters (range, depth, bearing and strength) are varied is considered to determine under what conditions localization is possible and if they are tactically significant.
In the following sections the peak-to-highest sidelobe and peak-to-mean background level metrics, as described in Subsect. 4.1, are evaluated as a function of system and source parameters. The results for the canonical case are shown in Subsect. 4.2. System and source parameters are varied and described as follows: the number of sensors in the array, sensor spacing, and array tilt are varied in Subsect. 4.3, the center frequency and the bandwidth of the source signal and processing are varied in Subsect. 4.4, and the source range, depth, bearing, and strength are varied in Subsect. 4.5. In each case only one parameter is varied holding all others fixed. This is to isolate the effect each parameter has on the performance of the MF3s as source localizer. These variations are evaluated for a narrowband (NB) and the two broadband (BB3 and BB5) cases as described in Subsect. 3.3. In discussing the canonical case results and in several other illustrative cases, the ambiguity surfaces for the BART and MVDR processors are shown so that the significance of the PSL and PBL metrics can be seen.
Report no. changed (Mar 2006): SM-255-UU
4.1. METRICS USED F O R COMPARISON
The ambiguity surface of an MFP (narrowband or broadband), under no mismatch, has a peak at the location of the source. When the spatial field is poorly sampled (as with an horizontal array) the sidelobes that appear in the ambiguity surface become nearly as large as the main peak. This causes false detections of sources in positions other than that of the true source and also may hide the peak belonging to the true source. The fist metric, the peak- to-next highest sidelobe ratio (PSL), addresses this problem. The PSL is defined as
AP PSL = -, ASL
where Ap is the value of the peak of the ambiguity surface and ASL is the value of the highest sidelobe.
The second metric is used to describe the difference between the peak level and the average background level which provides some indication of the probability of detecting the source. The peak-to-mean background level (PBL) metric is defined as
AP PBL = -, A,
where A, is the mean of the points in the ambiguity surface outside of 3 dB below the peak value. The mean value is taken on the linear values of the ambiguity surface and not on the decibel values. This metric combined with the PSL metric indicates how well the source is resolved from the sidelobes and the average background level.
The ambiguity surfaces are also shown for selected cases to show the relevance of the above metrics which are the primary means of comparison and also to illustrate the improvement that can be obtained by fortuitous array and frequency-processing parameters.
For a fixed bearing the ambiguity surface varies in range and depth. In this study the range-depth grid was from 0 to 20 km range in 0.5 km increments and from 0 to 120 m depth in 3 m increments. The PSL and PBL metrics are computed with respect to this 40-by-40 point grid in range and depth.
If the source position did not fall exactly at one of the grid points being evaluated it may not yield the highest peak. In all cases of this study the source was placed at the exact position of one of the grid points. This was done to avoid the mismatch caused by an offset of the source. In the same vein, the PSL and PBL metrics will vary slightly based on the grid sampling of the ambiguity surface.
Report no. changed (Mar 2006): SM-255-UU
4.2. CANONICAL CASE RESULTS
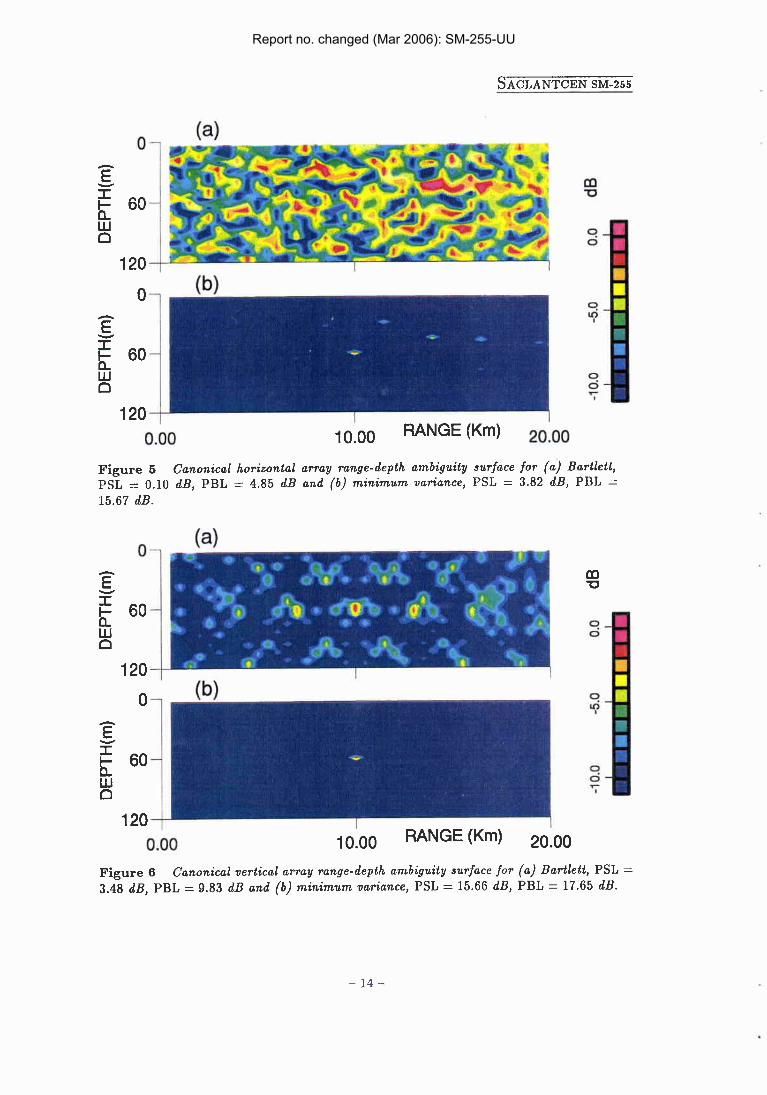
The canonical case for the horizontal array consists of the array positioned as follows: first sensor at 60.0 m depth, 64 sensors spaced at 4.0 m distance and a tilt of 0' from horizontal. The source is at a bearing of 90.0' from broadside to the array, at a range of 10.0 km from the first sensor of the array and at a depth of 60.0 m. The source and array are respectively generating and processing a narrowband signal at 300.3 Hz. The results are shown in Fig. 5 which contains the ambiguity surface for the narrowband results and the PSL and PBL metrics. The BART ambiguity surface exhibits several very large sidelobes (the highest is only 0.10 dB below the peak). Noting that the dynamic range of the contour plots is 10 dB, it is seen that very few sidelobes are within 10 dB of the peak in the MVDR ambiguity surface. This can also be seen from the PBL = 15.67 dB for the MVDR case.
The canonical case for the vertical array consists of the first sensor of the array at 119.0 m depth, 64 sensors spaced at 1.8 m distance, and an array tilt of 90.0' which constitutes a vertical array. The source is at the same range and depth as the canonical horizontal array, the bearing is now irrelevant assuming that the sensors are omnidirectional. The BART and MVDR ambiguity surfaces are depicted in Fig. 6. Note the considerable improvement in the PSL, PBL, and ambiguity surface for the BART processor over the horizontal-array case. The vertical array ambiguity surface exhibits strong sidelobes at the same depth as the source but straddling it in range. This is typical of MFPs as noted by Hamson and Heitmeyer [3]. The sidelobes straddling the source in range also exist in the MVDR ambiguity surface but are more than 10 dB below the peak value which is outside of the dynamic range of Fig. 6. According to the PSL and PBL metrics and the ambiguity surfaces, the vertical array and the MVDR processing of the canonical horizontal array have good performance in terms of localizing the source in range and depth. The BART processing of the canonical horizontal array has a low PSL ratio which would lead to problems in false source detections at the sidelobe locations.
4.3. PERFORMANCE BASED O N ARRAY CONFIGURATION
There often exist trade-offs between the configuration of an array and its perfor mance. This section considers the performance of an array for different configura- tions so that the importance of different array characteristics may be judged. The effect of changes in the number of sensors is discussed in Subsubsect. 4.3.1, sensor spacing in Subsubsect. 4.3.2, and the horizontal array tilt in Subsubsect. 4.3.3.
Report no. changed (Mar 2006): SM-255-UU
Report no. changed (Mar 2006): SM-255-UU
MVDR
...- 6 -
. I ) .od ..ee
20 60
Number of sensors C
BART d Of senso"
MVDR 4
.., 15 I-
n
- 20 40 60 20 40 60
Number of sensors Number of sensors
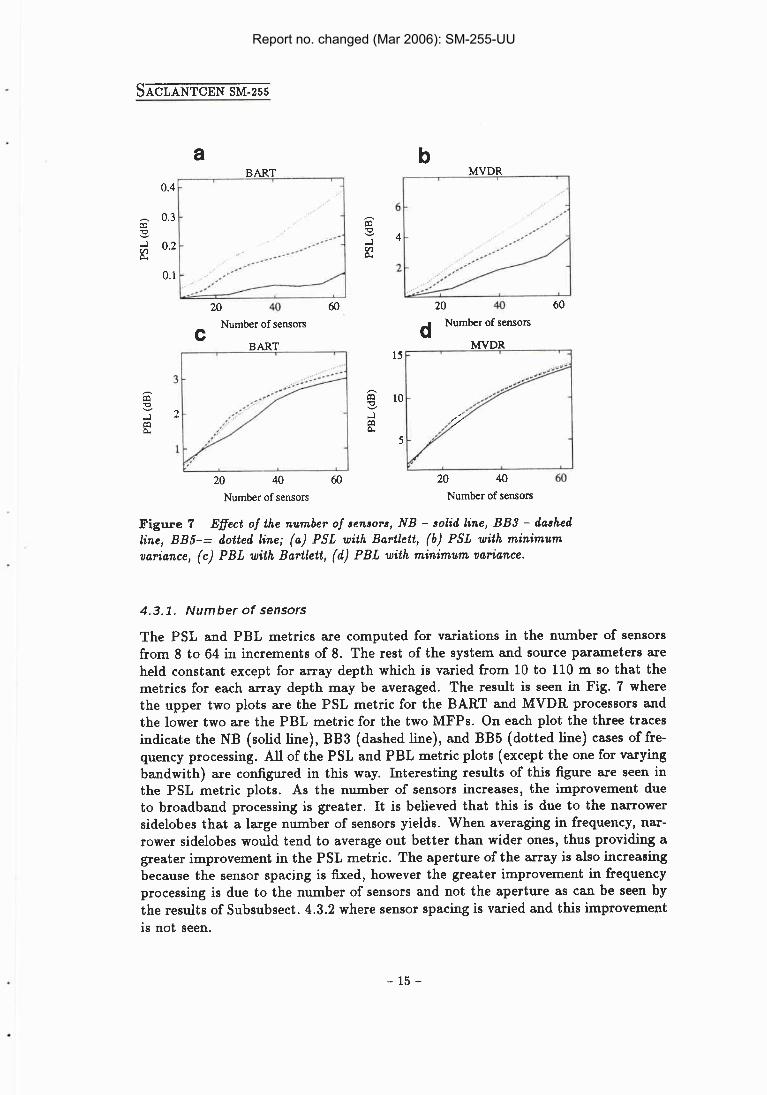
Figure 7 Effect of the number of sensors, NB - solid line, BB3 - dashed line, BB5-= dotted line; (a) PSL with Bartlett, (b) PSL with minimum variance, (c) PBL with Bartlett, ( d ) PBL with minimum variance.
4.3.1. Number of sensors
The PSL and PBL metrics are computed for variations in the number of sensors from 8 to 64 in increments of 8. The rest of the system and source parameters are held constant except for array depth which is varied from 10 to 110 m so that the metrics for each array depth may be averaged. The result is seen in Fig. 7 where the upper two plots are the PSL metric for the BART and MVDR processors and the lower two are the PBL metric for the two MFPs. On each plot the three traces indicate the NB (solid line), BB3 (dashed line), and BB5 (dotted line) cases of fre- quency processing. All of the PSL and PBL metric plots (except the one for varying bandwith) are configured in this way. Interesting results of this figure are seen in the PSL metric plots. As the number of sensors increases, the improvement due to broadband processing is greater. It is believed that this is due to the narrower sidelobes that a large number of sensors yields. When averaging in frequency, nar- rower sidelobes would tend to average out better than wider ones, thus providing a greater improvement in the PSL metric. The aperture of the array is also increasing because the sensor spacing is fixed, however the greater improvement in frequency processing is due to the number of sensors and not the aperture as can be seen by the results of Subsubsect. 4.3.2 where sensor spacing is varied and this improvement is not seen.
Report no. changed (Mar 2006): SM-255-UU
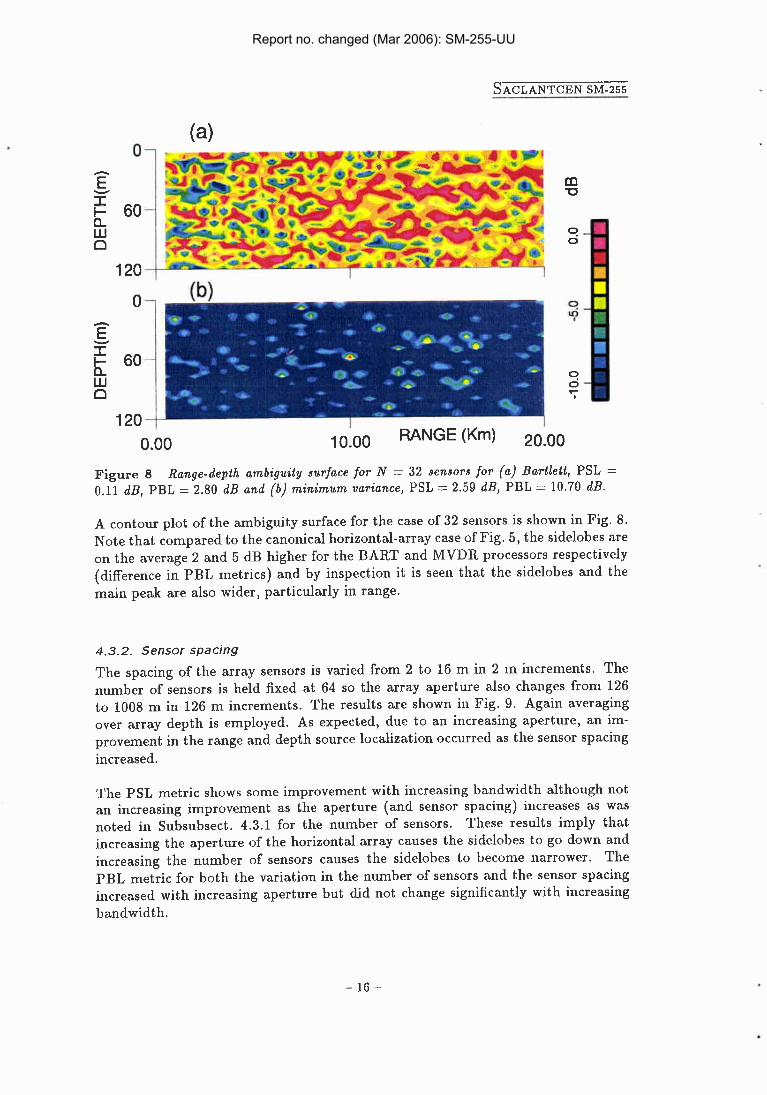
Figure 8 Bange-depth ambiguity surface for N = 32 sensors for (a) Bartlett, PSL = 0.11 dB, PBL = 2.80 dB and (b ) minimum variance, PSL = 2.59 dB, PBL = 10.70 dB.
A contour plot of the ambiguity surface for the case of 32 sensors is shown in Fig. 8. Note that compared to the canonical horizontal-array case of Fig. 5, the sidelobes are on the average 2 and 5 dB higher for the BART and MVDR processors respectively (difference in PBL metrics) and by inspection it is seen that the sidelobes and the main peak are also wider, particularly in range.
4.3.2. Sensor spacing
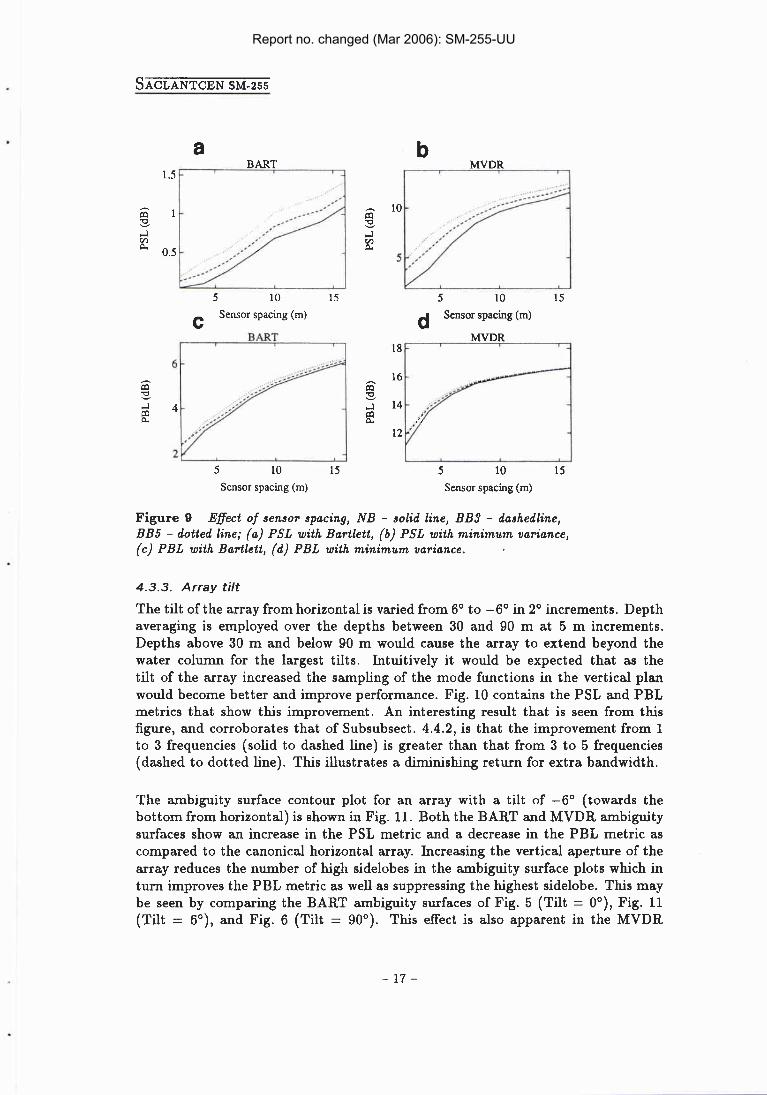
The spacing of the array sensors is varied from 2 to 16 m in 2 m increments. The number of sensors is held fixed at 64 so the array aperture also changes from 126 to 1008 m in 126 m increments. The results are shown in Fig. 9. Again averaging over array depth is employed. As expected, due to an increasing aperture, an im- provement in the range and depth source localization occurred as the sensor spacing increased.
The PSL metric shows some improvement with increasing bandwidth although not an increasing improvement as the aperture (and sensor spacing) increases as was noted in Subsubsect. 4.3.1 for the number of sensors. These results imply that increasing the aperture of the horizontal array causes the sidelobes to go down and increasing the number of sensors causes the sidelobes to become narrower. The PBL metric for both the variation in the number of sensors and the sensor spacing increased with increasing aperture but did not change significantly with increasing bandwidth.
Report no. changed (Mar 2006): SM-255-UU
BART 1.5 F"
MVDR I I
5 10 15
C Sensor spacing (m)
BART - 5 10 15 d Sensor spacing (m)
MVDR
5 10 15 Sensor spacing (m)
5 10 15 Sensor spacing (m)
Figure 9 Eflect of sensor spacing, NB - solid line, BB3 - dashedline, BB5 - dotted line; (a) PSL with Bartlett, ( b ) PSL with minimum variance, (c) PBL with Bartlett, ( d ) PBL with minimum variance.
4.3.3. Array tilt
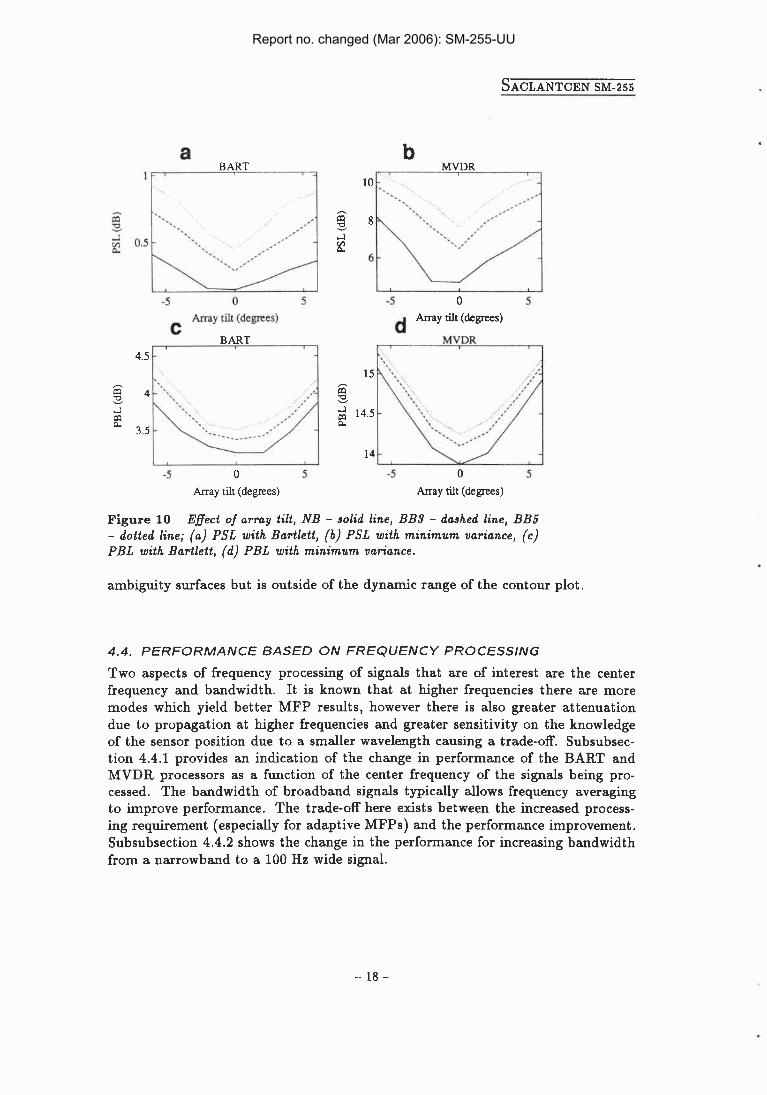
The tilt of the array from horizontal is varied from 6' to -6' in 2' increments. Depth averaging is employed over the depths between 30 and 90 m at 5 m increments. Depths above 30 m and below 90 m would cause the array to extend beyond the water column for the largest tilts. Intuitively it would be expected that as the tilt of the array increased the sampling of the mode functions in the vertical plan would become better and improve performance. Fig. 10 contains the PSL and PBL metrics that show this improvement. An interesting result that is seen from this figure, and corroborates that of Subsubsect. 4.4.2, is that the improvement from 1 to 3 frequencies (solid to dashed line) is greater than that from 3 to 5 frequencies (dashed to dotted line). This illustrates a diminishing return for extra bandwidth.
The ambiguity surface contour plot for an array with a tilt of -6" (towards the bottom from horizontal) is shown in Fig. 11. Both the BART and MVDR ambiguity surfaces show an increase in the PSL metric and a decrease in the PBL metric as compared to the canonical horizontal array. Increasing the vertical aperture of the array reduces the number of high sidelobes in the ambiguity surface plots which in turn improves the PBL metric as well as suppressing the highest sidelobe. This may be seen by comparing the BART ambiguity surfaces of Fig. 5 (Tilt = 0°), Fig. 11 (Tilt = 6"), and Fig. 6 (Tilt = 90'). This effect is also apparent in the MVDR
Report no. changed (Mar 2006): SM-255-UU
- BART MVDR
10- . . .
-5 0 5 -5 0 5
C M a y cilr (aegmS) BART
4.5 - *.. ',.
4 - '.. --.,
- - -
-5 0 5 Array tilt (degrees)
-- MVDR
Array tilt (degrees)
Figure 10 Efect of array tilt, NB - solid line, BB3 - dashed line, BB5 - dotted line; (a) PSL with Bartlett, ( b ) PSL with minimum variance, (c) PBL with Bartlett, (d) PBL with minimum variance.
ambiguity surfaces but is outside of the dynamic range of the contour plot.
4.4. PERFORMANCE BASED ON FREQUENCY PROCESSING Two aspects of frequency processing of signals that are of interest are the center frequency and bandwidth. It is known that at higher frequencies there are more modes which yield better MFP results, however there is also greater attenuation due to propagation at higher frequencies and greater sensitivity on the knowledge of the sensor position due to a smaller wavelength causing a trade-off. Subsubsec- tion 4.4.1 provides an indication of the change in performance of the BART and MVDR processors as a function of the center frequency of the signals being pro- cessed. The bandwidth of broadband signals typically allows frequency averaging to improve performance. The trade-off here exists between the increased process- ing requirement (especially for adaptive MFPs) and the performance improvement. Subsubsection 4.4.2 shows the change in the performance for increasing bandwidth from a narrowband to a 100 Hz wide signal.
Report no. changed (Mar 2006): SM-255-UU
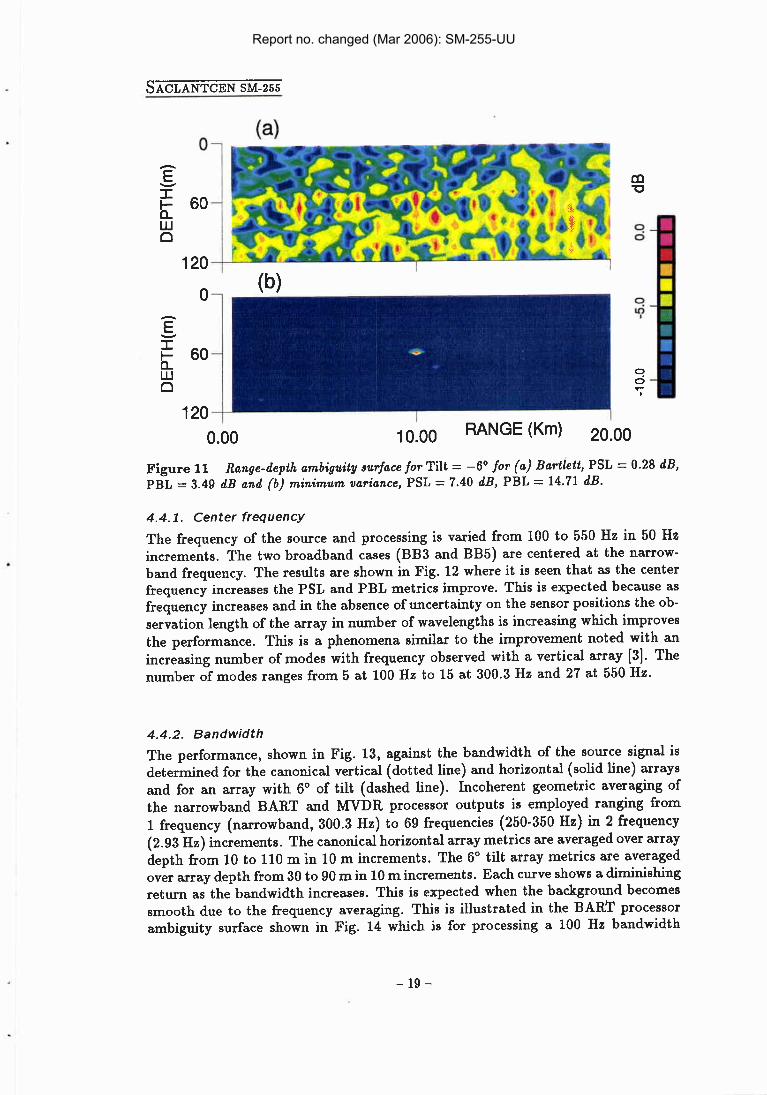
Figure 11 Range-depth ambiguity surface for Tilt = -6' for (a) Bartlett, PSL = 0.28 dB, PBL = 3.49 dB and (b) minimum variance, PSL = 7.40 dB, PBL = 14.71 dB.
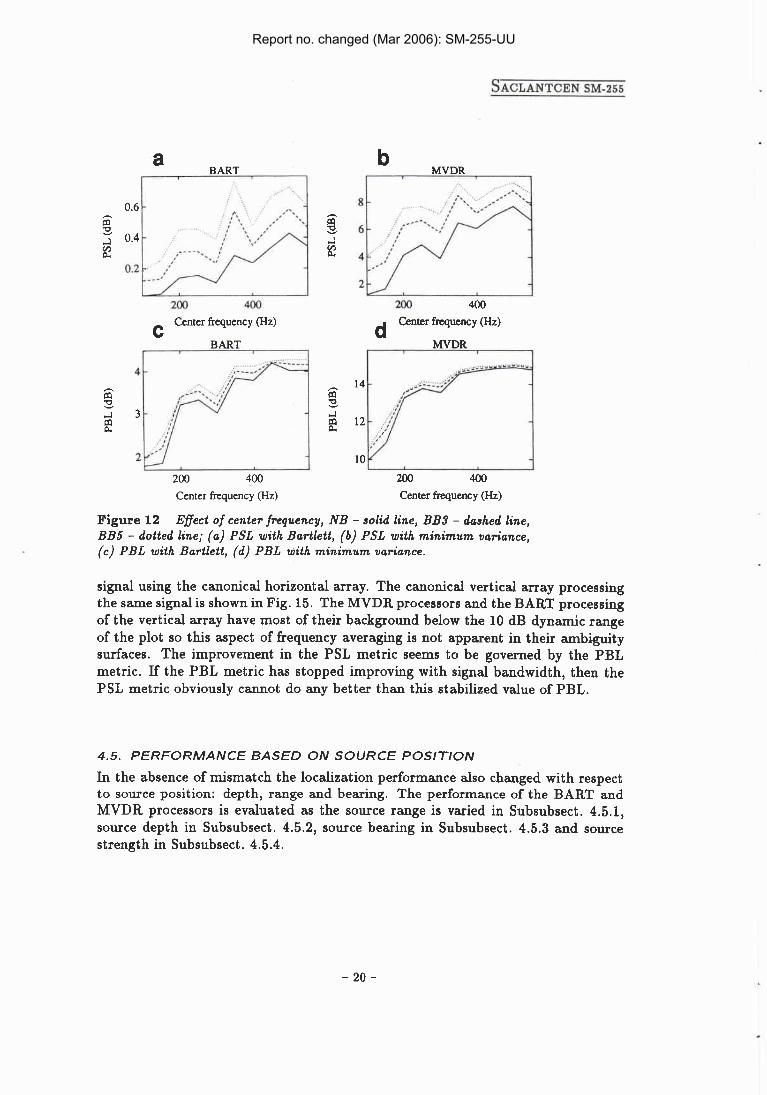
4.4.1. Center frequency The frequency of the source and processing is varied from 100 to 550 Hz in 50 Hz increments. The two broadband cases (BB3 and BB5) are centered at the narrow- band frequency. The results are shown in Fig. 12 where it is seen that as the center frequency increases the PSL and PBL metrics improve. This is expected because as frequency increases and in the absence of uncertainty on the sensor positions the ob- servation length of the array in number of wavelengths is increasing which improves the performance. This is a phenomena similar to the improvement noted with an increasing number of modes with frequency observed with a vertical array [3]. The number of modes ranges from 5 at 100 Hz to 15 at 300.3 Hz and 27 at 550 Hz.
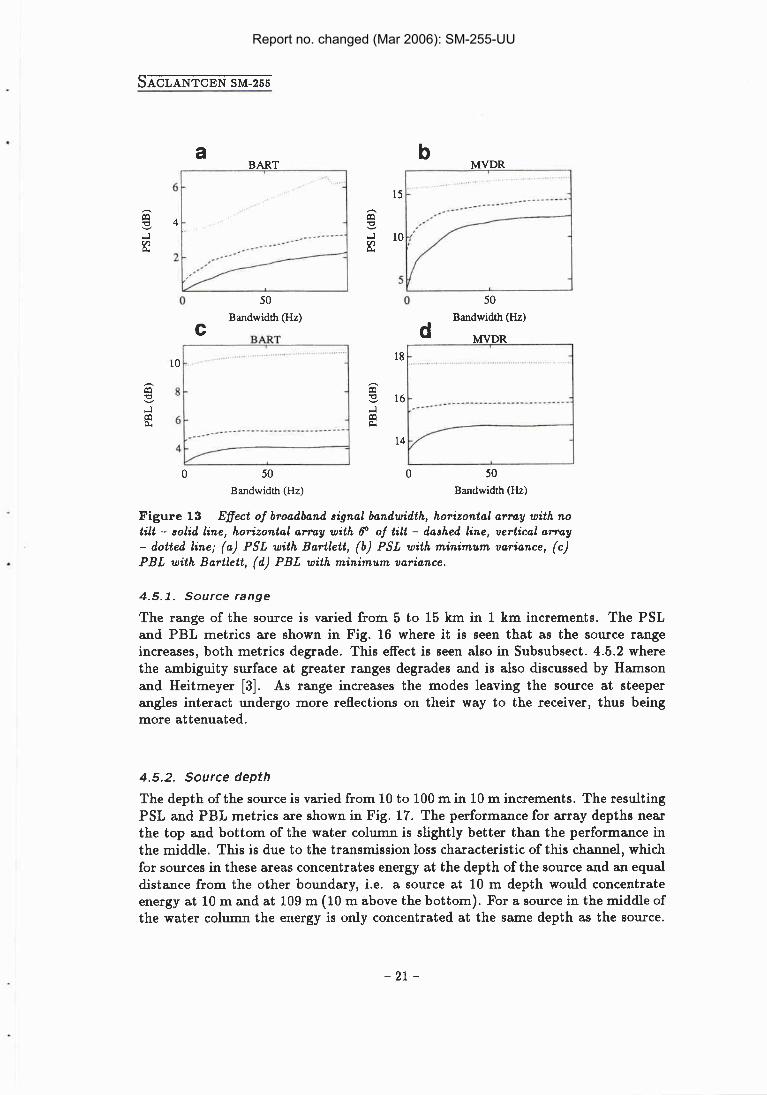
4.4.2. Bandwidth The performance, shown in Fig. 13, against the bandwidth of the source signal is determined for the canonical vertical (dotted line) and horizontal (solid line) arrays and for an array with 6' of tilt (dashed Line). Incoherent geometric averaging of the narrowband BART and MVDR processor outputs is employed ranging from 1 frequency (narrowband, 300.3 Hz) to 69 frequencies (250-350 Hz) in 2 frequency (2.93 Hz) increments. The canonical horizontal array metrics are averaged over array depth from 10 to 110 m in 10 m increments. The 6" tilt array metrics are averaged over array depth from 30 to 90 m in 10 m increments. Each curve shows a diminishing return as the bandwidth increases. This is expected when the background becomes smooth due to the frequency averaging. This is illustrated in the BART processor ambiguity surface shown in Fig. 14 which is for processing a 100 Hz bandwidth
Report no. changed (Mar 2006): SM-255-UU
a BART
b MVDR
d Center frequency (Hz)
MYDR
200 4 0 Center frequency (Hz)
200 400
Center frequency (Hz)
Figure 12 Eflect of center frequency, NB - solid line, BB3 - dashed line, BB5 - dotted line; (a) PSL with Bartlett, (b) PSL with minimum variance, (c) PBL with Bartlett, (d ) PBL with minimum variance.
signal using the canonical horizontal array. The canonical vertical array processing the same signal is shown in Fig. 15. The MVDR processors and the BART processing of the vertical array have most of their background below the 10 dB dynamic range of the plot so this aspect of frequency averaging is not apparent in their ambiguity surfaces. The improvement in the PSL metric seems to be governed by the PBL metric. If the PBL metric has stopped improving with signal bandwidth, then the PSL metric obviously cannot do any better than this stabilized value of PBL.
4.5. PERFORMANCE BASED ON SOURCE POSITION In the absence of mismatch the localization performance also changed with respect to source position: depth, range and bearing. The performance of the BART and MVDR processors is evaluated as the source range is varied in Subsubsect. 4.5.1, source depth in Subsubsect. 4.5.2, source bearing in Subsubsect. 4.5.3 and source strength in Subsubsect. 4.5.4.
Report no. changed (Mar 2006): SM-255-UU
a BART
....... . . . . . . . . 6 - 4 -
b MVDR - .............................. .......... ....... l5 - .-'.' -
Bandwidth (Hz) Bandwidth (Hz) d
... ............I _ ,...̂ ...... ..........- ................ ............ .++.. - *.... -
0 50 Bandwidth (Hz)
0 50 Bandwidth (Hz)
Figure 13 Effect of broadband signal bandwidth, horizontal array with no tilt - solid line, horizontal array with 60 of tilt - dashed line, vertical array - dotted line; (a) PSL with Bartlett, (b) PSL with minimum variance, (c) PBL with Bartlett, (d) PBL with minimum variance.
4.5.1. Source range
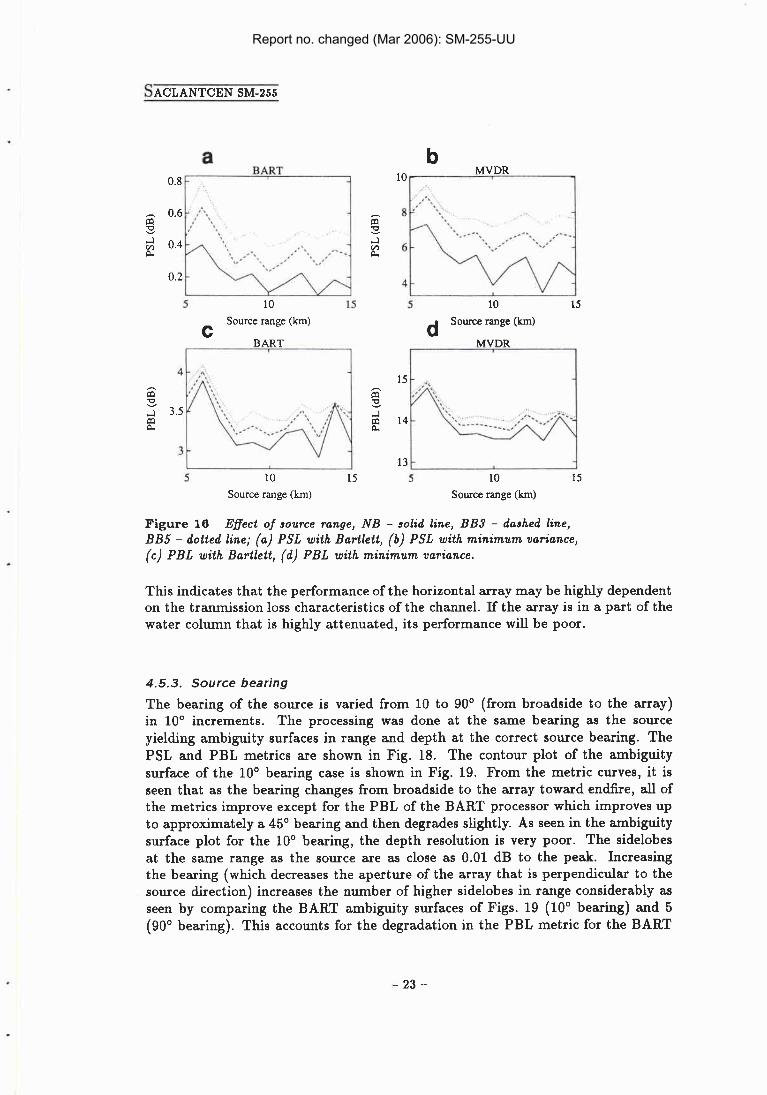
The range of the source is varied from 5 to 15 km in 1 km increments. The PSL and PBL metrics are shown in Fig. 16 where it is seen that as the source range increases, both metrics degrade. This effect is seen also in Subsubsect. 4.5.2 where the ambiguity surface at greater ranges degrades and is also discussed by Hamson and Heitmeyer [3]. As range increases the modes leaving the source at steeper angles interact undergo more reflections on their way to the receiver, thus being more attenuated.
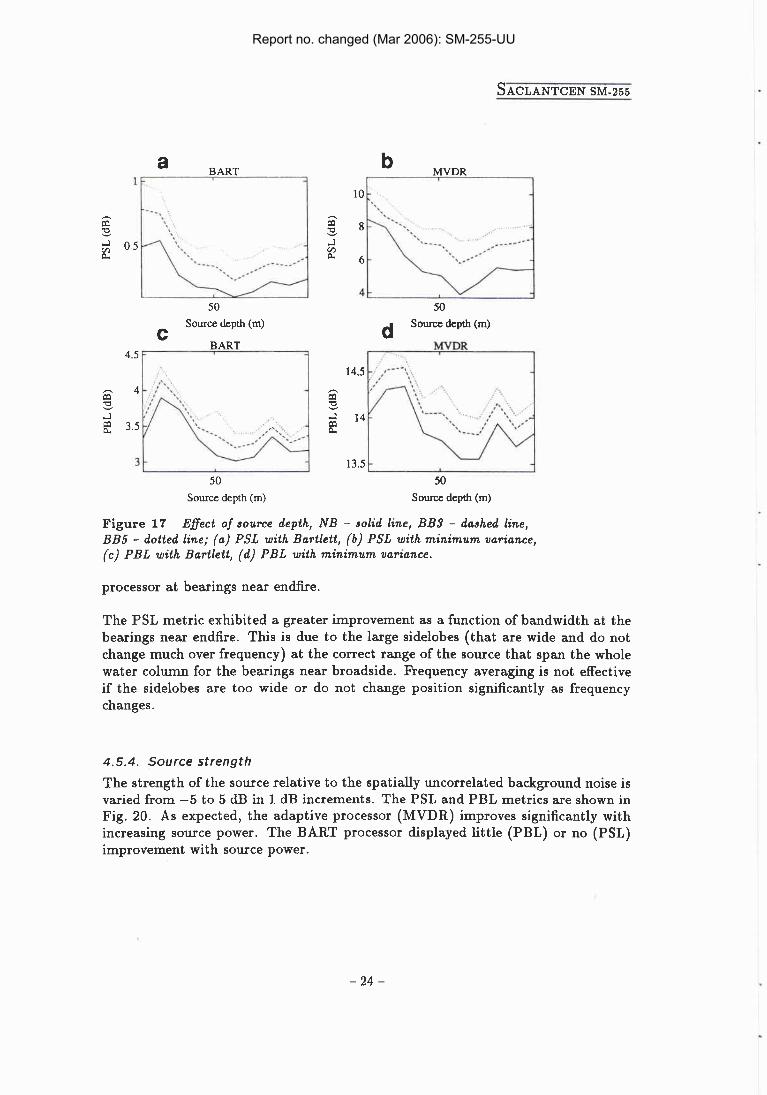
4.5.2. Source depth The depth of the source is varied from 10 to 100 m in 10 m increments. The resulting PSL and PBL metrics are shown in Fig. 17. The performance for array depths near the top and bottom of the water column is slightly better than the performance in the middle. This is due to the transmission loss characteristic of this channel, which for sources in these areas concentrates energy at the depth of the source and an equal distance from the other boundary, i.e. a source at 10 m depth would concentrate energy at 10 m and at 109 m (10 m above the bottom). For a source in the middle of the water column the energy is only concentrated at the same depth as the source.
Report no. changed (Mar 2006): SM-255-UU
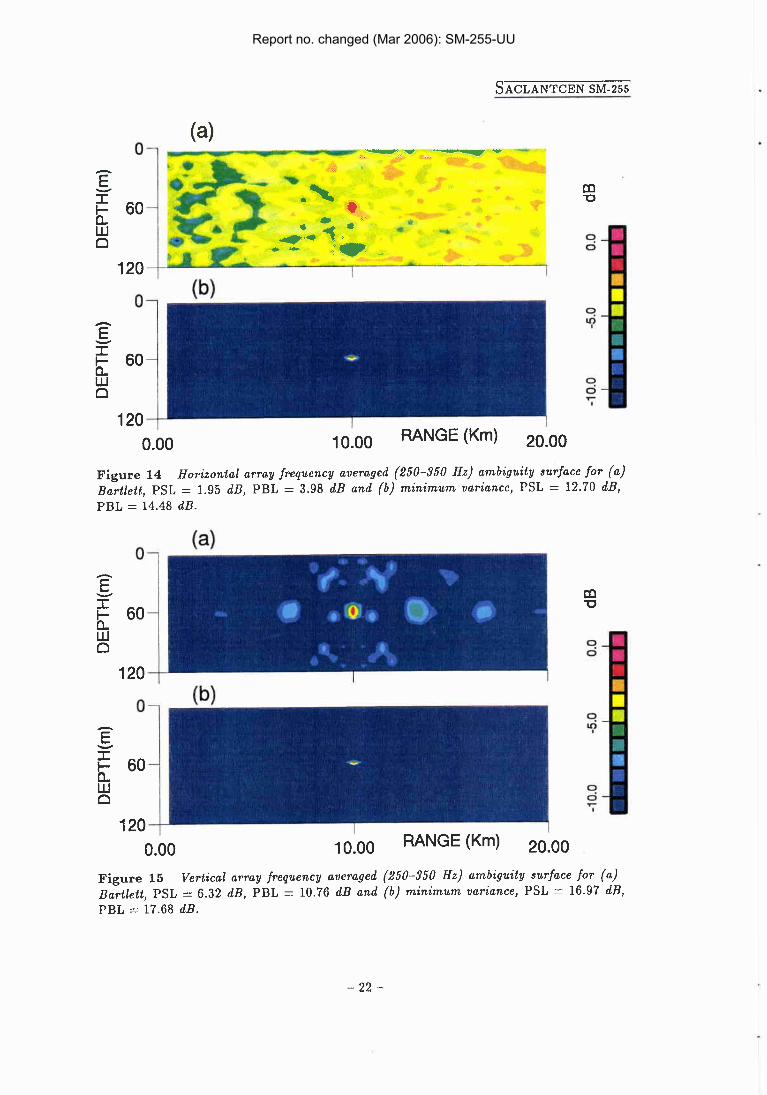
Figure 14 Horizonial array frequency averaged (250-350 Hz) ambiguity surface for (a) Bartlett, PSL = 1.95 dB, PBL = 3.98 dB and (b) minimum variance, PSL = 12.70 dB, PBL = 14.48 dB.
Figure 15 Vertical array frequency averaged (250-350 Hz) ambiguity surface for (a) Bartlett, PSL = 6.32 dB, PBL = 10.76 dB and (b ) minimum variance, PSL = 16.97 dB, PBL = 17.68 dB.
Report no. changed (Mar 2006): SM-255-UU
b 10, MVDR
1
Source range (km) C
BAXT
5 10 15 Source range (km)
10 15 Source range (km)
Figure 16 Effect of source range, NB - solid line, BB3 - dashed line, BB5 - dotted line; (a) PSL with Bartlett, ( b ) PSL with minimum variance, (c ) PBL with Bartlett, ( d ) PBL with minimum variance.
This indicates that the performance of the horizontal array may be highly dependent on the tranmission loss characteristics of the channel. If the array is in a part of the water column that is highly attenuated, its performance will be poor.
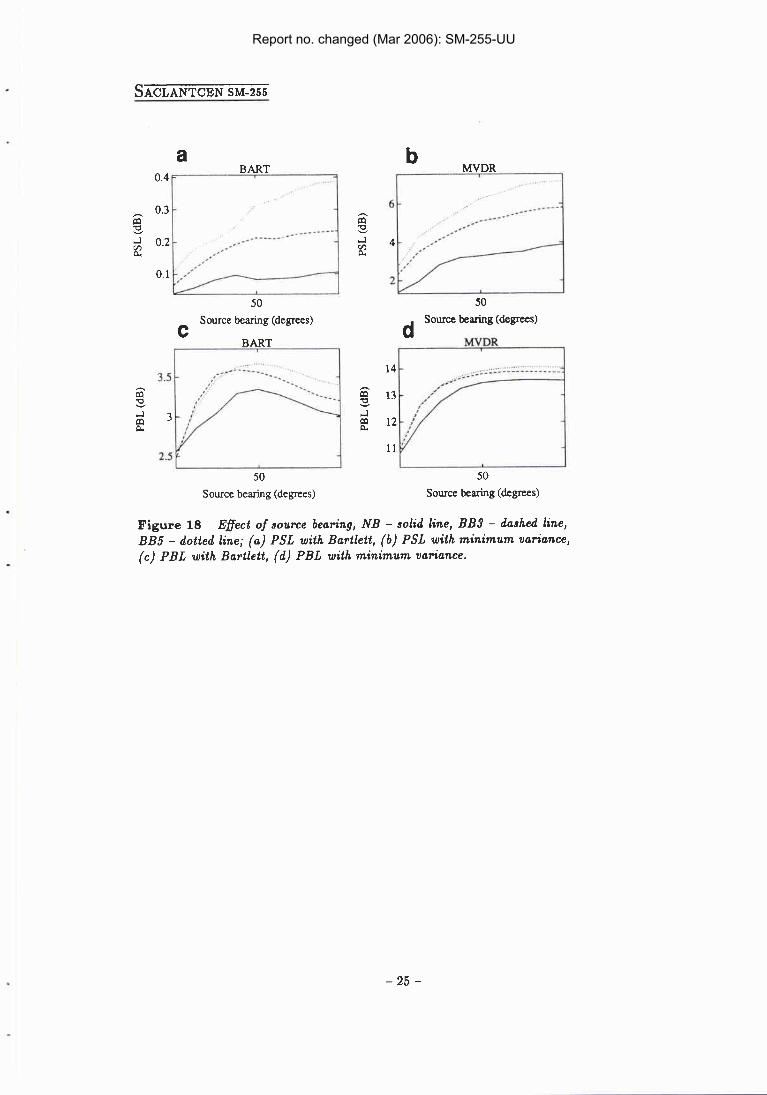
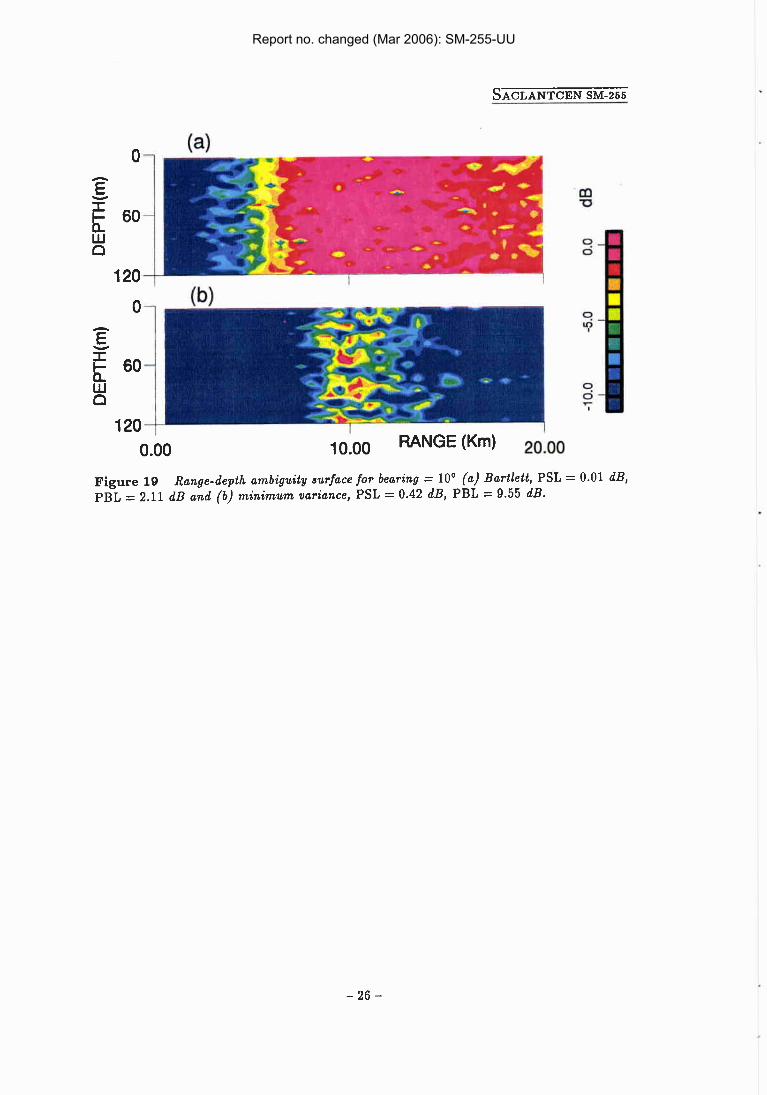
4.5.3. Source bearing The bearing of the source is varied from 10 to 90" (from broadside to the array) in 10" increments. The processing was done at the same bearing as the source yielding ambiguity surfaces in range and depth at the correct source bearing. The PSL and PBL metrics are shown in Fig. 18. The contour plot of the ambiguity surface of the 10" bearing case is shown in Fig. 19. From the metric curves, it is seen that as the bearing changes from broadside to the array toward endfire, all of the metrics improve except for the PBL of the BART processor which improves up to approximately a 45" bearing and then degrades slightly. As seen in the ambiguity surface plot for the 10" bearing, the depth resolution is very poor. The sidelobes at the same range as the source are as close as 0.01 dB to the peak. Increasing the bearing (which decreases the aperture of the array that is perpendicular to the source direction) increases the number of higher sidelobes in range considerably as seen by comparing the BART ambiguity surfaces of Figs. 19 (10" bearing) and 5 (90" bearing). This accounts for the degradation in the PBL metric for the BART
Report no. changed (Mar 2006): SM-255-UU
Source depth (m) C
BART
50 Source depth (m)
50
d Source depth (m)
50 Source depth (m)
Figure 17 Effect of source depth, NB - solid line, BB3 - dashed line, BB5 - dotted line; (a) PSL with Bartlett, ( b ) PSL with minimum variance, (c) PBL with Bartlett, (d) PBL with minimum variance.
processor at bearings near endfire.
The PSL metric exhibited a greater improvement as a function of bandwidth at the bearings near endfire. This is due to the large sidelobes (that are wide and do not change much over frequency) at the correct range of the source that span the whole water column for the bearings near broadside. Frequency averaging is not effective if the sidelobes are too wide or do not change position significantly as frequency changes.
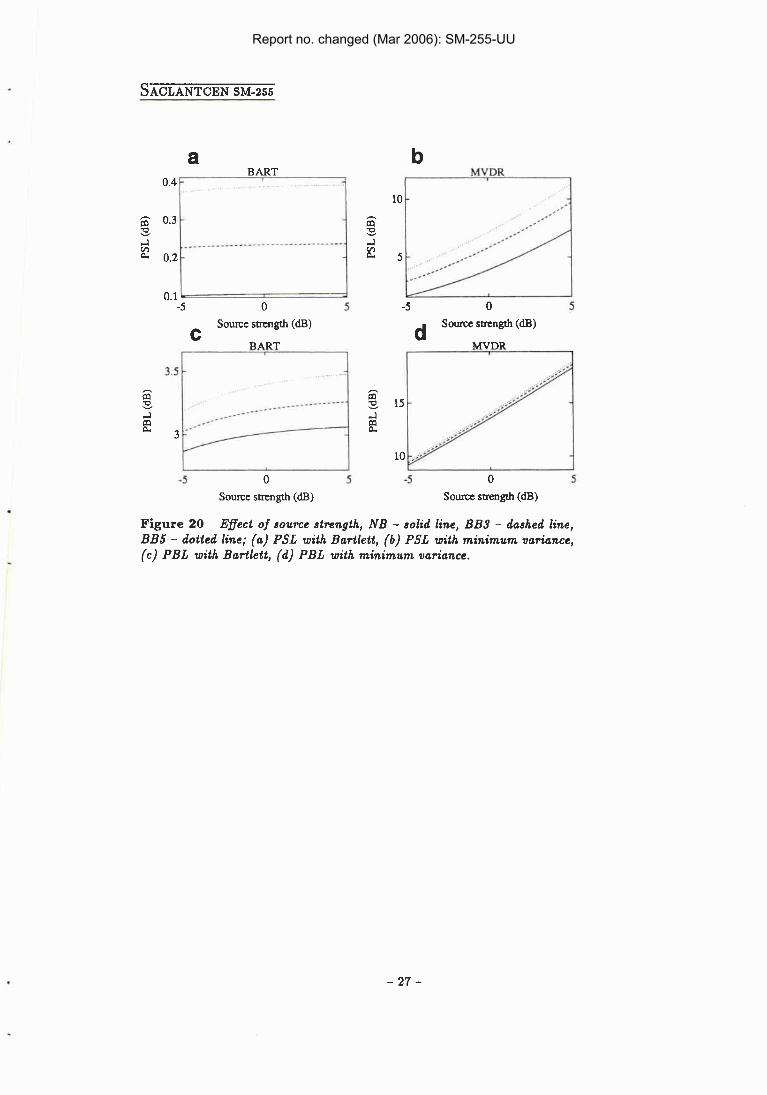
4.5.4. Source strength The strength of the source relative to the spatially uncorrelated background noise is varied from -5 to 5 dB in 1 dB increments. The PSL and PBL metrics are shown in Fig. 20. As expected, the adaptive processor (MVDR) improves significantly with increasing source power. The BART processor displayed little (PBL) or no (PSL) improvement with source power.
Report no. changed (Mar 2006): SM-255-UU
a BART
0.4 , . ...
Source bearing (degrees) d Source bearing (degrees) C
BART MVDR
50 50 Source bearing (degrees) Source bearing (degrees)
Figure 18 Effect of source bearing, NB - solid line, BB3 - dashed line, BB5 - dotted line; (a) PSL with Bartlett, (b) PSL with minimum variance, (c) PBL with Bartlett, (d) PBL with minimum variance.
Report no. changed (Mar 2006): SM-255-UU
F I
1 0.00 RANGE (Km) 20 00
Figure 19 Range-depth ambiguity surface for bearing = 10' (a) Bartlett, PSL = 0.01 dB, PBL = 2.11 dB and (b) minimum variance, PSL = 0.42 dB, PBL = 9.55 dB.
Report no. changed (Mar 2006): SM-255-UU
BART 0.4 . . . . . . . . . . 1
Source strength (dB)
C Source strength (dB) d Source strength (dB)
BART
Source strength (dB)
3.5
s -
Figure 20 Effect of source strength, NB - solid line, 8 8 3 - dashed line, BB5 - dotted line; (a) PSL with Bartlett, ( b ) PSL with minimum variance, (c) PBL with Bartlett, (d) PBL with minimum variance.
- ,, ._..
..- .
_-_-,-,,.-.-------a , . ( ' I
- 3 1 5 - _---- A 2
-S 0 5 -5 0 5
Report no. changed (Mar 2006): SM-255-UU
5 Conclusions
The objective of this study was to determine under which array, frequency process- ing, and source conditions matched-field processing of an horizontal array of sensors performs adequately for the passive range and depth localization of a source in a shal- low water environment at a fixed bearing. Perfect knowledge of environmental and system parameters (no mismatch) was assumed. Two metrics, the peak-to-highest sidelobe and peak-to-mean background ratios, were used to quantify the performance of Bartlett and minimum variance distortionless response matched-field processors.
With respect to the array parameters, the performance of the MFPs improved with increasing number of sensors, sensor spacing, and array tilt (vertical aperture), pri- marily due to better spatial sampling of the modes. With respect to frequency pro- cessing, performance improves when the center frequency increases due to a larger number of modes in the waveguide, and with increasing signal bandwidth. The performance for various source locations and strengths was evaluated and found to improve for bearings near endfire to the array, increasing source strength and de- creasing source range, due to the effective number or the spatial sampling of the modes. Performance as a function of source depth was found to be dependent on the transmission loss characteristics of the channel.
A greater improvement in the PSL metric was observed for the use of broadband signals as the number of sensors increased and as the source bearing tended to- ward endfire. In these cases the sidelobes of the range-depth ambiguity surface become narrower so frequency averaging can considerably improve performance. A trade-off exists here between the computational intensity required for the broadband frequency processing and the performance improvement.
The adaptive MVDR processor was on the average 3.7-8.8 dB higher than the BART processor for the PSL metric and 8.4-11.1 dB higher for the PBL metric. The cost of this improvement lies in the greater numerical intensity required for the implementation of the MVDR processor, the required knowledge or estimation of the covariance matrix of the signals and noise impinging on the array, and the greater susceptibility of the processor to mismatch.
The results of this simulation study indicate that adequate performance (defined by performance equivalent to a vertical array with BART processing) of the MVDR matched-field processor can be obtained for a realistic array system and frequency processing parameters (the canonical horizontal array case) for sources at bearings between z 45" and endfire at tactically significant source ranges and strengths. The
Report no. changed (Mar 2006): SM-255-UU
BART matched-field processor showed improved performance as noted above, but not performance equivalent to that of a vertical array. The primary hinderance to the horizontal array is the existence of a large number of very high and wide sidelobes when the spatial sampling of the modes is poor. When the array is configured to improve this sampling the sidelobe structure changes so that performance improves. Exploiting broadband characteristics of signals improves performance however the amount of gain depends on the sidelobe structure.
This study has been limited to one shallow water ocean environment with perfect matching between the received acoustic field and the processing replica field. Of further interest is the susceptibility of the BART and MVDR matched-field pro- cessing of horizontal arrays to mismatch in environment and system parameters. Klemm [4] has shown that horizontal arrays are more sensitive to surface fluctua- tions and mentions that they are more sensitive to processor mismatch than vertical arrays. The performance under mismatch for the horizontal array, the performance in other ocean environments, and the performance of arrays against horizontal tilt in vertically correlated surface noise models may be subjects for further study.
Report no. changed (Mar 2006): SM-255-UU
References [l] Baggeroer, A.B., Kuperman, W.A. and Schmidt, H. Matched-field processing: Source
localization in correlated noise as an optimum parameter estimation problem. Journal of the Acoustical Society of America, 83, 1988: 571-587.
[2] Hamson, R.M. and Heitmeyer, R.M. An analytical study of the effects of environmental and system parameters on source localisation in shallow water by matched-field pro- cessing of a vertical array, SACLANTCEN SR-140. La Spezia, Italy, NATO SACLANT Undersea Research Centre, 1988. [AD B 134 9551
[3] Hamson, R.M. and Heitmeyer, R.M. Environmental and system effects on source local- ization in shallow water by the matched-field processing of a vertical array. Journal of the Acoustical Society of America, 86, 1989: 1950-1959.
[4] Klemm, R. Range and depth estimation by line arrays in shallow water. Signal Pro- cessing, 3, 1981: 333-344.
Heitmeyer, R.M., Moseley, W.B., and Fizell, R.G. Full field ambiguity function pro- cessing in a complex shallow water environment. In: Wagstaff, R.A. and Baggeroer, A.B., eds., High Resolution Spatial Processing in Underwater Acoustics, Proceedings of an ONR sponsored workshop held a t the University of Southern Mississippi, 11-14 October 1983. NSTL, MS, Naval Ocean Research and Development Activity, 1985: pp. 171-191. [USGPO 1985-570-276 Govt. Document no. D.201.2-Ac 71 [LCCN 856018541
[6] Ozard, J.M. Matched field processing in shallow water for range, depth, and bearing determination: Results of experiment and simulation. Journal of the Acoustical Society of America, 86, 1989: 744-753.
[7] Feuillade, C., Kinney, W.A., and Del Balzo, D.R. Shallow-water matched-field localiza- tion off Panama City, Florida. Journal of the Acoustical Society of America, 88, 1990: 423-433.
[8] Gingras, D.F. Methods for predicting the sensitivity of matched-field processors to mismatch. Journal of the Acoustical Society of America, 86, 1989: 1940-1949.
[9] Jensen, F.B. and Ferla, M.C. SNAP: the SACLANTCEN normal-mode acoustic prop- agation model, SACLANTCEN SM-121. La Spezia, Italy, NATO SACLANT Undersea Research Centre, 1979. [AD A 067 2561
[lo] Hodgkiss, W.S., and Nolte, L.W. Covariance between Fourier coefficients representing the time waveforms observed from an array of sensors. Journal of the Acoustical Society of America, 59, 1976: 582-590.
[ll] Reed, I.S., Mallett, J.D., and Brennan, L.E. Rapid convergence rate in adaptive arrays. IEEE IPransactions on Aerospace and Electronic Systems, 10, 1974: 853-863.
Report no. changed (Mar 2006): SM-255-UU
Document Data Sheet NATO UNCLASSIFIED
D. Abraham
sound sources by matched-field p of matched-field processing both
This report focuses on the evaluation of the Id processing for source local- *bn d u g hodzc*rtat axays, ~ ; d i f k T e proceasiqs ~ l i ~ .
North Atlantic Treaty Organization tel: 0187 540 111 SACLANT Undersea Research Centre fax: 01 87 524 600 Viale San Bartolomeo 400, 19138 La Spezia, Italy telex: 271 148 SACENT I [From N. America: SACLAKTCEN CMR-426
(New York) APO AE 096131
NATO UNCLASSIFIED
Report no. changed (Mar 2006): SM-255-UU

Initial Distribution for SM-255
SCNR for SACLANTCEN SCNR Belgium SCNR Canada SCNR Denmark SCNR Germany SCNR Greece SCNR ltaly SCNR Netherlands SCNR Norway SCNR Portugal SCNR Spain SCNR Turkey SCNR U K SCNR US SECGEN Rep. SCNR N A M I L C O M Rep. SCNR
National Liaison Officers N L O Canada N L O Denmark N L O Germany N L O Italy N L O Netherlands NLO UK N L O US
Tota l external d ist r ibut ion 26 S A C L A N T C E N Library 10 Stock 24
-
Tota l number of copies 60
Report no. changed (Mar 2006): SM-255-UU