Embed Size (px)
Citation preview
External Evaluation of Programme, Youth Force
1 | D e s i g n & P l a n n i n g C o u n s e l
1. Contents Executive Summary ............................................................................................................................ 3
1. INTRODUCTION & EVALUATION SCOPE ...................................................................................... 8
1.1 About Youth Force .................................................................................................................. 8
1.1.1 Youth Member .................................................................................................................... 8
1.1.2 Livelihood Linkages ............................................................................................................. 9
1.1.3 Micro Entrepreneurship ...................................................................................................... 9
1.1.4 Micro Finance ...................................................................................................................... 9
1.1.5 Youth Leader ..................................................................................................................... 10
1.1.6 Job Fairs ............................................................................................................................. 10
1.2 Scope of Work for External Evaluation ................................................................................. 10
2. METHODOLOGY OF EVALUATION & SAMPLE SELECTION ......................................................... 11
2.1 Scrutiny & Analysis of Existing Data ...................................................................................... 12
2.2 Parameters for Evaluating Coverage of Programmes ........................................................... 12
2.3 Parameters for Questionnaire Survey ................................................................................... 12
2.4 Sample Size for Questionnaire Survey .................................................................................. 12
2.5 Questionnaire Survey ............................................................................................................ 13
2.6 Details of Samples Across Various Linkages Programmes .................................................... 15
2.6.1 Youth Member .................................................................................................................. 15
2.6.2 Livelihood Linkages ........................................................................................................... 15
2.6.3 Micro Entrepreneur ........................................................................................................... 16
2.6.4 Micro Finance .................................................................................................................... 17
2.6.5 Youth Leaders .................................................................................................................... 18
2.6.6 Job Fair .............................................................................................................................. 18
2.6.7 Company Placements ........................................................................................................ 19
3. FINDINGS AND RECOMMENDATIONS ....................................................................................... 20
3.1 Youth Member ...................................................................................................................... 20
3.1.1 Findings Based on the Questionnaire survey .................................................................... 23
3.1.2 Recommendations ............................................................................................................ 25
3.2 Livelihood Linkages ............................................................................................................... 26
3.2.1 Findings Based on Questionnaire Survey .......................................................................... 29
3.2.2 Recommendations ............................................................................................................ 32
3.3 Micro Entrepreneur ............................................................................................................... 33
3.3.1 Findings Based on Questionnaire Survey .......................................................................... 35
3.3.2 Recommendations ............................................................................................................ 37

External Evaluation of Programme, Youth Force
2 | D e s i g n & P l a n n i n g C o u n s e l
3.4 Micro Finance ........................................................................................................................ 38
3.4.1 Findings Based on Questionnaire survey .......................................................................... 40
3.4.2 Recommendations ............................................................................................................ 41
3.5 Youth Leaders ........................................................................................................................ 42
3.5.1 Findings Based on Questionnaire Survey .......................................................................... 43
3.5.2 Recommendations ............................................................................................................ 45
3.6 Job Fair .................................................................................................................................. 46
3.6.1 Findings based on Questionnaire Survey .......................................................................... 48
3.6.2 Recommendations: ........................................................................................................... 49
3.7 Company Placements ............................................................................................................ 50
3.7.1 Findings based on Questionnaire Survey .......................................................................... 50
3.7.2 Recommendations ............................................................................................................ 51
4. Annexure ................................................................................................................................... 52
1. Youth Member Questionnaire .......................................................................................... 52
2. Livelihood Linkages Questionnaire ................................................................................... 52
3. Micro Entrepreneur Questionnaire ................................................................................... 53
4. Micro Finance Questionnaire ............................................................................................ 53
5. Youth Leader Questionnaire ............................................................................................. 54
6. Job Fair Questionnaire ...................................................................................................... 54
7. Company Placements Questionnaire ................................................................................ 54
External Evaluation of Programme, Youth Force
3 | D e s i g n & P l a n n i n g C o u n s e l
Executive Summary
SAATH Ahmedabad is a registered public charitable trust aiming to improve the quality of life of urban poor by empowering them and building their capacities. Saath works with slum residents, migrants, minorities, children, women, youth and vulnerable people in urban and rural areas. In the last 25 years the trust has expanded into Gujarat, Rajasthan and Maharashtra (Mumbai) and has affected more than 4,60,576 individuals. Saath runs programmes in various sectors which include Livelihoods (Udaan, Nirman, Urmila, Youth Force, RWeaves), Health and Education (Child Friendly Spaces, Balghars, Sujal), Governance (Urban Resource Centre, Night Shelter), Human Rights (Child Rights for Change, Housing Rights), Affordable Housing, Rehabilitation and Resettlement and Microfinance (Saath Savings and Credit Cooperative Society Ltd. and Saath Mahila Savings and Credit Cooperative Society Ltd.)
About Youth Force
Youth force is one of the programme undertaken by Saath. The programme aims at building a platform for youth from urban slum areas in Gujarat and Mumbai. The objectives of the programme are:
1) To support the under privileged youth between the age group of 18‐35 years and enable them to gain access to opportunities for livelihoods and growth in the new emerging economy.
2) To provide a stage where youths can come for assistance and guidance.
3) Building the skills and capacities of youth through its various linkages like Youth members, Livelihood, Micro finance, Micro enterprise, Job fairs and Leadership programmes.
External Evaluation of Youth Force Programme
Having implemented the programme for almost two years, Saath appointed ‘Design & Planning Counsel’ (DPC) Ahmedabad to evaluate the Youth Force programme. The aim of the evaluation was to assess the impact of the programme between 2012‐13 and 2013‐2014. The time given for the evaluation was one month.
Objectives of External Evaluation: Impact analysis of the beneficiaries’ linkages, Qualitative and Quantitative impact of the programme and verification through sample survey.
The process of the external evaluation adopted by DPC started with the review of the given data to develop an understanding of each programme, its objectives and coverage with respect to different parameters. This understanding was developed through reports, discussions with Saath and through analysis of the existing data given for each programme. As a final outcome, the data for each programme has been scrutinised. Targets achieved by Saath (2012‐14) under each programme have been assessed against the funding agency (HSBC) targets. Predominantly, parameters related to Gender, Age group, Education profiles and differently abled members have been selected to assess the coverage and impact of the programme.
Number of beneficiaries in various linkage programmes across cities:
City Youth members Livelihood Micro‐
Entrepreneur Micro‐Finance
Youth Leaders
Placements Job Fair
Placements Company
Ahmedabad 1035 4352 159 2147 14 911 10
Surat 537 580 63 160 9 170 8 Baroda 660 3995 90 696 14 724 3 Rajkot 382 601 37 334 6 164 5 Mumbai 860 968 102 589 8 615 29 Total 3474 10496 451 3926 51 2584 55
External Evaluation of Programme, Youth Force
4 | D e s i g n & P l a n n i n g C o u n s e l
Sample Survey (Selection & Size)
The sample survey has been done through telephonic survey and visits. Based on the findings recorded through the analysis for the coverage of programme across different parameters, the sample types and sample sizes have been selected for the survey. The selection of sample types has been based on predominant parameters within each programme. The details for the selection of predominant parameters for the sample survey have been covered under Chp‐2* “Samples selected across different linkage programmes”.
Multiple parameters affected the selection of sample size. Based on the quantum of members in each programme and the limited time period available for the study– the sample size varies for each linkage programme. Sample size also varies across the cities for each programmes. The causes of variation in sample sizes was due to different response rate in each city and the Quality of inputs given by the members. For the sample survey Questionaries’ were formulated specific to each programme. The questions framed were not just limited to taking ‘Yes’ or ‘No’ answers. But were descriptive to understand the experience of the member during the programme. The survey was stretched to extend to record the qualitative inputs from each member in terms of their experiences and suggestions.
Volume of sample size achieved for external evaluation under different linkage programmes
Sample Size: Successful Calls Vs Total Calls
City Youth members
Livelihood Micro‐Entrepreneur
Micro‐Finance
Youth Leaders
Registrations for Job Fair
Placements Company
Total 4% (10%) 3% (8%) 8% (23%) 2% (5%)
100% (100%)
3% (7%) 100% (100%)
Note: The numbers outside the bracket denotes Successful interviews and the numbers inside the bracket denotes total respondents who were contacted.
Response rate across cities
City Youth
Member (%)
Livelihood linkages (%)
Micro Entrepreneur
(%)
Micro Finance (%)
Youth Leaders (%) Job Fair
(%)
Ahmedabad (%) 40 41 48 42 72 38
Surat (%) 38 26 86 42 56 45 Baroda (%) 43 43 27 40 64 54 Rajkot (%) 51 25 83 25 50 71 Mumbai (%) 34 53 20 38 57 44
Total 40 36 36 39 62 44
The volume of calls varied in different cities due to low response rate. For instance, under the Livelihood linkage programme response rate recorded in Surat has been 26%, due to the low response rate the volume of the sample survey had to be increased to 31%. While under the Micro Entrepreneur linkage programme response rate in Surat has been 86% and the quality of inputs given by the respondents was also good. Hence, the volume of the sample survey has been limited to 12%.

External Evaluation of Programme, Youth Force
5 | D e s i g n & P l a n n i n g C o u n s e l
Findings
Achievements against the HSBC target
Growth rate 2012‐2014
Linkages Growth Rate
Youth Members (%) 202% Livelihood linkages (%) -81% Micro Entrepreneur (%) 129% Micro Finance (%) -97% Registration of candidates for Job Fair (%) -60% Coverage of the programmes across gender profile
Linkages Female (%) Male (%) Missing Data (%)
Youth Member 41 59 0 Livelihood linkages 58 39 3 Micro entrepreneur 66 34 0 Micro finance 54 46 0 Job Fair 32 68 0 Youth Leader 47 53 0
Livelihood, Micro Entrepreneur and Micro Finance programme show higher involvement of female members. Sample survey suggests that females have benefited from the training under these programmes. Many of them have become self‐employed and work from home after taking training under the livelihood programme. The female members under youth member programme have equally benefitted by participating in multiple activities and seminars. Before the programme, many of them have never gone outside their city or town they belonged. However due to the trips and visits as part of the programme, they got an opportunity to visit different places and now feel confident to move alone.
Coverage of the programmes across different age groups
Age‐(Slab) Youth member (%)
Livelihood (%)
Micro‐entrepreneur (%)
Micro‐finance (%)
Job‐fair (%)
00‐17 years 6 1 2 4 2 18‐20 years 43 42 33 29 24 21‐25 years 33 28 27 30 33 26‐30 years 12 14 17 16 13 31‐35 years 5 10 20 17 12 Data Missing 1 5 1 4 16
Programmes No.s Targeted (HSBC) No.s Achieved
Youth Member 3120 3474 Livelihood 13000 10496 Micro
Entrepreneur 400 451
Micro Finance 3360 3926 Youth Leader 50 51 Job Fair (direct placement) 4000 2584
External Evaluation of Programme, Youth Force
6 | D e s i g n & P l a n n i n g C o u n s e l
Coverage of all the programmes across the age group of 18‐20 years and 21‐25 years has been maximum. The analysis suggests that Youth force through its beneficiary programmes has targeted youths of the correct age groups.
Coverage of the programme w.r.t education level of youths
Education ‐ Slab Youth Member (%)
Livelihood linkages (%)
Micro Entrepreneur
(%)
Micro Finance (%)
Youth Leader (%)
Job Fair (%)
00‐09 grade 24 29 33 31 8 11 10‐12 grade 44 52 41 39 47 36 Graduation 26 16 14 24 18 34 Masters 4 2 11 4 25 3 Studying 2 1 1 2 2 7
Data Missing 0 0 0 0 0 9 Coverage of all the programmes across the education profiles of 10‐12th grade and 00‐09th grade has been maximum. Youth Force programmes has rightly targeted youths with low education profiles. The coverage of the programmes across graduated youths has been equally good. Sample survey suggests that these graduated youths have equally benefitted from the programmes by making friends, contacts with other people and enrolling for skill based course for knowledge enhancement. These youths have equally helped other members and motivated them to join and continue with Youth force.
Findings Based on Questionnaire Survey
Based on the questionnaire survey, the overall performance of the programme within and across the cities has been assessed. Recommendations based on the findings and performance for each programme has been suggested. Many of the recommendations listed were suggested by the members during the survey.
In the Youth Member programme, 86% of members agreed to have benefitted by participating in various youth force activities. However, In spite of the benefits from the programme only 35% were found to be currently active. The busy working lifestyle was found to be the main reason behind the decrease in the rate of participation. Recommendations: 1) Organization of activities should be based on convenience of the youth members may be more beneficial to increase the participation. 2) Family based activities and trips may also be more beneficial to maximize the participation. In the Livelihood Programme, 82% of the members said to have benefited from the training course. The overall coverage of the programme has been better among the Females as compared to Males. Recommendations: 1) The benefits gained by the members should be gauged in terms of employment opportunities after the course work. In this context, the Livelihood linkage programme can offer two kinds of courses – one which may be for knowledge enhancement and skill development while the second course should focus on providing assured job placements with certain pre‐requisite conditions.
In the Micro Entrepreneur programme, 77% of the members said to have benefited in terms of their business expansion and increase in the monthly income. The overall coverage of the programme has been better among the Females as compared to Males. Recommendations: 1) To increase the coverage of the programme a parallel short course may be given to the same members after the completion of any training courses offered by the organisation.
External Evaluation of Programme, Youth Force
7 | D e s i g n & P l a n n i n g C o u n s e l
In the Micro Finance programme, 87% of the respondents said to have benefited from the training course. Recommendations: 1) To increase the coverage of the programme, a short presentation may be given to the members after completion of any training courses offered by the organisation. 2) For the Micro Finance the continuity of ‘savings’ is the main objective of the programme. Hence, a mid‐assessment may be done by Saath to survey the continuity of the saving by the members and motivate them to continue it.
In the Job Fair programme, 20% of the respondent who registered for the job fair were positive about the outcomes. The major concerns raised by the respondents was lack of quality jobs at the job fair. Many of the people had left the job even after getting placements.
For the Company placements, 42% of the Company personnel were satisfied with the people recruited through Youth Force. However, many people left the job in short time as they were not satisfied either with the work or the salary given. Recommendations: 1) Extensive Counselling should be undertaken. This will help candidates to have more clarity about their job needs, their skills and the market demands.
In the Youth leader programme, all the Leaders were found to be active, regular and focused in their work. Recommendations: 1) Youth leader programme presently has active participation of leaders who are less educated but due to their experience with the organisation they have developed a better understanding for the programme. The programme may also try to focus on educated youths and all other members who have long association with the organization.

External Evaluation of Programme, Youth Force
8 | D e s i g n & P l a n n i n g C o u n s e l
1. INTRODUCTION & EVALUATION SCOPE About Saath
SAATH Ahmedabad is a registered public charitable trust aiming to improve the quality of life of urban poor by empowering them and building their capacities. Saath works with slum residents, migrants, minorities, children, women, youth and vulnerable people in urban and rural areas. In the last 25 years the trust has expanded into Gujarat, Rajasthan and Maharashtra (Mumbai) and has affected more than 4,60,576 individuals. Saath runs programs in various sectors which include Livelihoods (Udaan, Nirman, Urmila, Youth Force, RWeaves), Health and Education (Child Friendly Spaces, Balghars, Sujal), Governance (Urban Resource Centre, Night Shelter), Human Rights (Child Rights for Change, Housing Rights), Affordable Housing, Rehabilitation and Resettlement and Microfinance (Saath Savings and Credit Cooperative Society Ltd. and Saath Mahila Savings and Credit Cooperative Society Ltd.)
1.1 About Youth Force Youth Force is one of the livelihoods programme undertaken by Saath. The programme aims at building a platform for youth from urban slum areas in Gujarat and Mumbai.
Objectives of the Youth Force:
1) To support the under privileged youth between the age group of 18‐35 years and enable them to gain access to opportunities for livelihoods and growth in the new emerging economy.
2) To provide a stage where youths can come for assistance and guidance.
3) Building the skills and capacities of youth through its various linkage programmes like Youth Member, Livelihood Linkages, Micro Finance, Micro Enterprise, Youth Leader and Job Fairs
1.1.1 Youth Member
The programme of Youth Member focuses on building relationship and gaining the trust with the youths. It ensures to provide a stage where youths can come for assistance and guidance. It aims at providing a platform for youths from urban slum areas in Gujarat and Mumbai.
The objectives of the programme are, to build an ability to learn from complex situations and motivate the youths to work on socially relevant issues, to mobilize the youths and to gain personal development & exposure.
Any youth in the age group of 18‐35 years is eligible for joining the Youth force. A form worth Rs. 50/‐ needs to be filled to become a Youth member. The objectives of the programme are met through different development activities like Group bonding and strengthening, leisure activities, sports activities, competitions with inclusions of differently able. Community bonding through celebrating festivals such as the Republic day, World Aids day, Holi and Iftar party. Exposure visits to various organizations and places such as other NGO’s, Malls, Women Development Centre, Company/Industry visit, Ashrams etc. are organized.
Youth Members attending run for Unity marathon in Ahmedabad, Source: Saath

External Evaluation of Programme, Youth Force
9 | D e s i g n & P l a n n i n g C o u n s e l
1.1.2 Livelihood Linkages
The programme of livelihood linkages aims at providing Individual development activities through training courses to the members. The objective of livelihood programme is to provide linkages to better work, self‐employment or formal and secure employment.
Any youth between the age group of 18‐35 years, can enroll in these courses. The fees varies according to the course. The programme is open for all the youths and not only limited to the Youth members.
After getting enrolled, the members benefit from skill building, counseling, career orientation training with the help of other organizations and NGO’s. Each member after the successful completion of the course is awarded with a certificate. Placements are also provided at the end of the training.
1.1.3 Micro Entrepreneurship
The programme of Micro Entrepreneur focuses on providing training to youths who are already running small business to expand their market base and increase their income.
Any youth between the age group of 18‐35 years can participate in this programme. A 16 hour’s training module is distributed across two or three days.
All the youths involved with various small business are given training and guidance specific to their business.
1.1.4 Micro Finance
The programme of Micro Finance focuses on making youth members / beneficiaries, aware and understand the importance of savings. The objectives of Micro Finance is to help the members open bank account and to make them eligible for affordable credits from Saath Savings & Credit Cooperative society.
Micro Finance linkage is carried through door to door visits. Leaders and coordinators visit each and every house to make people aware about savings. During the visit, importance of savings and benefits of credits from the bank is explained. Interested candidates are helped by the Youth members / leaders to open a bank account.
Beauty Parlour course, Odhav Center, Ahmedabad, Source: DPC
Micro Entrepreneur training course, Ahmedabad Source: Saath
External Evaluation of Programme, Youth Force
10 | D e s i g n & P l a n n i n g C o u n s e l
1.1.5 Youth Leader
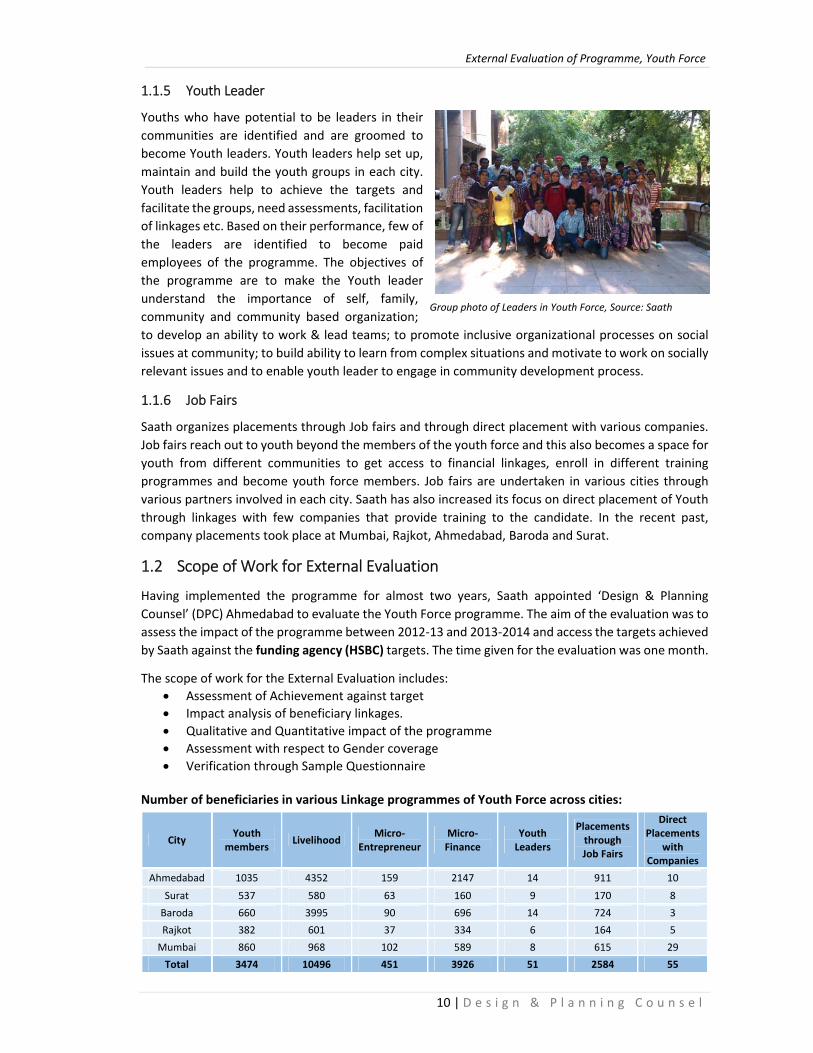
Youths who have potential to be leaders in their communities are identified and are groomed to become Youth leaders. Youth leaders help set up, maintain and build the youth groups in each city. Youth leaders help to achieve the targets and facilitate the groups, need assessments, facilitation of linkages etc. Based on their performance, few of the leaders are identified to become paid employees of the programme. The objectives of the programme are to make the Youth leader understand the importance of self, family, community and community based organization; to develop an ability to work & lead teams; to promote inclusive organizational processes on social issues at community; to build ability to learn from complex situations and motivate to work on socially relevant issues and to enable youth leader to engage in community development process.
1.1.6 Job Fairs
Saath organizes placements through Job fairs and through direct placement with various companies. Job fairs reach out to youth beyond the members of the youth force and this also becomes a space for youth from different communities to get access to financial linkages, enroll in different training programmes and become youth force members. Job fairs are undertaken in various cities through various partners involved in each city. Saath has also increased its focus on direct placement of Youth through linkages with few companies that provide training to the candidate. In the recent past, company placements took place at Mumbai, Rajkot, Ahmedabad, Baroda and Surat.
1.2 Scope of Work for External Evaluation
Having implemented the programme for almost two years, Saath appointed ‘Design & Planning Counsel’ (DPC) Ahmedabad to evaluate the Youth Force programme. The aim of the evaluation was to assess the impact of the programme between 2012‐13 and 2013‐2014 and access the targets achieved by Saath against the funding agency (HSBC) targets. The time given for the evaluation was one month.
The scope of work for the External Evaluation includes: • Assessment of Achievement against target • Impact analysis of beneficiary linkages. • Qualitative and Quantitative impact of the programme • Assessment with respect to Gender coverage • Verification through Sample Questionnaire
Number of beneficiaries in various Linkage programmes of Youth Force across cities:
City Youth members Livelihood Micro‐
Entrepreneur Micro‐Finance
Youth Leaders
Placements through Job Fairs
DirectPlacements
with Companies
Ahmedabad 1035 4352 159 2147 14 911 10
Surat 537 580 63 160 9 170 8 Baroda 660 3995 90 696 14 724 3 Rajkot 382 601 37 334 6 164 5 Mumbai 860 968 102 589 8 615 29 Total 3474 10496 451 3926 51 2584 55
Group photo of Leaders in Youth Force, Source: Saath
External Evaluation of Programme, Youth Force
11 | D e s i g n & P l a n n i n g C o u n s e l
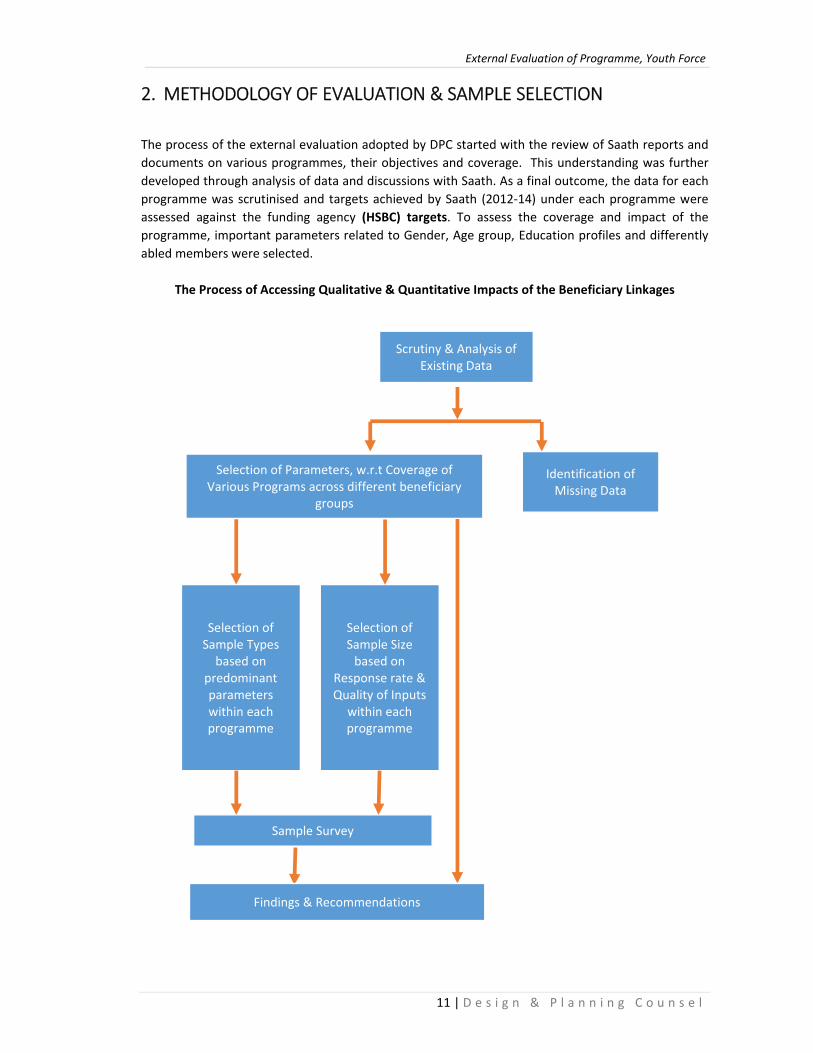
2. METHODOLOGY OF EVALUATION & SAMPLE SELECTION
The process of the external evaluation adopted by DPC started with the review of Saath reports and documents on various programmes, their objectives and coverage. This understanding was further developed through analysis of data and discussions with Saath. As a final outcome, the data for each programme was scrutinised and targets achieved by Saath (2012‐14) under each programme were assessed against the funding agency (HSBC) targets. To assess the coverage and impact of the programme, important parameters related to Gender, Age group, Education profiles and differently abled members were selected.
The Process of Accessing Qualitative & Quantitative Impacts of the Beneficiary Linkages
Scrutiny & Analysis of Existing Data
Selection of Parameters, w.r.t Coverage of Various Programs across different beneficiary
groups
Selection of Sample Types based on
predominant parameters within each programme
Sample Survey
Findings & Recommendations
Selection of Sample Size based on
Response rate & Quality of Inputs
within each programme
Identification of Missing Data
External Evaluation of Programme, Youth Force
12 | D e s i g n & P l a n n i n g C o u n s e l
2.1 Scrutiny & Analysis of Existing Data A total of 24 excel files and 7 pdf reports were provided by Saath for scrutiny covering all the Linkages across two years (2012‐14) within different cities
Details of the 24 Excel files listed below:
• Youth Member, Livelihood, ME, Micro Finance – 2 Excel file • Youth Leader – 3 Excel files • Job Fair – 2 Excel files • Company details across Ahmedabad, Baroda, Rajkot, Mumbai – 1 Excel file each • Analysis sheet – 7 Excel file each
Detail study of all the reports was undertaken to understand the process and objectives behind each programme. All the parameters under each programme were scrutinized and the missing information was identified. This included verification of contact numbers of beneficiaries. An exhaustive list of missing and wrong digit number was made under each programme, before and during the questionnaire survey.
2.2 Parameters for Evaluating Coverage of Programmes
The coverage of programme was assessed with respect to Gender, Age and Education profiles. In certain programmes, few other parameters were also analysed based on the availability of information. For instance, Caste, Community & Economic profiles were analysed for the Youth member linkage. Parameter related to marital status though being an important indicator, was not considered as the data was two years old. (Sample survey highlighted change in marital status of 75% of Female)
Parameters related to dreams, expectations, hobby were not taken into consideration for the analysis. The analysis clearly highlighted profiles of beneficiaries, and coverage of programmes across parameters of gender, age & education profiles. Number of beneficiaries and their growth rate were also listed for each programme.
2.3 Parameters for Questionnaire Survey
Samples were picked based on predominant parameters within each programme like gender, education, age etc. Gender being one of the important parameter across all the programmes, It was attempted to cover more number of female beneficiaries in the survey. The survey was done with the ratio of around 60% females and 40% males. Of the total differently abled members, around 60% of members were also surveyed across all the programmes.
2.4 Sample Size for Questionnaire Survey
Based on the quantum of members and the response rate* across cities– the sample size varies within and across the programmes. To start with, a range for telephonic survey was decided for each programme. However based on the response rate of the members and quality of inputs – the sample size started varying in each city. For instance in Youth Member programme for Surat City: Total Youth members in Surat‐ 537 members. Volume of total calls made ‐ 18% (88 calls). Non‐Successful calls ‐ 11% (54 calls) were ‘Not contactable’ or were ‘Wrong’ contact numbers. ‘Not Contactable’ implies – Members were either busy at work, Not picking up the phone, Disconnects the call, Phone was switched off, Call cannot get connected, or Incoming call facility not available. Successful Calls ‐ 7% (34calls) were successful calls in which qualitative inputs were recorded from the members.
‘Response Rate’* – Rate of successful calls as compared to the ‘Total calls made’
External Evaluation of Programme, Youth Force
13 | D e s i g n & P l a n n i n g C o u n s e l
Total calls made for questionnaire survey (The numbers in bracket denote percentage of the total members to whom calls were made within each programme and city)
City Youth members
Livelihood Micro‐Entrepreneur
Micro‐Finance
Youth Leaders
Registrations for Job Fair
Placements Company
Ahmedabad 66 (7%) 275(7%) 21(14%) 52(2.5%) 14(100%) 162(9%) 10 (100%)
Surat 88(18%) 160(31%) 7(11%) 19(12%) 9(100%) 11(7%) 8(100%)
Baroda 40(6%) 133(4%) 22(26%) 53(8%) 14(100%) 78(6%) 3(100%)
Rajkot 45(13%) 179(33%) 6(26%) 16(5%) 6(100%) 7(4%) 5(100%)
Mumbai 87(14%) 70(9%) 41(44%) 56(11%) 7(100%) 90(7%) 29(100%)
Total 326(10%) 817(8%) 97(23%) 196(5%) 50*(100%) 348(7%) 55(100%)
50*‐ Total Youth leader are 51, but contact information for one member (in Mumbai) was missing.
Final sample size achieved across various linkages programmes
City Youth members
Livelihood Micro‐Entrepreneur
Micro‐Finance
Youth Leaders
Registrations for Job Fair
Placements Company
Ahmedabad 3% 3% 7% 1% 100% 3% 100%
Surat 7% 8% 10% 5% 100% 3% 100%
Baroda 3% 2% 7% 3% 100% 3% 100%
Rajkot 6% 8% 22% 1% 100% 3% 100%
Mumbai 5 % 5% 9% 4% 100% 3% 100%
Total 4% 3% 8% 2% 100% 3% 100%
2.5 Questionnaire Survey
Questionnaire survey was done through telephonic calls and few direct interactions. For the Telephonic survey three phones were used, two separate SIM cards were purchased for the same. The phone calls were made from the following Numbers.
1. +91 – 7048889851 2. +91 – 7048889852 3. 079 – 26762165
Questions were asked in Hindi or Gujarati based on the convenience of the member.Telephonic survey was not limited just to record the verification of the given data. It was stretched to record the qualitative inputs from each member, in terms of their experiences and suggestions. The questions hence formulated were not just limited to taking ‘Yes’ or ‘No’ answers. But in many cases were descriptive to understand the experience of the member during the programme.
Telephonic conversation started with introduction of Saath, Youth force, Yuva (Mumbai) and a brief description about the survey. Respondents were first asked to validate if they were the real participants / beneficiaries of the programme and Secondly, the questions were formulated to understand whether the objectives put forwards by the particular programme have been achieved and sustained or not. Thirdly, there were questions for suggestions on improving the effectiveness of the programmes. The detail questionaries’ for each programme have been listed in Annexure.
External Evaluation of Programme, Youth Force
14 | D e s i g n & P l a n n i n g C o u n s e l
Note: In many cases – during the survey the contact number belonged to the family members – Father, Mother, Elder brother, Elder Sister – in such cases the inputs were recorded. As their inputs were considered equally important to assess the performance of the programme. In many cases – a single Contact number belonged to more than one person, either two sisters, husband‐wife, brother‐sister, two friends shared the same contact number. In such cases, an inquiry was done to cross‐check the correctness of the information
During the questionnaire survey the evaluation team also realized that the qualitative inputs was varying across the cities. Hence, to achieve appropriate response, the number of calls varied in different cities. The percentage of calling varies in all the cities based on their response rates and qualitative inputs received during conversation from the members.
External Evaluation of Programme, Youth Force
15 | D e s i g n & P l a n n i n g C o u n s e l
2.6 Details of Samples Across Various Linkages Programmes
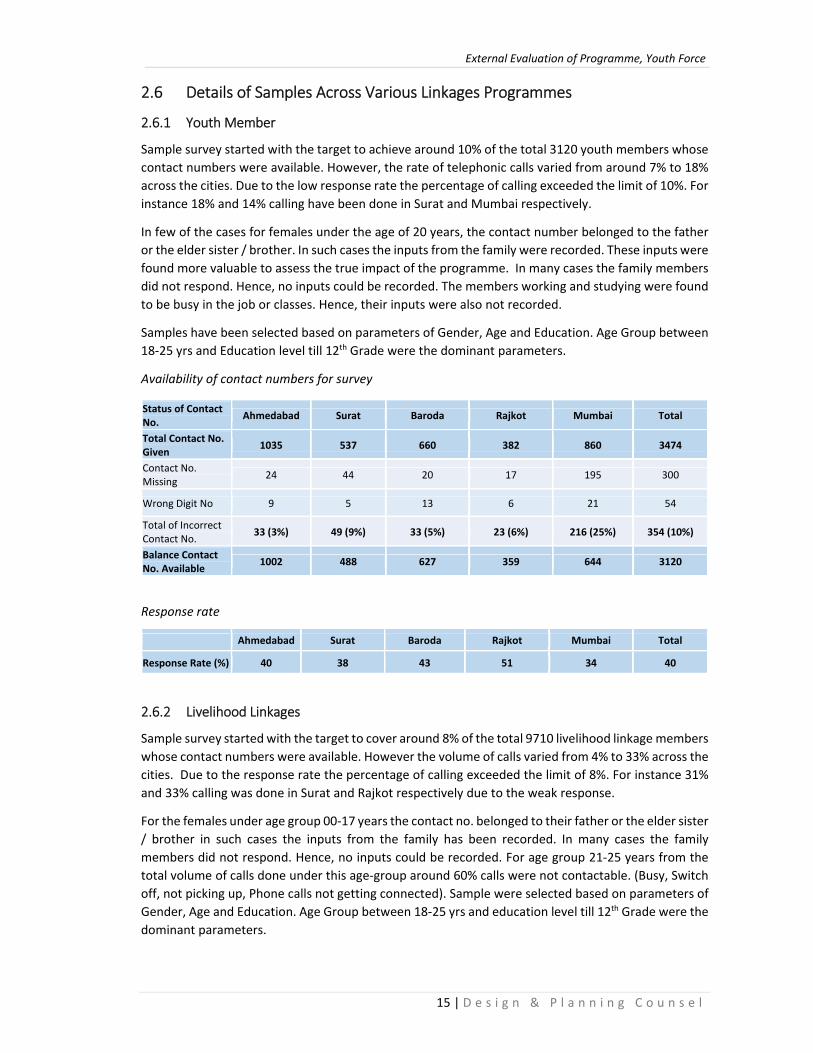
2.6.1 Youth Member
Sample survey started with the target to achieve around 10% of the total 3120 youth members whose contact numbers were available. However, the rate of telephonic calls varied from around 7% to 18% across the cities. Due to the low response rate the percentage of calling exceeded the limit of 10%. For instance 18% and 14% calling have been done in Surat and Mumbai respectively.
In few of the cases for females under the age of 20 years, the contact number belonged to the father or the elder sister / brother. In such cases the inputs from the family were recorded. These inputs were found more valuable to assess the true impact of the programme. In many cases the family members did not respond. Hence, no inputs could be recorded. The members working and studying were found to be busy in the job or classes. Hence, their inputs were also not recorded.
Samples have been selected based on parameters of Gender, Age and Education. Age Group between 18‐25 yrs and Education level till 12th Grade were the dominant parameters.
Availability of contact numbers for survey
Status of Contact No. Ahmedabad Surat Baroda Rajkot Mumbai Total
Total Contact No. Given 1035 537 660 382 860 3474
Contact No. Missing 24 44 20 17 195 300
Wrong Digit No 9 5 13 6 21 54
Total of Incorrect Contact No. 33 (3%) 49 (9%) 33 (5%) 23 (6%) 216 (25%) 354 (10%)
Balance Contact No. Available 1002 488 627 359 644 3120
Response rate
2.6.2 Livelihood Linkages
Sample survey started with the target to cover around 8% of the total 9710 livelihood linkage members whose contact numbers were available. However the volume of calls varied from 4% to 33% across the cities. Due to the response rate the percentage of calling exceeded the limit of 8%. For instance 31% and 33% calling was done in Surat and Rajkot respectively due to the weak response.
For the females under age group 00‐17 years the contact no. belonged to their father or the elder sister / brother in such cases the inputs from the family has been recorded. In many cases the family members did not respond. Hence, no inputs could be recorded. For age group 21‐25 years from the total volume of calls done under this age‐group around 60% calls were not contactable. (Busy, Switch off, not picking up, Phone calls not getting connected). Sample were selected based on parameters of Gender, Age and Education. Age Group between 18‐25 yrs and education level till 12th Grade were the dominant parameters.
Ahmedabad Surat Baroda Rajkot Mumbai Total
Response Rate (%) 40 38 43 51 34 40

External Evaluation of Programme, Youth Force
16 | D e s i g n & P l a n n i n g C o u n s e l
Availability of contact numbers for survey
Response rate
2.6.3 Micro Entrepreneur
Sample survey started with the target to achieve around 8% of the total 418 ME linkages whose contact numbers were available. However, the rate of telephonic calls varies from around 11% to 44% across the cities. Due to response rate the percentage of calling exceeded the limit of 8%. For instance 44% and 26% calling have been done in Mumbai and Baroda respectively due to the weak response.
In Rajkot also 26% of calling was done and the response rate was also found to be good. But the calling was exceeded from the limit of 8% to 26% as no qualitative and positive response was received in initial 8% of calling. Thus, the percentage of calling varies in all the cities based on their response rates and qualitative inputs received during conversation from the members. The Response rate, Qualitative response and Positive response under this programme was found to be weak. This aspect is evident with 23% of volume of calls done across the cities for sample survey. Out of which only 8% successfully recorded the inputs from the members. The sample had to vary from the one considered before starting the survey, to record qualitative inputs from the people. The responses from the youths under 18‐20 yrs of age was good and qualitative. The response from members under the age group of 26‐30 yrs was weak. Hence, the sample varies under this age group.
Availability of contact numbers for survey
Status of Contact No. Ahmedabad Surat Baroda Rajkot Mumbai Total
Total Contact No. Given 159 63 90 37 102 451
Contact No. Missing 3 1 2 11 7 24
Wrong Digit No 3 0 2 3 1 9 Total of Incorrect Contact No. 6 (4%) 1 (1.5%) 4 (4%) 14 (38%) 8 (8%) 33 (7%)
Balance Contact No. Available 153 62 86 23 94 418
Response rate
Ahmedabad Surat Baroda Rajkot Mumbai Total Response Rate (%) 48 86 27 83 20 36
Status of Contact No. Ahmedabad Surat Baroda Rajkot Mumbai Total
Total Contact No. Given 4352 580 3995 601 968 10496
Contact No. Missing 179 56 197 50 141 623
Wrong Digit No 60 6 58 9 30 163
Total of Incorrect Contact No. 239 (5%) 62 (11%) 255 (6%) 59 (10%) 171 (18%) 786 (7%)
Balance Contact No. Available 4113 518 3740 542 797 9710
Ahmedabad Surat Baroda Rajkot Mumbai Total Response Rate (%) 41 26 43 25 53 36

External Evaluation of Programme, Youth Force
17 | D e s i g n & P l a n n i n g C o u n s e l
2.6.4 Micro Finance
Sample survey started with the target to achieve around 6% of the total 3666 micro finance programme beneficiaries. However, the rate of telephonic calls varies from around 5% to 12% across the cities. Due to low response rate, the percentage of calling exceeded the limit of 6%. For instance 12% and 11% calling have been done in Surat and Mumbai respectively.
The response rate in Ahmedabad was also 42%, similar to Surat. However, the percentage of calling in Ahmedabad (8%) was less compared to Surat (12%). Response quality from beneficiaries in 18‐20 yrs age group was better as compared to the other age groups.
Availability of contact numbers for survey
Status of Contact No. Ahmedabad Surat Baroda Rajkot Mumbai Total
Total Contact No. Given 2147 160 696 334 589 3926
Contact No. Missing 109 6 21 4 86 226
Wrong Digit No 5 1 15 4 9 34
Total of Incorrect Contact No. 114(5%) 7(4%) 36(5%) 8 (2%) 65(11%) 260(7%)
Balance Contact No. Available 2033 153 660 326 494 3666
Shortfalls related with the contact Information
Sample of the similar contact numbers with different names
As shown above, similar number with different names were registered for the members. Radom calling was done against these numbers to figure out the issue. “7777992063” Belongs to Gupta Ketan, he had enrolled other members for Micro finance programme. For all the members he had registered his own contact number. In this case verification with other 61 members was not possible as no contact information was available. It was difficult to verify the correct data under this contact number. Hence, the name of any one contact person was used and verified for this kind of numbers.
Response rate
Ahmedabad Surat Baroda Rajkot Mumbai Total
Response Rate (%) 42 42 40 25 38 39
Contact No. Members with
same contact No. 8128323851 4 9714018937 4 9724596966 4 9819203780 4 9913079177 4 8735881027 4 9909673749 4 9998341972 4 9029718584 4
Contact No. Members with same contact No.
7777992063 62 9099303861 18 9898677507 11 8153075822 9 9913757122 8 7383255407 7 8980782751 6 8866947865 5 9274895670 5
External Evaluation of Programme, Youth Force
18 | D e s i g n & P l a n n i n g C o u n s e l
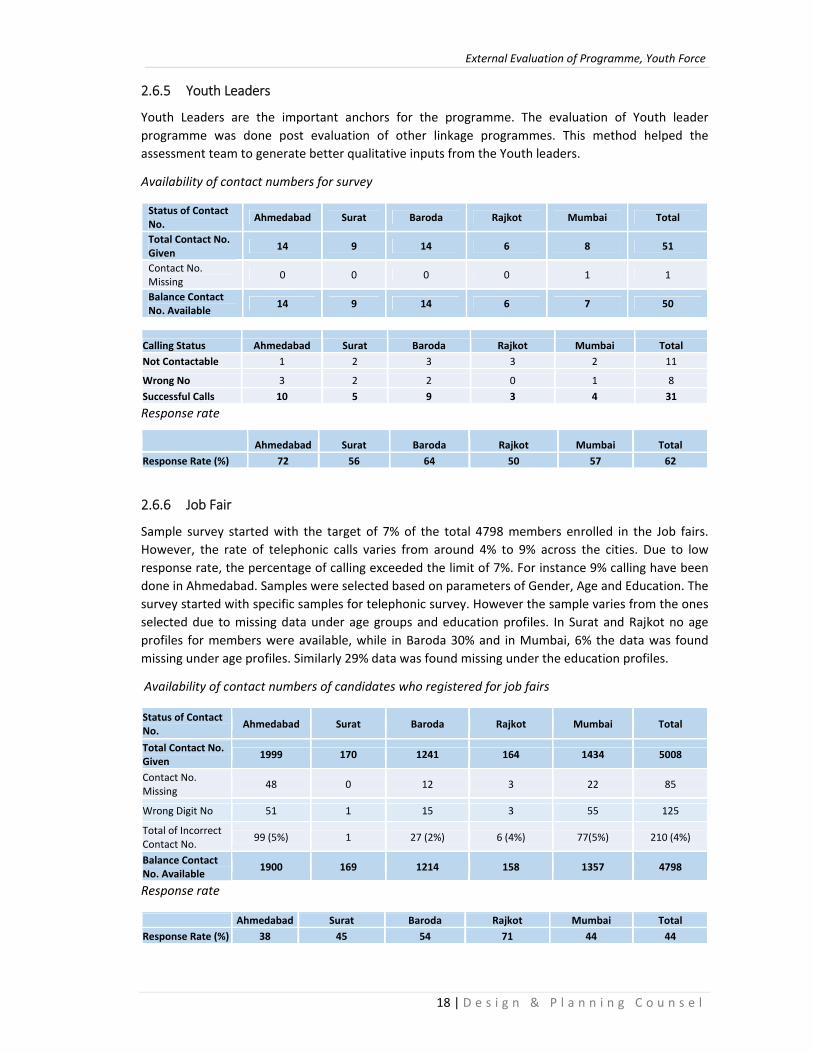
2.6.5 Youth Leaders
Youth Leaders are the important anchors for the programme. The evaluation of Youth leader programme was done post evaluation of other linkage programmes. This method helped the assessment team to generate better qualitative inputs from the Youth leaders.
Availability of contact numbers for survey
Status of Contact No. Ahmedabad Surat Baroda Rajkot Mumbai Total
Total Contact No. Given 14 9 14 6 8 51
Contact No. Missing 0 0 0 0 1 1
Balance Contact No. Available 14 9 14 6 7 50
Response rate
2.6.6 Job Fair
Sample survey started with the target of 7% of the total 4798 members enrolled in the Job fairs. However, the rate of telephonic calls varies from around 4% to 9% across the cities. Due to low response rate, the percentage of calling exceeded the limit of 7%. For instance 9% calling have been done in Ahmedabad. Samples were selected based on parameters of Gender, Age and Education. The survey started with specific samples for telephonic survey. However the sample varies from the ones selected due to missing data under age groups and education profiles. In Surat and Rajkot no age profiles for members were available, while in Baroda 30% and in Mumbai, 6% the data was found missing under age profiles. Similarly 29% data was found missing under the education profiles.
Availability of contact numbers of candidates who registered for job fairs
Status of Contact No. Ahmedabad Surat Baroda Rajkot Mumbai Total
Total Contact No. Given 1999 170 1241 164 1434 5008
Contact No. Missing 48 0 12 3 22 85
Wrong Digit No 51 1 15 3 55 125
Total of Incorrect Contact No. 99 (5%) 1 27 (2%) 6 (4%) 77(5%) 210 (4%)
Balance Contact No. Available 1900 169 1214 158 1357 4798
Response rate
Ahmedabad Surat Baroda Rajkot Mumbai Total Response Rate (%) 38 45 54 71 44 44
Calling Status Ahmedabad Surat Baroda Rajkot Mumbai Total Not Contactable 1 2 3 3 2 11
Wrong No 3 2 2 0 1 8 Successful Calls 10 5 9 3 4 31
Ahmedabad Surat Baroda Rajkot Mumbai Total Response Rate (%) 72 56 64 50 57 62

External Evaluation of Programme, Youth Force
19 | D e s i g n & P l a n n i n g C o u n s e l
2.6.7 Company Placements
For the Company Placements all 55 firms were contacted and response from 17 were successfully recorded.
Availability of contact numbers for survey
Calling Status Ahmedabad Surat Baroda Rajkot Mumbai Total Not Contactable 5 5 1 5 18 34 Wrong Co. No 0 0 1 0 3 4 Successful Calls 5 3 0 0 5 17
Percentage of successful calls
Calling Status Ahmedabad Surat Baroda Rajkot Mumbai Total
Successful Calls 50% 38% 0% 0% 19% 33%
Status of Contact No.26 Ahmedabad Surat Baroda Rajkot Mumbai Total
Total Contact No. Given 10 8 3 5 29 55
Wrong Digit No. 0 0 1 0 3 4 Balance Contact No. Available 10 8 2 5 26 51
External Evaluation of Programme, Youth Force
20 | D e s i g n & P l a n n i n g C o u n s e l
3. FINDINGS AND RECOMMENDATIONS
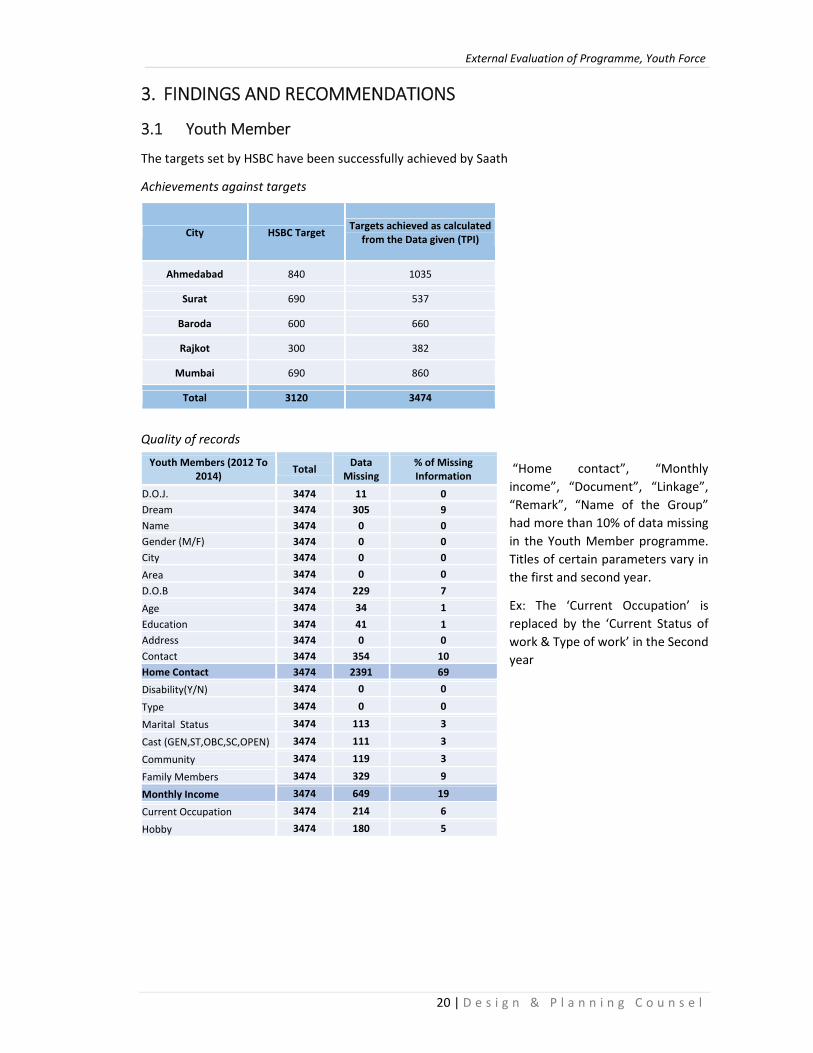
3.1 Youth Member
The targets set by HSBC have been successfully achieved by Saath
Achievements against targets
Quality of records
“Home contact”, “Monthly income”, “Document”, “Linkage”, “Remark”, “Name of the Group” had more than 10% of data missing in the Youth Member programme. Titles of certain parameters vary in the first and second year.
Ex: The ‘Current Occupation’ is replaced by the ‘Current Status of work & Type of work’ in the Second year
City HSBC Target Targets achieved as calculated from the Data given (TPI)
Ahmedabad 840 1035
Surat 690 537
Baroda 600 660
Rajkot 300 382
Mumbai 690 860
Total 3120 3474
Youth Members (2012 To 2014) Total Data
Missing % of Missing Information
D.O.J. 3474 11 0 Dream 3474 305 9 Name 3474 0 0 Gender (M/F) 3474 0 0 City 3474 0 0 Area 3474 0 0 D.O.B 3474 229 7 Age 3474 34 1 Education 3474 41 1 Address 3474 0 0 Contact 3474 354 10 Home Contact 3474 2391 69 Disability(Y/N) 3474 0 0 Type 3474 0 0 Marital Status 3474 113 3 Cast (GEN,ST,OBC,SC,OPEN) 3474 111 3 Community 3474 119 3 Family Members 3474 329 9 Monthly Income 3474 649 19 Current Occupation 3474 214 6 Hobby 3474 180 5
External Evaluation of Programme, Youth Force
21 | D e s i g n & P l a n n i n g C o u n s e l
Distribution and growth rate of the youth member programme
Number of Youth Members across various cities
Distribution of Youth Members across various cities
Years Ahmedabad (%) Surat (%) Baroda (%) Rajkot (%) Mumbai (%) Over All 30 15 19 11 25
Growth rate
Years Ahmedabad (%) Surat (%) Baroda (%) Rajkot (%) Mumbai (%) Over All Over All 257% 170% 165% 148% 231% 202% In the year 2012‐13, Ahmedabad had maximum share of total youth members. In the next year 2013‐14, there has been 202% increase in the number of members across all the cities. Ahmedabad constituted maximum 257% growth, while Rajkot shared 148% growth in the number of youth members.
Coverage of Youth member programme across different caste and communities
Caste No %
SC 868 25
ST 219 6
BC/OBC 715 21
Minority 194 6
General 1359 39
Data Missing 119 3
Total 3474 100
SC & BC/OBC together constituted 46% of the total youth members. The General caste category had 39% of the total youth members. Across communities, 12% members were from Muslim community and 84% were from Hindu Community.
Coverage of the Youth member programme based on gender profiles
Female / Male participation
Gender Ahmedabad (%) Surat (%) Baroda (%) Rajkot (%) Mumbai (%) Over All Female 36 40 44 52 39 41% Male 64 60 56 48 61 59%
Overall female participation is 41% as compared to 59% of males. However Rajkot showed highest female participation rate with 52%. Ahmedabad and Mumbai have lower than average participation of female members across the cities.
Years Ahmedabad Surat Baroda Rajkot Mumbai Total 2012‐2013 290 199 249 154 260 1152
2013‐2014 745 338 411 228 600 2322 Total 1035 537 660 382 860 3474
Community No %
Hindu 2901 84
Muslim 410 12
Christian 15 0.4
Data Missing 148 4
Total 3474 100
External Evaluation of Programme, Youth Force
22 | D e s i g n & P l a n n i n g C o u n s e l
Coverage of Youth member programme based on age groups
Age group profiles
Age‐(Slab) Ahmedabad (%) Surat (%) Baroda (%) Rajkot (%) Mumbai (%) Over All (%) 00‐17 3 7 3 3 14 6 18‐20 41 47 44 46 41 43 21‐25 33 29 35 35 30 33 26‐30 15 12 12 12 10 12 31‐35 8 5 6 4 3 5
Data Missing 0 0 0 0 2 1
18‐20 years and 21‐25 years forms the predominant age groups. 76% of the youth members fall under these age groups. The coverage of the programme was least among the youths under 18 years and above 31 years of age.
Coverage of Youth member programme based on education profiles
Education profiles
Education ‐ Slab Ahmedabad (%) Surat (%) Baroda (%) Rajkot (%) Mumbai (%) Over All 00‐09 grade 19 31 16 23 34 24 10‐12 grade 42 51 45 25 49 44 Graduation 29 16 35 34 16 26 Masters 5 1 3 14 0 4 Studying 5 0 1 3 0 2 Data Missing* 0 1 0 1 1 0
The coverage of the programme is highest among youths educated till 12th Grade. 24% of youths covered in the programme were less than 10th grade educated. However, in Rajkot 34% of youths were graduates. In Baroda also the programme has covered more graduate youths.
Note: The programme rightly targets the youths with less education. However graduate youth also showed equal interest. The questionnaire survey suggests that the graduate youths join Youth force for company, friends and leisure time. This group of educated members were found to active in participation and acted as a source of inspiration for other members.
Gender & Education profile within pre‐dominant age groups
Age‐(Slab) Gender (M/F) 00‐09 (%) 10‐12(%) Graduation (%) Masters (%) Studying (%)
18‐20 yrs Female (40%) 27 46 24 0 3
Male (60%) 14 52 30 1 3
21‐25yrs Female (36%) 31 29 30 8 2
Male (64%) 19 39 32 8 2
The analysis showed that within 18‐20 years age group – 46% of females were educated between 10th‐ 12th. The sample survey showed that these females were generally unmarried and had opportunities for further studies due to young age.
External Evaluation of Programme, Youth Force
23 | D e s i g n & P l a n n i n g C o u n s e l
In the 21‐25 years age bracket, only 29% females were educated between 10th‐12th. Females under this age group were generally house‐wives. The sample survey covering these females clearly showed that Youth force has played an important role in providing them personal development, exposure to the society, and many of them have got connected to Livelihood linkage programme. They are presently self‐employed, working from home.
3.1.1 Findings Based on the Questionnaire survey
Ahmedabad (%) Surat (%) Baroda (%) Rajkot (%) Mumbai (%) Over All Respondents who confirmed getting enrolled with Youth member programme
92% 32% 88% 91% 77% 72%
Members who actually participated in Youth force activities after getting enrolled
50% 91% 80% 76% 83% 73%
Members who agreed to have benefited from activities
45% 80% 80% 95% 60% 86%
Members who are currently active
33% 10% 27% 57% 39% 35%
a. Confirmation of the enrolled members Q1 – “Did you get enrolled with Youth member?” After giving a brief introduction about the Survey, Youth force and Saath, conversation was initiated with the verification of the name of the member and if he/she was part of the Youth Force.
72% of the respondents confirmed getting enrolled while 28% denied having joined Youth force. Ahmedabad and Rajkot respondents showed more than 90% positive response while 88% of respondents from Baroda and 77% from Mumbai confirmed getting enrolled. Surat was very weak with only 32% of the respondents replying in affirmative.
b. Confirmation in activity participation organized for the enrolled members Q2 – “What activities did you participate after joining Youth force?” A brief introduction regarding the Activities, Competitions, Trips, Exposure visits, Workshops and Seminars was given. Verification of participation was done by asking if the member had participated in any of the activities.
Out of the total Youth members, 73% said to have participated in various activities. 27% of the youth members who did not participate, gave multiple reasons for the same like: many of them had just filled the form, were busy with study, work and in many cases women were busy with their children. Surat had maximum 91% participation of youth members in various activities. Mumbai 83%, Rajkot 76% and Baroda had 80% participation by youth members after joining the youth force. In Ahmedabad 50% youth members said to have participated in various activities and programmes after joining the Youth force.
Youth members in Safai Abhiyan at Ahmedabad Source: Saath

External Evaluation of Programme, Youth Force
24 | D e s i g n & P l a n n i n g C o u n s e l
c. Benefits from the programme Q3 – “What benefit did you get after attending activities or being a part of the Youth force?” Members were asked about the benefits from being part of the Youth force. Ex: During the course did you meet people, made friends or have you learnt new things etc.
86% of the Youth members across the cities gave positive response, and said to have benefited in terms of personal development, exposure to new things, making new friends, knowing people and working in a group. Out of the above, 58% were female members. Youth members, especially female members responded that earlier they never use to go out and talk with anyone. However, after attending the programs and activities they have gained confidence. During the conversation, a girl responded that she gained confidence to talk and present her ideas in the group. Many of them had never gone outside their city or town they belonged, due to the trips and visits, they got an opportunity to go visit different places, they now feel confident to move alone anywhere.
In Rajkot around 95% of youth members agreed to have benefited after joining the programme. While in Mumbai, Surat and Baroda the range varies from 60% to 80%. In Ahmedabad around 45% youth members gained from the programme. Around 10% of the Youth members across the cities also said to have got enrolled with livelihood linkages after joining the Youth force.
d. Activeness / Regularity of the member Q4 – Do you presently attend the programs and Sunday activities of Youth force? If ‘No’ – why not? Overall 35% of the Youth members were active and regularly attended programs or activities. In Rajkot 57% of Youth members said that they were currently active in the programs. In Ahmedabad, Baroda and Mumbai around 35% of the members were currently active. Busy lifestyle was recorded as the main reasons for the low participation rate, members were busy with work and study, and women were busy with family and children.
In Surat only 10% of Youth members said that they were currently active. Many of them complained about the center not working. It was also recorded that the new activities and programs were not organized because no youth leaders were present in the area. This input was recorded from Kosad and Pandesara area. However, during conversation with Youth leaders, no negative inputs for low participation rate of youth members was recorded from their side. e. Propagation Q5‐ How did you get the information regarding Youth force? Across the cities, around 43% of propagation was through Youth members, 21% through friends, 18% was through Leaders and rest through pamphlets and newspapers. In Ahmedabad and Rajkot Youth Leaders were found to be active in propagating the programs. Many of the members came to know about the linkage programme through Youth leaders. While in Mumbai and Baroda Youth members were more active in propagating the programs.
Sketch by Youth Members representing the centers in Odhav Area. Source: DPC
External Evaluation of Programme, Youth Force
25 | D e s i g n & P l a n n i n g C o u n s e l
f. Internal communication system Q6 ‐How are you informed regarding any youth activities? Across the cities, around 60% of the Youth members said that they received regular messages through phones, friends, leaders and other youth members regarding schedule of activities being organized. Many of them received personal calls from the centers. In Rajkot the internal communication was better with 55% members receiving regular messages, in Ahmedabad and Mumbai it ranges around 30% to 40% and in Baroda it ranges around 15%. In Surat the communication was found to be very weak. The members said that they were not regularly informed regarding the activities.
g. Inputs from differently ‐ able Members
A total of 29 differently abled Youth members were enrolled in the programme.
Out of the total 29 differently abled members, Contact numbers of 4 were wrong / missing. A total of 19 members were called, however 12 members were “not contactable”. (Not picking up call, Busy, Switch off, Wrong co. Number, Number not getting connected). Finally Inputs from 7 members (24% of the differently abled members enrolled) has been recorded.
All the 7 members (100% respondents) gave very positive inputs. Most of these members were active participants in the programs and activities. Many of them got enrolled with livelihood courses after joining Youth force
3.1.2 Recommendations
Ahmedabad and Baroda: Organization of activities based on convenience of the youth members may be more beneficial to increase the participation. Family based activities / trips may be more beneficial.
Surat: Surat should focus on periodic organization of various activities & a better communication system among the members. Rajkot: Rajkot may focus on increasing the membership.
Mumbai: Travelling distance and busy life‐style was cited as the main reason behind people not able to attend the activities. Establishment of more Centers might increase the participation of members.
Case: Parmar Dipika Maganbhai, Odhav, Ahmedabad (Affected with Polio, Left leg)
Dipika Parmar at Odhav Center , Source: DPC
Dipika is active as a Youth member and attends the programs and activities whenever she finds time from her work. According to her, she gained confidence to talk and communicate with others after attending various programs and seminars done at Youth force. She was able to gain basic knowledge of how to use the bank, how to get a bank‐account, how to use ATM machine. She also shared that the exposure trips helped her to learn new things, new people and work in a group. Now she feels confident to move around alone for her work. Due to her very good experience with the linkage programme she has helped many other members get enrolled with Youth force.

External Evaluation of Programme, Youth Force
26 | D e s i g n & P l a n n i n g C o u n s e l
3.2 Livelihood Linkages
The targets set by HSBC have been successfully achieved by Saath
Achievements against the targets
City HSBC Target Targets achieved as calculated from the Data given (TPI)
Ahmedabad 4000 4352 Surat 2000 580 Baroda 4000 3995 Rajkot 2000 601 Mumbai 1000 968 Total 13000 10496
Quality of records
Each of the organisation providing livelihood linkage has followed a different system to record the information. Therefore analysing the information with common head of the parameters was difficult. Certain parameters related to Family occupation, Past occupation, Placements received, Monthly salary were found to important parameters to be considered while data analysis and selecting the sample survey. However, the information in each of this parameter was missing.
Livelihood (2012 To 2014) Total Data
Missing % of Missing Data
City 10496 0 0 Centre Address 10496 2651 25 Batch No. 10496 3326 32 Course 10496 2653 25 Name 10496 4 0 Address 10496 119 1 Phone 10496 786 7 Email 10496 10205 97 Age 10496 529 5 Gender (M/F) 10496 298 3 Caste 10496 3337 32 Disability Type 10496 0 0 Disability 10496 0 0 Education 10496 723 7 Past Occupation 10496 8588 82
Father /Husband 10496 6209 59
Mother 10496 6661 63
Company Name 10496 5408 52
Company Address 10496 8596 82
Contact person 10496 6680 64
Phone 10496 7613 73
Email 10496 10458 100
Salary 10496 5832 56 Post 10496 6806 65 Part Time Full Time 10496 9369 89
Joining Month 10496 9919 95 Leaving Month 10496 10496 100
External Evaluation of Programme, Youth Force
27 | D e s i g n & P l a n n i n g C o u n s e l
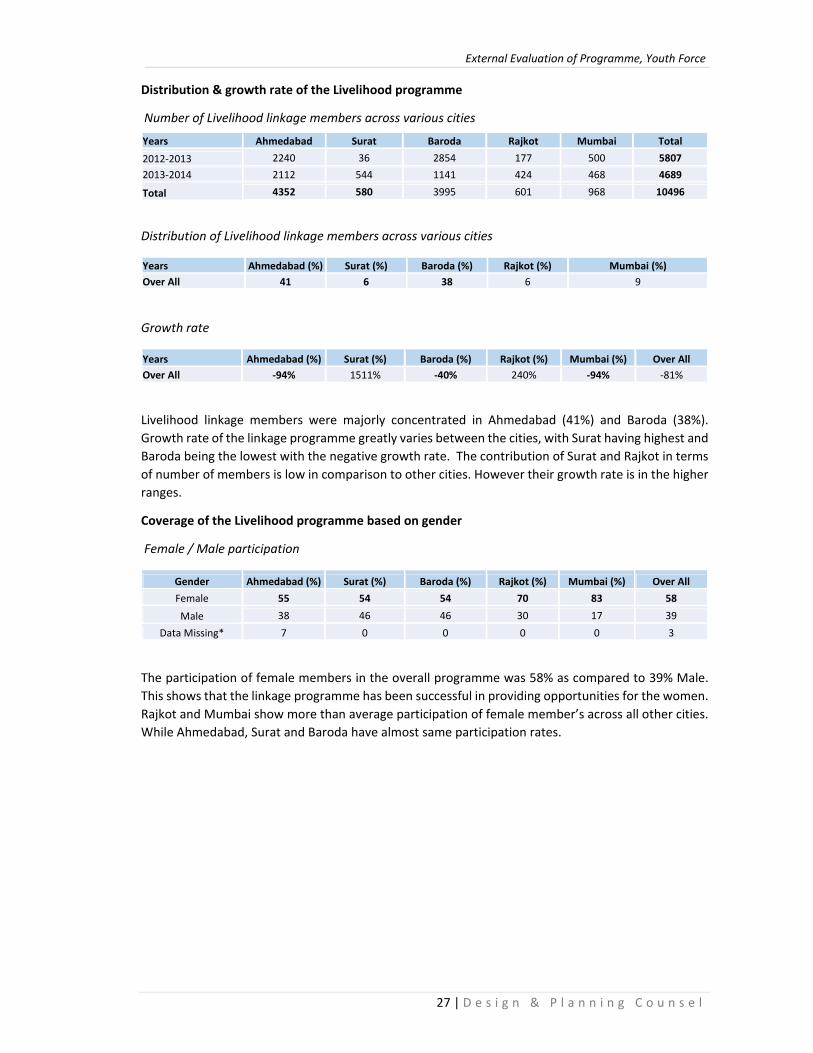
Distribution & growth rate of the Livelihood programme
Number of Livelihood linkage members across various cities
Distribution of Livelihood linkage members across various cities
Years Ahmedabad (%) Surat (%) Baroda (%) Rajkot (%) Mumbai (%) Over All 41 6 38 6 9
Growth rate
Years Ahmedabad (%) Surat (%) Baroda (%) Rajkot (%) Mumbai (%) Over All Over All ‐94% 1511% ‐40% 240% ‐94% ‐81%
Livelihood linkage members were majorly concentrated in Ahmedabad (41%) and Baroda (38%). Growth rate of the linkage programme greatly varies between the cities, with Surat having highest and Baroda being the lowest with the negative growth rate. The contribution of Surat and Rajkot in terms of number of members is low in comparison to other cities. However their growth rate is in the higher ranges.
Coverage of the Livelihood programme based on gender
Female / Male participation
Gender Ahmedabad (%) Surat (%) Baroda (%) Rajkot (%) Mumbai (%) Over All Female 55 54 54 70 83 58 Male 38 46 46 30 17 39
Data Missing* 7 0 0 0 0 3
The participation of female members in the overall programme was 58% as compared to 39% Male. This shows that the linkage programme has been successful in providing opportunities for the women. Rajkot and Mumbai show more than average participation of female member’s across all other cities. While Ahmedabad, Surat and Baroda have almost same participation rates.
Years Ahmedabad Surat Baroda Rajkot Mumbai Total 2012‐2013 2240 36 2854 177 500 5807 2013‐2014 2112 544 1141 424 468 4689 Total 4352 580 3995 601 968 10496
External Evaluation of Programme, Youth Force
28 | D e s i g n & P l a n n i n g C o u n s e l
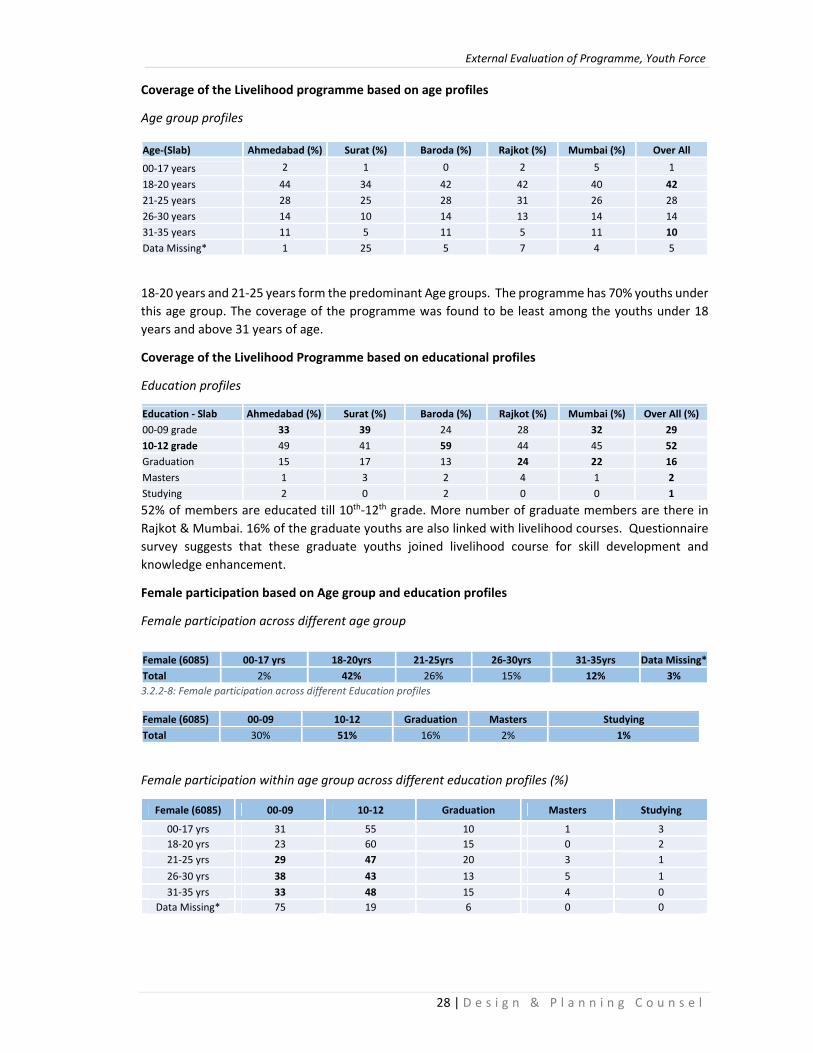
Coverage of the Livelihood programme based on age profiles
Age group profiles
18‐20 years and 21‐25 years form the predominant Age groups. The programme has 70% youths under this age group. The coverage of the programme was found to be least among the youths under 18 years and above 31 years of age.
Coverage of the Livelihood Programme based on educational profiles
Education profiles
52% of members are educated till 10th‐12th grade. More number of graduate members are there in Rajkot & Mumbai. 16% of the graduate youths are also linked with livelihood courses. Questionnaire survey suggests that these graduate youths joined livelihood course for skill development and knowledge enhancement.
Female participation based on Age group and education profiles
Female participation across different age group
3.2.2‐8: Female participation across different Education profiles
Female (6085) 00‐09 10‐12 Graduation Masters Studying Total 30% 51% 16% 2% 1%
Female participation within age group across different education profiles (%)
Age‐(Slab) Ahmedabad (%) Surat (%) Baroda (%) Rajkot (%) Mumbai (%) Over All 00‐17 years 2 1 0 2 5 1 18‐20 years 44 34 42 42 40 42 21‐25 years 28 25 28 31 26 28 26‐30 years 14 10 14 13 14 14 31‐35 years 11 5 11 5 11 10 Data Missing* 1 25 5 7 4 5
Education ‐ Slab Ahmedabad (%) Surat (%) Baroda (%) Rajkot (%) Mumbai (%) Over All (%) 00‐09 grade 33 39 24 28 32 29 10‐12 grade 49 41 59 44 45 52 Graduation 15 17 13 24 22 16 Masters 1 3 2 4 1 2 Studying 2 0 2 0 0 1
Female (6085) 00‐17 yrs 18‐20yrs 21‐25yrs 26‐30yrs 31‐35yrs Data Missing*Total 2% 42% 26% 15% 12% 3%
Female (6085) 00‐09 10‐12 Graduation Masters Studying
00‐17 yrs 31 55 10 1 3 18‐20 yrs 23 60 15 0 2 21‐25 yrs 29 47 20 3 1 26‐30 yrs 38 43 13 5 1 31‐35 yrs 33 48 15 4 0
Data Missing* 75 19 6 0 0
External Evaluation of Programme, Youth Force
29 | D e s i g n & P l a n n i n g C o u n s e l
68% of the female participation was spread across 18‐20 years (42%) and 21‐25 years (26%) age groups. The analysis shows that across all the age groups majority of the women were educated till 12th grade. Females under the age group (21‐35 years) have less opportunities for higher education. Questionnaire survey suggests many females joined the training course for skill development and knowledge enhancement. Many Females under this age group have benefited from the training course and have started working from home.
3.2.1 Findings Based on Questionnaire Survey
Ahmedabad (%) Surat (%) Baroda (%) Rajkot (%) Mumbai (%) Over All Respondents who confirmed getting enrolled with livelihood programme
84% 62% 96% 66% 38% 75%
Members who agreed to have benefited from activities
73% 87% 86% 86% 96% 82%
Propagation of programme by the members to their friends and Family‐ Percentage of members who helped Friends & Family members to get enrolled in livelihood programme
60% 88% 91% 76% 57% 73%
Connection with other Linkage programs‐ Have you done any other Training course or enrolled with any other Linkage programs?
5% 10% 21% 2% 16% 10%
Participation of ‘Youth members’ in the ‘Linkage programme’‐ are you also connected to youth force
16% 40% 26% 7% 27% 21%
a. Confirmation of the enrollment of members Q1 – Have you taken Training with any Organization? (With Name) Overall 75% of the respondents confirmed getting enrolled in the programme.96% of the respondents from Baroda gave positive response while 84% of respondents from Ahmedabad acknowledged getting enrolled with the training course. In Rajkot 66% of positive response has been recorded from the respondents. However only 38% respondents from Mumbai confirmed getting enrolled for training. b. Benefits from the training courses Q2 ‐ Did you benefit from the training course? After the verification of the training course, the member was asked about the quality and regularity of the training course in terms of whether the faculty was good and regular, did the faculty help them understand things. The duration of the course, if certificates were obtained by the members or not. After a brief conversation, members were asked if the training course helped them in any ways. Benefit was assessed in terms of skill development, knowledge enhancement and increase in employment opportunities after training course.
82% of members who took training agreed to have gained from the training course, while for 18% members the training course was not very helpful. 8% of the members who got training complained about not receiving the Certificate or about getting certificates with wrong names. In Ahmedabad around 75% of members gained from the training courses. In Surat, Rajkot and Baroda around 87% members who took training gained from the training. Mumbai was highest with 96% members agreed to have gained from the training.
External Evaluation of Programme, Youth Force
30 | D e s i g n & P l a n n i n g C o u n s e l
c. Propagation of programme by the beneficiaries to their friends and Family Q3 –Did you enroll / inform other Friends & Family members to do the training courses? The positive response indicates the success of the training programme. Members who benefitted from the course shared their experiences with others and helped others get enrolled with the training course. 75% of members helped other friends and family to get enrolled for the training course. In Surat and Baroda around 85% of members helped their family and friends get enrolled with the same training course. While in Rajkot, Mumbai and Ahmedabad around 60% to 75% of members helped their family and friends get enrolled with the training course.
d. Connection with other Linkage programs Q4 – Have you done any other Training course or enrolled with any other Linkage programs? Only 10% of the total Youth members were enrolled with other training courses. 21% of members in Baroda and 16% members in Mumbai were enrolled with other linkage programmes of Youth force. In Surat around 10%, Ahmedabad 5% and in Rajkot 2% of the members were linked with other programmes of Youth force.
e. Participation of ‘Youth members’ in the ‘Linkage programme’ Q5 – Are you also connected to Youth Force, are you also a youth member? The responses helped to assess and understand the percentage of people passing through more than one linkage programme.
Overall 21% of members linked to livelihood course were also part of Youth force. In Surat around 40% members were also linked to Youth force. In Mumbai and Baroda around 26% and Ahmedabad around 16% members were part of the Youth force. In Rajkot 7% of the members were also part of Youth force.
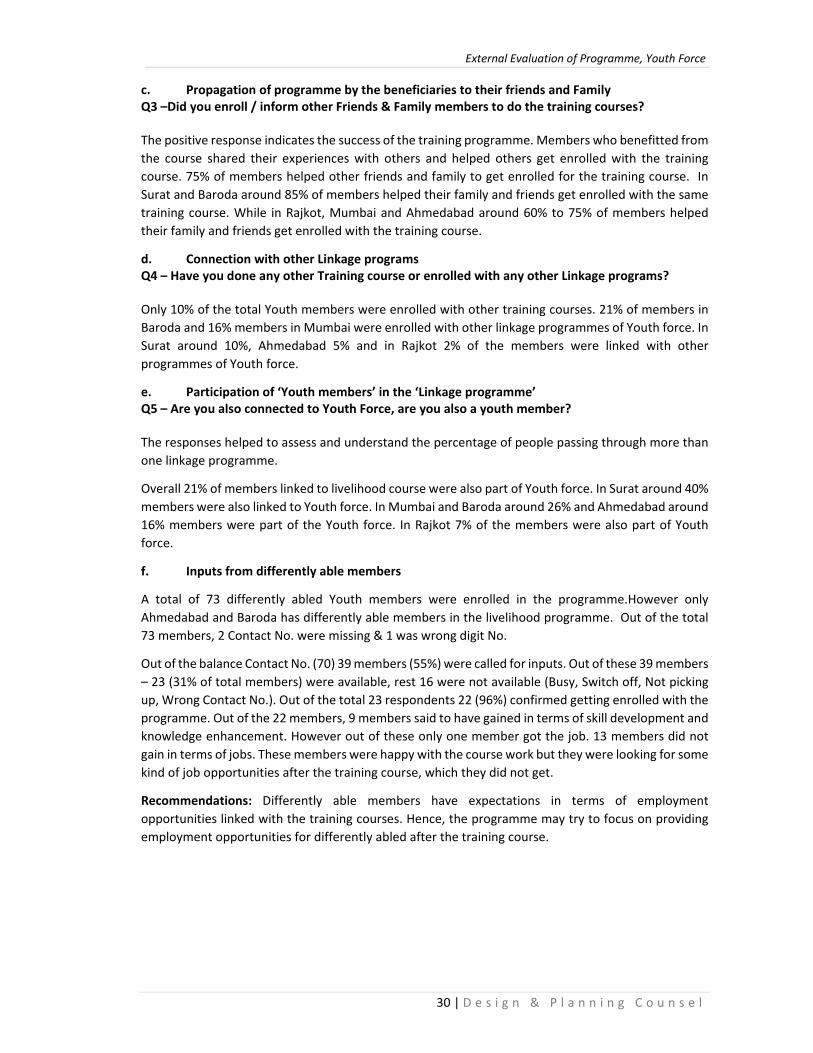
f. Inputs from differently able members
A total of 73 differently abled Youth members were enrolled in the programme.However only Ahmedabad and Baroda has differently able members in the livelihood programme. Out of the total 73 members, 2 Contact No. were missing & 1 was wrong digit No.
Out of the balance Contact No. (70) 39 members (55%) were called for inputs. Out of these 39 members – 23 (31% of total members) were available, rest 16 were not available (Busy, Switch off, Not picking up, Wrong Contact No.). Out of the total 23 respondents 22 (96%) confirmed getting enrolled with the programme. Out of the 22 members, 9 members said to have gained in terms of skill development and knowledge enhancement. However out of these only one member got the job. 13 members did not gain in terms of jobs. These members were happy with the course work but they were looking for some kind of job opportunities after the training course, which they did not get.
Recommendations: Differently able members have expectations in terms of employment opportunities linked with the training courses. Hence, the programme may try to focus on providing employment opportunities for differently abled after the training course.

External Evaluation of Programme, Youth Force
31 | D e s i g n & P l a n n i n g C o u n s e l
Case 1: – Visit to Odhav Center, Ahmedabad
Odhav center at Ahmedabad was visited by DPC team. At the Center, initially three courses were being taught, Retail Management, Beauty Parlour and ITS course (basics in computer). Presently, two batches were being held for Retail management and Beauty Parlour. One batch in the morning and other afternoon. The strength of each batch varied from 15‐20 students. While conversing with the students, all of them were found to be active members of Youth Force and participated in the activities undertaken by Youth Force. The information of the enrolled students was maintained in the register as well as in soft copies. The instructor for Retail Management course Mr. Yogeshbhai, added that in his course majority of them were girls and all the students have been regular. The strength of the students within the age group of 20‐22 years was found to be maximum.
Positive inputs were recorded from the women attending the Beauty Parlour course. The classes were regularly conducted and teacher have been helpful. Children were allowed to attend the course with the mothers. The women were eager to complete the training course and start their own parlour from home. Enrolment for the batch has been limited to 20 students which is a good ratio for one to one communication with the teacher.
Case 2: – Visit to Juhapura Center, Ahmedabad
The center at Juhapura is being co‐ordinated by the youth leader Afrozben.
Presently at the center all the offered training courses were completed. No new course is being currently offered. Due to the holy month of Ramazan majority of the people belonging to the Muslim community did not enrol for any course.
Based on the inputs from Afroz ben, female participation has been maximum for the training courses. These women were regular and enthusiastic during the course work. Many of them have started working from home as they were not allowed to work outside their house.
The center was presently involved with providing placements and counselling to the students who had completed the training courses.
Retail Management course at the Odhav Center, Ahmedabad Source: DPC
Register of enrolled students , Source: DPC
In conversation with the Youth Leader‐ Afrozben , instructor Deepa Panchal‐ Juhapura, Ahmedabad Source: DPC
Beauty Parlour class in Juhapura center, Ahmedabad Source: DPC
External Evaluation of Programme, Youth Force
32 | D e s i g n & P l a n n i n g C o u n s e l
3.2.2 Recommendations
Females should be encouraged to opt for skill based course which can also provide better employment opportunities as the members gauge the benefits in terms of employment opportunities after the course work.
The livelihood linkage programme can offer certain courses which are skilled based and for knowledge enhancement. While there could be certain courses which provide assured job opportunities with certain pre‐requisite conditions like regularity, passing in the exam to test their performance after course work, continuity of the job for at least 2‐3months after joining etc.
Mumbai data was not very authentic. Hence, the programme coordinators should try to verify the given data. Similarly, Surat and Rajkot coordinators should also try to verify the correctness of the given data.

External Evaluation of Programme, Youth Force
33 | D e s i g n & P l a n n i n g C o u n s e l
3.3 Micro Entrepreneur
Achievements against the targets
The targets set by HSBC have been achieved by Saath
Quality of records
Distribution & Growth rate of the Micro Entrepreneur programme across cities
Number of Micro Entrepreneur linkages across cities
Distribution of Micro Entrepreneur linkages across cities
Years Ahmedabad (%) Surat (%) Baroda (%) Rajkot (%) Mumbai (%) Over All 35 14 20 8 23
Growth rate
Years Ahmedabad (%) Surat (%) Baroda (%) Rajkot (%) Mumbai (%) Over All Over All 165% 125% 125% ‐48% 132% 129%
Ahmedabad had highest share of members in Micro Entrepreneur programme (35%), while Rajkot has least (8%). The overall growth rate was 129%. Ahmedabad shows highest 165% growth in one year, while Rajkot has negative growth (‐48%) in the ME linkage programme participation.
City HSBC Target Targets as calculated from the Data given (TPI)
Ahmedabad 80 159
Surat 80 63
Baroda 80 90 Rajkot 80 37 Mumbai 80 102 Total 400 451
Micro Entrepreneur (2012 To 2014)
Total Data Missing % of Missing Data
Form No. 451 184 41 D.O.J. 451 50 11 Dream 451 78 17 Name 451 0 0 Gender (M/F) 451 0 0 City 451 0 0 Area 451 1 0 D.O.B 451 14 3 Age 451 6 1 Education 451 48 11 Address 451 2 0 Contact 451 33 7
Years Ahmedabad Surat Baroda Rajkot Mumbai Total 2012‐2013 60 28 40 25 44 197 2013‐2014 99 35 50 12 58 254
Total 159 63 90 37 102 451
External Evaluation of Programme, Youth Force
34 | D e s i g n & P l a n n i n g C o u n s e l
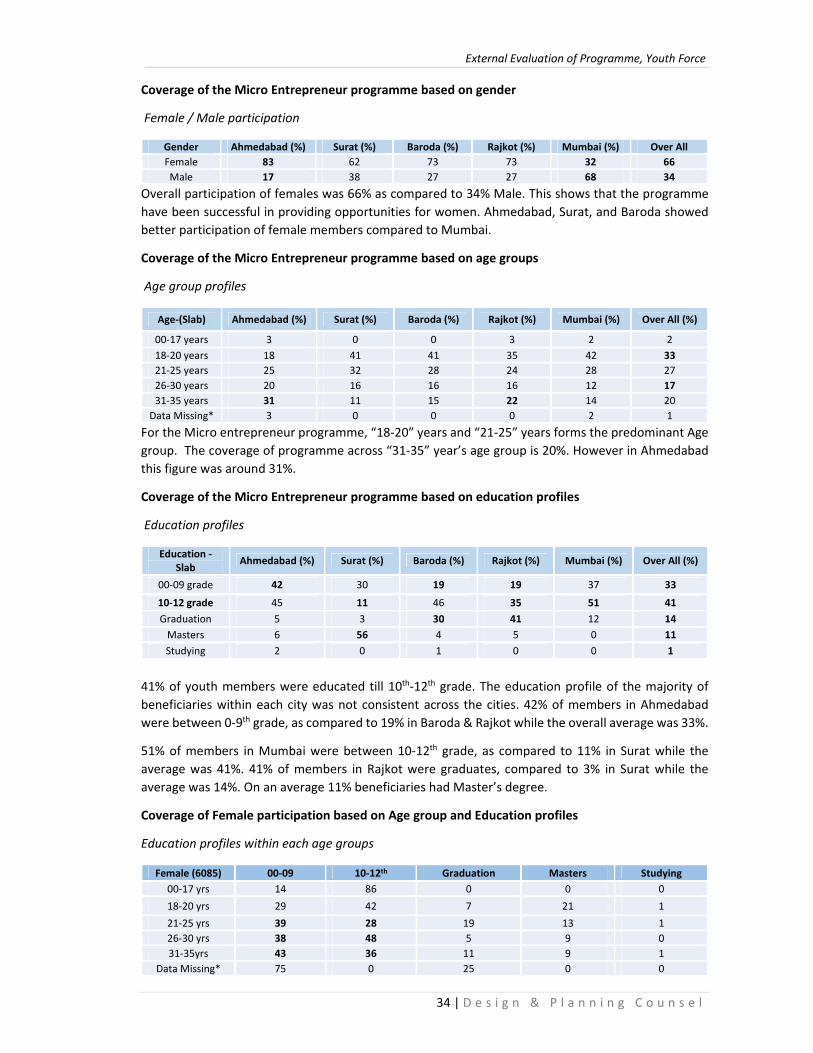
Coverage of the Micro Entrepreneur programme based on gender
Female / Male participation
Gender Ahmedabad (%) Surat (%) Baroda (%) Rajkot (%) Mumbai (%) Over All Female 83 62 73 73 32 66Male 17 38 27 27 68 34
Overall participation of females was 66% as compared to 34% Male. This shows that the programme have been successful in providing opportunities for women. Ahmedabad, Surat, and Baroda showed better participation of female members compared to Mumbai.
Coverage of the Micro Entrepreneur programme based on age groups
Age group profiles
Age‐(Slab) Ahmedabad (%) Surat (%) Baroda (%) Rajkot (%) Mumbai (%) Over All (%)
00‐17 years 3 0 0 3 2 2 18‐20 years 18 41 41 35 42 33 21‐25 years 25 32 28 24 28 2726‐30 years 20 16 16 16 12 17 31‐35 years 31 11 15 22 14 20Data Missing* 3 0 0 0 2 1
For the Micro entrepreneur programme, “18‐20” years and “21‐25” years forms the predominant Age group. The coverage of programme across “31‐35” year’s age group is 20%. However in Ahmedabad this figure was around 31%.
Coverage of the Micro Entrepreneur programme based on education profiles
Education profiles
Education ‐ Slab Ahmedabad (%) Surat (%) Baroda (%) Rajkot (%) Mumbai (%) Over All (%)
00‐09 grade 42 30 19 19 37 33
10‐12 grade 45 11 46 35 51 41 Graduation 5 3 30 41 12 14 Masters 6 56 4 5 0 11 Studying 2 0 1 0 0 1
41% of youth members were educated till 10th‐12th grade. The education profile of the majority of beneficiaries within each city was not consistent across the cities. 42% of members in Ahmedabad were between 0‐9th grade, as compared to 19% in Baroda & Rajkot while the overall average was 33%.
51% of members in Mumbai were between 10‐12th grade, as compared to 11% in Surat while the average was 41%. 41% of members in Rajkot were graduates, compared to 3% in Surat while the average was 14%. On an average 11% beneficiaries had Master’s degree.
Coverage of Female participation based on Age group and Education profiles
Education profiles within each age groups
Female (6085) 00‐09 10‐12th Graduation Masters Studying 00‐17 yrs 14 86 0 0 018‐20 yrs 29 42 7 21 1 21‐25 yrs 39 28 19 13 126‐30 yrs 38 48 5 9 0 31‐35yrs 43 36 11 9 1
Data Missing* 75 0 25 0 0

External Evaluation of Programme, Youth Force
35 | D e s i g n & P l a n n i n g C o u n s e l
Age wise participation of females
Majority (30%) of the women in micro entrepreneur programme were in 18‐20 year age group. Within this age group 42% of women were in 10th‐12th education bracket. More women in the age groups of 21‐25 & 31‐35 had education less than 10th class.
Predominant age groups within each educational level
Female participation across different education profiles
39% of female micro entrepreneur were educated between 10‐12th and in 18‐20 year age bracket. Majority of women who were educated between 0‐9th were in 31‐35 year age bracket.
3.3.1 Findings Based on Questionnaire Survey
Ahmedabad (%) Surat (%) Baroda (%) Rajkot (%) Mumbai (%) Over AllRespondents who confirmed getting enrolled with Micro Entrepreneur
50% 17% 67% 0% 38% 37%
Members who agreed to have benefited from activities
80% 100% 75% 0% 67% 77%
Propagation of programme by the members to their friends and Family‐ Percentage of members who helped Friends & Family members to get enrolled in Micro Entrepreneur programme
50% 33% 67% 80% 25% 49%
Participation of ‘Youth members’ in the ‘Linkage programme’‐ are you also a youth member?
50% 50% 67% 20% 25% 43%
Connection with other Linkage programs‐ Have you done any other Training course or enrolled with any other Linkage programs?
30% 50% 67% 80% 50% 51%
Female (6085) 00‐17 yrs 18‐20 yrs 21‐25yrs 26‐30yrs 31‐35yrs Data Missing*Total 2 30 23 20 24 1
Female (6085) 00‐09 10‐12 Graduation Masters Studying 00‐17 yrs 1 5 0 0 0 18‐20 yrs 24 32 19 49 33 21‐25 yrs 25 17 42 23 33 26‐30 yrs 20 24 10 13 0 31‐35yrs 28 22 26 15 33 Data Missing* 2 0 3 0 1
Female (6085) 00‐09 10‐12 Graduation Masters StudyingTotal 37 39 10 13 1

External Evaluation of Programme, Youth Force
36 | D e s i g n & P l a n n i n g C o u n s e l
a. Confirmation of the enrolled members Q1 – Have you taken any Training to expand your business? Overall 37% of respondents confirmed, while 63% respondents denied having joined any training course in Micro entrepreneur programme. In Baroda 67%, Ahmedabad 50%, Mumbai 38% and in Surat 17% respondents confirmed joining the training. However in Rajkot all respondents denied joining any training course in Micro entrepreneur programme b. Benefits from the training courses Q2 ‐ Did you benefit from the training course? After the verification of enrollment in the training course, the member was asked about the quality and regularity of the training course in terms of whether the faculty was good and regular, did the faculty help them understand things and gave them specific guidance based on their profession. Benefits were assessed in terms of skill development, knowledge enhancement and increase in employment opportunities after training course. Overall 77% of the enrolled members said to have benefited from the training course while for 23% enrolled members the training course was not helpful. In Surat 100% of enrolled members gained from the training courses. While in Ahmedabad 80% and Baroda 75% enrolled members gained from the training courses. In Mumbai around 67% of enrolled members benefited from the training courses. c. Propagation Q3‐ How did you get information regarding the training course? Around 77% of the enrolled members came to know regarding the training course through Youth Members, 8% through Youth leaders and remaining 15% through Friends. Around 95% members in Ahmedabad and Baroda received information through Youth members.. Around 95% members in Surat received information through Youth leaders. While in Mumbai, 33% through Youth members and 67% members received the information regarding the training courses through friends. d. Propagation of programme by the beneficiaries to their friends and family Q4 –Did you enroll / inform other Friends & Family members to do the training courses? The positive response indicates the success of the training programme. Members who benefitted from the course shared their experiences with others and helped new members get enrolled with the training course. Around 49% of the enrolled members helped friends and family members to get enrolled with the training course. Around 33% of members in Surat and 25% in Mumbai helped their family and friends get enrolled with the same training course. While around 67% members in Baroda helped their family and friends get enrolled with the training course. e. Participation of ‘Youth members’ in the ‘Linkage programme’ Q5 – Are you also connected to Youth Force, are you also a youth member? The response helped to assess and understand – how many people pass through more than one linkage programme. Overall 43% of the total beneficiaries were also part of Youth Force. Around 67% in Baroda, 50% of members in Ahmedabad and 50% in Surat were also members of Youth Force. Around 25% of beneficiaries in Mumbai were also members of Youth Force. In Rajkot 20% of the respondents agreed being Youth members.

External Evaluation of Programme, Youth Force
37 | D e s i g n & P l a n n i n g C o u n s e l
f. Connection with other Linkage programs Q6 – Have you done any other Training course or enrolled with any other Linkage programs? 51% of beneficiaries were enrolled with other training courses. Around 80% of respondents in Rajkot were enrolled with livelihood training courses but did not participate in ME programme. Around 67% beneficiaries in Baroda, 50% of in Surat and Mumbai, and around 30% beneficiaries in Ahmedabad were enrolled with other linkage programmes of Youth force.
g. Inputs from differently ‐ able Members Based on the data given, no differently abled members were enrolled in the micro entrepreneur programme
3.3.2 Recommendations
During the survey, it was realized that many of the members were involved with Livelihood linkage programme or Youth force, but were not involved with the Micro‐Entrepreneur programme. To increase the beneficiary coverage of the programme a parallel short course can be given to the same members after the completion of the livelihood training course. Youth Members were found to be more active in informing others about the Micro entrepreneur training course. Hence, for propagating the programme, Youth members should be motivated to create awareness among other people. Differently abled members should be encouraged to enroll in the micro entrepreneur programme.

External Evaluation of Programme, Youth Force
38 | D e s i g n & P l a n n i n g C o u n s e l
3.4 Micro Finance
The targets set by HSBC have been successfully achieved by Saath
Achievement against the targets
City HSBC Target Achievement as calculated from the Data given (TPI)
Ahmedabad 700 2147 Surat 700 160Baroda 600 696 Rajkot 700 334 Mumbai 660 589 Total 3360 3926
Quality of records
Distribution & Growth rate across cities
Number of MFI beneficiaries across various cities
Distribution of MFI beneficiaries across various cities
Years Ahmedabad (%) Surat (%) Baroda (%) Rajkot (%) Mumbai (%) Over All 55 4 18 8.5 15
Growth rate
Years Ahmedabad (%) Surat (%) Baroda (%) Rajkot (%) Mumbai (%) Over All Over All ‐43% 789% 248% 912% 152% ‐97%
Ahmedabad shares maximum 55%, while Surat shares minimum 4% of the Micro finance programme beneficiary’s participation across the cities. The overall growth rate is negative at 97%. However variations in the growth rate are observed across the cities, with highest 912% in Rajkot and negative at ‐43% in Ahmedabad.
Micro Finance (2012 To 2014) Total Data Missing % of
missing Data
Form No. 2534 1116 44 D.O.J. 2534 310 12
Dream 2534 1459 58 Name 2534 0 0 Gender (M/F) 2534 0 0
City 2534 0 0
Area 2534 8 0
D.O.B 2534 160 6
Age 2534 95 4
Education 2534 82 3
Address 2534 10 0
Contact 2534 260 10
Caste 2534 1449 57
Name of Bank or MFI 2534 18 1
How Many Saving Amount 2534 189 7
Years Ahmedabad Surat Baroda Rajkot Mumbai Total
2012‐2013 1505 18 200 33 234 1990 2013‐2014 642 142 496 301 355 1936
Total 2147 160 696 334 589 3926

External Evaluation of Programme, Youth Force
39 | D e s i g n & P l a n n i n g C o u n s e l
Coverage of the Micro Finance programme based on gender
Female / Male participation
Gender Ahmedabad (%) Surat (%) Baroda (%) Rajkot (%) Mumbai (%) Over All (%) Female 69 44 45 40 63 61 Male 31 56 55 60 37 39
Overall the participation of females is 61% as compared to 39% males. Ahmedabad and Mumbai show better participation of females compared to other cities.
Coverage of the Micro Finance programme based on age group profiles
Age group profiles
Age‐(Slab) Ahmedabad (%) Surat (%) Baroda (%) Rajkot (%) Mumbai (%) Over All 00‐17 years 2 4 1 0 6 4 18‐20 years 17 31 40 35 31 29 21‐25 years 23 31 32 45 29 30 26‐30 years 22 25 13 11 14 16 31‐35 years 28 9 13 9 16 17 Data Missing* 8 0 1 0 4 4
18‐20 years and 21‐25 years form the predominant (59%) Age group .The coverage of programme across members beyond 26 year age is 33%.
Coverage of the Micro Finance programme based on education profiles
Education profiles
Education ‐ Slab Ahmedabad (%) Surat (%) Baroda (%) Rajkot (%) Mumbai (%) Over All (%) 00‐09 grade 52 33 20 16 24 31 10‐12 grade 29 50 43 27 50 39 Graduation 11 15 33 40 24 24Masters 2 2 3 17 2 4Studying 6 0 1 0 0 2
39% of beneficiaries are educated till 10‐12th grade. 52% of micro finance beneficiaries in Ahmedabad have less than 9th class education. 50% of beneficiaries in Mumbai, 50% members in Surat & 43% of members in Baroda have education level between 10‐12th. Majority of the beneficiaries (40%) in Rajkot are graduates.

External Evaluation of Programme, Youth Force
40 | D e s i g n & P l a n n i n g C o u n s e l
3.4.1 Findings Based on Questionnaire survey
Ahmedabad (%) Surat (%) Baroda (%) Rajkot (%) Mumbai (%) Over AllRespondents who confirmed getting enrolled with Micro Finance Programme
32% 25% 10% 0% 19% 20%
Members who agreed to have benefited from the training
86% 100% 50% 0% 100% 87%
Propagation of programme by the members to their friends and Family‐ Percentage of members who helped Friends & Family members to get enrolled in Micro Finance programme
27% 25% 10% 0% 19% 18%
Connection with other Linkage programmes‐ Have you done any other Training course or enrolled with any other Linkage programmes?
18% 50% 10% 50% 62% 33%
Participation of ‘Youth members’ in the ‘Linkage programme’‐ are you also a youth member?
59% 25% 52% 50% 14% 41%
a. Confirmation of the members enrolled Q1 – Have you taken any Training related to savings/ did someone assisted you to create a bank account? Overall 20% of respondents confirmed as being members of the Micro Finance programme while 80% of the respondents denied of having got any information for Micro finance or any member coming home to give information regarding Micro finance. 32% of respondents in Ahmedabad, 25% in Surat, 19% in Mumbai and 10% respondents in Baroda confirmed being a part of the Micro finance programme. However all respondents from Rajkot denied being members of the Micro finance programme b. Benefits from the training courses / Continuity of the Savings Q2 – Presently, are you saving in the bank account / did you benefit After the verification of having enrolled with Micro finance programme, verification of the bank name was done, wherever available. In many cases the member already had a bank account before being a part of MFI. After the brief conversation with the member the above question was asked. 87% of the members enrolled with the MFI, gained from the training course while for the rest 13% the training course was not helpful. 100% of the enrolled members in Mumbai and Surat, 86% enrolled members in Ahmedabad and 50% of the members enrolled with the MFI in Baroda benefited from the programme. c. Propagation of programme by the beneficiaries to their friends and family Q3 –Did you enroll / inform other Friends & Family members to do the training courses? The positive response indicates the success of the training programme. Members who benefitted from the course shared their experiences with others and helped others get enrolled with the training course. Overall around 18% of members helped other friends and family members to get enrolled with the MF course. Around 27% of members in Ahmedabad and Surat helped their family and friends get enrolled with the same training course. While around 19% in Mumbai and 10% in Baroda helped their family and friends get enrolled with the training course.
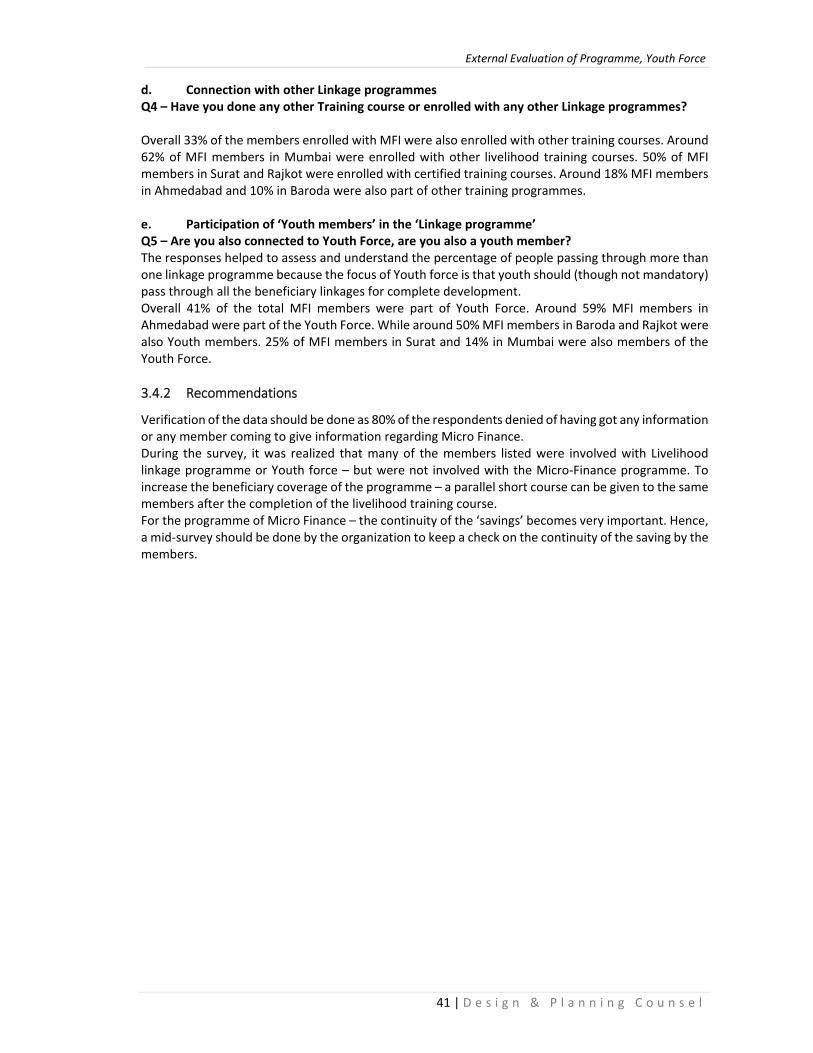
External Evaluation of Programme, Youth Force
41 | D e s i g n & P l a n n i n g C o u n s e l
d. Connection with other Linkage programmes Q4 – Have you done any other Training course or enrolled with any other Linkage programmes? Overall 33% of the members enrolled with MFI were also enrolled with other training courses. Around 62% of MFI members in Mumbai were enrolled with other livelihood training courses. 50% of MFI members in Surat and Rajkot were enrolled with certified training courses. Around 18% MFI members in Ahmedabad and 10% in Baroda were also part of other training programmes. e. Participation of ‘Youth members’ in the ‘Linkage programme’ Q5 – Are you also connected to Youth Force, are you also a youth member? The responses helped to assess and understand the percentage of people passing through more than one linkage programme because the focus of Youth force is that youth should (though not mandatory) pass through all the beneficiary linkages for complete development. Overall 41% of the total MFI members were part of Youth Force. Around 59% MFI members in Ahmedabad were part of the Youth Force. While around 50% MFI members in Baroda and Rajkot were also Youth members. 25% of MFI members in Surat and 14% in Mumbai were also members of the Youth Force. 3.4.2 Recommendations
Verification of the data should be done as 80% of the respondents denied of having got any information or any member coming to give information regarding Micro Finance. During the survey, it was realized that many of the members listed were involved with Livelihood linkage programme or Youth force – but were not involved with the Micro‐Finance programme. To increase the beneficiary coverage of the programme – a parallel short course can be given to the same members after the completion of the livelihood training course. For the programme of Micro Finance – the continuity of the ‘savings’ becomes very important. Hence, a mid‐survey should be done by the organization to keep a check on the continuity of the saving by the members.
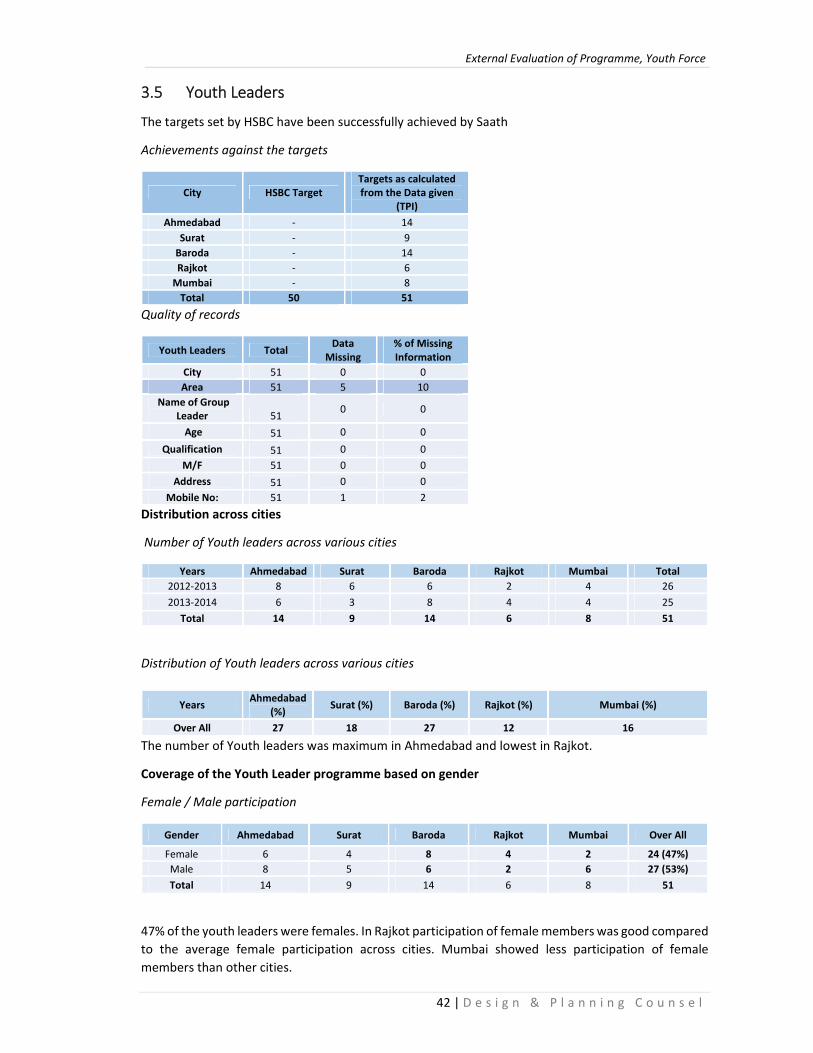
External Evaluation of Programme, Youth Force
42 | D e s i g n & P l a n n i n g C o u n s e l
3.5 Youth Leaders
The targets set by HSBC have been successfully achieved by Saath
Achievements against the targets
City HSBC Target Targets as calculated from the Data given
(TPI) Ahmedabad ‐ 14
Surat ‐ 9 Baroda ‐ 14 Rajkot ‐ 6 Mumbai ‐ 8 Total 50 51
Quality of records
Youth Leaders Total Data Missing
% of Missing Information
City 51 0 0 Area 51 5 10
Name of Group Leader 51 0 0
Age 51 0 0 Qualification 51 0 0
M/F 51 0 0Address 51 0 0
Mobile No: 51 1 2 Distribution across cities
Number of Youth leaders across various cities
Years Ahmedabad Surat Baroda Rajkot Mumbai Total 2012‐2013 8 6 6 2 4 26 2013‐2014 6 3 8 4 4 25
Total 14 9 14 6 8 51
Distribution of Youth leaders across various cities
The number of Youth leaders was maximum in Ahmedabad and lowest in Rajkot.
Coverage of the Youth Leader programme based on gender
Female / Male participation
Gender Ahmedabad Surat Baroda Rajkot Mumbai Over All
Female 6 4 8 4 2 24 (47%) Male 8 5 6 2 6 27 (53%)Total 14 9 14 6 8 51
47% of the youth leaders were females. In Rajkot participation of female members was good compared to the average female participation across cities. Mumbai showed less participation of female members than other cities.
Years Ahmedabad (%) Surat (%) Baroda (%) Rajkot (%) Mumbai (%)
Over All 27 18 27 12 16
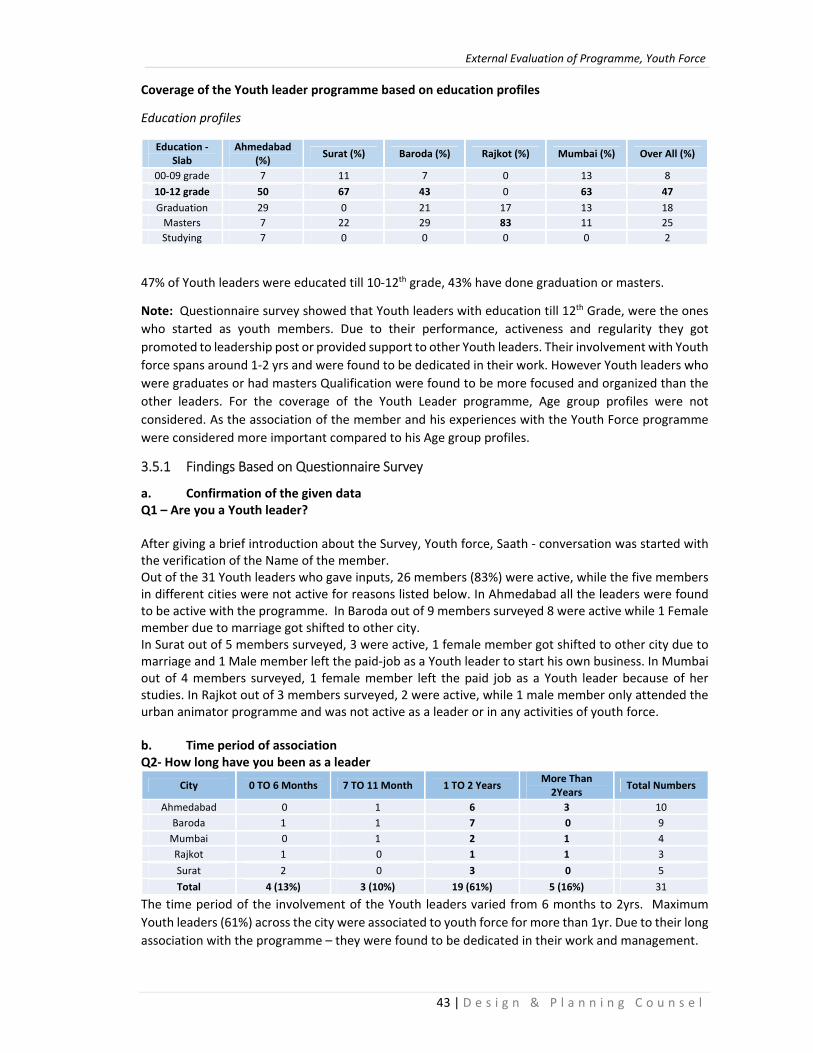
External Evaluation of Programme, Youth Force
43 | D e s i g n & P l a n n i n g C o u n s e l
Coverage of the Youth leader programme based on education profiles
Education profiles
Education ‐ Slab
Ahmedabad (%) Surat (%) Baroda (%) Rajkot (%) Mumbai (%) Over All (%)
00‐09 grade 7 11 7 0 13 8 10‐12 grade 50 67 43 0 63 47 Graduation 29 0 21 17 13 18Masters 7 22 29 83 11 25Studying 7 0 0 0 0 2
47% of Youth leaders were educated till 10‐12th grade, 43% have done graduation or masters.
Note: Questionnaire survey showed that Youth leaders with education till 12th Grade, were the ones who started as youth members. Due to their performance, activeness and regularity they got promoted to leadership post or provided support to other Youth leaders. Their involvement with Youth force spans around 1‐2 yrs and were found to be dedicated in their work. However Youth leaders who were graduates or had masters Qualification were found to be more focused and organized than the other leaders. For the coverage of the Youth Leader programme, Age group profiles were not considered. As the association of the member and his experiences with the Youth Force programme were considered more important compared to his Age group profiles.
3.5.1 Findings Based on Questionnaire Survey
a. Confirmation of the given data Q1 – Are you a Youth leader? After giving a brief introduction about the Survey, Youth force, Saath ‐ conversation was started with the verification of the Name of the member. Out of the 31 Youth leaders who gave inputs, 26 members (83%) were active, while the five members in different cities were not active for reasons listed below. In Ahmedabad all the leaders were found to be active with the programme. In Baroda out of 9 members surveyed 8 were active while 1 Female member due to marriage got shifted to other city. In Surat out of 5 members surveyed, 3 were active, 1 female member got shifted to other city due to marriage and 1 Male member left the paid‐job as a Youth leader to start his own business. In Mumbai out of 4 members surveyed, 1 female member left the paid job as a Youth leader because of her studies. In Rajkot out of 3 members surveyed, 2 were active, while 1 male member only attended the urban animator programme and was not active as a leader or in any activities of youth force. b. Time period of association Q2‐ How long have you been as a leader
City 0 TO 6 Months 7 TO 11 Month 1 TO 2 Years More Than 2Years Total Numbers
Ahmedabad 0 1 6 3 10 Baroda 1 1 7 0 9 Mumbai 0 1 2 1 4Rajkot 1 0 1 1 3 Surat 2 0 3 0 5 Total 4 (13%) 3 (10%) 19 (61%) 5 (16%) 31
The time period of the involvement of the Youth leaders varied from 6 months to 2yrs. Maximum Youth leaders (61%) across the city were associated to youth force for more than 1yr. Due to their long association with the programme – they were found to be dedicated in their work and management.
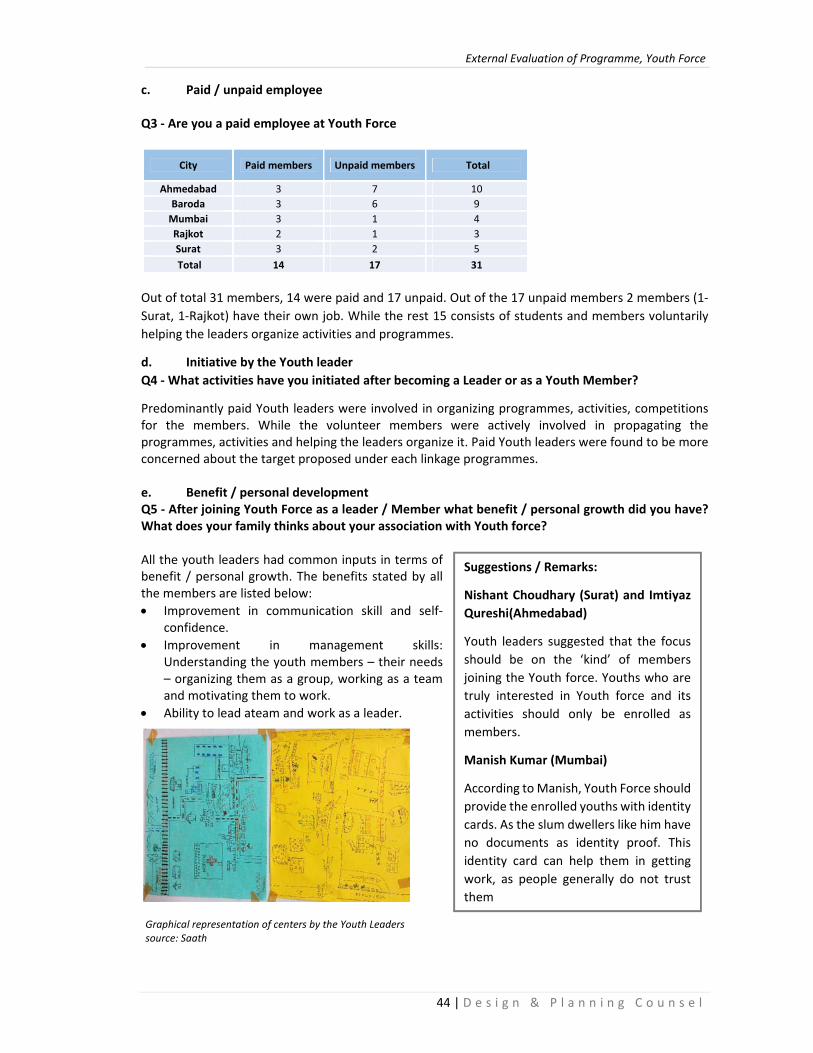
External Evaluation of Programme, Youth Force
44 | D e s i g n & P l a n n i n g C o u n s e l
c. Paid / unpaid employee Q3 ‐ Are you a paid employee at Youth Force
Out of total 31 members, 14 were paid and 17 unpaid. Out of the 17 unpaid members 2 members (1‐Surat, 1‐Rajkot) have their own job. While the rest 15 consists of students and members voluntarily helping the leaders organize activities and programmes.
d. Initiative by the Youth leader Q4 ‐ What activities have you initiated after becoming a Leader or as a Youth Member?
Predominantly paid Youth leaders were involved in organizing programmes, activities, competitions for the members. While the volunteer members were actively involved in propagating the programmes, activities and helping the leaders organize it. Paid Youth leaders were found to be more concerned about the target proposed under each linkage programmes. e. Benefit / personal development Q5 ‐ After joining Youth Force as a leader / Member what benefit / personal growth did you have? What does your family thinks about your association with Youth force? All the youth leaders had common inputs in terms of benefit / personal growth. The benefits stated by all the members are listed below: • Improvement in communication skill and self‐
confidence. • Improvement in management skills:
Understanding the youth members – their needs – organizing them as a group, working as a team and motivating them to work.
• Ability to lead ateam and work as a leader.
City Paid members Unpaid members Total
Ahmedabad 3 7 10 Baroda 3 6 9 Mumbai 3 1 4 Rajkot 2 1 3Surat 3 2 5 Total 14 17 31
Suggestions / Remarks:
Nishant Choudhary (Surat) and Imtiyaz Qureshi(Ahmedabad)
Youth leaders suggested that the focus should be on the ‘kind’ of members joining the Youth force. Youths who are truly interested in Youth force and its activities should only be enrolled as members.
Manish Kumar (Mumbai)
According to Manish, Youth Force should provide the enrolled youths with identity cards. As the slum dwellers like him have no documents as identity proof. This identity card can help them in getting work, as people generally do not trust them
Graphical representation of centers by the Youth Leaders source: Saath
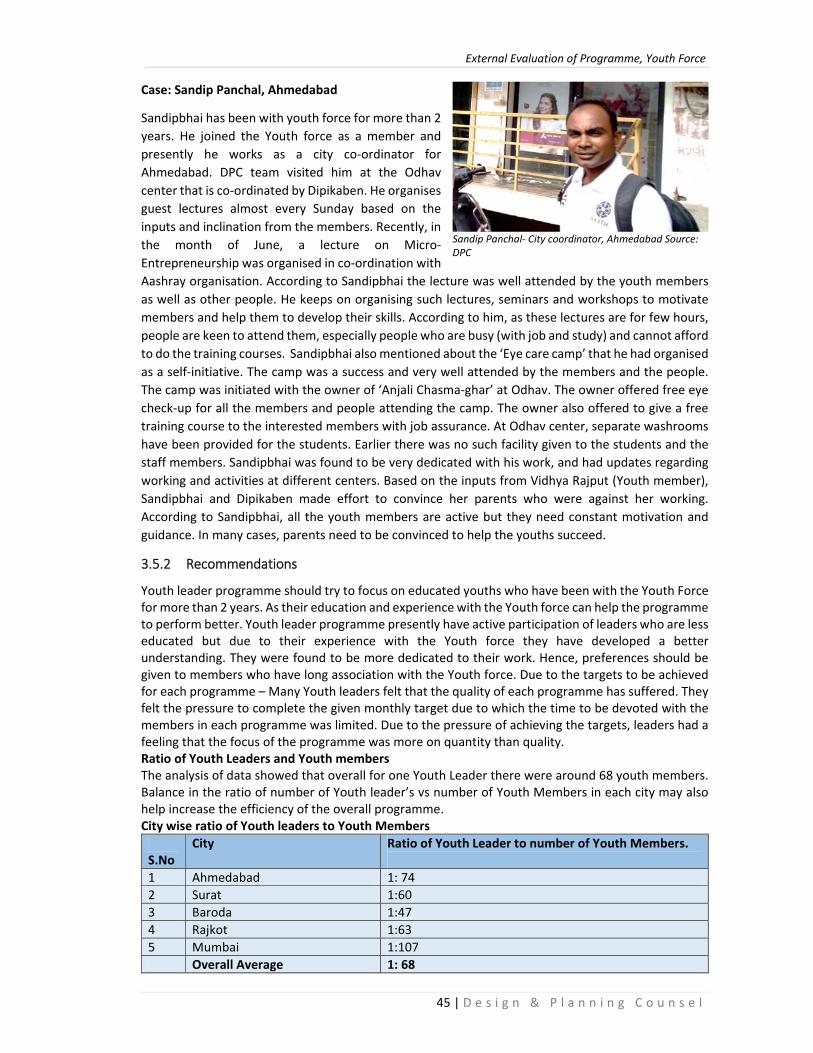
External Evaluation of Programme, Youth Force
45 | D e s i g n & P l a n n i n g C o u n s e l
Case: Sandip Panchal, Ahmedabad
Sandipbhai has been with youth force for more than 2 years. He joined the Youth force as a member and presently he works as a city co‐ordinator for Ahmedabad. DPC team visited him at the Odhav center that is co‐ordinated by Dipikaben. He organises guest lectures almost every Sunday based on the inputs and inclination from the members. Recently, in the month of June, a lecture on Micro‐Entrepreneurship was organised in co‐ordination with Aashray organisation. According to Sandipbhai the lecture was well attended by the youth members as well as other people. He keeps on organising such lectures, seminars and workshops to motivate members and help them to develop their skills. According to him, as these lectures are for few hours, people are keen to attend them, especially people who are busy (with job and study) and cannot afford to do the training courses. Sandipbhai also mentioned about the ‘Eye care camp’ that he had organised as a self‐initiative. The camp was a success and very well attended by the members and the people. The camp was initiated with the owner of ‘Anjali Chasma‐ghar’ at Odhav. The owner offered free eye check‐up for all the members and people attending the camp. The owner also offered to give a free training course to the interested members with job assurance. At Odhav center, separate washrooms have been provided for the students. Earlier there was no such facility given to the students and the staff members. Sandipbhai was found to be very dedicated with his work, and had updates regarding working and activities at different centers. Based on the inputs from Vidhya Rajput (Youth member), Sandipbhai and Dipikaben made effort to convince her parents who were against her working. According to Sandipbhai, all the youth members are active but they need constant motivation and guidance. In many cases, parents need to be convinced to help the youths succeed.
3.5.2 Recommendations
Youth leader programme should try to focus on educated youths who have been with the Youth Force for more than 2 years. As their education and experience with the Youth force can help the programme to perform better. Youth leader programme presently have active participation of leaders who are less educated but due to their experience with the Youth force they have developed a better understanding. They were found to be more dedicated to their work. Hence, preferences should be given to members who have long association with the Youth force. Due to the targets to be achieved for each programme – Many Youth leaders felt that the quality of each programme has suffered. They felt the pressure to complete the given monthly target due to which the time to be devoted with the members in each programme was limited. Due to the pressure of achieving the targets, leaders had a feeling that the focus of the programme was more on quantity than quality. Ratio of Youth Leaders and Youth members The analysis of data showed that overall for one Youth Leader there were around 68 youth members. Balance in the ratio of number of Youth leader’s vs number of Youth Members in each city may also help increase the efficiency of the overall programme. City wise ratio of Youth leaders to Youth Members S.No
City Ratio of Youth Leader to number of Youth Members.
1 Ahmedabad 1: 74 2 Surat 1:60 3 Baroda 1:474 Rajkot 1:63 5 Mumbai 1:107 Overall Average 1: 68
Sandip Panchal‐ City coordinator, Ahmedabad Source: DPC
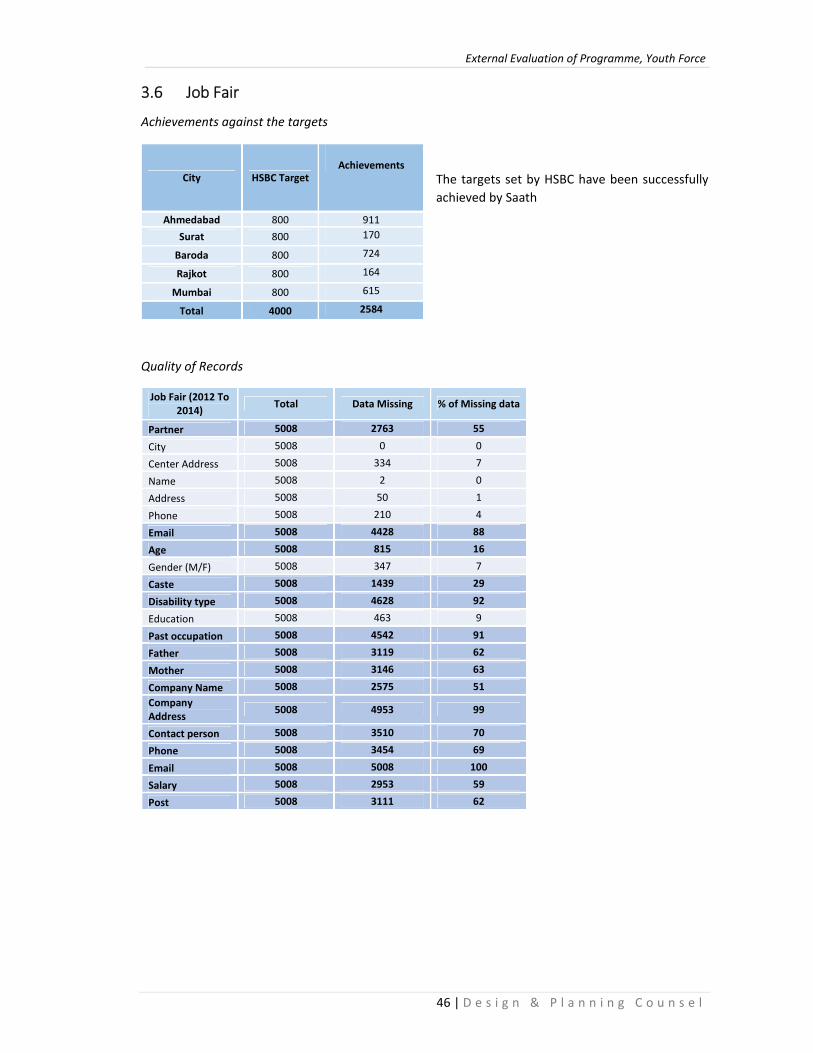
External Evaluation of Programme, Youth Force
46 | D e s i g n & P l a n n i n g C o u n s e l
3.6 Job Fair
Achievements against the targets
The targets set by HSBC have been successfully achieved by Saath
Quality of Records
Job Fair (2012 To 2014) Total Data Missing % of Missing data
Partner 5008 2763 55
City 5008 0 0
Center Address 5008 334 7
Name 5008 2 0
Address 5008 50 1
Phone 5008 210 4
Email 5008 4428 88
Age 5008 815 16
Gender (M/F) 5008 347 7
Caste 5008 1439 29
Disability type 5008 4628 92
Education 5008 463 9
Past occupation 5008 4542 91
Father 5008 3119 62
Mother 5008 3146 63
Company Name 5008 2575 51 Company Address 5008 4953 99
Contact person 5008 3510 70
Phone 5008 3454 69
Email 5008 5008 100
Salary 5008 2953 59
Post 5008 3111 62
City HSBC Target
Achievements
Ahmedabad 800 911 Surat 800 170
Baroda 800 724
Rajkot 800 164
Mumbai 800 615
Total 4000 2584
External Evaluation of Programme, Youth Force
47 | D e s i g n & P l a n n i n g C o u n s e l
a. Distribution & growth rate of registered candidates across cities
Number of people registered in Job Fairs across various cities
Years Ahmedabad Surat Baroda Rajkot Mumbai Total 2012‐2013 1561 0 684 0 894 31392013‐2014 438 170 557 164 540 1869 Total 1999 170 1241 164 1434 5008
Distribution of people registered across various cities
Growth rate of registration
Years Ahmedabad (%) Surat (%) Baroda (%) Rajkot (%) Mumbai (%) Over All Over All ‐28% N.A ‐81% N.A ‐60% ‐60%
Highest 40% of the people registered in job fares were from Ahmedabad, while Rajkot shares minimum 3% of the participation. However overall there has been a 60% decline in the number of people who registered in the second year.
Coverage of the Job Fair programme based on gender
Female / Male participation
Gender Ahmedabad (%) Surat (%) Baroda (%) Rajkot (%) Mumbai (%) Over All (%)
Female 33 6 25 26 42 32 Male 67 94 75 74 58 68
The analysis showed male participation has been high in the job fair programmes as compared to females. However in case of Mumbai female participation was significant.
b. Coverage of the Job Fair programme based on age group
Age group profiles
Age‐Slab Ahmedabad (%) Surat (%) Baroda (%) Rajkot (%) Mumbai (%) Over All (%)
00‐17 years 4 0 1 0 1 218‐20 years 33 0 18 0 22 24 21‐25 years 33 0 29 0 43 33 26‐30 years 14 0 11 0 17 13 31‐35 years 15 0 11 0 11 12 Data Missing 1 100 30 100 6 16
57% of the registered candidates were in the age group of 18‐25yrs.
Years Ahmedabad (%) Surat (%) Baroda (%) Rajkot (%) Mumbai (%)
Over All 40 3 25 3 29
External Evaluation of Programme, Youth Force
48 | D e s i g n & P l a n n i n g C o u n s e l
c. Coverage of the Job Fair programme based on education profiles
Education profiles
E‐Slab Ahmedabad (%) Surat (%) Baroda (%) Rajkot (%) Mumbai (%) Over All (%)
00‐09 18 17 5 9 4 11 10‐12th 40 46 18 14 48 36
Graduation 25 32 42 51 40 34 Masters 1 3 3 14 3 3Studying 15 1 3 6 0 7
Data Missing 1 1 29 6 5 9 36% of the registered candidates under Job fair programme had education level till 10‐12th grade & 34% were graduates. For the sample survey pre‐dominant education profiles has been focused. However, 11% of registered candidates educated between 00‐09th grades were also given equal importance. As the Job fair programme was found to be equally beneficially for them.
3.6.1 Findings based on Questionnaire Survey
a. Confirmation of the given data Q1‐Have you attended the Job Fair conducted by Saath? After giving a brief introduction about the Survey, Youth force, Saath ‐ conversation was started with the verification of the name of the respondent. 46% of the respondent had information regarding Job Fair programme (Out of which many attended but did not take the job due to multiple reasons listed in listed in Q‐2), while 54% of respondent had no information regarding the Job fair programme and they did not attend it. 100% of respondent surveyed in Rajkot attended the job fair programme. While 80% in Surat and 56% in Ahmedabad said to have attended the programme. About 33% of respondent had attended the programme in Baroda and Mumbai. b. Benefits Q2‐Did you apply and got the job? 20% of the respondent who had attended the job fair programme said to have gained from it. While according to the remaining 80% of respondents who attended the job fairs‐ the companies were not not of their choice / or most Companies were limited to Call centers. In many cases the respondents had applied for a job, submitted the documents but did not receive any positive response from the companies. 35% respondent in Ahmedabad and 14% in Baroda gained from the Job fair programme in terms of getting placements.
c. Continuity of the job Q3‐Do you still work there? Out of the total respondent who got the placements, 13% were found to be working at the same place. 21% respondent in Ahmedabad and 14% in Baroda were found to be still working at the same place. 87% did not continue with the job due to multiple reasons. Few felt that the salary given was less, while few did not findthe job appropriate for them. In one case a female left the job because work offered during the placement was different from the one she was asked to do when she started working. (She was offered job as a receptionist, later she was asked to do back‐office work).
External Evaluation of Programme, Youth Force
49 | D e s i g n & P l a n n i n g C o u n s e l
d. Propagation: Q4‐ How did you get the information regarding the Job Fair? Around 44% of respondents who were registered candidates came to know regarding the Job fair through Youth members. While 29% through pamphlets and 27% through friends. Around 86% registered in Baroda, 50% in Surat and 20% in Rajkot received information through Youth members. While 62% in Mumbai, 50% in Surat, 40% in Rajkot and around 24% in Ahmedabad received the information regarding the job fair through pamphlets. e. Participation of respondent in the Linkage programme: Q5 – Are you connected to Youth Force, are you a youth member? 16% of the total respondent were part of Youth Force. City wise around 44% respondent in Ahmedabad, 20% in Rajkot and Surat, 13% in Mumbai and 7% in Baroda were youth members. f. Inputs from Differently‐able People: Around 125 differently abled people had registered themselves for the Job fairs. However all of them were from Ahmedabad and Baroda. Out of the total 125 people list – 2 Contact No. were missing & 5 were wrong digit No., Out of the balance C118, 64 registered members (51%) were called for inputs. Out of this– 26 (21% Successful Calls) were available, rest 38 were not available (Busy, Switch off, Not picking up, Wrong Co. No)
Out of the total 26 successful calls, 17 people said to have attended the Job fair and 9 were not able to attend the job fair, because of work at home. However people who attended the job fair and submitted their documents, did not receive any reply from the company. Only 2 people got the job but even they did not continue as their job location was too far. The respondents thought that the jobs provided were not relevant because the companies in the job fair were not according to their choice. Of the total 26 registered members 4 were members of Youth force Inputs from a specific case is listed below:
Case1: Pealgari Ravi Manekrav, Behrampura, Ahmedabad (Cannot hear and speak)
Ravi is deaf and dumb.On behalf of Ravi, his elder brother answered the questions. Ravi attended the job fair, but the job offered to him was for the call center which was of no use to him. His brother further added that there were limited job opportunities for the differently‐abled members.
3.6.2 Recommendations:
Verification of data should be done at the ground level as lot of respondents denied registering for the job fair

External Evaluation of Programme, Youth Force
50 | D e s i g n & P l a n n i n g C o u n s e l
3.7 Company Placements
Quality of records
City Total Data
Missing % of Missing
Data Company Name 55 0 0 Company Head office Address 55 9 16 Name of
55 3 5 the Immediate Supervisor/ HR Contact no of Supervisor/HR 55 3 5
Designation of Youth in Company 55 32 58
Type of Work 55 0 0Salary Package per Month 55 29 53
3.7.1 Findings based on Questionnaire Survey
a. Confirmation of the given data Q1‐ Has your company done placement from Youth Force/ Yuva? Overall 86% of respondents gave positive response to this question. City wise, 100% respondent in Baroda and Surat, 88% in Mumbai and 80% in Ahmedabad said to have done placement from Youth Force / Yuva. b. Performance of the people recruited Q2‐ Are the people recruited, good in their Work? 42% of company personnel respondents were happy with the people recruited through Youth Force. Companies that gave negative response mentioned that ‐ people recruited were not interested in the work given to them and majority of them would leave the job after a week. Lot of people need training on basic skills. In many cases, people recruited never showed up. c. Verification of the people still continuing Q3‐ Do the people you recruited through Youth force still continue to work with you? 58% of the companies responded positively that the people they recruited are still continuing in in their company d. Are the Companies still willing to recruit people from the Youth Force Q4‐ Would you still consider recruiting people from the Youth Force? 71% of the companies were willing to recruit people through Youth Force. However they suggested that people applying for placements should be given counselling so that they become clear about their job priorities. This will help them to apply for a job of their liking. Secondly, youth applying for job should be trained in basic skills of communication in Hindi, simple English and some computer knowledge.

External Evaluation of Programme, Youth Force
51 | D e s i g n & P l a n n i n g C o u n s e l
Case1‐ Jain Chandani, Odhav, Ahmedabad
Presently Chandani works with Karnavati health care center and also studying. She is an active member of Youth force and attends the activities and seminars in spite of her busy schedule.
She has been with the youth force from past one year. It is through her cousin that she got enrolled with the youth force. Initially, she was not confident about her capabilities and never use to share or talk with other people. However after attending the youth force trips and activities, she started making friends and knowing new people. This exposure helped her gain confidence. The environment at youth force helped her to know herself better and open up with other people. She also attended the course on retail management.
With reference from Dipikaben, she was able to find a job at the health care center. She feels positive and very happy working, studying and being a part of the Youth force. She has also encouraged many of her friends and family members to join the youth force.
Case 2‐ Vidhya Rajput, Odhav, Ahmedabad
Presently Vidhya works at the Idea shop. She is a youth member and has earlier attended the course of Retail Management under the Livelihood linkage programme. Vidhay wanted to be independent and help her family. Initially her family members were against her working outside. Sandipbhai and Dipikaben made personal visit to her house to convince her parents. Currently her family is happy for her. Even she feels confident and responsible as she is earning and helping her family. Vidhya says that youth force and its activities have been the motivating force in her life. She finds all the members and leaders really helpful and always ready to help and guide people.
3.7.2 Recommendations
Extensive counselling should be undertaken. This will help candidates to have more clarity about their job needs, their skills and the market demands. Recruited people should be given training in basic skills of communications.
During conversation with Vidhya Rajput and Sandip Panchal at Idea shop Source: DPC
During conversation with Sandip Panchal and Chandani Jain at Karnavati Health Care center Source: DPC
External Evaluation of Programme, Youth Force
52 | D e s i g n & P l a n n i n g C o u n s e l
4. Annexure 1. Youth Member Questionnaire
Youth Member
Name Area Contact
હાલમા ંતમે
થુફોસ
સાથે
સકંળાયેલા
છો? કટલા
સમયથી?
તમે
થુફોસમા ં
જોડાયા
પછ કયા
કયા
કાય મોમા ં
ભાગ
લીધો?
સ ય બ યા
પછ /
કાય મમા ં
ભાગ લીધા
પછ તમને
કોઈ ફાયદો
થયો?
હાલમાં
કોઈ પણ
કાય મમાં
વો છો
ખરા?
તમને
થુફોસની
મા હતી
ાથંી
મળ ?
થુફોસની
કોઇપણ
મા હતીની
તમને ણ
કરવામા ં
આવે છે
ખરા?
Remarks
2. Livelihood Linkages Questionnaire
Livelihood Linkages
Name Area Contact
તમે સાથ / ી ટ્ર ટ / િનમાર્ણ /
અથવા યથુફોસર્ માથંી રોજગારી
માટેની તાલીમ લીધી હતી?
આ તાલીમ ારા તમને શુ ં
ફાયદો થયો?
આ
તાલીમની
માિહતી
તમને કેવી
રીતે મળી?
આ તાલીમ
લીધા પછી
આ
તાલીમનો
લાભ બીજા
કેટલા
યિક્તને
અપા યો?
તમે આના
િસવાય બીજી
કોઈ તાલીમ /
કોષર્ કય છે?
તમે હાલમા ં
યથુફોસર્
સાથે
જોડાયેલા
છો?
Remarks

External Evaluation of Programme, Youth Force
53 | D e s i g n & P l a n n i n g C o u n s e l
3. Micro Entrepreneur Questionnaire
Micro Entrepreneur
Name Area Contact
તમારા
ધધંાને
વધારવા
માટ કોઈ
તાલીમ
લીધી હતી
ખરા?
તમને આ
તાલીમથી
તમારા ધધંામા ં
કોઈ ફાયદો
થયો?
તમને આ
તાલીમની
મા હતી
ાથંી
મળ ?
આ તાલીમ
લીધા પછ આ
તાલીમનો
લાભ બી
કટલા
ય તને
આ યો?
તમે હાલમા ં
થુફોસ સાથે
જોડાયેલા
છો?
તમે આના
િસવાય
બી કોઈ
તાલીમ /
કોષ કય
છે?
Remarks
4. Micro Finance Questionnaire
Micro Finance
Name Area Contact
તમે કોઈ
બચતલ ી
તાલીમ
લીધી
હતી?
તમને આ
તાલીમ િવષે
મા હતી
ાથંી
મળ ?
આ તાલીમ
લીધા પછ
તમે બચત
કરો છો?
તેનાથી
તમને ુ ં
ફાયદો
થયો?
આ તાલીમ
લીધા પછ
આ
તાલીમનો
લાભ બી
કટલી
ય તને
આ યો?
તમે
આના
િસવાય
બી
કોઈ
તાલીમ
/ કોષ
કય છે
ખરા?
તમે હાલમા ં
થુફોસ
સાથે
જોડાયેલા
છો?
Remarks
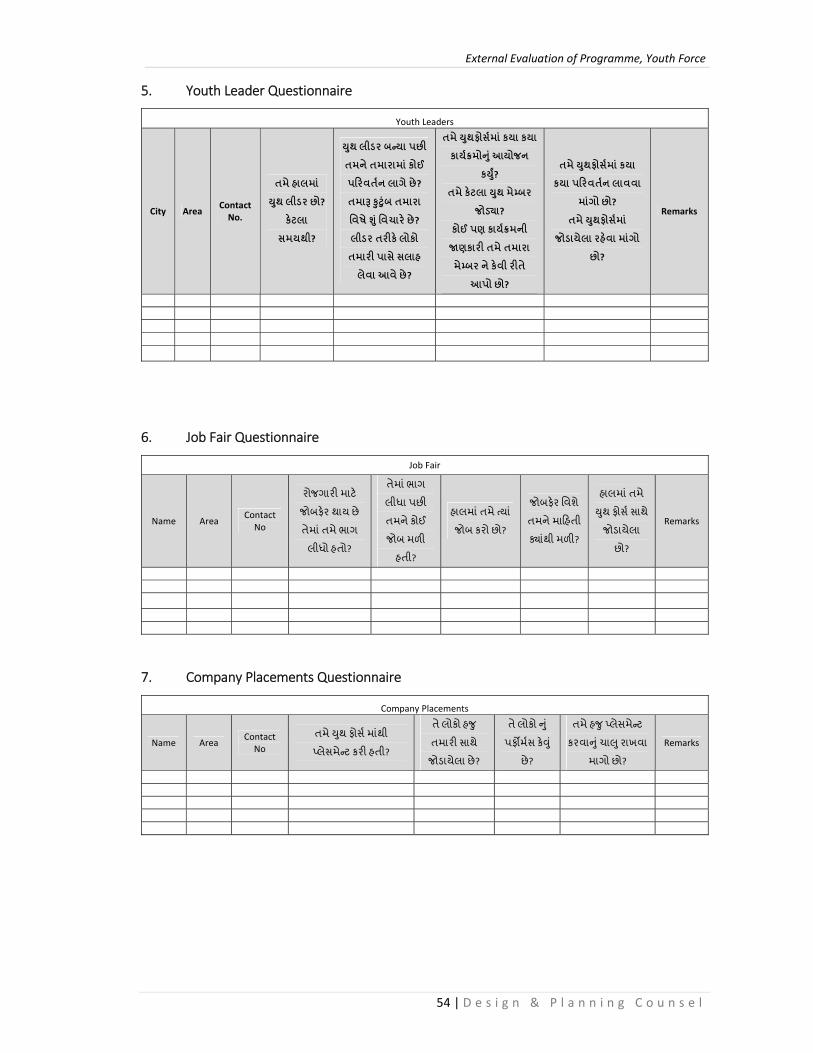
External Evaluation of Programme, Youth Force
54 | D e s i g n & P l a n n i n g C o u n s e l
5. Youth Leader Questionnaire
Youth Leaders
City Area Contact No.
તમે હાલમા ં
થુ લીડર છો?
કટલા
સમયથી?
થુ લીડર બ યા પછ
તમને તમારામા ંકોઈ
પ રવતન લાગે છે?
તમા ુ ુંબ તમારા
િવષે ુ ંિવચાર છે?
લીડર તર ક લોકો
તમાર પાસે સલાહ
લેવા આવે છે?
તમે થુફોસમા ંકયા કયા
કાય મો ુ ંઆયોજન
ક ?ુ
તમે કટલા થુ મે બર
જોડ ા?
કોઈ પણ કાય મની
ણકાર તમે તમારા
મે બર ને કવી ર તે
આપો છો?
તમે થુફોસમા ંકયા
કયા પ રવતન લાવવા
માગંો છો?
તમે થુફોસમા ં
જોડાયેલા રહવા માગંો
છો?
Remarks
6. Job Fair Questionnaire
Job Fair
Name Area Contact No
રોજગારી માટે
જોબફેર થાય છે
તેમા ંતમે ભાગ
લીધો હતો?
તેમા ંભાગ
લીધા પછી
તમને કોઈ
જોબ મળી
હતી?
હાલમા ંતમે યા ં
જોબ કરો છો?
જોબફેર િવશે
તમને માિહતી
ક્યાથંી મળી?
હાલમા ંતમે
યથુ ફોસર્ સાથે
જોડાયેલા
છો?
Remarks
7. Company Placements Questionnaire
Company Placements
Name Area Contact No
તમે યથુ ફોસર્ માથંી
લસેમે ટ કરી હતી?
તે લોકો હજુ
તમારી સાથે
જોડાયેલા છે?
તે લોકો નુ ં
પફ મર્સ કેવ ુ ં
છે?
તમે હજુ લેસમે ટ
કરવાનુ ંચાલ ુરાખવા
માગો છો?
Remarks