Embed Size (px)
Citation preview

Christoph Angerer, Jakob Progsch,
GTC 2017
S7444 - WHAT THE PROFILER IS TELLING YOU: OPTIMIZING GPU KERNELS

2
BEFORE YOU START
1. Know your application
• What does it compute? How is it parallelized? What final performance is expected?
2. Know your hardware
• What are the target machines, how many nodes? Machine-specific optimizations okay?
3. Know your tools
• Strengths and weaknesses of each tool? Learn how to use them (and learn one well!)
4. Know your process
• Performance optimization is a constant learning process
5. Make it so!
The five steps to enlightenment
3
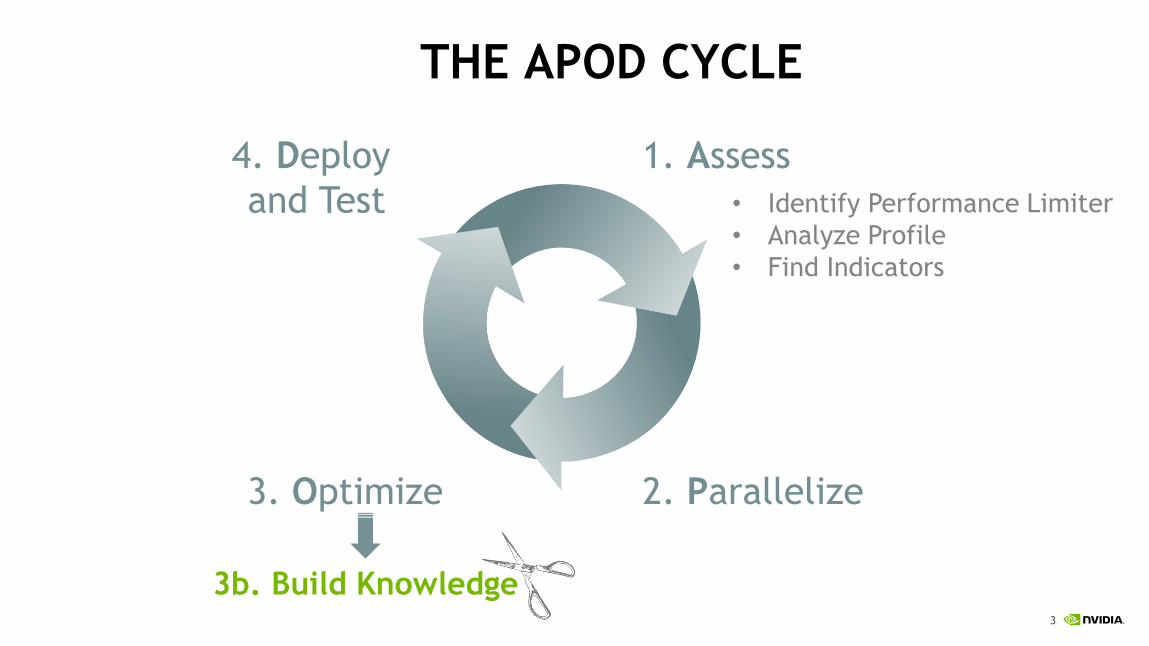
THE APOD CYCLE
1. Assess
• Identify Performance Limiter
• Analyze Profile
• Find Indicators
2. Parallelize3. Optimize
3b. Build Knowledge
4. Deploy
and Test
4
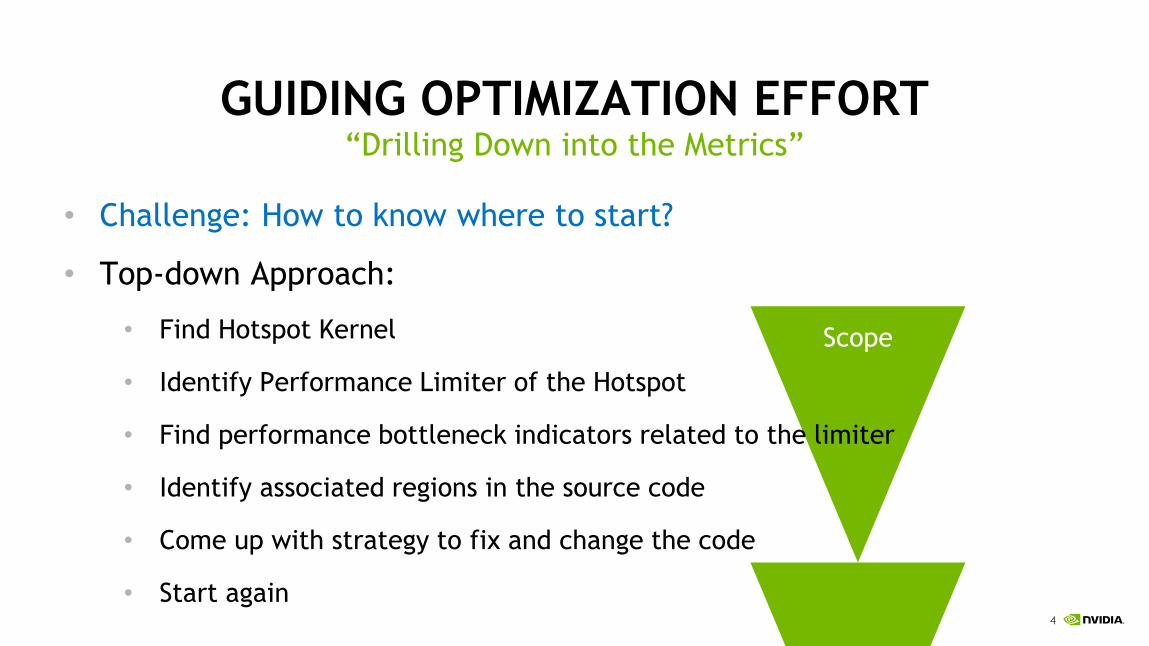
Scope
GUIDING OPTIMIZATION EFFORT
• Challenge: How to know where to start?
• Top-down Approach:
• Find Hotspot Kernel
• Identify Performance Limiter of the Hotspot
• Find performance bottleneck indicators related to the limiter
• Identify associated regions in the source code
• Come up with strategy to fix and change the code
• Start again
“Drilling Down into the Metrics”

5
KNOW YOUR APPLICATION: HPGMG
6
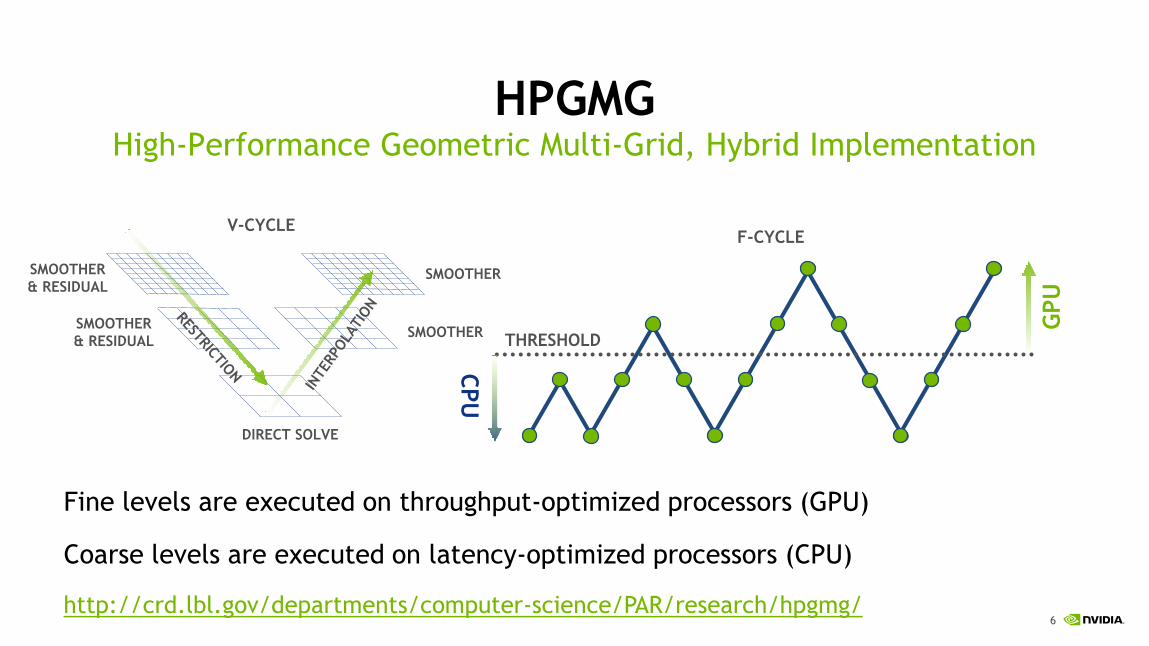
HPGMGHigh-Performance Geometric Multi-Grid, Hybrid Implementation
Fine levels are executed on throughput-optimized processors (GPU)
Coarse levels are executed on latency-optimized processors (CPU)
5/9/2017
GPU
CPU
THRESHOLD
F-CYCLEV-CYCLE
DIRECT SOLVE
SMOOTHER
& RESIDUAL
SMOOTHER
& RESIDUAL
SMOOTHER
SMOOTHER
http://crd.lbl.gov/departments/computer-science/PAR/research/hpgmg/
7
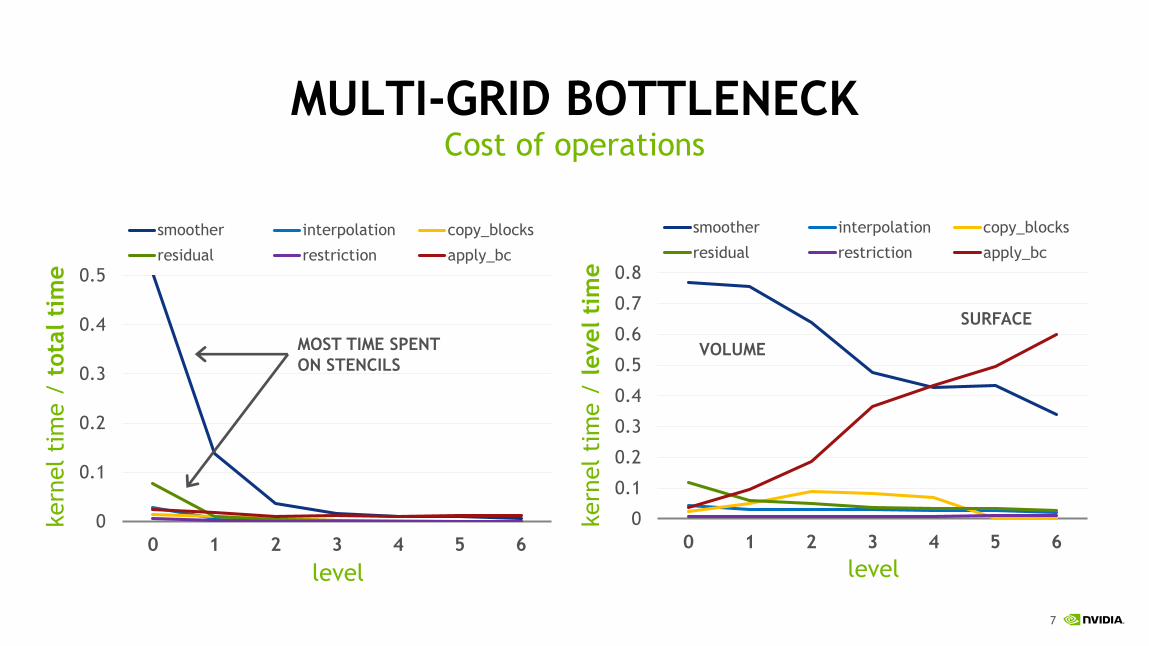
MULTI-GRID BOTTLENECKCost of operations
5/9/2017
level
kern
el ti
me /
tota
l ti
me
0
0.1
0.2
0.3
0.4
0.5
0 1 2 3 4 5 6
smoother interpolation copy_blocks
residual restriction apply_bc
MOST TIME SPENT
ON STENCILS
levelkern
el ti
me /
level ti
me
0
0.1
0.2
0.3
0.4
0.5
0.6
0.7
0.8
0 1 2 3 4 5 6
smoother interpolation copy_blocks
residual restriction apply_bc
VOLUME
SURFACE

8
KNOW YOUR HARDWARE:PASCAL ARCHITECTURE
9
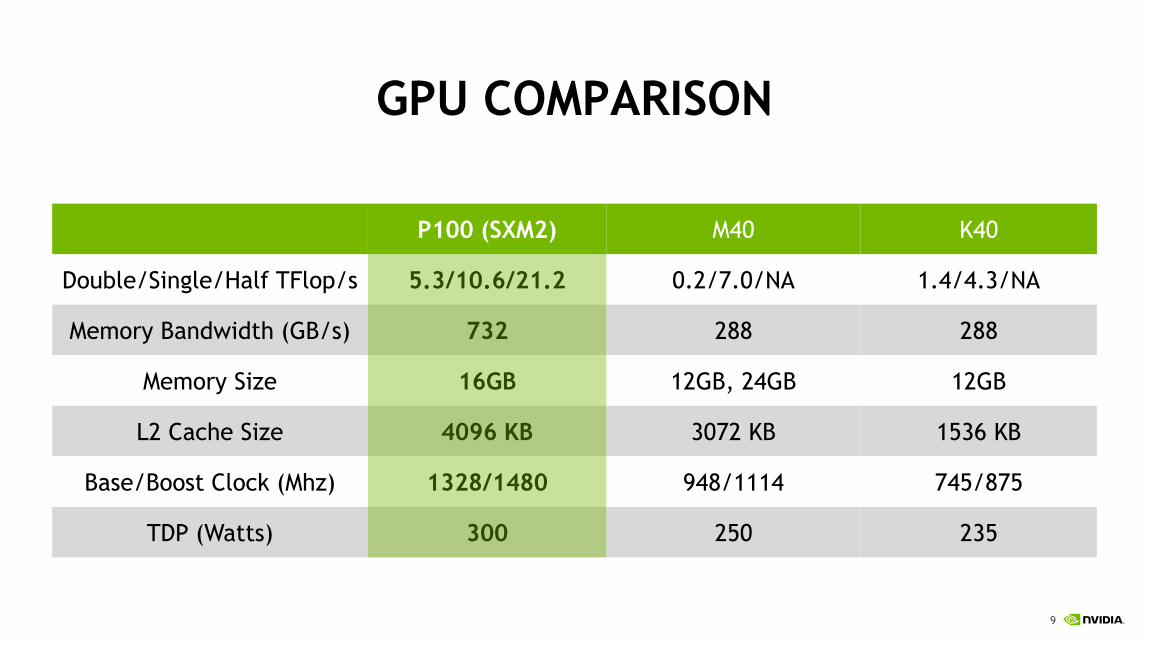
GPU COMPARISON
P100 (SXM2) M40 K40
Double/Single/Half TFlop/s 5.3/10.6/21.2 0.2/7.0/NA 1.4/4.3/NA
Memory Bandwidth (GB/s) 732 288 288
Memory Size 16GB 12GB, 24GB 12GB
L2 Cache Size 4096 KB 3072 KB 1536 KB
Base/Boost Clock (Mhz) 1328/1480 948/1114 745/875
TDP (Watts) 300 250 235
1010
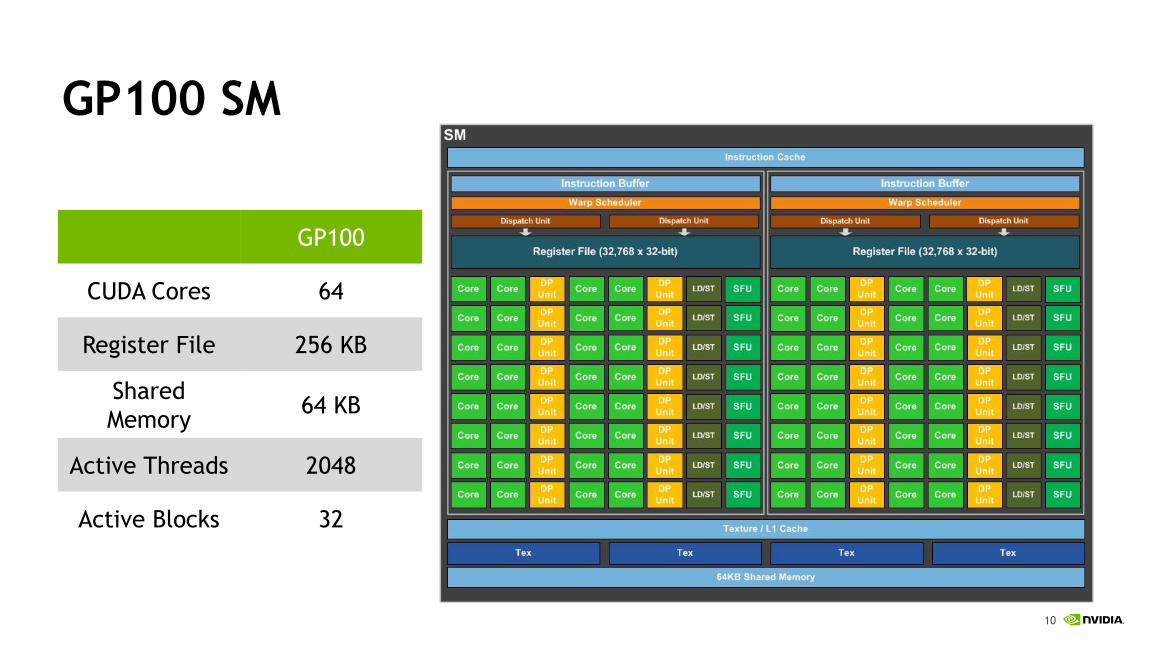
GP100 SM
GP100
CUDA Cores 64
Register File 256 KB
Shared
Memory64 KB
Active Threads 2048
Active Blocks 32

11
KNOW YOUR TOOLS:PROFILERS
12
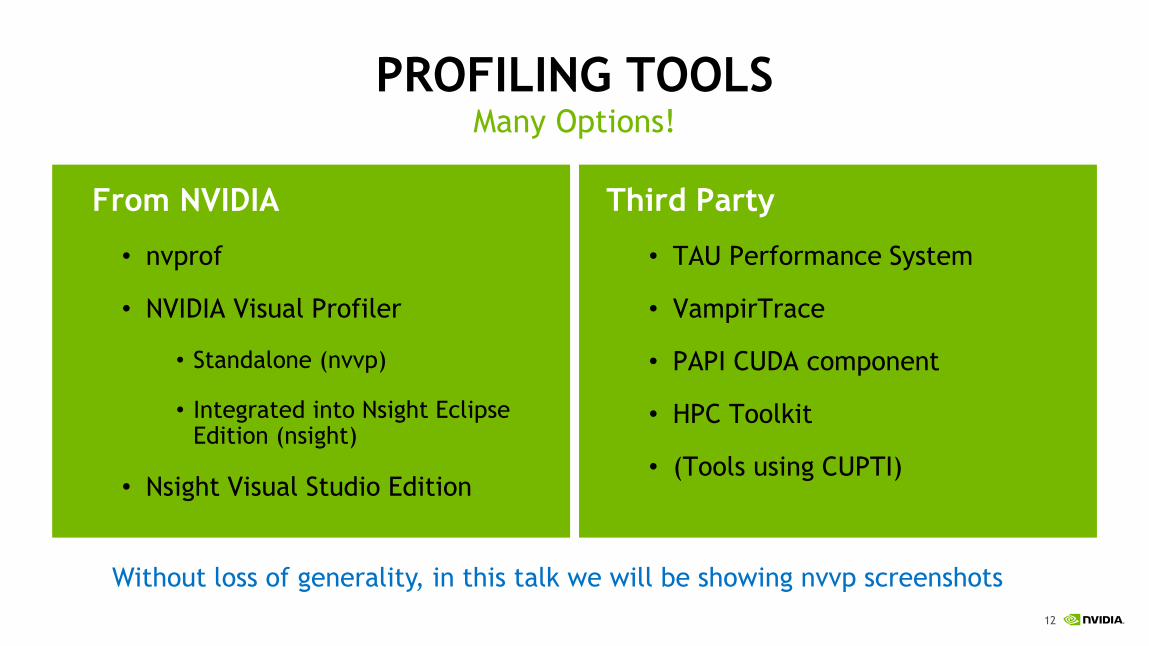
PROFILING TOOLS
From NVIDIA
• nvprof
• NVIDIA Visual Profiler
• Standalone (nvvp)
• Integrated into Nsight Eclipse Edition (nsight)
• Nsight Visual Studio Edition
Third Party
• TAU Performance System
• VampirTrace
• PAPI CUDA component
• HPC Toolkit
• (Tools using CUPTI)
Many Options!
Without loss of generality, in this talk we will be showing nvvp screenshots

13
THE NVVP PROFILER WINDOW
Timeline
Analysis Results
Summary
Guide
• S7824 – DEVELOPER TOOLS UPDATE, Wed 4:00 PM
• S7495 - OPTIMIZING APPLICATION PERFORMANCE
WITH CUDA PROFILING TOOLS, Thur 10:00 AM

14
MAKE IT SO:ITERATION 1
2ND ORDER 7-POINT STENCIL
15
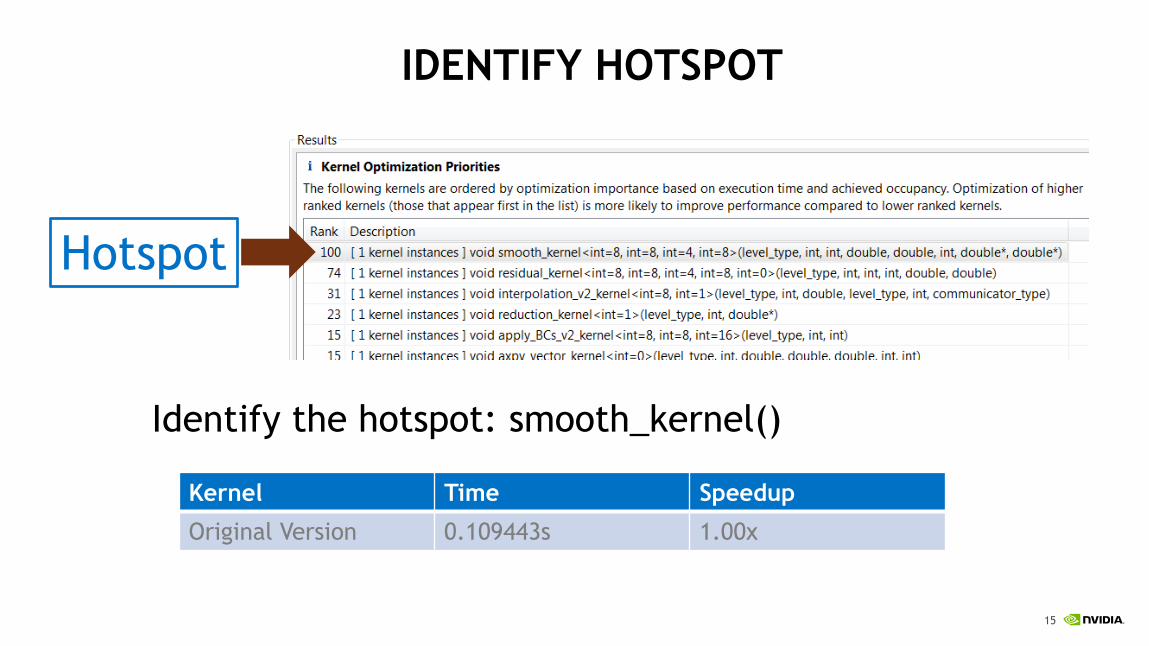
Identify the hotspot: smooth_kernel()
IDENTIFY HOTSPOT
Hotspot
Kernel Time Speedup
Original Version 0.109443s 1.00x
1616
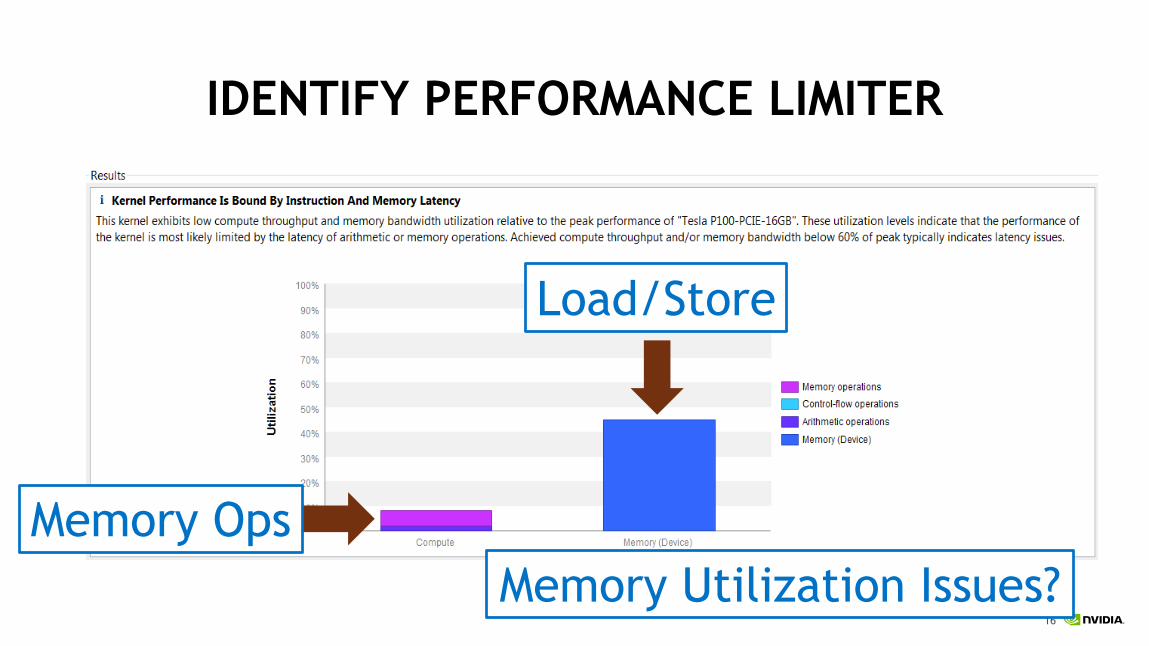
IDENTIFY PERFORMANCE LIMITER
Memory Ops
Load/Store
Memory Utilization Issues?
17
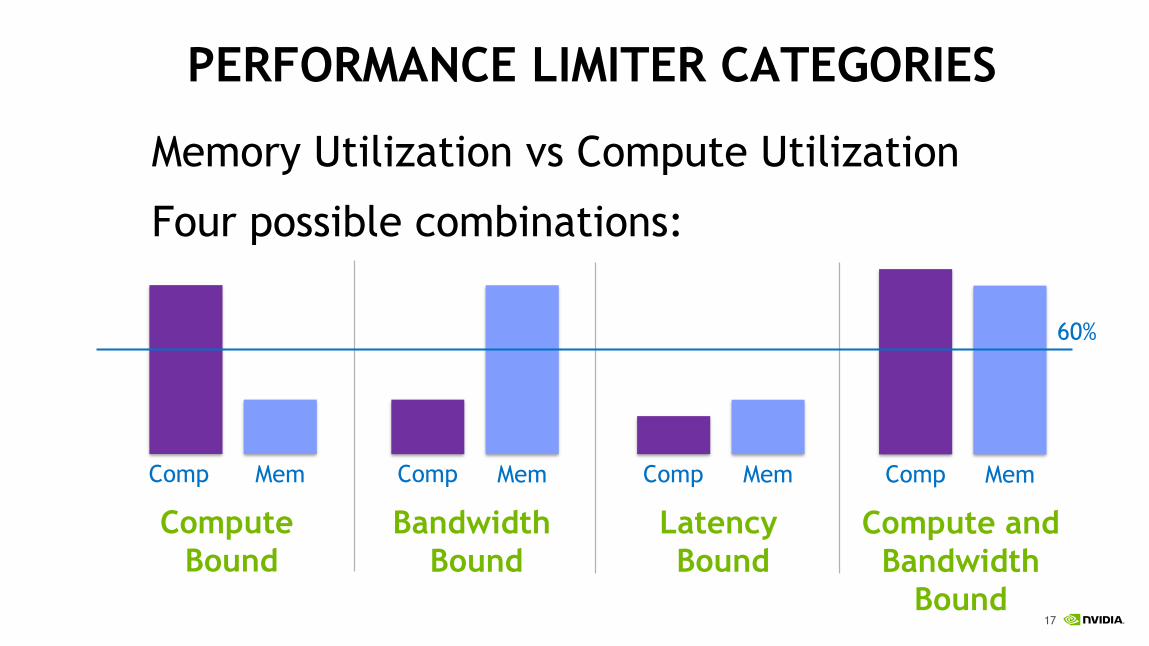
Memory Utilization vs Compute Utilization
Four possible combinations:
PERFORMANCE LIMITER CATEGORIES
Comp Mem
Compute
Bound
Comp Mem
Bandwidth
Bound
Comp Mem
Latency
Bound
Comp Mem
Compute and
Bandwidth
Bound
60%

1818
DRILLING DOWN: LATENCY ANALYSIS
19
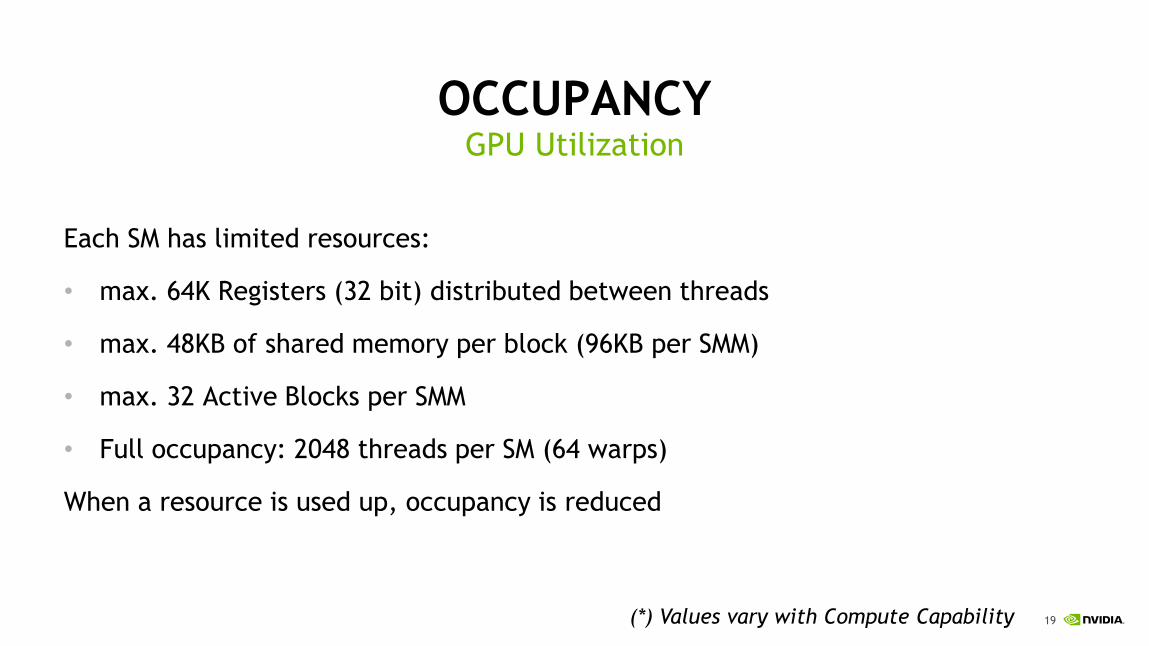
OCCUPANCY
Each SM has limited resources:
• max. 64K Registers (32 bit) distributed between threads
• max. 48KB of shared memory per block (96KB per SMM)
• max. 32 Active Blocks per SMM
• Full occupancy: 2048 threads per SM (64 warps)
When a resource is used up, occupancy is reduced
GPU Utilization
(*) Values vary with Compute Capability

20
LATENCY
GPUs cover latencies by having a lot of work in flight
warp 0
warp 1
warp 2
warp 3
warp 4
warp 5
warp 6
warp 7
warp 8
warp 9
The warp issues
The warp waits (latency)
Fully covered latencywarp 0
warp 1
warp 2
warp 3
No warp issues
Exposed latency, not enough warps
21
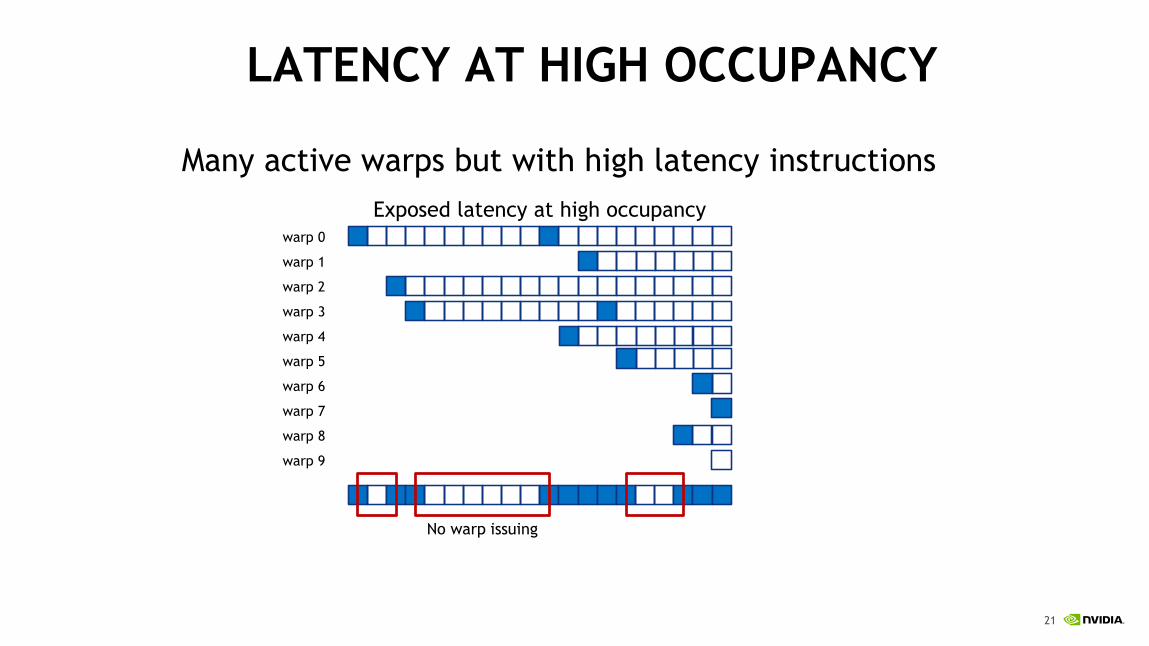
LATENCY AT HIGH OCCUPANCY
Many active warps but with high latency instructions
Exposed latency at high occupancy
No warp issuing
warp 0
warp 1
warp 2
warp 3
warp 4
warp 5
warp 6
warp 7
warp 8
warp 9
2222
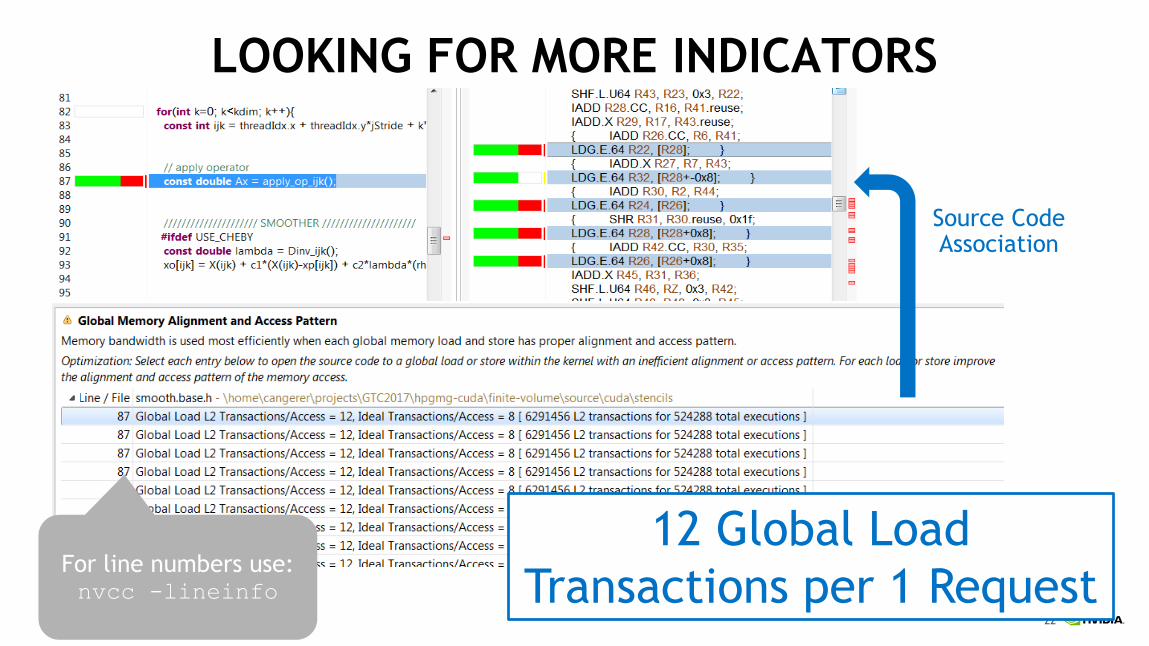
LOOKING FOR MORE INDICATORS
12 Global Load
Transactions per 1 RequestFor line numbers use:nvcc -lineinfo
Source Code Association
23
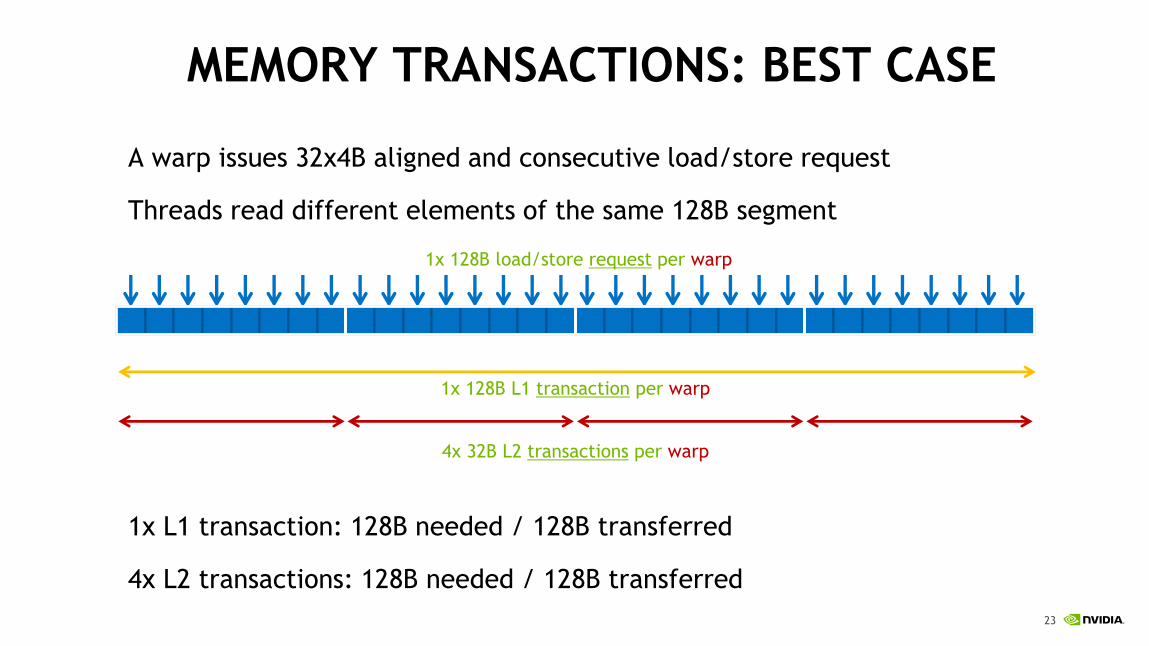
MEMORY TRANSACTIONS: BEST CASE
A warp issues 32x4B aligned and consecutive load/store request
Threads read different elements of the same 128B segment
1x L1 transaction: 128B needed / 128B transferred
4x L2 transactions: 128B needed / 128B transferred
1x 128B L1 transaction per warp
4x 32B L2 transactions per warp
1x 128B load/store request per warp
24
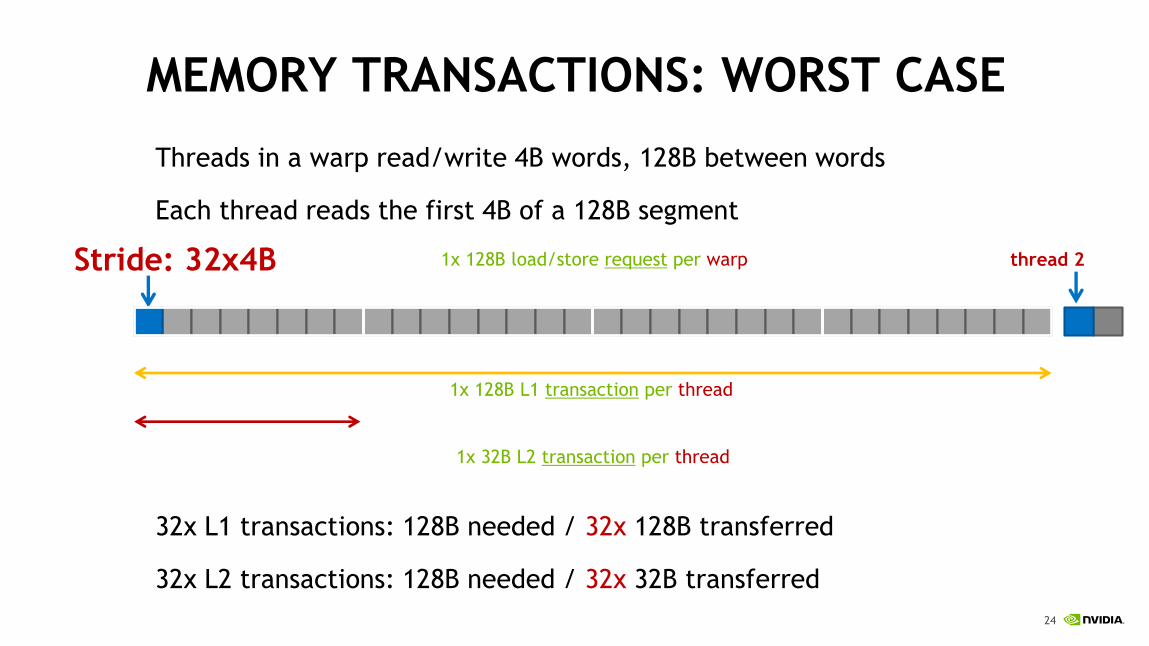
MEMORY TRANSACTIONS: WORST CASE
Threads in a warp read/write 4B words, 128B between words
Each thread reads the first 4B of a 128B segment
32x L1 transactions: 128B needed / 32x 128B transferred
32x L2 transactions: 128B needed / 32x 32B transferred
1x 128B L1 transaction per thread
1x 32B L2 transaction per thread
1x 128B load/store request per warpStride: 32x4B thread 2

25
TRANSACTIONS AND REPLAYS
With replays, requests take more time and use more resources
More instructions issued
More memory traffic
Increased execution time
Inst. 0
Issued
Inst. 1
Issued
Inst. 2
Issued
Execution time
Threads
0-7/24-31
Threads
8-15
Threads
16-23
Inst. 0
Completed
Inst. 1
Completed
Inst. 2
Completed
Threads
0-7/24-31
Threads
8-15
Threads
16-23
Transfer data for inst. 0
Transfer data for inst. 1
Transfer data for inst. 2
Extra latencyExtra work (SM)
Extra memory traffic

2626
FIX: BETTER GPU TILINGBefore After
Block Size Up
Memory Utilization Up
Transactions Per Access Down
Kernel Time Speedup
Original Version 0.109443s 1.00x
Better Memory Accesses 0.076051s 1.44x

27
Category: Latency Bound – Occupancy
Problem: Latency is exposed due to low occupancy
Goal: Hide latency behind more parallel work
Indicators: Occupancy low (< 60%)
Execution Dependency High
Strategy: Increase occupancy by:
• Varying block size
• Varying shared memory usage
• Varying register count (use __launch_bounds)
PERF-OPT QUICK REFERENCE CARD

28
Category: Latency Bound – Coalescing
Problem: Memory is accessed inefficiently => high latency
Goal: Reduce #transactions/request to reduce latency
Indicators: Low global load/store efficiency,
High #transactions/#request compared to ideal
Strategy: Improve memory coalescing by:
• Cooperative loading inside a block
• Change block layout
• Aligning data
• Changing data layout to improve locality
PERF-OPT QUICK REFERENCE CARD
29
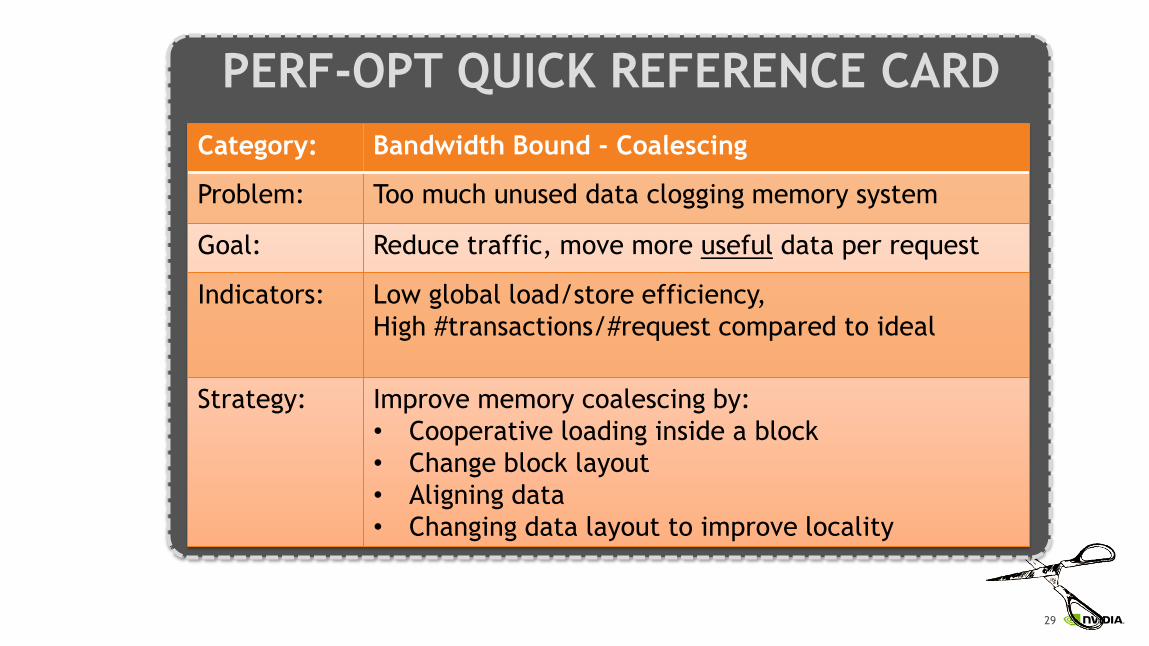
Category: Bandwidth Bound - Coalescing
Problem: Too much unused data clogging memory system
Goal: Reduce traffic, move more useful data per request
Indicators: Low global load/store efficiency,
High #transactions/#request compared to ideal
Strategy: Improve memory coalescing by:
• Cooperative loading inside a block
• Change block layout
• Aligning data
• Changing data layout to improve locality
PERF-OPT QUICK REFERENCE CARD

30
ITERATION 2:REGISTER OPTIMIZATION AND CACHING
3131
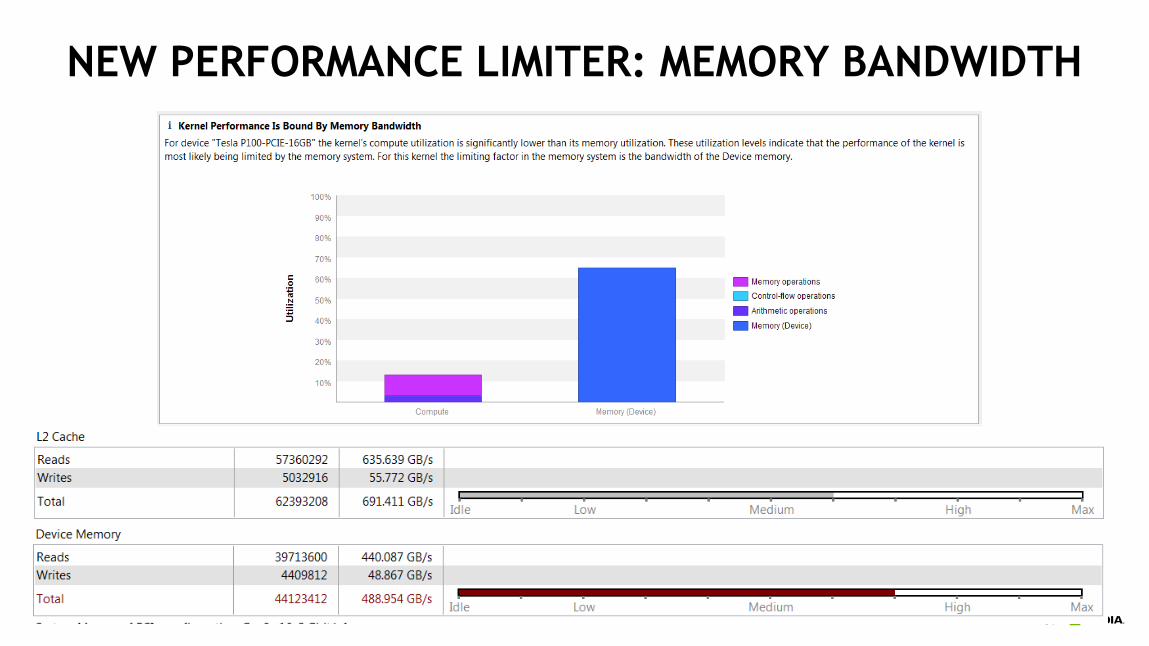
NEW PERFORMANCE LIMITER: MEMORY BANDWIDTH

32
SM
Unifie
d
Cache
Share
d
Mem
ory
Functional Units
Register File
SM
Unifie
d
Cache
Share
d
Mem
ory
Functional Units
Register File
GPU MEMORY HIERARCHYP100 (SMX2)
Global Memory (Framebuffer)
L2$
Bring reused data closer to
the SMs
• Registers (256 KB/SM): good for intra-thread data reuse
• Shared memory (64 KB/SM): good for explicit intra-block data reuse
• L1$/Tex$, L2$ (4096 KB):implicit data reuse
33
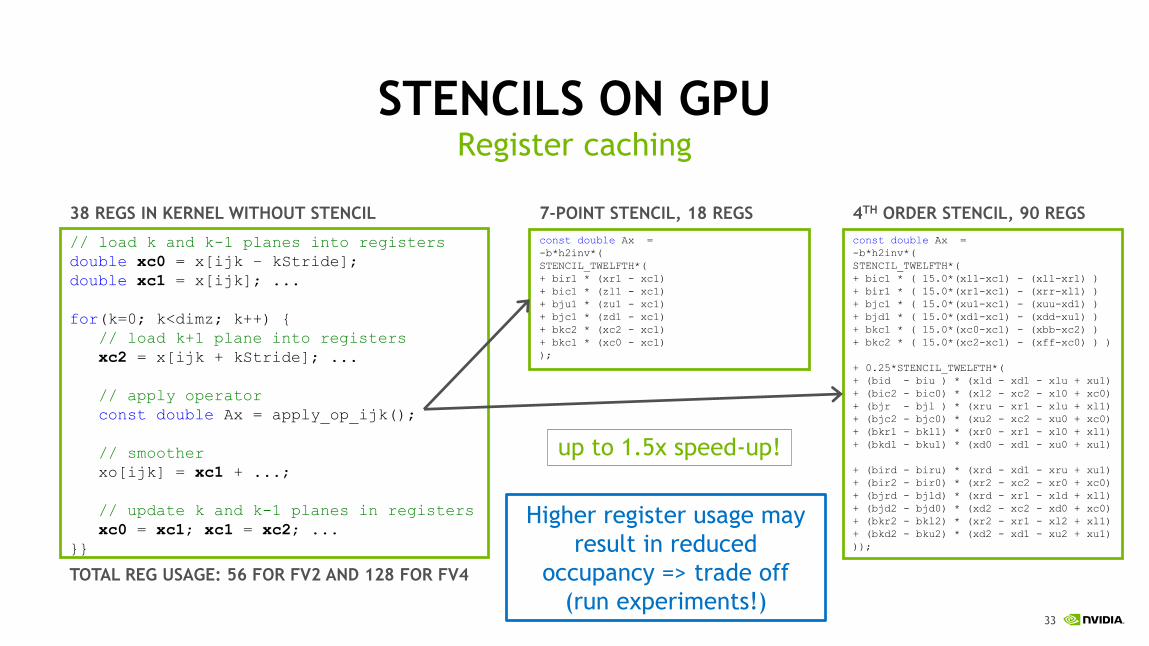
STENCILS ON GPURegister caching
5/9/2017
// load k and k-1 planes into registers
double xc0 = x[ijk – kStride];
double xc1 = x[ijk]; ...
for(k=0; k<dimz; k++) {
// load k+1 plane into registers
xc2 = x[ijk + kStride]; ...
// apply operator
const double Ax = apply_op_ijk();
// smoother
xo[ijk] = xc1 + ...;
// update k and k-1 planes in registers
xc0 = xc1; xc1 = xc2; ...
}}
const double Ax =
-b*h2inv*(
STENCIL_TWELFTH*(
+ bic1 * ( 15.0*(xl1-xc1) - (xll-xr1) )
+ bir1 * ( 15.0*(xr1-xc1) - (xrr-xl1) )
+ bjc1 * ( 15.0*(xu1-xc1) - (xuu-xd1) )
+ bjd1 * ( 15.0*(xd1-xc1) - (xdd-xu1) )
+ bkc1 * ( 15.0*(xc0-xc1) - (xbb-xc2) )
+ bkc2 * ( 15.0*(xc2-xc1) - (xff-xc0) ) )
+ 0.25*STENCIL_TWELFTH*(
+ (bid - biu ) * (xld - xd1 - xlu + xu1)
+ (bic2 - bic0) * (xl2 - xc2 - xl0 + xc0)
+ (bjr - bjl ) * (xru - xr1 - xlu + xl1)
+ (bjc2 - bjc0) * (xu2 - xc2 - xu0 + xc0)
+ (bkr1 - bkl1) * (xr0 - xr1 - xl0 + xl1)
+ (bkd1 - bku1) * (xd0 - xd1 - xu0 + xu1)
+ (bird - biru) * (xrd - xd1 - xru + xu1)
+ (bir2 - bir0) * (xr2 - xc2 - xr0 + xc0)
+ (bjrd - bjld) * (xrd - xr1 - xld + xl1)
+ (bjd2 - bjd0) * (xd2 - xc2 - xd0 + xc0)
+ (bkr2 - bkl2) * (xr2 - xr1 - xl2 + xl1)
+ (bkd2 - bku2) * (xd2 - xd1 - xu2 + xu1)
));
4TH ORDER STENCIL, 90 REGS38 REGS IN KERNEL WITHOUT STENCIL
const double Ax =
-b*h2inv*(
STENCIL_TWELFTH*(
+ bir1 * (xr1 - xc1)
+ bic1 * (zl1 - xc1)
+ bju1 * (zu1 - xc1)
+ bjc1 * (zd1 - xc1)
+ bkc2 * (xc2 - xc1)
+ bkc1 * (xc0 - xc1)
);
7-POINT STENCIL, 18 REGS
TOTAL REG USAGE: 56 FOR FV2 AND 128 FOR FV4
up to 1.5x speed-up!
Higher register usage may
result in reduced
occupancy => trade off
(run experiments!)
3434
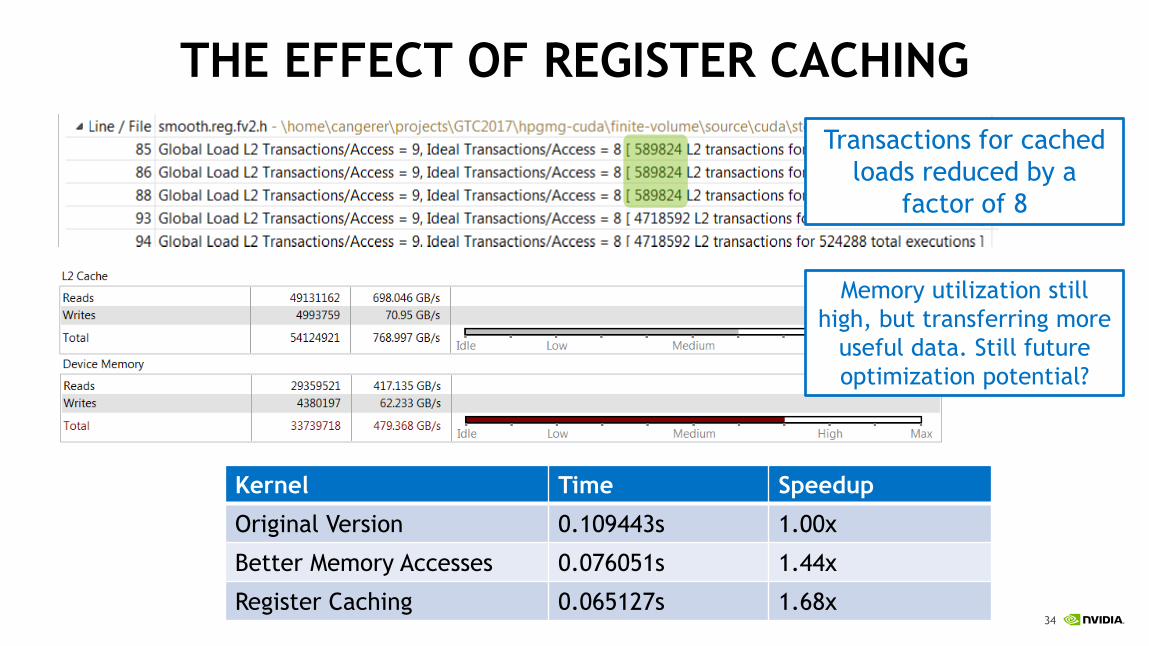
THE EFFECT OF REGISTER CACHING
Transactions for cached
loads reduced by a
factor of 8
Memory utilization still
high, but transferring more
useful data. Still future
optimization potential?
Kernel Time Speedup
Original Version 0.109443s 1.00x
Better Memory Accesses 0.076051s 1.44x
Register Caching 0.065127s 1.68x
35
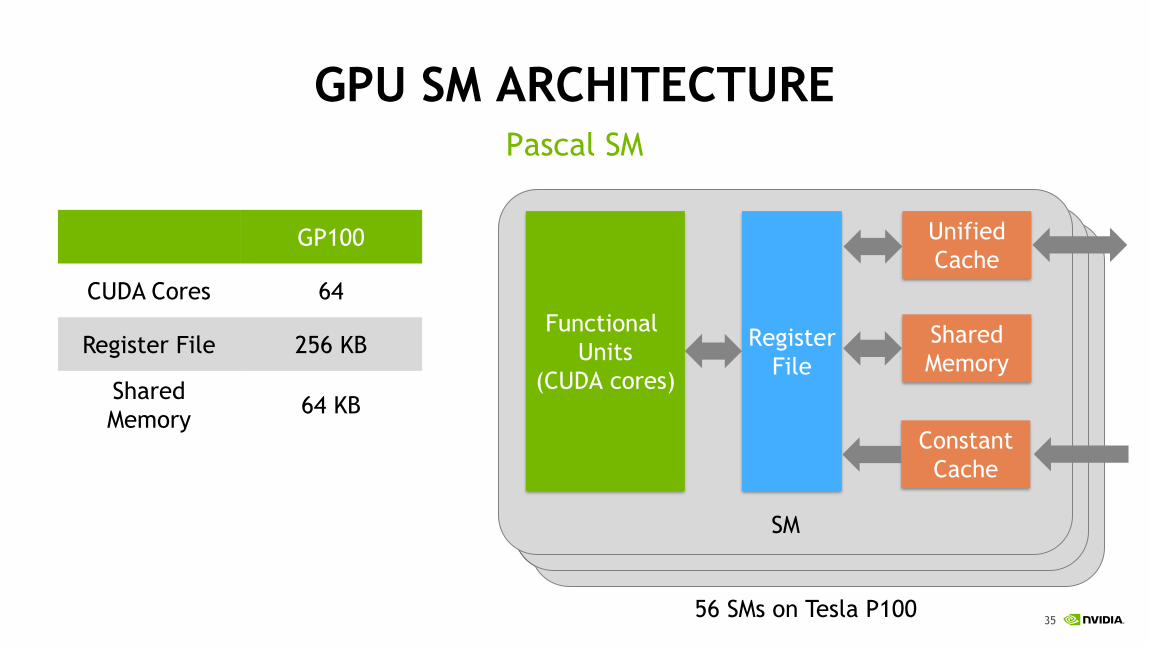
GPU SM ARCHITECTUREPascal SM
SMSM
SMSM
Register
File
Unified
Cache
Functional
Units
(CUDA cores)
Shared
Memory
GP100
CUDA Cores 64
Register File 256 KB
Shared
Memory64 KB
Constant
Cache
56 SMs on Tesla P100
36
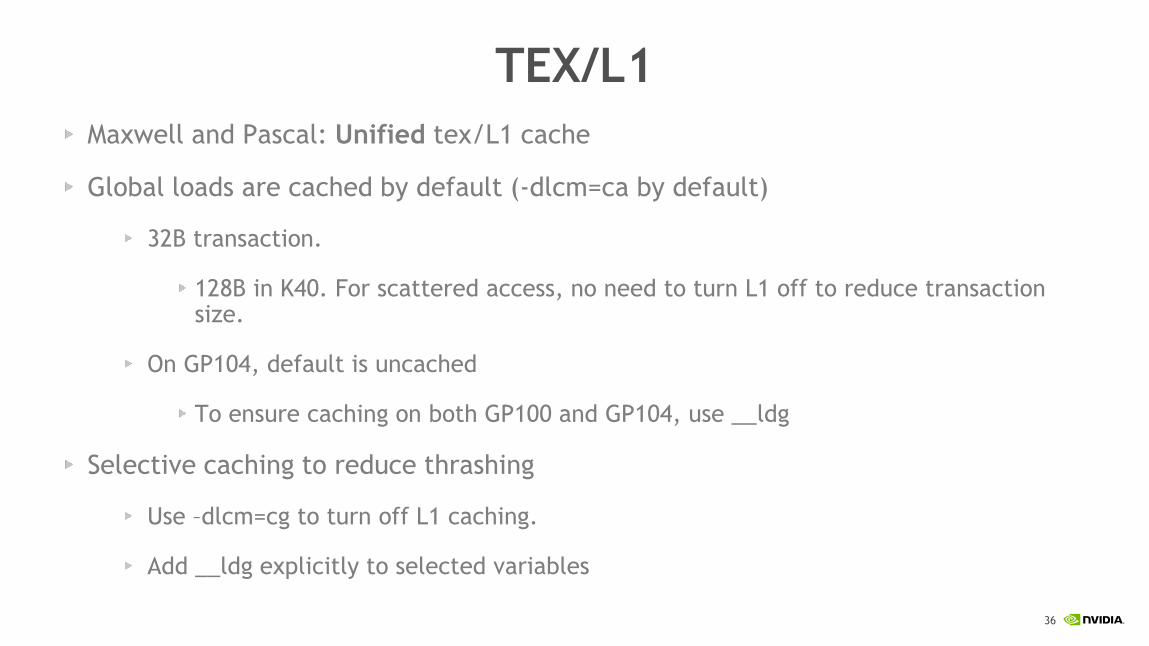
TEX/L1
Maxwell and Pascal: Unified tex/L1 cache
Global loads are cached by default (-dlcm=ca by default)
32B transaction.
128B in K40. For scattered access, no need to turn L1 off to reduce transaction size.
On GP104, default is uncached
To ensure caching on both GP100 and GP104, use __ldg
Selective caching to reduce thrashing
Use –dlcm=cg to turn off L1 caching.
Add __ldg explicitly to selected variables
37
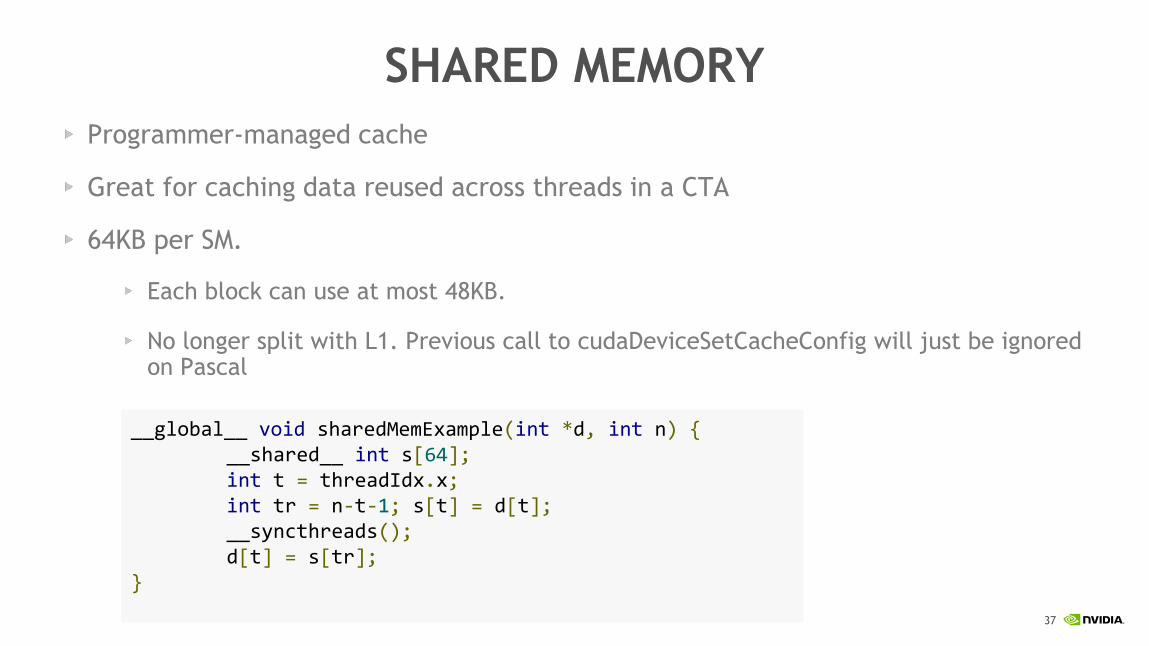
SHARED MEMORY
Programmer-managed cache
Great for caching data reused across threads in a CTA
64KB per SM.
Each block can use at most 48KB.
No longer split with L1. Previous call to cudaDeviceSetCacheConfig will just be ignored on Pascal
__global__ void sharedMemExample(int *d, int n) {__shared__ int s[64];int t = threadIdx.x;int tr = n-t-1; s[t] = d[t];__syncthreads();d[t] = s[tr];
}
38
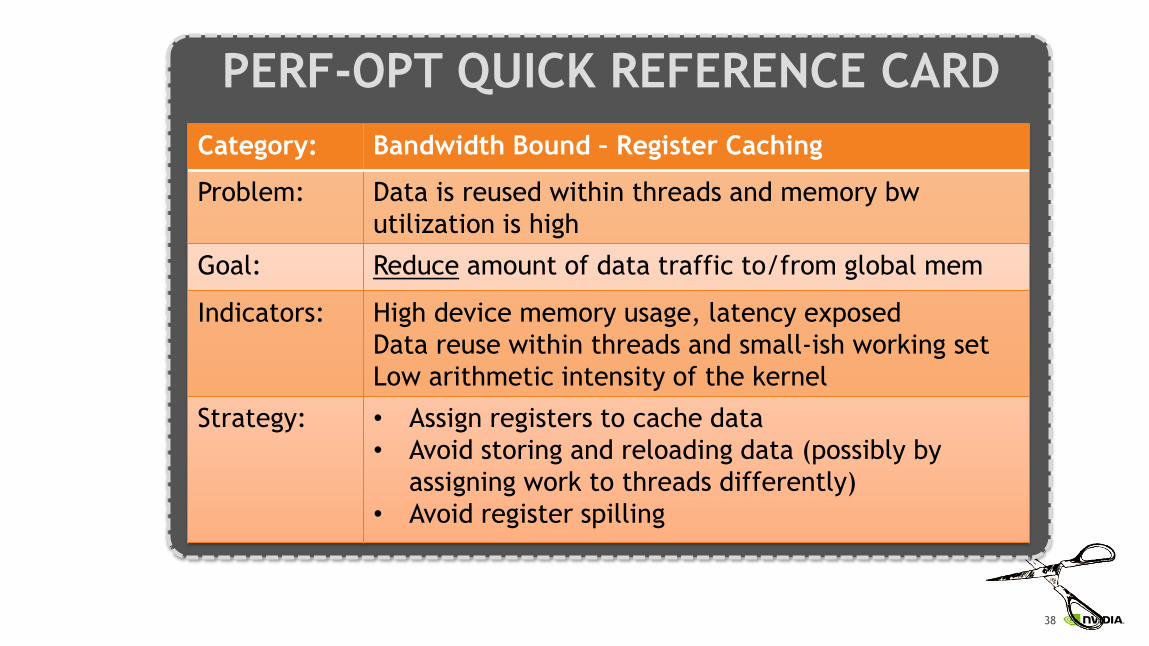
Category: Bandwidth Bound – Register Caching
Problem: Data is reused within threads and memory bw
utilization is high
Goal: Reduce amount of data traffic to/from global mem
Indicators: High device memory usage, latency exposed
Data reuse within threads and small-ish working set
Low arithmetic intensity of the kernel
Strategy: • Assign registers to cache data
• Avoid storing and reloading data (possibly by
assigning work to threads differently)
• Avoid register spilling
PERF-OPT QUICK REFERENCE CARD
39
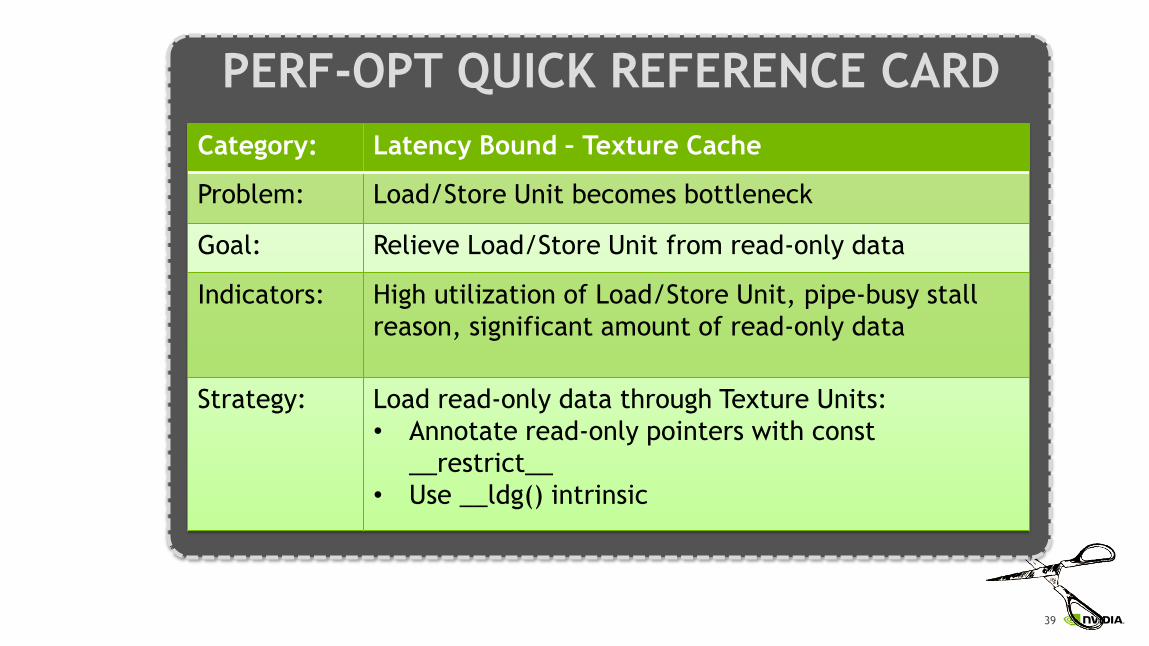
Category: Latency Bound – Texture Cache
Problem: Load/Store Unit becomes bottleneck
Goal: Relieve Load/Store Unit from read-only data
Indicators: High utilization of Load/Store Unit, pipe-busy stall
reason, significant amount of read-only data
Strategy: Load read-only data through Texture Units:
• Annotate read-only pointers with const
__restrict__
• Use __ldg() intrinsic
PERF-OPT QUICK REFERENCE CARD
40
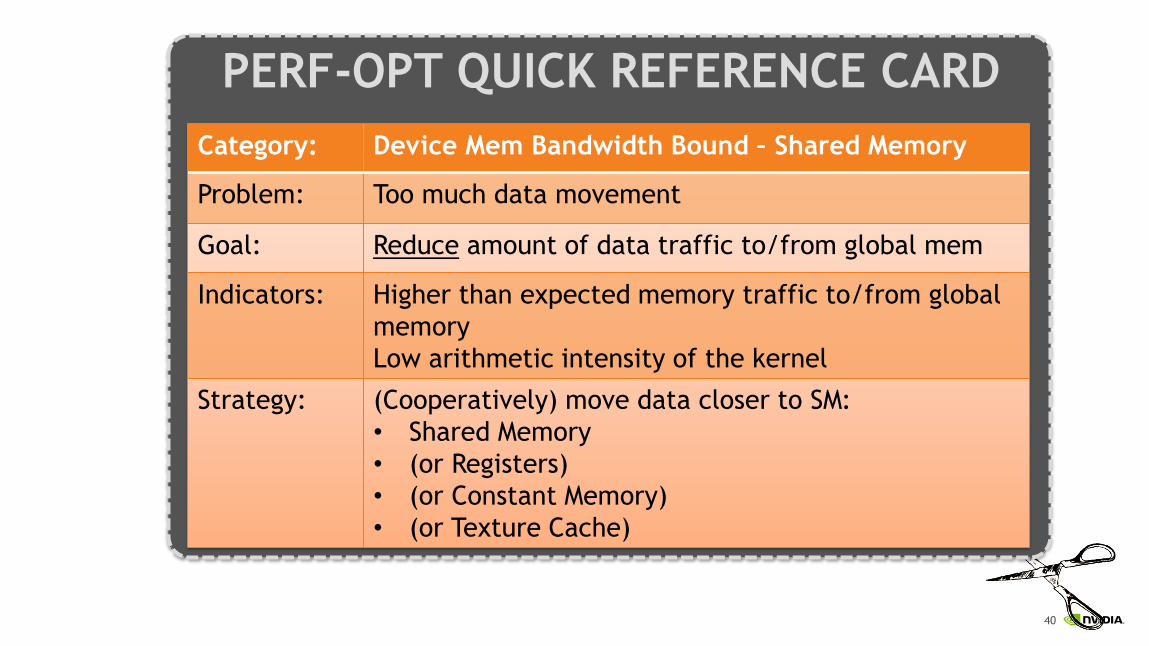
Category: Device Mem Bandwidth Bound – Shared Memory
Problem: Too much data movement
Goal: Reduce amount of data traffic to/from global mem
Indicators: Higher than expected memory traffic to/from global
memory
Low arithmetic intensity of the kernel
Strategy: (Cooperatively) move data closer to SM:
• Shared Memory
• (or Registers)
• (or Constant Memory)
• (or Texture Cache)
PERF-OPT QUICK REFERENCE CARD

41
Category: Shared Mem Bandwidth Bound – Shared Memory
Problem: Shared memory bandwidth bottleneck
Goal: Reduce amount of data traffic to/from global mem
Indicators: Shared memory loads or stores saturate
Strategy: Reduce Bank Conflicts (insert padding)
Move data from shared memory into registers
Change data layout in shared memory
PERF-OPT QUICK REFERENCE CARD

42
ITERATION 3:KERNELS WITH INCREASED
ARITHMETIC INTENSITY

43
HPGMG4th order vs 2nd order
Performs 4x the FP operations
MPI: sends 3x the messages, doubles the size (2-deep halos)
DRAM memory footprint is the same (assuming no overfetch)
Attains lower relative residual: ~10-9 for a single F-cycle
5/9/2017
K-2 K+1 K+2K-1 K

4444
FUNCTION UNIT UTILIZATION AND STALL REASONS
Functional units are not the bottlenecks in
HPGMG, even with higher order stencils!
Execution Dependencies
starting to become
significant!
45
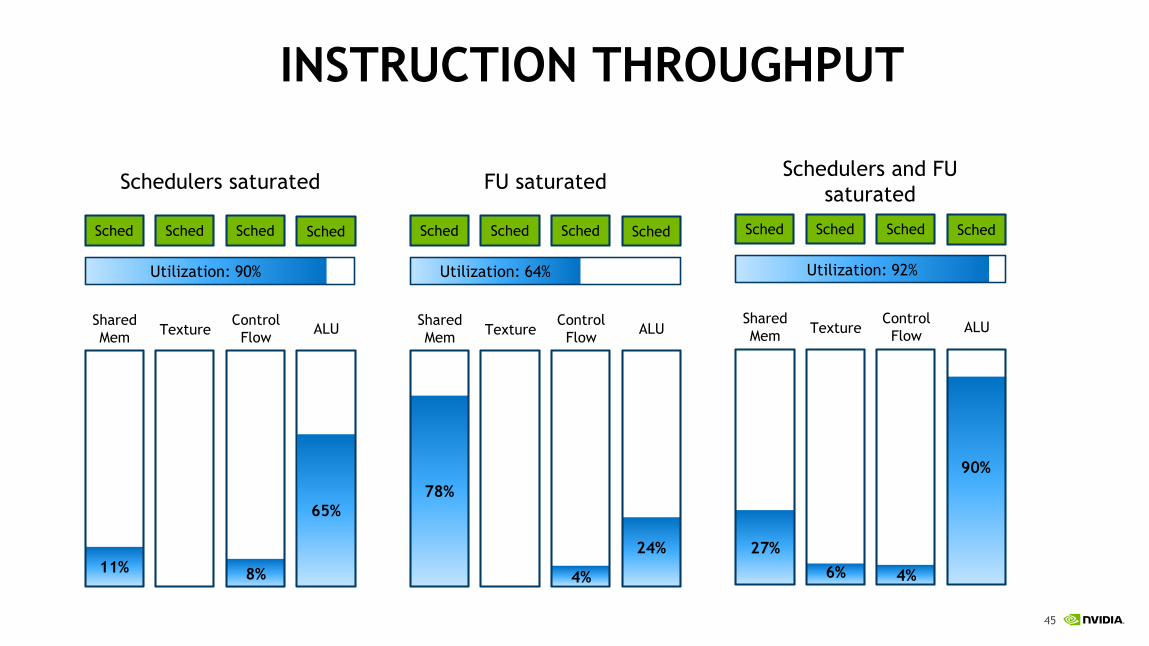
4%6%4%8%
INSTRUCTION THROUGHPUT
Sched Sched Sched Sched
Schedulers saturated
Utilization: 90%
Shared
MemTexture
Control
FlowALU
11%
65%
Sched Sched Sched Sched
Schedulers and FU
saturated
27%
Utilization: 92%
Shared
MemTexture
Control
FlowALU
90%
Sched Sched Sched Sched
FU saturated
78%
Utilization: 64%
Shared
MemTexture
Control
FlowALU
24%
46
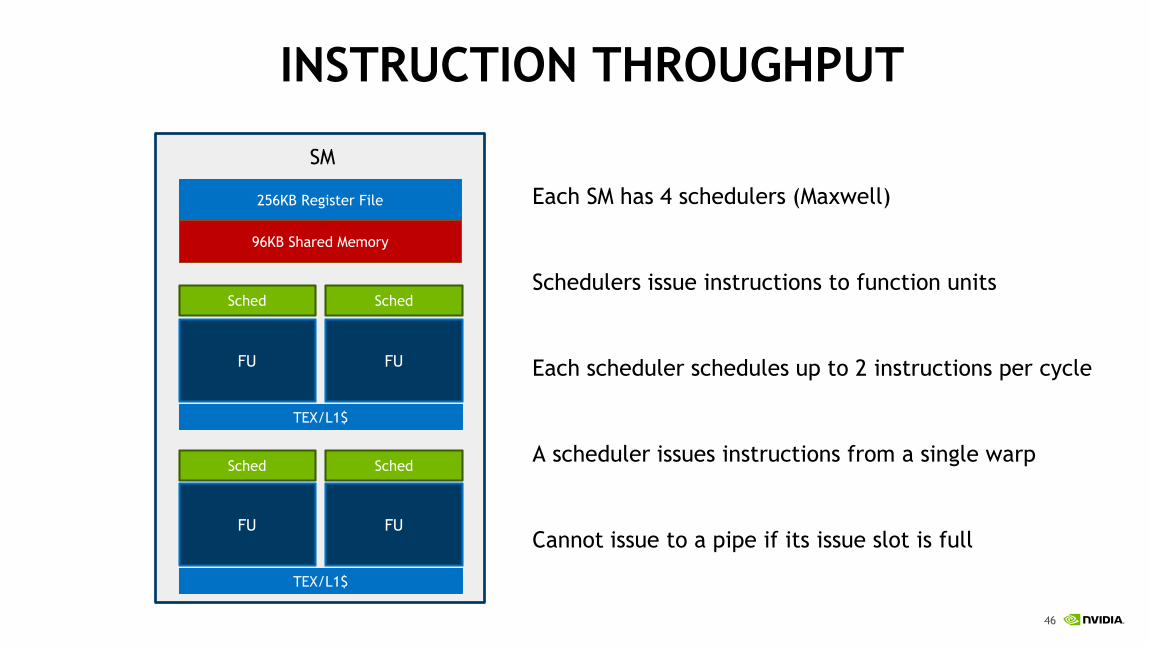
INSTRUCTION THROUGHPUT
Each SM has 4 schedulers (Maxwell)
Schedulers issue instructions to function units
Each scheduler schedules up to 2 instructions per cycle
A scheduler issues instructions from a single warp
Cannot issue to a pipe if its issue slot is full
SM
FU
Sched
TEX/L1$
256KB Register File
FU
Sched
FU
Sched
TEX/L1$
FU
Sched
96KB Shared Memory
47
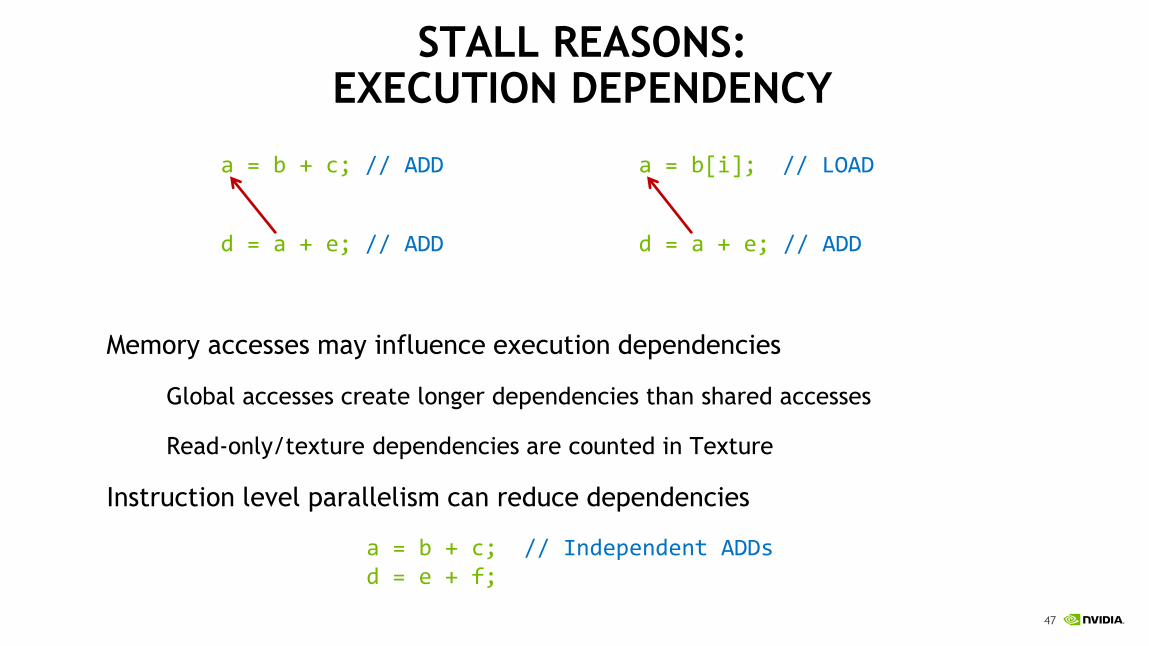
STALL REASONS: EXECUTION DEPENDENCY
Memory accesses may influence execution dependencies
Global accesses create longer dependencies than shared accesses
Read-only/texture dependencies are counted in Texture
Instruction level parallelism can reduce dependencies
a = b + c; // ADD
d = a + e; // ADD
a = b[i]; // LOAD
d = a + e; // ADD
a = b + c; // Independent ADDsd = e + f;
48
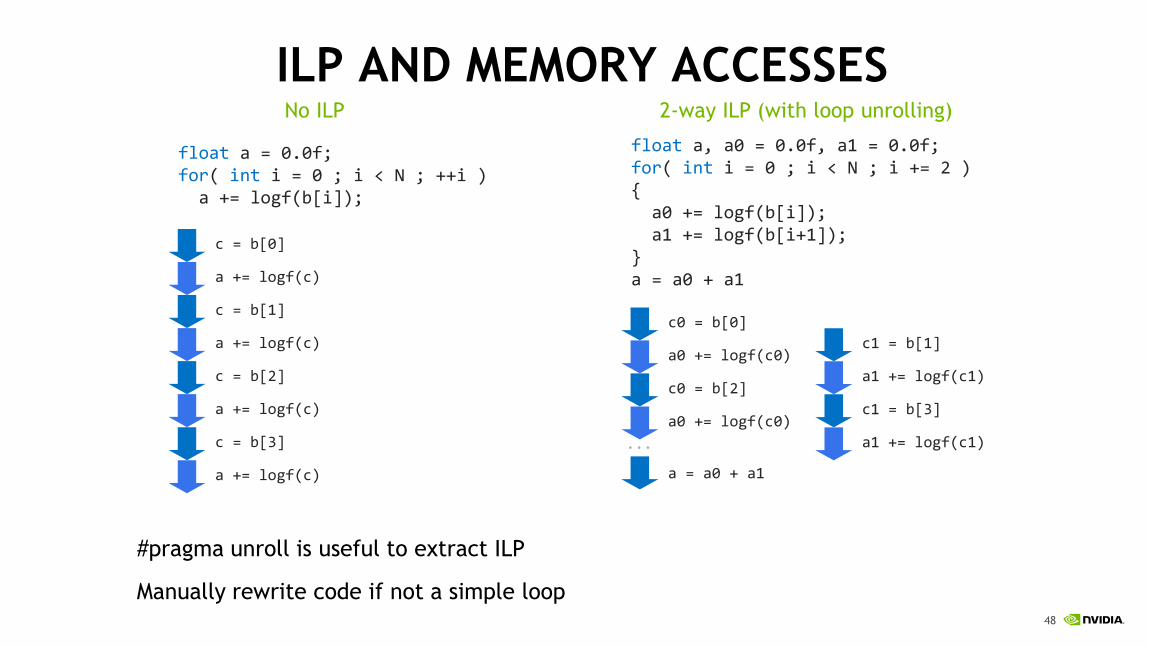
ILP AND MEMORY ACCESSES
#pragma unroll is useful to extract ILP
Manually rewrite code if not a simple loop
float a = 0.0f;for( int i = 0 ; i < N ; ++i )
a += logf(b[i]);
c = b[0]
No ILP 2-way ILP (with loop unrolling)
float a, a0 = 0.0f, a1 = 0.0f;for( int i = 0 ; i < N ; i += 2 ){
a0 += logf(b[i]);a1 += logf(b[i+1]);
}a = a0 + a1a += logf(c)
c = b[1]
a += logf(c)
c = b[2]
a += logf(c)
c = b[3]
a += logf(c)
c0 = b[0]
a0 += logf(c0)
c0 = b[2]
a0 += logf(c0)
c1 = b[1]
a1 += logf(c1)
c1 = b[3]
a1 += logf(c1)
a = a0 + a1
...
49
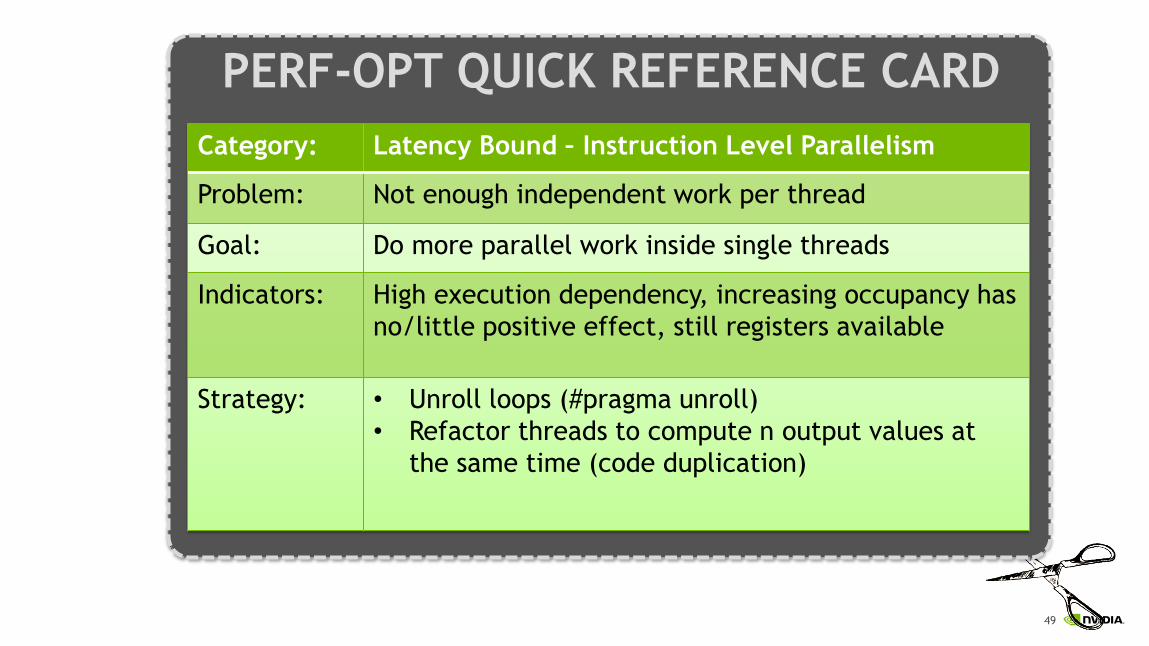
Category: Latency Bound – Instruction Level Parallelism
Problem: Not enough independent work per thread
Goal: Do more parallel work inside single threads
Indicators: High execution dependency, increasing occupancy has
no/little positive effect, still registers available
Strategy: • Unroll loops (#pragma unroll)
• Refactor threads to compute n output values at
the same time (code duplication)
PERF-OPT QUICK REFERENCE CARD

50
Category: Compute Bound – Algorithmic Changes
Problem: GPU is computing as fast as possible
Goal: Reduce computation if possible
Indicators: Clearly compute bound problem, speedup only with
less computation
Strategy: • Pre-compute or store (intermediate) results
• Trade memory for compute time
• Use a computationally less expensive algorithm
• Possibly: run with low occupancy and high ILP
PERF-OPT QUICK REFERENCE CARD

51
SUMMARY
52
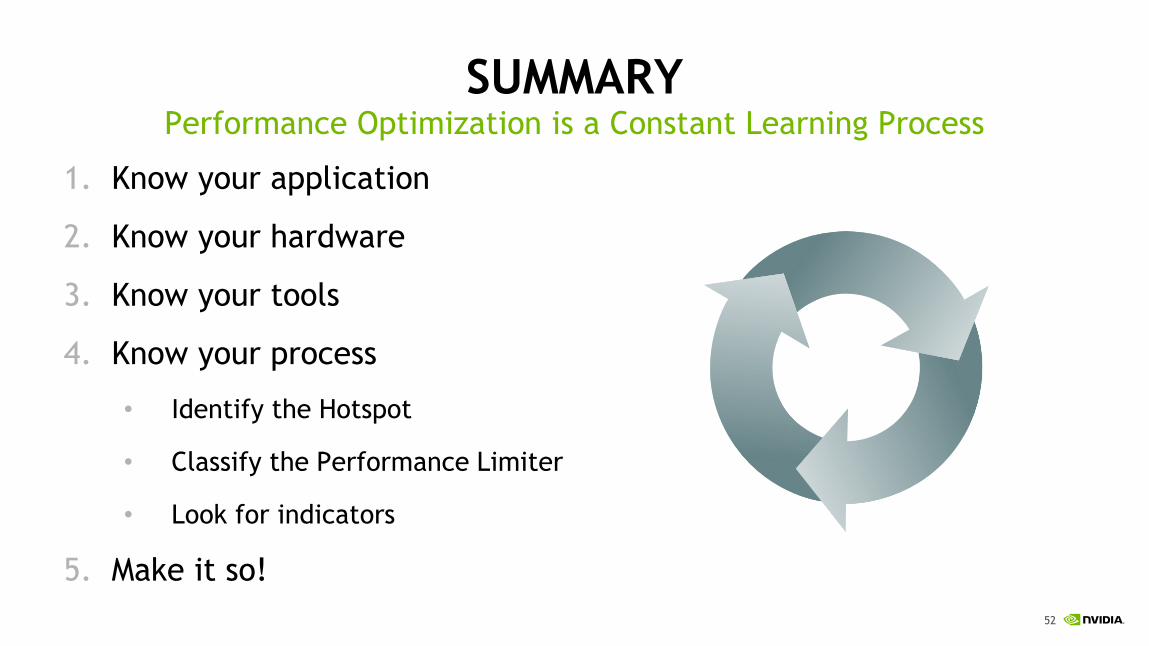
SUMMARY
1. Know your application
2. Know your hardware
3. Know your tools
4. Know your process
• Identify the Hotspot
• Classify the Performance Limiter
• Look for indicators
5. Make it so!
Performance Optimization is a Constant Learning Process
53
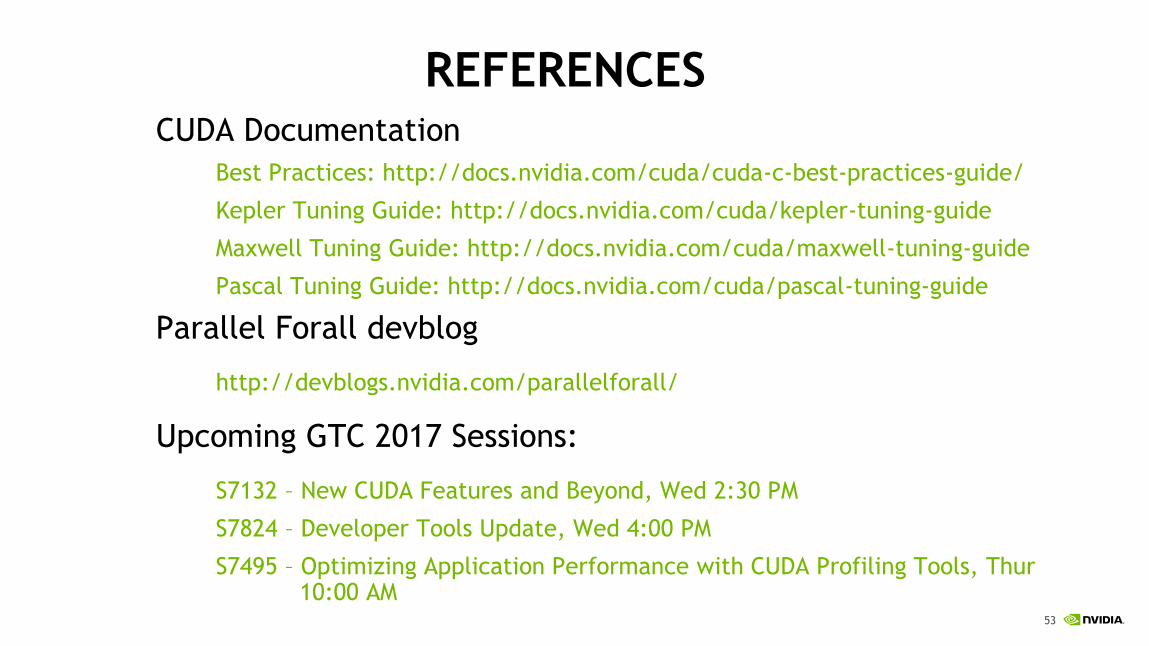
REFERENCESCUDA Documentation
Best Practices: http://docs.nvidia.com/cuda/cuda-c-best-practices-guide/
Kepler Tuning Guide: http://docs.nvidia.com/cuda/kepler-tuning-guide
Maxwell Tuning Guide: http://docs.nvidia.com/cuda/maxwell-tuning-guide
Pascal Tuning Guide: http://docs.nvidia.com/cuda/pascal-tuning-guide
Parallel Forall devblog
http://devblogs.nvidia.com/parallelforall/
Upcoming GTC 2017 Sessions:
S7132 – New CUDA Features and Beyond, Wed 2:30 PM
S7824 – Developer Tools Update, Wed 4:00 PM
S7495 – Optimizing Application Performance with CUDA Profiling Tools, Thur10:00 AM

THANK YOU
JOIN THE NVIDIA DEVELOPER PROGRAM AT
developer.nvidia.com/join