Embed Size (px)
Citation preview

SECOND CONTAINER PORT ADVICE – EVIDENCE BASE Discussion Paper
IntroductionThis discussion paper provides an overview of the evidence Infrastructure Victoria will consider in developing its advice to the Special Minister of State on when and where the Government should invest in new container port capacity for the State.
This is not our advice to the Minister, it is the information, data and analysis we have collected to date. We must provide our advice to the Minister by May 2017.
Our future advice to the Minister will help ensure that the Victorian Government is well placed to make an informed decision about when to invest in new capacity, and whether that capacity should be at the Port of Melbourne, or at a new port at either Bay West or Hastings. From the evidence collected thus far it is clear that all options have pros and cons for the Government to consider.
The release of this discussion paper and body of evidence is the next important step in our consultation process to help develop our advice.
In September 2016, we released our discussion paper Preparing advice on Victoria’s future port capacity, which sought to begin building understanding and consensus among the community and stakeholders on the key factors we should consider as we prepare our advice.
We heard from many different groups and this feedback has helped shape our work and inform this paper. Our consultation summary paper, released together with this paper, provides more detail on what we heard and how it has been used. You can view this document on our website.
Our advice on when we might need a new port and where it should be located must be based on the best available evidence. We have used existing studies, undertaken new technical investigations and consulted with key stakeholders and local communities over the past six months to develop this evidence.
As our work has progressed, it has become clear there are a number of factors that will be critical to our advice on when to invest in new capacity and where. These are:
Ship size: what size ships, and how many, are likely to want to visit Australia, what is the biggest ship that can access the Port Phillip Heads, and how much we value being able to accept an unrestricted ship size.

Cost of complementary infrastructure: the capital and operating cost of the complementary transport infrastructure to support each port.
Environmental and social impacts: the impact expanding the Port of Melbourne or developing a new port would have on significant environmental and social values, and what that means for the difficulty of securing environmental approvals.
This paper explains the evidence we have gathered on these factors, as well as other issues that need to be considered when planning new port capacity, such as trade and container demand forecasts.
We have had our work and technical reports peer reviewed. This evidence is available in our document library at infrastructurevictoria.com.au.
Consistent with our approach, we are releasing this evidence to help promote understanding and build consensus on our evidence base.
We are now inviting stakeholders and the community to consider this evidence and bring forward any further evidence they may have, before we deliver our advice to the Minister in May this year.
HOW TO NAVIGATE THIS PAPERThe paper can be read from end to end, to give you an overview of evidence we will use to develop our advice.
This paper acts as a guide to the technical reports we are releasing for each of our work streams, and is also a standalone document which provides a comprehensive overview of our evidence. The ports and freight sector is technical, and like many technical fields comes with a lot of jargon and assumed technical knowledge. For people without a history in this field, we recommend using this report as a starting point before reading the technical reports.
If you are familiar with this topic, and have a particular area of interest, then you can go straight to the ‘Evidence’ sections, which summarise our key technical reports. These sections also state which technical studies to look at if you want more detail as you read this paper.
If you would like to know how we will analyse this evidence and prepare our advice to the Minister, go to the ‘Next steps’ section.
To find out how to comment on our evidence base or put forward new evidence go to the ‘Getting involved’ section.
WANT TO FIND OUT MORE?We commissioned work on the key factors described in our first discussion paper, Preparing advice on Victoria’s future ports capacity, released in September 2016. We are releasing the
Infrastructure Victoria Second Container Port Advice – Evidence Base2

technical reports we commissioned, which provide much greater detail and form the evidence base we will analyse to ultimately prepare our advice. These reports underpin this paper and contain a significant volume of information. If you are interested we encourage you to read these documents and provide us with written comments by 3 April, or come along to a drop-in session (details at yoursay.infrastructurevictoria.com.au).
We are also releasing a consultation summary paper, which documents who we spoke to between September and December 2016, what we heard and how this has influenced our work.
All of these reports are available in our document library at infrastructurevictoria.com.au.
ContentsINTRODUCTION 1 LIST OF FIGURES 4 LIST OF TABLES 5 Glossary and abbreviations 5 What this paper is about 8 What this paper is not about 8 Our Terms of Reference 9 A consultative approach 10 What you have told us so far 11 CHOOSING A NEW PORT 12 It is complex to choose when and where to invest in new port capacity 12 The importance of an efficient international port 14 Port capacity factors 16 Victorian commercial ports today 18 EVIDENCE FOR FUTURE DEMAND, CHANNEL CAPACITY AND SHIP SIZES 19 Demand forecasts 19 Channel capacity, including Port Phillip Heads 24 Changing ship sizes 33 EVIDENCE FOR WHEN A SECOND PORT WILL BE REQUIRED 42 Port of Melbourne supply chains 43 Port of Melbourne road and rail links beyond the port gate 48 Capacity of the Port of Melbourne 52 Environmental and social considerations 64 Triggers to invest in a second container port 67 EVIDENCE FOR WHERE A SECOND CONTAINER PORT SHOULD BE LOCATED 69 Hastings port concept 72 Potential environmental and social impacts 88 Bay West port concept 94 Potential environmental and social impacts 107 NEXT STEPS – DEVELOPING OUR ADVICE 114 GETTING INVOLVED 116 SOURCES 117ABOUT US 121
Infrastructure Victoria Second Container Port Advice – Evidence Base3

List of figuresFigure 1: Land-bridging cost comparisonFigure 2: Forecasts of total container trade, volumes (TEU): central, low and high casesFigure 3: Historic demand forecasts for Victorian container demandFigure 4: Extreme high and low scenarios for container trade demandFigure 5: Port Phillip Bay channelsFigure 6: Shipping channels through Port Phillip HeadsFigure 7: Vessel tracks for successful transits of Port Phillip Heads by 14,000 TEU MSC Daniela in ship simulatorFigure 8: Evolution of container shipsFigure 9: Global shipping routesFigure 10: Evolution of the world container fleetFigure 11: Forecast fleet spectrum for the constrained case Figure 12: Forecast fleet spectrum for the unconstrained case Figure 13: Import supply chains at the Port of Melbourne Figure 14: Export supply chains at the Port of Melbourne Figure 15: Landside port capacity overviewFigure 16: Port of Melbourne todayFigure 17: Swanson Dock layout and possible capacity enhancement measuresFigure 18: Possible capacity enhancements for berth, yard and landside at Swanson DockFigure 19: Theoretical sequence of possible capacity upgrades at Swanson DockFigure 20: Webb Dock layout and possible capacity enhancement measuresFigure 21: Possible capacity enhancements for berth, yard and landside at Webb DockFigure 22: Theoretical sequence of possible capacity upgrades at Webb DockFigure 23: Port of Melbourne surrounding land useFigure 24: Existing Port of Hastings and surrounding land useFigure 25: ‘Along shore’ and ‘Dig out’ concepts for HastingsFigure 26: Hastings concept terminal and port environsFigure 27: Existing channels at the Port of HastingsFigure 28: Hastings concept, elements included in costingFigure 29: Hastings development footprint overlayed on selected habitat map and Ramsar siteFigure 30: Bay West study area and surrounding land use Figure 31: Initial location concepts for Bay WestFigure 32: Bay West concept terminal and port environs Figure 33: Bay West concept, elements included in costing Figure 34: Bay West development footprint overlayed on selected habitat map and Ramsar site Figure 35: Methodology overview
List of tablesTable1. Victorian commercial ports todayTable 2. Port Phillip Bay Channels and constraints for various ship sizesTable 3. Results of navigation simulations Table 4. Container ships on order, January 2017
Infrastructure Victoria Second Container Port Advice – Evidence Base4

Table 5. Forecast maximum ship size (TEU) by yearTable 6. Number of buildings, area and size categories of buildings within State Significant Industrial Precincts, Metropolitan Melbourne, 2015-16Table 7. Current vacant industrial land and proposed industrial land, State Significant Industrial Precincts, 2015-16Table 8. Melbourne current and forecast future population distribution (number of people)Table 9. Design vessel characteristics for Hastings and Bay WestTable 10. Cost estimate for Hastings concept 14,000 TEU design vessel ($ millions)Table 11. Cost estimate for Hastings concept 18,500 TEU design vessel ($ millions)Table 12. Design vessel characteristics for Bay West and HastingsTable 13. Cost estimate for Bay West concept 14,000 TEU design vessel ($ millions)Table 14. Cost estimate for Bay West concept 18,500 TEU design vessel ($ millions)
GLOSSARY AND ABBREVIATIONSAir draught: The height of a ship, measured from the waterline to the tallest part of the ship. It determines if a vessel can pass under obstructions such as bridges and power lines. Air draught is not constant but depends on how the vessel is loaded.Beam: The maximum width of a ship’s hull.Berth pocketsA dedicated location alongside a wharf, in which ship can moor.Break bulk: Cargo that is carried in unitised, palletised, bundled or barrelled form or other non-unitised cargo such as vehicles.Bridging/land- bridging: A supply chain where goods are brought into one port and then transported by either train or truck to a wide spread of other locations. For example, land-bridging in Australia could involve bringing almost all imports in through the Port of Brisbane, and transporting goods along the east coast by train or truck.Commonwealth waters: The ocean between 3 and 200 nautical miles offshore is classified as Commonwealth waters. Commonwealth, rather than state or territory laws, apply to this area.Complementary infrastructure: The road and rail infrastructure necessary for the operation of a port. It does not include the immediate transport connections from the port to the existing network. It does include network upgrades or new links required within the existing network.Containerised trade: Transportation of cargo in containers, usually 20 or 40 foot long. Containers can also be refrigerated.Controlled action: An action defined in the Environment Protection and Biodiversity Conservation Act 1999, which includes a project, a development, an undertaking, an activity or a series of activities, or an alteration of any of these things.Development footprint: The area of land a proposed development will cover.Disruptive technology: An innovation or new technology which disrupts the way an existing market operates.Draught: The depth of a ship, measured as the vertical distance between the waterline and the bottom of the hull (including the keel). The ‘maximum’ or ‘scantling draught’ is the maximum safe draught the vessel is designed for. ‘Sailing draught’ is the actual draught of
Infrastructure Victoria Second Container Port Advice – Evidence Base5

the vessel at any time. Sailing draught is not constant but depends on how the vessel is loaded.Dredge material: Clay, silt, sand or rock dredged from the seafloor.Dredge material ground (DMG): Unconfined sea disposal: Designated underwater area where dredge material can be placed for disposal. If dredge material is contaminated then a layer of uncontaminated material may be placed on top to cap the DMG – this is termed ‘confined’ sea disposal. Where no capping layer is used it is termed ‘unconfined sea disposal’.Dry bulk: Cargo that is transported in large, unpackaged quantities and loaded directly into the hold of a ship such as mineral sands, wood chips, grain and alumina.DWT: Dead Weight Tonnage measures how much weight a ship can safely carry, not including the weight of the ship.Feeder vessel: A smaller container ship, usually less than 4,000 TEU, that is used to service small ports in regional groups. Feeder vessels collect shipping containers from different ports and transport them to central container terminals where they are loaded to bigger vessels or further transport by truck or rail into the hub port’s hinterland.Handling characteristics: How well a ship steers. This is influenced by the design of the ship and the depth of water under the ship.Harbour master: An official responsible for enforcing the regulations of a port, to ensure safe navigation, the security of the arbor and the correct operation of the port facilities. A Harbour master will usually issue directions as to the size of vessel than can safely visit a port, and the speed at which vessels may travel.HPFV: High productivity freight vehicle: Any truck larger than a B-Double. B-Doubles are articulated vehicles capable of carrying three 20 foot containers. HPFV can carry four 20 foot containers.Hyperloop: A proposed transport mode for passengers and freight. Still in testing and development, Hyperloop proposes to propel pods through a tube at very high speeds.Indented basin dock: A three-sided, u-shaped dock, where ships can moor on either side of the dock.Intertidal zone: The area along the coast that is above the water at low tide and beneath the water at high tide.Landside capacity: The ability of land-based transport networks to handle the volume of containers entering and exiting a port.Liquid bulk: Cargo that is transported in liquid form such as oils, petroleum and chemicals.LOA: Length Over All: The length of a ship’s hull measured parallel to the waterline.Origin/destination port: A port where almost all containers handled are export or import containers which leave through the port gate.Quay line: Edge of wharf separating the land of the container terminal from the berth area where ships tie up.Rail marshalling yard: A rail yard used to separate and join trains, or move them onto to different tracks, to make the entry and exit of trains from the port more efficient.Ramsar: An international treaty providing a framework for the protection of ecologically important wetlands, focusing on wetlands used by migratory birds. In Australia, Ramsar wetlands are managed under the Commonwealth Environment Protection and Biodiversity Conservation (EPBC) Act 1999.Reclamation: Constructing new land within a waterway, using either dredged material or material sourced from land.
Infrastructure Victoria Second Container Port Advice – Evidence Base6

Roll on/Roll off: A cargo ship where vehicles and cargo are able to be driven directly on or off the ship via a ramp.Sea pilot: An experienced mariner certified to navigate ships into and within a port. A sea pilot possesses extensive local knowledge of the channels, depths of water, currents and dangers within and around the port for which they are licenced.Sensitivity analysis; Used to test a central hypothesis by applying low and high ranges, to understand a range of possible outcomes.Shipping containers: Standardised steel boxes designed to be carried on, and easily transferred between ships, trucks, and trains. Standardised shipping containers originated in the 1950s, and are now used for shipping almost all non-bulk cargo, such as manufactured goods, clothing, food or anything that can be packaged and moved on pallets.Slow steam: Operating international cargo ships at significantly less than their maximum speed. Shipping lines may slow steam to save fuel costs, or to time their arrival in ports to match with berth availability or avoid traffic.Staging: The process of storing goods in between movements in a supply chain. For instance, goods may leave a port during the night and be taken to a staging area, before being delivered to a store or factory during business hours.Stevedore: Individual dock worker or firm that employs dock workers to load and unload vessels.Supply chain: How goods move from their origin (this could be farm, factory or mine) to the consumer. Supply chains comprise a combination of nodes, such as airports, ports, or intermodal freight terminals, from which goods are transferred to and from warehouses, distribution centres and shops. Goods are carried between the locations by some combination of ships, trucks, planes or light delivery vehicles.SUZ1: Special Use Zone 1: A zone within the Victorian Planning Provision that reserves land for a specific use, as defined in the relevant local planning scheme.TEU: Twenty foot Equivalent Unit: Shipping containers come in two sizes, 20 foot and 40 foot long. Both lengths are generally 8 feet 6 inches high and 8 feet wide. Ship or port capacity to handle containers is measured in 20 foot equivalent units (TEU). For instance one 40 foot container is counted as 2 TEU.Tidal assist: The process of ships using high tide to access a waterway that would be too shallow or unsafe at other tidal conditions.Tidal cycle – ebb, flood, slack water: Waterways connected to the ocean experience tides, regular changes in water level and currents driven by the gravitational attraction of the sun and the moon. The coast of Victoria has a tidal cycle with two high tides and two low tides every day. ‘Flood’ tide is the part of the cycle when the water level is rising and it may be associated with strong tidal currents. ‘Ebb’ tide is the part of the cycle where the water level is falling and it may also be associated with strong tidal currents. ‘Slack water’ is a short period between the flood and ebb when tidal currents are low.Transhipment port: A port where containers are unloaded from one ship and loaded onto another ship without leaving the port.Transit only zone: A regulated area of water in the vicinity of a commercial shipping channel. Recreational craft may travel through but must not anchor or drift within the transit only zone.Tugs/tug boats: A special ship used to manoeuvre vessels either by pulling or pushing them. Tugs are used to help ships navigate into berths.Turbidity: The degree to which water becomes less transparent because of the presence of suspended particles in the water.
Infrastructure Victoria Second Container Port Advice – Evidence Base7

Turning basin/swing basin: An area at the end of a channel close to a dock which is deep and wide enough to allow ships to be turned around with the assistance of tugs before they are maneuvered into a berth.Under keel clearance: The space between the bottom of a ship’s hull and the ocean floor.Wharf structure: The structure against which a ship berths.
WHAT THIS PAPER IS ABOUTThis paper discusses the complexity of planning port capacity and the operation of Victorian commercial ports. It presents evidence we will use to prepare our advice to the Minister.We consider key factors that are relevant to both when and where to invest in container capacity:
container demand projections navigating the Port Phillip Heads future ship size.
In examining when to build a second port we consider: potential capacity of the Port of Melbourne the capacity and availability of road and rail networks outside the port gate the environmental and social impacts of expanding the Port of Melbourne.
In examining where to build a second port for both Bay West and Hastings we consider: a design vessel concept design for each port road and rail transport links environmental and social impacts staging and cost.
We are sharing this information so that stakeholders and anyone interested can understand the evidence we are using to prepare our advice. We want to hear about:
any information you have that is different or contrary to the evidence we have put forward
any evidence you have that expands the information we can draw on.
WHAT THIS PAPER IS NOT ABOUTThis paper is not our advice to the Minister. Based on the evidence released with this paper, and what we hear from you, we will prepare our advice to the Minister by May 2017.
The evidence in this paper, including the estimated engineering costs, are key inputs to a number of analyses currently being prepared. These analyses will form our advice to the Minister and include:
comprehensive least cost economic analysis, including the costs and benefits of externalities and amenity impacts
further transport modelling as an input to the economic modelling and to determine the congestion around the potential port sites and the general road network
separate supply chain cost analysis regional, state and economy wide analysis of productivity impacts analysis of the interaction of our advice with the roles and responsibilities of the
Government, industry and the newly appointed Port of Melbourne lessee.
Infrastructure Victoria Second Container Port Advice – Evidence Base8

Our advice to the Minister is strategic and intended to guide decision making on the choice of when to invest in a second container port, and where. To inform our advice, costs and benefits are considered from a state wide and national perspective. Our advice will discuss who may pay for and be best placed to deliver the infrastructure, but a final decision on funding and delivery would occur closer to the time a second port is needed.
This paper does not provide a detailed description of all the evidence we will use to prepare our advice. This detail is provided in the accompanying technical reports which are available in our document library at infrastructurevictoria. com.au. In this paper we have tried to focus on what we think are the differentiators to making a decision on when and where a second port should be developed. We have also provided a summary of technical information such as possible Port of Melbourne capacity enhancements, and possible concept designs for Bay West and Hastings ports.
The Minister’s Terms of Reference also asks us to examine scenarios for non-containerised trade. This paper is focused on container capacity. We do, however, discuss the ability of the Ports of Portland, Geelong and Hastings to handle greater volumes of their current trades, or to handle trades relocated from Melbourne.
This paper and the technical reports identify technically possible actions to increase capacity at the Port of Melbourne, navigate Port Phillip Heads or develop a second port. This paper does not contain Infrastructure Victoria’s recommendations about whether technically possible actions should actually be taken. Our final advice to the Minister will include Infrastructure Victoria’s recommendations.
Our Terms of ReferenceThe Special Minister of State has requested that Infrastructure Victoria provide advice on the preferred sequencing, timing and location of investment in future Victorian container port capacity. We must answer two questions:
If and when a second container port will need to be built, and what that means for the distribution of trades across Victorian commercial ports.
Where a second container port should be located, examining sites at Bay West and Hastings.
We must provide our advice to the Minister in May 2017.
The section below describes the scope of our advice. You can find the Minister’s full on our website: infrastructurevictoria.com.au/second-container-port
Scope of adviceThe Government wishes to ensure that decisions regarding Victoria’s long term port capacity and associated infrastructure are developed in accordance with robust, independent advice, particularly in relation to the sequencing, timing and location of investments. Infrastructure Victoria’s advice on options for Victoria’s future commercial port capacity should address the following issues:
1. Scenarios for the long term demand for, and capacity of, existing Victorian commercial ports, including:
Infrastructure Victoria Second Container Port Advice – Evidence Base9

a) when the need for a second major container port is likely to arise and what variables may alter this timeline
b) capacity for containers, bulk and other non-containerised cargo;c) the capability of Victorian channels and existing port infrastructure to handle
different scenarios of future changes to the international shipping fleet, cargo handling technologies and changes to the supply chain onshore; and
d) potential increases in capacity resulting from investment and improved port management under the Port of Melbourne lease arrangement.
2. Where a second major container port would ideally be located and under what conditions, including the suitability of, and/or barriers to investing in, sites at the Port of Hastings, and the Bay West location, including:
a) the indicative costs, risks and benefits of above options, including impacts on metropolitan, regional and interstate (including Tasmanian) supply chains;
b) any necessary measures to preserve the long term optionality at these sites including any appropriate relevant planning measure, environmental protections, or land and transport corridor reservations which may be required
c) impacts and requirements that a second major container port would take place on surrounding and supporting infrastructure, and the impacts – including the costs to Victorian taxpayers – of any complementary infrastructure investments that may need to be considered; and
d) the environmental, economic and social impacts of developing a second container port, as well as the environmental, economic and social impacts of the required complementary infrastructure, on existing local communities.
A consultative approachWe are engaging with stakeholders in the development of our future advice to the Minister. Ports have significant economic, social and environmental outcomes that impact all Victorians. We think everyone should have an opportunity to consider, understand and comment on the evidence that will underpin our final advice. Our Terms of Reference recognise the importance of consulting and building understanding on the timing and location of a second container port.
What you have told us so far
Who we’ve heard fromTo ensure we heard from key stakeholders, we held a number of meetings and group sessions with:
stevedores at the Port of Melbourne freight and logistics peak bodies and companies environmental groups community groups community members relevant local governments and government agencies other Australian ports the operators of all Victorian commercial ports
Infrastructure Victoria Second Container Port Advice – Evidence Base10

Victorian maritime regulatory bodies peak bodies in the shipping and maritime industries business groups.
We also considered all submissions we received in response to our September 2016 discussion paper, Preparing advice on Victoria’s future ports capacity.
Key themesThe main themes that emerged during consultation were:
The impact of future ship sizes – feedback differed on the size of ships likely to visit Melbourne in the future, but was consistent in suggesting there needs to be a robust view on future ship sizes to inform our study.
Future demand for container capacity – while feedback differed on the likely future demand for container capacity, many noted the importance of demand projections in shaping our advice.
Environmental impacts – feedback highlighted that developing a new port at either Hastings or Bay West will have significant environmental impacts. Groups were most concerned with the environmental impacts of a port development closest to their location.
Freight movement and supply chains – feedback focused on:o the need for rail connections to support efficient future supply chains, both for
an expanded Port of Melbourne and a port at either Hastings or Bay Westo the impact on supply chains if traffic flows around the Port of Melbourne
become more congested because of increased freight volumes or a densification of urban development
o the impact of different port locations on supply chains. Feedback focused on the impact of changed supply chains based on their current warehousing locations.
Economic activity – feedback from local government and industry peak bodies focused on the importance of an efficient port and supply chains for a healthy economy. Local government submissions generally advocated for the new port to be closest to their location because of the increased employment and economic activity from a new port and ancillary business activity.
Our consultation summary paper discusses what we heard in greater detail. You can also look at the RPS Group workshop summary report for a summary of our consultation sessions.
Infrastructure Victoria Second Container Port Advice – Evidence Base11

Choosing a new port
It is complex to choose when and where to invest in new port capacity.
Timing complexity – increasing capacity at an existing port becomes progressively more complex.
Before deciding to invest in a new container port, there are usually a number of actions the port operator or manager, or stevedores can take to increase capacity at an existing port. These capacity enhancements often start simply and are relatively cheap, and become more complex, costly and time consuming as a port approaches its ultimate capacity.
At some point, it is likely to make more sense to invest in a second port, compared to incrementally improving capacity at an existing port. This decision must be made well in advance of needing the extra capacity, because there is a long lag between deciding to build a new port and the port opening.
Using national and international benchmarks, it is reasonable to assume that once a decision on a new port location is made, it will take between 10 and 15 years to plan, design, gain approval for, and construct the port. This long lead time means the government must make the decision to begin planning and constructing a new port in a climate of considerable uncertainty.
For instance, before the Global Financial Crisis in 2008, Victoria had experienced ten years of very strong growth in container demand, an average of about 7 per cent per year. After 2008, the rate of container demand growth was much less, and has remained low at an average of about 1-2 per cent. The decision a government would make about investing in new port capacity in early 2007 would be very different from the decision it might make in 2017.
There is also the potential for disruptive change in the maritime or land transport industries. In the 1950s the Port of Melbourne was planning a huge land expansion, to provide the amount of space needed for the growing trade. At the time, all cargo was loaded and unloaded using cargo nets and cargo was packed into different sized boxes and barrels, requiring significant space and labour. Ten years later containers started being used to transport goods, and the space and labour required to load and unload a ship drastically reduced.
There is also potential for a disruptive landside transport technology to fundamentally change the economics of long distance freight transport in Australia. If technology like high speed rail or ‘hyper loop’ was proven to be technically and commercially feasible in Australia, it could significantly affect the structure of the freight industry.
Infrastructure Victoria Second Container Port Advice – Evidence Base12

We have tried to consider the uncertainty inherent in long- term planning in calculating our demand forecasts. It is hard to foresee the timing and specific nature of disruptive change, so when planning port capacity far in advance, government needs to regularly review some key indicators to track the likely point at which it is best to invest in new port capacity.
Asset complexity – ports are complex to approve and build because they combine different infrastructure, including roads, rail, buildings, bridges, quays, cranes and shipping channels.
Ports are also built in a sensitive environmental interface (land, intertidal and marine). The combination of these factors increases the complexity of planning and building a port. The complexity of planning, approving and building a port in a new location could be compared with combining the approval and construction complexity, for example, of the Victorian Desalination Plant, Peninsula Link, Regional Rail Link and channel deepening. Each of these types of development has their own specific characteristics and challenges, which would need to be considered alongside each other when planning and constructing a second container port at either Hastings or Bay West.
Location complexity – port location influences the import supply chains, and the ability of Victorian products to reach export markets.The location will shape Victoria’s economic competitiveness, and the location of jobs, transport links and housing in Melbourne.
Because so much of what people consume comes in through a port, a large amount of warehousing is needed to store and process imports before they end up in our shops, or are transported to factories as an input into manufacturing or some other value-add process. Warehousing companies look for cheap land, close to good transport connections and an international gateway, like a port. This means that the location of a port is likely to change the distribution of warehousing across metropolitan Melbourne.
The port location and transport connections will also affect how easily Victoria’s export products can get to market.
The importance of an efficient international portPorts are critical international gateways which help transport our exports to international markets, and allow us to access goods and manufacturing inputs from around the world. Efficient supply chains support economic development, help Victoria maintain its competitiveness and increase its productivity.
Most consumer goods pass through the Port of Melbourne. 87 per cent of import containers passing through the Port are destined for the metropolitan Melbourne area. Some of these containers hold finished consumer goods that are sold in department stores or home improvement stores. Other containers hold manufacturing inputs, which Victorian businesses turn into value-added products. Some containers are broken down, repacked and sent to Perth, Adelaide or regional Victoria. For exports and imports, an efficient port is critical to
Infrastructure Victoria Second Container Port Advice – Evidence Base13

Victoria’s economy and supply chains for Victoria, South Australia, southern New South Wales and Tasmania.
To maximise the benefit Victoria gets from this key piece of infrastructure we need to ensure it has:
efficient transport links, so exporters and importers can easily access the port an ability to respond to demand enough excess capacity to encourage competition between stevedores access to a large nearby market effective price regulation to contain port user fees and charges.
An efficient port has benefits beyond the port city and serves as an important trade facilitator for exports and imports.
For containerised and non-containerised exporters, such as agricultural and natural resource producers and manufacturers, an efficient port provides reliable and cost-effective access to international markets.
For containerised and non-containerised importers, such as retail business and manufacturers who need imported inputs, an efficient port keeps the cost of inputs low and reduces supply chain costs for finished goods, which benefits Victorian consumers and businesses.
While an efficient port benefits all Victoria, operating such a large and busy piece of infrastructure can have negative impacts which tend to be felt more locally. These impacts can include increased transport network congestion, habitat loss, reduced air quality, noise and other amenity impacts.
While focusing on making sure Victoria always provides competitive port capacity, the locally felt negative impacts need to be addressed. This means understanding the likely traffic impacts of either an expanded Port of Melbourne or a second port at Bay West or Hastings, and the social, amenity and environmental impacts.
We assume Victoria will always seek to provide an efficient port for exporters and importers, with enough capacity to promote competition between stevedores to help keep supply chain costs low.
Why land-bridging is not viableLand transport costs are much higher than port or shipping costs, which makes it uneconomical to move containers by truck or train from one city to another for import or export.
Typically, shipping companies charge a ‘pan-Australian rate’ – they charge the same amount for taking a shipping container to any of the Australian east coast ports. This means there is limited competition between ports. Each major city has one container port with a natural catchment.
Infrastructure Victoria Second Container Port Advice – Evidence Base14

Port fees and access costs do vary between cities, so there is minor competition where natural catchments overlap, for instance Riverina trade can go to Sydney or Melbourne. Land-bridging is bringing cargo through one port and transporting it to other Australian capitals by train or truck. This is sometimes discussed as an alternative to investing in new port capacity. Land-bridging is considered to be an inefficient solution for the Australian logistics industry for the following reasons:
A significant majority of Australia’s population live in capital cities and capital cities are located a long distance from each other.
On a per kilometre basis, the cost of shipping is a fraction of road transport costs. Eastern capital cities have located ports near to their city centre, aiming to minimise
road transport distances for all import destinations and export origins. Each time a container is handled it adds additional costs.
Historically it has been more cost efficient to ship directly to eastern capital city ports and minimise road transport costs.
As the diagram below shows, based on current charges and operations, it is at least 25 per cent cheaper to ship directly to Port of Melbourne than land-bridging from Sydney, the closest port. These numbers are an approximation only. This assessment is based on current freight pricing and does not try to anticipate how costs would change if the national shipping industry was restructured and/or there was significant investment in road and rail infrastructure, for example the Brisbane to Melbourne Inland Rail project.
It is also less reliable to load a 5,000 to 6,000 TEU shipment onto rail, which would overload rail lines and result in containers arriving later than if they’d been shipped by sea.
Figure 1 demonstrates the different cost associated with land-bridging compared to shipping.
Infrastructure Victoria Second Container Port Advice – Evidence Base15

Figure 1. Land-bridging cost comparison
Source: Deloitte, Infrastructure Victoria Second Container Port Advice TEU cost assessment, 2017
Port capacity factors
Why is this important?Port capacity is influenced by a range of factors. It is important to understand these factors when thinking about ways to increase port capacity, particularly in the context of potential expansion of the Port of Melbourne.
Effective vs nameplate capacityPort capacity is often discussed in terms of nameplate capacity and effective capacity.
Nameplate capacity is the full theoretical number of containers a port can handle, working at peak operation for 365 days a year. The nameplate capacity doesn’t account for the time berths may be at a lower productivity because of maintenance, or for seasonal variability in demand.
Effective capacity is less than the nameplate capacity, and refers to the actual capacity a port operates at, accounting for a range of buffers that reduce capacity below the nameplate capacity.
Infrastructure Victoria Second Container Port Advice – Evidence Base16

Maintaining an effective capacity lower than the nameplate capacity helps to ensure buffers for:
Seasonality and market volatility: trade demand through the port fluctuates during the year; exports peak after harvest and imports peak ahead of busy consumption periods, like Christmas. The Port of Melbourne’s peak volume has been up to 15 per cent higher than the annual monthly average.
Competition between stevedores: competition drives productivity improvements through incentivising investment in more efficient operations and new capacity. To have competition between stevedores, there needs to be some excess capacity so that shipping lines and importers and exporters can change between stevedores, limiting the ability of stevedores and port operators to raise port fees.
Maintenance and industrial downtime: ideally terminals would work seven days a week, 24 hours a day for 365 days a year. In reality, the machinery needs downtime for maintenance, there can be unplanned breakdowns, or industrial action.
Port capacity factorsPort capacity is determined by the interaction of different factors which can be grouped as:
Maritime approaches: the capacity of the channels, any constraining features, such as the Port Phillip Heads, limiting the size or number of ships that can access the port.
Container terminal: there are three distinct areas that can limit the container terminal:
Infrastructure Victoria Second Container Port Advice – Evidence Base17
Port Melbourne Hastings Geelong PortlandOwner Leased State Private PrivateBerths 34 3 16 6Land 510 hectares Long Island
Point: 6.2 hectaresCrib Point: 4.8 hectaresStony Point: 1.9 hectares
226 hectares 65 hectares
Channel depth 15.5 metres to Williamstown14.6 metres in Yarra Channel
14.2 metres 12.3 metres 12.1 metres
Maximum vessel draught with tidal assist
14.7 metres tankers14 metres containerships
15 metres 12 metres 12.85 metres
Trades Containers, dry bulk, break bulk, liquid bulk
Liquid bulk, break bulk
Liquid bulk, break bulk, dry bulk
Dry bulk, break bulk

– Berth/quay: the length of berths and quay line available for ships to moor at the terminal, and the number of ship to shore cranes to load and unload containers.
– Yard: the yard space available for container stacks and stacking system. Containers typically spend several days in the yard before leaving the port.
– Gate: the number and speed of truck (or train) loading bays limit the speed at which containers can be moved into or out of the terminal on the landside.
Landside transport networks: the capacity of road and rail transport networks beyond the port gate to move containers to and from the port.
Victorian commercial ports todayVictoria has four commercial ports at Melbourne, Hastings, Geelong and Portland. The Port of Melbourne is Victoria’s only container port; the other ports handle a mix of dry bulk, break bulk and liquid bulk. Table 1 describes the characteristics and current trades of each port.
Table 1. Victorian commercial ports todaySource: Adapted by Infrastructure Victoria based on discussion with Harbour Masters and information in the Deloitte/Aurecon, Victorian infrastructure capability assessments: transport, 2016
Our Terms of Reference ask us to examine locating a second container port at Bay West or Hastings. While there is potential to expand activities at some Victorian ports, the Port of Geelong and the Port of Portland face natural constraints that make them unsuitable for a container port.
The Port of Geelong has a long channel with a significant amount of rock, which means any further dredging of the channel so it could accept larger ships will be very costly. There is limited land available for the major expansion required for a large container port. The Port of Geelong has the potential to accept relocated trades from the Port of Melbourne and increase volumes in current trades but is not suitable as the location of a second container port.
The Port of Portland has a declared channel depth of 12.1 metres, is constrained by surrounding residential land uses, its current port land is fully occupied and is over 350 kilometres away from Melbourne. Its proximity to agricultural and resources exports in northwestern Victoria may present potential for the port to increase its role as a bulk and break bulk port, but it is not suitable as the location of a second container port.
We discuss the need to redistribute non-containerised trades either within the Port of Melbourne or other Victorian ports on pages 44 and 54.
Infrastructure Victoria Second Container Port Advice – Evidence Base18

Evidence for future demand, channel capacity and ship sizesThe Special Minister of State requested that Infrastructure Victoria provide advice on the long-term demand for port capacity, including the capability of Victorian channels and existing port infrastructure to handle future changes, and where to locate new port capacity.
To help us understand the potential impact of future changes on Victorian ports, we have gathered evidence on the following key factors:
Container demand forecasts: the level of future demand drives the decision to invest in additional container capacity, whether it is increasing the capacity of the Port of Melbourne, or deciding to build a second container port at either Bay West or Hastings. We have also considered non- containerised demand forecasts.
The capacity of the Port Phillip Heads: what size of ship, and how many ships, can access Port Phillip Bay through the Port Phillip Heads is critical to providing advice on when and where Victoria should invest in new container capacity.
Future ship sizes: how ship sizes are changing and what that means for the vessels that want to visit Victoria and Australia influences what ship size Victorian container ports need to accommodate in the future.
We are presenting the evidence we have gathered on these key factors together, because all three are relevant for:
preparing our advice on when we need a second port, because it helps us understand the possible capacity of the Port of Melbourne
preparing our advice on where to locate a second port, because it helps us understand the capacity of Bay West to accept large ships, and how much this matters relative to Hastings.
Demand forecasts
Why is this important?To recommend when Victoria should invest in additional port capacity we need to estimate future demand – for both import and export containers. Once we forecast future demand, we can assess the Port of Melbourne’s ability to handle future demand, and whether we should invest in additional capacity at the Port of Melbourne or at a second container port.
DemandWhen we talk about ‘demand’, we mean how many TEU the port must handle to satisfy the needs of all the port customers. Port capacity needs to stay ahead of demand to avoid restricting trade. Demand is measured by the number of TEU per year that are imported and exported through a port. While demand is measured in the number of TEU, we are really trying to predict how many goods, manufacturing inputs and agricultural products our households, businesses and farms will need to import and export in the future.
Infrastructure Victoria Second Container Port Advice – Evidence Base19

Predicting economy-wide demand for imports and global demand for Victorian exports is complicated and relies on a range of factors which will change, often in ways we can’t predict.
Technology changes in production and transportation can have unforseen impacts on how the freight industry works, and how we produce and consume goods. For instance, consumer products have changed dramatically in the past decades. Many have become smaller, or been combined into one device. Smartphones now perform tasks that used to be performed by multiple devices such as alarm clocks, watches, music players, calendars and cameras.
Demand forecasting is not exact but it is a valuable and credible tool in capacity planning and is used all over the world. We recognise that forecasts will almost always be inaccurate. They rely on what has gone before to predict the future, with little (or no) capability to identify shifts in trends. Nevertheless, long-term planning, such as advising on when a second container port will be needed, requires a judgement on the future numbers of containers to be moved based on the best available information.
More information on how we developed our demand forecasts can be found in Infrastructure Victoria Second Container Port Advice container trade forecasts for Victoria.
Our demand forecastsDemand for container port capacity is driven by demand for imports and, to a lesser extent in Victoria, the increasing containerisation of exports.
Historically, economic and population growth has driven growth in container trade volumes. Changes in the exchange rate also affect demand for imports and exports – when the Australian dollar has been more valuable, it made imports relatively cheap, which tended to increase import demand. When the dollar has become less valuable, it drove more demand for Victorian exports, because they became relatively cheap in the global marketplace.
Population and economic growth is forecast to continue, which will also result in continued growth in container volumes. The Victorian Government’s population forecast, Victoria in Future 2016, predicts a population increase to over 7.7 million in 2031, compared with over 6 million today. The 2016-17 Victorian State Budget also forecasts growth in Gross State Product to continue at between 2.75–3 per cent between now and 2019–20 (the Victorian budget only forecasts Gross State Product growth outto 2019–20).
We have developed forecasts for central, high and low demand growth cases. The central case will be used as the demand forecast input to other parts of our advice. The high and low forecasts will be used to test different scenarios, often referred to as a ‘sensitivity analysis’. We have developed these forecasts in line with common practice, and the detailed methodology for how we developed the forecasts can be found in Infrastructure Victoria Second Container Port Advice container trade forecasts for Victoria.
Infrastructure Victoria Second Container Port Advice – Evidence Base20

We have also reviewed demand forecasts for non- containerised trades, which predict that these trades will continue growth in the vicinity of 0.5 to 2 per cent out to 2065. More information on our review of non- containerised demand forecasts can be found in Infrastructure Victoria Second container Port Advice container trade forecasts for Victoria.
The results of forecasting the central, high and low casesFigure 2 shows that in the 2031 financial year, total containerised demand will reach 4.3 million TEU under the central case, 4.2 million TEU under the low case and 5.5 million TEU under the high case. Thereafter demand grows notably less under the low case compared to the central and high case. By the 2046 financial year, container demand is expected to reach 6.5 million TEU under the central case, 5.6 million under the low case and 8 million TEU under the high case.
Figure 2. Forecasts of total container trades volumes (TEU): central, low and high cases
Source: Deloitte, Infrastructure Victoria Second Container Port Advice container trade forecasts for Victoria, 2017
How we used the demand forecastsThe demand forecasts are a key input for many of our other work streams and were used to:
Plan and cost Port of Melbourne capacity expansion stages. The engineering and technical advisors used the demand forecasts to help understand when additional capacity may be required, and how that demand could possibly be met by phasing capacity expansions at the Port of Melbourne. To ensure competitive tension within the port, and access for imports and exports, it is a requirement that the Port of Melbourne capacity should always exceed demand.
Infrastructure Victoria Second Container Port Advice – Evidence Base21

Model the number of calls and the fleet spectrum of container ships calling on the Port of Melbourne. The demand forecasts were used to inform how often ships would need to visit the Port of Melbourne, and how different levels of demand might affect the ship size shipping companies want to bring to Melbourne.
Model the traffic through the Port Phillip Heads. Related to the number of calls and the fleet spectrum analysis, the demand forecasts were used to generate numbers of ships needing access to the Port Phillip Heads. These numbers were modelled alongside the other ships that need access through the heads, such as cruise ships heading to Princes Pier, and oil tankers and grain ships heading to the Port of Melbourne and the Port of Geelong, and Trans-Tasman container and cargo ships, to understand whether there would be issues with traffic at the Heads.
Historic forecasts for Victorian container demand and extreme high and low scenariosAll ports complete regular demand forecasting as part of regular port development plans. Over the last 10 years several demand forecasts have been published for Melbourne by the Port of Hastings Development Authority, the Department of Treasury and Finance, and the Bureau of Infrastructure, Transport and Regional Economics. As shown in figure 3, different forecasts have given quite different results. Figure 3 also includes the forecast for our central demand scenario.
Figure 3. Historic demand forecasts for Victorian container demand
Source: Deloitte, Infrastructure Victoria Second Container Port Advice container trade forecasts for Victoria, 2017
Before the Global Financial Crisis in 2008, Victoria had experienced ten years of very strong growth in container demand, an average of about 7 per cent. After 2008, the rate of growth of container demand was much less, and has remained at a lower rate of an average of
Infrastructure Victoria Second Container Port Advice – Evidence Base22

about 1–2 per cent. For a government, the decision it would have made regarding investment in new port capacity in early 2007 would be very different from the decision it may have made in early 2009.
A government’s view of future demand will vary depending on whether it is forecasting demand in a high or low growth environment. Figure 4 shows how demand forecasts would have looked had the trade continued on the basis of the high growth up to 2007, as well as the low growth post- 2008, and our central, high and low forecasts.
Figure 4. Extreme high and low scenarios for container trade demand
Source: Prepared by Deloitte for Infrastructure Victoria, 2017
QUESTIONS Do you have feedback on our demand forecast? Do you have evidence to challenge our findings?
Which technical reports should I look at for more information?Deloitte, Infrastructure Victoria Second Container Port Advice container trade forecasts for Victoria, 2017
Channel capacity, including Port Phillip Heads
Why is this important?What size of ship, and how many ships, can access Port Phillip Bay through the Port Phillip Heads is critical to providing advice on when and where Victoria should invest in new container capacity.
Infrastructure Victoria Second Container Port Advice – Evidence Base23

For the Port of Melbourne, if the channels are too congested, or if the size of ships that need to visit cannot pass through the Heads, then the potential capacity of the Port may never be realised.
The capacity at the Heads is also critical to the viability of a possible future port at Bay West. A new port at either Bay West or Hastings may need to service Victoria for 100 years or more. For any Port of Melbourne expansion and the Bay West option, we need to understand if the Port Phillip Heads has the capacity to accommodate the amount of ships wanting to visit the container port in this timeframe, without compromising cruise ship visits, the Port of Geelong’s operations or the Tasmanian trade.
Navigating into Port Phillip BayA system of channels within Port Phillip Bay allows large ships to enter the Bay and navigate to the ports of Geelong or Melbourne. These channels are shown in figure 5.
The difficulty of navigating these channels, particularly the entrance to Port Phillip called ‘the Heads’, has prompted the Melbourne Harbour Master to require all ships to engage a pilot – a mariner with specialist local knowledge and experience. The Harbour Master also restricts the size of vessels that can enter the Bay and under what conditions.
A large container ship approaching from Bass Strait must first pick up a pilot at the boarding ground outside the Heads, then navigate through the Heads using one of several channels. Almost all container ships use the Great Ship Channel, the deepest through the Heads.
Once inside the entrance, ships must turn right and follow the South Channel to cross the Great Sands, a large shallow area in the southern part of the Bay. At the end of the South Channel close to Rosebud, ships turn around the Hovell Pile and into the deeper area in the centre of the Bay.
From the Hovell Pile ships can head north to the Port Melbourne Channel, northwest to the start of the Geelong channel near Portarlington, or to the anchorage on the western side of the Bay.
The Port of Melbourne Channel starts at Fawkner Beacon and runs north to Station Pier. Cargo ships heading for the Port of Melbourne turn into the Williamstown Channel which leads to the mouth of the Yarra and Webb Dock. Around Williamstown the ship is joined by one or more tug boats which will assist it manoeuvring to its berth.
If calling at Webb Dock, the ship will be swung around in the Webb Swing Basin then dragged backwards by the tugs into its assigned berth in Webb Dock.
If the ship is bound for Swanson Dock it needs to continue up the narrow Yarra Channel and under the West Gate Bridge to the Swanson Dock Swing Basin, where it is swung around and then backed into its berth in Swanson Dock.
Infrastructure Victoria Second Container Port Advice – Evidence Base24

Figure 5. Port Phillip Bay channels
Source: Adapted by Infrastructure Victoria from Victorian Ports Corporation (Melbourne), Port Information Guide, 2016
The channels in Port Phillip Bay have different dimensions and constraints, as summarised in table 2. Some of these constraints can be relatively easily unlocked (for example by dredging to widen a channel) but others are much harder (for example raising the West Gate Bridge).
Table 2. Port Phillip Bay channels and constraints for various ship sizes
Container ship classArea Old Post
Panamax Old Post Panamax
Old Post Panamax
New Post Panamax
Ultra Large
Comment on
Infrastructure Victoria Second Container Port Advice – Evidence Base25

7,000 TEU
Plus 8,500 TEU
Plus 9,500 TEU
14,000 TEU
Container Ship 18,500 TEU
existing limitations
Great Ship Channel (Heads)
Y Y Y Y N Width of channel
South Channel
Y Y Y Y Y
Port Melbourne Channel
Y Y - - N Width of channel
Williamstown Channel
Y Y - - N Width of channel
Webb Dock Swing Basin
Y - - N N Size of swing basin
Webb Dock Y Y Y - - Width of northern section, southern section adequate
Yarra River Channel
Y N N N N Width of channel
West Gate Bridge
Y Y - N N Air draught
Swanson Dock Swing Basin
Y N N N N Size of swing basin
Swanson Dock
Y N N N N Width of basin
Source: GHD, Infrastructure Victoria Second Container Port Advice – Estimated Capacity of the Port of Melbourne, 2017
Key
Y: Vessel size can operate in channel or through constriction -: Borderline. Vessel size should beable to operate with minor
adjustments or some restrictions N: Vessel size cannot operate
The capacity and constraints of Webb Dock, the Yarra Channel and Swanson Dock are discussed in the ‘Capacity of the Port of Melbourne’ section.
Do the Port Phillip Heads limit ship size in Port Phillip Bay?‘The Heads’ or ‘the Rip’ is the entrance to Port Phillip Bay between Point Nepean and Point Lonsdale.
The Heads is a notoriously treacherous entrance. It experiences strong tidal currents and is exposed to ocean swell waves. There are two shallow areas, Rip Bank and Nepean Bank,
Infrastructure Victoria Second Container Port Advice – Evidence Base26

separated by a horseshoe- shaped canyon up to 90 metres deep which can cause complex and unpredictable eddies in the current.
There are five defined shipping channels through the heads positioned side-by-side. The central and deepest is the Great Ship Channel which has been dredged to give it a declared depth of 17 metres. The width of the Great Ship Channel at 254 metres is narrow for the size of ships using it, which means that only one large ship at a time may enter or leave the Bay. Figure 6 shows the current configuration of the Heads.
Large and deep draught vessels can have difficulty maintaining control in strong currents and shallow water through the Heads, in particular across Rip Bank. For safety, the Melbourne Harbour Master currently restricts large container vessels from transiting the Heads when tidal currents are greater than:
5 knots for inbound transits (5 per cent of the time) 5 knots (flood tide) or 4 knots (ebb tide) for outbound transits (18 per cent of the
time).
Vessel draughts are restricted to 14.0 metres. Deeper draught vessels, up to 14.5 metres, may be brought in during favourable conditions by special arrangement with the Harbour Master.
The Heads poses a potential constraint on the size of ships that can enter Port Phillip Bay to call at Melbourne, Geelong or Bay West. As part of this study we conducted a ship simulation exercise to determine the largest class of container ship that could safely transit the Heads.
Figure 6. Shipping channels through Port Phillip Heads
Source: The Port of Melbourne, Port hydrography poster accessed 2017
Infrastructure Victoria Second Container Port Advice – Evidence Base27

Ship simulation – Port Phillip HeadsTo better understand the size of ship that could safely access the Heads, our navigation study included a ship simulation at the Australian Maritime College Maritime Simulation Centre in Tasmania. The ship simulation was to determine two things:
What size vessel could safely transit the Heads, with its current configuration? What channel upgrades would be required to allow some of the largest vessels in the
world – 18,500 TEU capacity and 400 metres long – to safely transit the heads?
The ship simulator is analogous to a flight simulator.It consists of a full size mock-up of a ship’s bridge witha wrap-around video screen showing the view forward and to either side and includes all navigation instruments, steering and engine controls.
Our simulations were piloted by professional Port Phillip Sea Pilots, who specialise in guiding ships in and out of Port Phillip Bay. These pilots are familiar with the conditions in the Heads and how real ships behave. They are also familiar with the Australian Maritime College simulator and its limitations, for instance the simulator’s inability to introduce random currents or sudden failures of a ship’s gear. Both of these situations have occurred during transits of the Heads. The pilots are able to consider the simulator limitations when deciding if a simulated transit was a success.
We conducted a number of simulator runs to account for different ship sizes and different tidal conditions. In all, 28 transits of the Heads were simulated with three different ship sizes, including at different times in the tidal cycle: in-bound, out-bound, flood tide and ebb tide. Table 3 describes the result of these navigation simulations.8,500 Vessel could safely transit the Heads using existing channels in low current window around slack water.
Table 3. Results of navigation simulations
Vessel Length (m) Beam (m) Draught (m) TEU ResultItal CortesiaOld Post Panamax plus
334 42.8 13 8,500 Vessel could safely transit the Heads using existing channels in low current windowaround slack water.Current limit: 3 to 4 knots, depending on tide and direction
MSC DanielaNew Post Panamax
366 51.2 13.5 14,000 Vessel could safely transit the Heads using existing channels in low current window
Infrastructure Victoria Second Container Port Advice – Evidence Base28

around slack water.Current limit: 1.5 to 3 knots, depending on tide and direction
Superium MaerskUltra Large Container Ship
389 58.2 14 18,00 It did not seem feasible for a vessel of this size to safely transit the Heads with theexisting channel con guration.Vessel could safely transit the Heads in low current window around slack water with channel widened under water from 245 to 425 metres.Current limit: 3 knotsChannel would also require deepening for vessel to operate at full draught (16 metres).
Source: AECOM, Infrastructure Victoria Second Container Port Advice – Navigation Study, 2017
The navigation simulations show that vessels up to about 14,000 TEU can safely transit the Heads, if they time their transit for the low current period around slack water. As vessels get larger, the length of the window around slack water that the vessel can safely access the Heads becomes smaller. Slack water is the point in the tidal cycle where the level of water inside the bay and outside the bay are equal, resulting in very low tidal currents. Slack water occurs approximately every six hours. Figure 7 shows the vessel tracks of the 14,000 TEU ship in the simulator for multiple successful transits of the Heads.
A number of simulations were carried out to test the effects of deepening or widening the Great Ship Channel. These showed that enlarging the channel did allow larger ships to transit, but they were still restricted to the low current window around slack water. Given the nature of the Heads we think that even with channel upgrades, access for large ships will always be constrained to certain tidal windows around slack water.
On the basis of these simulations, a 14,000 TEU ship would be a reasonable future design vessel for Bay West, although it may be many years before these vessels come to Melbourne – see the discussion of ship size and future fleet forecast below. Although access
Infrastructure Victoria Second Container Port Advice – Evidence Base29

is restricted to certain tidal conditions, this is not unusual. Many ports have similar restrictions including Fremantle and Brisbane, where deep draught ships cannot access the port at low tide.
Although we have carried out ship simulations with a deepened and/or widened channel through the Heads, we are not recommending that any dredging in the Heads is required at this stage. If in the future the option to expand the channel through the Heads was considered then more detailed studies would be required to assess the environmental and social impact. These issues are discussed further in the ‘Bay West - Potential environmental and social impacts’ section.
Figure 7. Vessel tracks for successful transits of Port Phillip Heads by 14,000 TEU MSC Daniela in ship simulator
Source: AECOM, Infrastructure Victoria Second Container Port Advice – Navigation Study, 2017
Capacity – How many large ships can navigate through the Heads?Ship simulation established that ships with a capacity up to 14,000 TEU can access the Heads during a limited window around slack water.
To understand whether there was sufficient capacity during this window for all container ships, tankers, bulk carriers, car carriers, cruise ships and ferries that may need future access to Port Phillip Bay, we compared a 50-year forecast of all commercial shipping into the Bay with the theoretical number of available ‘slots’ for ships to transit the Heads and South Channel in suitable conditions.
Infrastructure Victoria Second Container Port Advice – Evidence Base30

We estimated the total number of ship calls to Port Phillip Bay in 2066 would be about 5,900 (there were 3,687 in 2016). This results in 11,800 transits of the Heads. Of these 3,600 would be large container ships or tankers which can only transit in the low current window around slack water.
To calculate the theoretical maximum number of available slots we assumed ships travel in one-way convoys with a 15 minute gap between ships, and that only 70 percent of each window is used to retain flexibility. This gives a total of about 29,400 slots, including 7,400 low-current slots. We also assumed the maximum container ship size is 14,000 TEU and the channels through the heads remain in their existing configuration (i.e. no deepening or widening takes place).
This high level analysis demonstrates that there is ample capacity up to the year 2066, with less than half of the available slots used. If growth in ship numbers were to continue as forecast then the ultimate capacity constraint would not be reached until sometime in the mid-2100s.
Vessels transit the heads on a first-come first-through basis. A more active vessel traffic management regime would be required to maximise capacity. This would involve the vessel traffic service (VTS) provider prioritising vessels based on size, cargo and handling characteristics and assigning them a suitable time slot to transit the Heads. As the main limiting factor is tidal currents, suitable slots can be predicted and assigned in advance. This allows ships to ‘slow steam’ from the previous port, timing their arrival to meet the slot and saving fuel.
While vessel traffic management systems operate at many ports around the world, congestion increases port costs. As the number of ships increase, the traffic management system will introduce some delays to shipping (usually no more than 6 to 12 hours) and potentially erode the efficiency of port terminals as ships arrive in bunches around slack water rather than spread throughout the day, putting pressure on the ability of cranes, quay lines and terminals to handle an influx of containers.
Could an accident block the Heads?Port Phillip Heads is a busy and constricted waterway through which most of Victoria’s sea-borne trade flows. As ship numbers increase so may the risk of an accident blocking the shipping channel.
In order to better understand this risk we consulted with Captain David Shennan, ex-Port of Melbourne Harbour Master, who considered the most likely cause of an accident which blocked the channel would be a ship running aground on a channel edge, due to either human error or mechanical failure. There is a low likelihood of this occurring, due to comprehensive systems to ensure the safety of vessels navigating the heads, such as:
one-way traffic through the Heads Harbour Master’s restrictions on vessel size and conditions in which to transit the
Heads compulsory pilotage for vessels over 35 metres in length
Infrastructure Victoria Second Container Port Advice – Evidence Base31

vessel traffic service monitoring all transits and providing warnings of potential conflicts
dynamic under keel clearance systems for deep draught vessels survey and maintenance dredging of channels inspections of ships by Australian Maritime Safety Authority and classification
societies to ensure equipment is fit for purpose and properly maintained.
In particular, the introduction of safety management systems covering training, maintenance and backup systems, along with auditing, has reduced the risk of accidents.
If an accident resulted in a ship blocking the Great Ship Channel, a number of strategies could be used to minimise the impact of the restriction:
Ships with smaller draught could continue to transit the Heads using one of the adjacent shallower channels.
Tugs could be used to move the grounded ship or hold it in a position that allowed other ships to pass.
Salvage experts could be called in to refloat and remove the grounded ship.
The time taken to clear a blocked channel would depend on the nature of the incident. In an extreme case it could take weeks, but several days is considered far more likely.
Navigating through the Heads is more complex than the entrance to Western Port. Safety standards are in place at each location to reduce the risk of navigation to acceptable levels.
QUESTIONS Do you have feedback on the ship navigation simulation work?
Which technical reports should I look at for more information? GHD, Infrastructure Victoria Second Container Port Advice – Estimated Capacity of
the Port of Melbourne, 2017 AECOM, Infrastructure Victoria Second Container Port Advice – Navigation Study,
2017
Changing ship sizes
Why is this important?How ship sizes are changing and what that means for the vessels that want to visit Victoria and Australia influences what vessels Victorian container ports need to accommodate in the future. Changes in ship size also affect the cost of importing and exporting cargo, with larger ships generally providing a lower per TEU cost. Likely future ship sizes will influence our advice on how large the Port of Melbourne could be, as well as the suitability of a second container port at either Bay West or Hastings.
Infrastructure Victoria Second Container Port Advice – Evidence Base32

How have ship sizes changed over time and how do ships come to Australia?Container ships and container port terminals are designed to handle large numbers of containers as efficiently as possible.
The first container ships in the 1950s were converted tankers or general cargo ships. Dedicated container ships optimised for container capacity and quick loading and unloading soon followed. Prior to containers, it could take weeks to load and unload large cargo ships. The introduction of dedicated container ships, and the associated quay infrastructure of cranes and container stacks, means it is now possible to load and unload a ship within 24 hours. This has resulted in a large reduction in cost of moving cargo long distances.
The size of container ships has steadily increased. Figure 8 shows the general evolution of container ship size. Naming conventions for classes of ships often refer to the physical feature through which they can fit. For instance, some of the ships in figure 8 are named for their ability to fit through the old or new locks on the Panama Canal, a major international shipping route.
Infrastructure Victoria Second Container Port Advice – Evidence Base33

Figure 8. Evolution of container ships
Source: Infrastructure Victoria, 2017
The life of a container ship and shipping to and from AustraliaThe bulk of world container trade is on the ‘East–West’ routes between Europe, Asia and North America. Australia, New Zealand, Africa and South America are serviced by the ‘North–South’ routes.
Most of the Australia’s container trade is with ports in Asia.
Infrastructure Victoria Second Container Port Advice – Evidence Base34

Figure 9. Global shipping routes
Source: Infrastructure Victoria, adapted from Drewry, Container Ship Fleet Forecast and Maritime Economic Assessment, 2017
Most container services visiting Australia call at all three east coast ports; Brisbane, Sydney and Melbourne. A ship size restriction in one port becomes a restriction for all. It also means that ships arriving in Melbourne typically load and unload only 30–40 per cent of their full capacity.
The life of a typical container ship is 10 to 30 years. Every five years ships must undergo a major safety inspection required by certification agencies and maritime safety regulators. From about ten years onwards, shipping companies may decide to scrap ships after this inspection, rather than reinvest in refurbishing a ship that is becoming uneconomical due to its size or fuel costs. In practice, most container ships operate for between 15 and 20 years.
The newest and largest ships are deployed on global East–West routes. As ships get older, and new larger ships are built and deployed, shipping lines seek to redeploy the midlife ships to North–South routes, which are the routes servicing Australia, New Zealand, Africa and South America. This is termed the ‘cascade’ of large ships from East– West to North–South.
Because the maximum life of a container ship is usually about 20 years, most ships currently sailing or on order will likely be scrapped by 2040. We can only use forecasts for insight into the size of future ships.
Container ships are getting biggerContainer ships at the top end of the size spectrum are getting bigger. Big ships are also becoming a larger percentage of the total ships in the global fleet.
Figure 10 shows the evolution of container ship sizes since the 1960s, how many individual ships exist in each size class, and what size ships are being ordered for future deployment. Each grey dot represents a single ship, its year of launch and nominal container capacity.
Infrastructure Victoria Second Container Port Advice – Evidence Base35

Grey dots are ships that have been launched (many of these have subsequently been scrapped); red dots are ships under construction or on order.
Figure 10 clearly shows that ships sizes continue to increase and that this trend is accelerating. As ships become larger, fewer ship calls are needed to provide the same TEU capacity.
Figure 10. Evolution of the world container fleet
Source: Adapted by Infrastructure Victoria from Drewry, Container Ship Fleet Forecast and Maritime Economic Assessment, 2017
The global shipping industry is highly competitive, and the move to bigger ships is driven by shipping companies always seeking to reduce the cost per TEU of moving a container (the ‘slot cost’).
Over the past decade, the global shipping market has suffered from oversupply. To try and maintain business or win new business, shipping companies have responded to this oversupply by ordering and building even bigger ships, in a constant pursuit of lower costs, usually measured in cost per TEU. In open markets this is a strange industry response, with oversupply in an industry typically resulting in a rationalisation of firms. So far the shipping industry has resisted this trend, but we are starting to see more consolidation within the industry, which is likely to continue. The current oversupply has also led some shipping lines to form alliances, which lets them combine their business and send fewer, bigger ships on the same route.
The increasing supply of large ships has resulted in some ships being scrapped after only ten years, and also in shipping companies seeking to accelerate the cascade of larger ships from East–West to North–South routes (for more information on the lifecycle of ship and the cascade effect, see page 35).
Infrastructure Victoria Second Container Port Advice – Evidence Base36

Table 4. Container ships on order, January 2017 TEU capacity
TEU capacity Number of vessels % of total TEU capacity on order
0 – 3,999 239 15%4,000 – 5,999 9 2%6,000 – 7,999 1 <1%8,000 – 11,999 53 18%12,000 – 15,999 60 26%>16,000 62 38%
Source: Adapted by Infrastructure Victoria from Drewry, Container Ship Fleet Forecast and Maritime Economic Assessment, 2017
Table 4 shows a breakdown of the container ships currently on order around the world. Almost all fall into two categories: small ‘feeder’ ships of less than 4,000 TEU or large ships of greater than 8,000 TEU. Feeder ships are small ships used to service small ports in regional groups for example some Tasmanian and Pacific Island trade, which is only a small percentage of Port of Melbourne’s trade.
Ships currently visiting AustraliaThe Port of Melbourne is currently the most constrained east coast port in terms of large ship access. The largest container ships regularly visiting the Port of Melbourne can carry a maximum capacity of about 6,000 TEU. These ships are about 285–300 metres long and 40 metres wide. In Preparing advice on Victoria’s future ports capacity, we listed the largest container ship to visit the Port of Melbourne so far as the Pangal, which has a capacity of 6,600 TEU, is 304 metres long, 40 metres wide and 12.5 metres deep. Since then, the largest capacity ship to visit the Port of Melbourne has been the E.R. Long Beach, which has a capacity of 7,500 TEU, is 288 metres long, 43 metres wide and 14.5 metres deep. As table 4 shows, very few ships are being built or areon order in this class. Most ships now on order are much larger, 8,000–12,000 TEU or 12,000+ TEU.
The Port of Brisbane has already been visited by an 8,500 TEU capacity ship, and Brisbane could be upgraded for 11,000 TEU vessels with a reasonable investment. The length of Brisbane’s approach channel is about 90 kilometres, which means that there would be a significant cost to dredge the channel to accept ships larger than 11,000 TEU.
Port Botany in Sydney has also accepted an 8,500 TEU vessel. Port Botany can accommodate ships between 8,000 and 10,000 TEU, possibly larger with modest channel modifications.
Shipping lines are regularly approaching Australian ports, including the Port of Melbourne, to accept vessels in the 8,000–10,000 TEU range. The Port of Melbourne does not currently service ships of this size. If all east coast ports could accept ships this size, they may become the standard size for east coast ports for the next couple of decades.
Infrastructure Victoria Second Container Port Advice – Evidence Base37

It is possible that if one or two (Melbourne and Brisbane) ports on the east coast are constrained and one not (Sydney) then instead of running a loop service, shipping lines could shift to a ‘hubbing’ model where all imports come directly to the hub (Sydney) and are transhipped onto smaller coastal vessels to reach other ports (Melbourne). This possible, but unlikely, scenario would increase the cost of shipping to and from the smaller ports relative to the hub.
Current and future ability of ports to accept larger shipsShipping lines will always prefer to send the largest ship they can fill on a weekly basis, in an attempt to reduce costs. Port infrastructure influences the size of ships that visit.
However, significant port investment is required to accept the larger vessels including dredging to deepen and widen channels, upgrading of wharf structures, and bigger cranes. Ports may also need to extend or widen their berths.
Ports may face financial, environmental or social reasons which stop them from upgrading facilities for larger ships. For example, many ports around the world stopped investing to deepen channels, because it was becoming too costly and environmentally damaging. This has acted as a constraint on container ships getting deeper. The result of this can be seen in the ship profile where newer ships larger than the “Old Post Panamax Plus” started being built wider rather than deeper.
In response, shipping lines have ordered wider and longer ships, rather than deeper. For instance, in 2000, the largest container ship in the world had an 8,000 TEU capacity with a maximum draught of 14.5 metres. By 2016 the capacity of the largest ship in the world had increased to 18,000 TEU, but its maximum draught was 15.5 metres, only a metre more than the much smaller capacity ship in 2000. Even though this ship has a maximum draught of 15.5 metres, its normal operating draught is between 13 and14 metres.
Port infrastructure and structural constraints also exist for vessel length and beam, which could limit the expansion of container ships in the future. For example, the lengthof ships transiting the Bosphorus Strait in Turkey is limited to 300 metres. Constraints such as these mean there will also be a need for smaller and mid-size ships in the global container fleet.
What size ship do we need to plan for?Does Victoria need to respond to shipping line requests to bring ever increasing ship sizes to Australia? We have considered two scenarios.
UnconstrainedGovernments, port operators and stevedores continuously upgrade port infrastructure at all three east coast ports to allow the largest and most efficient vessels to meet demand. This results in low shipping rates but requires significant capital investment in port infrastructure and accepting the environmental and social impacts associated with infrastructure upgrades.
Infrastructure Victoria Second Container Port Advice – Evidence Base38

ConstrainedMelbourne and Victoria is a significant market for container imports and source of exports. If Port of Melbourne infrastructure is not upgraded, shipping lines will continue to service our market. Shipping lines may use older, smaller ships, or they may build a specific class of vessel to suit the Port of Melbourne. This is likely to increase supply chain costs for imports and exports passing through the Port of Melbourne.
In the ‘constrained’ scenario port infrastructure is progressively upgraded to accept an optimal size ship for the east coast of Australia, balancing demand and the world container fleet against the cost and impacts of infrastructure upgrades. Because ships call at all three east coast ports, the port with the lowest size constraint constrains all three. Matching the capacity at the three east coast ports would allow shipping lines to continue to offer efficient services with a pan-Australia rate.
In this scenario the growth of ship size visiting Melbourne is constrained to keep the older facilities at Swanson Dock commercially viable for international trade. If this is not done there is a risk of large volumes jumping quickly to Webb Dock because it can take larger vessels. We discuss Swanson Dock constraints in the ‘Capacity of the Port of Melbourne’ section.
Ship sizes expand gradually up to a maximum of 14,000 TEU – the largest sizes that can safely navigate through Port Phillip Heads with the existing channels.
Future fleet forecastsFleet forecasts have been prepared for the constrained and unconstrained scenarios taking into account current trade routes, forecast trade growth, the possibility of consolidation among shipping lines and the limitations of navigating into the Port of Melbourne.
The forecast fleet spectrums are given in figures 11 and 12, and the maximum ship size in the forecasts is summarised in table 5 below. For more information on the fleet forecasts refer to the ‘Estimated Capacity of the Port of Melbourne’ technical report. We consider the two scenarios presented here represent possible slow and rapid growth in ship size. Actual growth will likely be between these scenarios, depending on: trade growth, Australian port regulation and infrastructure investment, and the evolution of the world container fleet.
Cascading of container ships in the global fleet means that shipping lines want to bring larger ships to Australia now if possible, up to 10,000 TEU capacity. The very largest ships in the global fleet, however, are unlikely to call in Australia in the next couple of decades. To achieve economies of scale, ships need to be close to full and without significant industry consolidation there is not enough demand to fill 18,000 TEU vessels for Australian services for decades.
Figure 11 shows that without service consolidation we are unlikely to see 18,000 TEU capacity ships before 2066. Figure 12 shows that with consolidation shipping companies may want to bring 18,000 TEU capacity ships as soon as 2035. Victoria does not necessarily need to respond to shipping company requests at that time.
Infrastructure Victoria Second Container Port Advice – Evidence Base39

Table 5. Forecast maximum ship size (TEU) by year
Year Constrained Unconstrained2016 6,000 6,0002026 8,000 10,0002036 14,000 18,0002046 14,000 18,000+2056 14,000 18,000+2066 14,000 18,000+
Source: Adapted by Infrastructure Victoria from GHD, Infrastructure Victoria Second Container Port Advice – Estimated Capacity of the Port of Melbourne, 2017
Figure 11. Forecast fleet spectrum for the constrained case
Source: Adapted by Infrastructure Victoria from GHD, Infrastructure Victoria Second Container Port Advice – Estimated Capacity of the Port of Melbourne, 2017
Infrastructure Victoria Second Container Port Advice – Evidence Base40

Figure 12. Forecast fleet spectrum for the unconstrained case
Source: Adapted by Infrastructure Victoria from GHD, Infrastructure Victoria Second Container Port Advice – Estimated Capacity of the Port of Melbourne, 2017
Which technical reports should I look at for more information? GHD, Infrastructure Victoria Second Container Port Advice – Estimated Capacity of
the Port of Melbourne, 2017 Drewry, Container Ship Fleet Forecast and Maritime Economic Assessment 2017
QUESTIONS Do you think our information on ship sizes is right? Do you have evidence that challenges our findings?
Evidence for when a second port will be requiredThe Special Minister of State requested that Infrastructure Victoria provide advice on the capacity of Victoria’s commercial ports.
Managing the use of, and improving, assets we already have is often a more efficient and cheaper option than investing in new infrastructure. We used this principle of improving the existing asset of the Port of Melbourne as the starting point for gathering evidence on when a second container port is required.
The need for additional port capacity will be driven by the growth in container trade.
The evidence we have gathered on when a second container port will be needed is presented below. The key factors we are considering and have gathered evidence on are:
Infrastructure Victoria Second Container Port Advice – Evidence Base41

landside supply chains that service the port, including road and rail links to the port possible improvements to increase container capacity within the port environmental and social considerations other triggers for deciding when a second container port is needed.
We will analyse this evidence in preparing advice to the Government on a timeframe for investing in a second port. Based on the evidence we have gathered so far, we do not think Government will need to invest in a second port for decades.
Port of Melbourne supply chains
Why is this important?Before examining the potential capacity of the Port of Melbourne, we need to understand how supply chains work to deliver or remove containers from the Port. This will help us understand whether the supply chains beyond the port gate can handle the number of containers that need to leave and arrive at the Port.
Port of Melbourne supply chainsExport and import commodities are transported to and from the Port to places where they are produced and consumed. Commodities are transported in containersby truck and by rail. The supply chains supporting the Port also have to organise the repositioning of empty containers.
Import supply chainsMelbourne is an import-dominated port so import supply chains drive investment and land use decisions. Most containerised imports are manufactured products. They are either ready to use or parts that come to Victoria for a value add process prior to use.
The import supply chain commences with an overseas manufacturer or company selling to an Australian buyer. The Australian buyer arranges to have the goods delivered, culminating in the arrival of the goods at their final destination, and the return of the empty container.
Often transport companies do not deliver to the client or distribution centre directly from the port but stage the box in a transport depot first. About 70 per cent of import boxes are staged in greater metropolitan Melbourne. Staging is common because the port and transport companies work 24 hour seven day operations but many factories, wholesalers and distribution centres are only open five days a week during business hours. Night operations are likely to increase as port volumes increase, as trucks seek to avoid increasingly congested peak periods.
Over 80 per cent of imports through the Port of Melbourne are delivered within metropolitan Melbourne. A substantial number go via a facility where full shipments are broken into smaller packages, especially for delivery to retail. The place where this occurs is called a distribution centre or warehouse.
Infrastructure Victoria Second Container Port Advice – Evidence Base42

Our supply chain analysis costs the initial staged move and all subsequent moves to final destinations. The analysis will look at the following scenarios:
Scenario 1a: originate at a container port, interim move to a staging facility, unpacked at a distribution centre, proceed to a factory for processing, final destination is a retailer.
Scenario 2a: originate at a container port, interim move to a staging facility, unpacked at a distribution centre, final destination is a retailer.
Scenario 3a: originate at a container port, interim move to a staging facility, proceed to a factory for processing, final destination is a retailer.
Scenario 4: the above scenarios but no interim move to a staging facility. Scenario 1b, 2b, 3b: the above scenarios but the final destination is an empty
container park.
Figure 13. Import supply chains at the Port of Melbourne
Source: Prepared by Deloitte for Infrastructure Victoria, 2017
Export supply chains – Port of MelbourneThe export supply chain is a reverse of the import supply chain, with some key differences. Because Melbourne is import dominated, shipping lines compete for back loads of empty containers to help cover costs of ships travelling back to their origins. Empty containers are moved at the shipping line’s cost. Shipping lines compete aggressively for export containers, because even at a discounted rate they generate more revenue than empty containers.
Export supply chains are less Melbourne-centric. 46 per cent of exports are packed in regional Victoria or interstate. Exports are also staged less than imports.
Infrastructure Victoria Second Container Port Advice – Evidence Base43

We assume that the supply chains for a second port location should aim to manage costs for Victorian exporters.
Our supply chain analysis costs the initial staged move and all subsequent moves to final destinations. The analysis will look at the following export scenarios:
Scenario 1: empty container moves to commodity origin for packing, moves to intermodal terminal(s), final destination port.
Scenario 2: empty container and commodity move to distribution centre or factory for processing, move to intermodal terminal(s), final destination port.
Scenario 3: empty container moves to port, final destination.
Figure 14. Export supply chains at the Port of Melbourne
Source: Prepared by Deloitte for Infrastructure Victoria, 2017
Land useTo determine the possible location of industrial facilities that import and export products we will use the data on current and planned industrial land prepared by the Department of Environment, Land, Water and Planning’s Urban Development Program and Plan Melbourne data. Freight flows to each precinct are weighted according to the precinct’s size and
Infrastructure Victoria Second Container Port Advice – Evidence Base44

employment estimates for manufacturing-oriented industries (i.e. manufacturing, transport and warehousing, and wholesale trade).
The transport and freight industry considers a number of key criteria when making location choices:
cheap industrial land that is preferably flat and without residents nearby good access to transport links optimal distance to customers and the supply chain centre of gravity (balancing the
distance between where goods are picked up and where they need to be delivered).
Table 6 presents all the industrial buildings across Melbourne by number and total area. This shows that the north, west and south all have significant areas of industry but that the west has the largest buildings of the type commonly used by warehousing and distribution facilities. This data indicates that the west and north are significant freight hubs.
Table 6. Number of buildings, area and size categories of buildings within State Significant Industrial Precincts, Metropolitan Melbourne, 2015-16
0 to 1,000m2 1,000 to 5,000m2 5,000 to 10,000m2
10,000 to 25,000m2 25,000m2 plus Total
SSIP Number Area (m2)
Number Area (m2)
Number Area (m2)
Number Area (m2)
Number Area (m2)
Area (m2)
West 3,614 1,303,000
1,238 2,731,200
224 1,582,600
174 2,755,200
51 2,006,600
10,378,600
Inner 376 136,000 159 400,000
25 169,300 11 171,300 3 168,000
1,044,600
North 5,162 2,012,000
1,237 2,531,100
108 745,300 73 1,125,400
19 930,100
7,343,900
South 5,095 1,776,600
1,514 3,217,700
195 1,376,400
105 1,479,200
20 733,500
8,583,400
Pakenham/Officer
443 156,600 94 181,600
2 13,800 3 49,000 0 0 401,000
Hastings 413 72,300 24 54,200 3 18,400 1 18,000 2 124,200
287,100
TOTAL SSIPs
15,103 5,456,500
4,266 9,115,800
557 3,905,800
367 5,598,100
95 3,962,400
28,038,600
Source: Department of Environment, Land, Water and Planning – Urban Development Program, State Significant Industrial Precincts 2016
Future land availability is likely to continue this trend. Table 7 shows land that is currently zoned for industry and land that will be zoned for industry in future Precinct Structure Plans. Table 7 shows that the west and north of Melbourne are likely to have more land available that suits freight industry needs.
Table 7. Current vacant industrial land and proposed industrial land, State Significant Industrial Precincts, 2015-16West State North State South State Pakenham/ Officer Hastings State
Infrastructure Victoria Second Container Port Advice – Evidence Base45

Significant Industrial Precinct
Significant Industrial Precinct
Significant Industrial Precinct
State Significant Industrial Precinct
Significant Industrial Precinct
Vacant Land (Ha)
Proposed Industrial (Ha)
Vacant Land (Ha)
Proposed Industrial (Ha)
Vacant Land (Ha)
Proposed Industrial (Ha)
Vacant Land (Ha)
Proposed Industrial (Ha)
Vacant Land (Ha)
Proposed Industrial (Ha)
1,857 1,605 1,024 1,135 674 0 388 935 574 0
Source: Department of Environment, Land, Water and Planning – Urban Development Program, Metropolitan Melbourne 2016
How is population growth changing the shape of Melbourne?After a long period of steady growth in Melbourne’s east and southeast, growth is increasing in Melbourne’s west and north. What does this mean for the shape of Melbourne and the location of a second container port?
The government’s most recent population forecast, Victoria in Future 2016, predicts that Melbourne’s west will continue to accommodate significant growth.
The historical shape of Melbourne, however, is skewed. In the southeast there is solid urban development out to areas like Pakenham, Cranbourne and Officer, which are all over 50 kilometres from the city and continue to grow. In the west, areas like Rockbank, Wyndham Vale and Tarneit are only about 30-35 kilometres from the city, with much less density between them and the city.
The current and forecast population distribution is shown in table 8.
Table 8. Melbourne current and forecast future population distribution (number of people)
NorthRegion 2011 2021 2031 Annual
percentage change 2011-2031
Northwest Melbourne
1 488 300 1 899 300 2 339 400 2.3%
Southeast Melbourne
2 17 0000 2 504 200 2 830 500 1.3%
Difference 681 700 604 900 491 100
Source: Adapted by Infrastructure Victoria from Victoria in Future 2016 data.
This means even with the northwest growing at nearly twice the rate of the southeast, the historical distribution of Melbourne’s population means the southeast is growing from a much larger base, and so the geographical population centre of Melbourne will remain in the southeast. Table 8 shows, however, that the population spread of Melbourne is forecast to become more balanced over time.
Infrastructure Victoria Second Container Port Advice – Evidence Base46

As Melbourne’s population spread becomes more balanced, there will be significant freight demand across the metropolitan area. This means regardless of deciding to locate a port at either Bay West or Hastings, we will need to plan for significant cross-city movements as goods travel between the port, warehouses and retail locations.
A port at Hastings will generate more warehousing and container unpacking in the southeast. This will create significant east to west movements from these warehouses to industry and population in the west, especially as retail demand grows to service the growing population in the northwest.
A port at Bay West would generate significant west to east movements as warehousing consolidates in the west and north. This means cargo from unpacked containers will need to be moved east to service the significant population and retail centres in the southeast. In either case, planning for increased cross-city movements will be an important part of planning a second container port.
QUESTION Have we identified the Port of Melbourne supply chains correctly?
Port of Melbourne road and rail links beyond the port gate
Why is this important?We needed to model key intersections and the broader traffic network to understand whether supply chains and the transport network outside the port gate would be able to handle capacity increases at the Port of Melbourne.
Contrary to public perception, freight vehicles contribute little to congestion. Freight vehicles are less than 20 per cent of metropolitan traffic, and port trucks are an even smaller percentage of this. Even in intersections directly outside port gates, during the busiest times of the day, port trucks account for about 10 per cent of the traffic. Overnight port traffic is proportionally more (above 50 per cent) but there is only 10 per cent of the total traffic volumes at night.
Microsimulation of the local road networkWe have modelled key intersections for Swanson and Webb Docks to understand whether the road network outside the port can handle capacity increases within the port.
Figure 15 provides an overview of the landside port capacity.
Webb Dock
Our modelling demonstrates Webb Dock can operate at 4.5 million TEU per year, with the existing road network, assuming 50 per cent night operations and some minor upgrades to West Gate Freeway onramps (with a capital cost of about $20 million).
Infrastructure Victoria Second Container Port Advice – Evidence Base47

The two key intersections for trucks accessing Webb Dock are Todd Road/Cook Street and Todd Road/Webb Dock Drive. Running a microsimulation of traffic flows through these intersections indicates it is possible for the landside network at Webb Dock to handle the traffic flows, assuming increases in truck night operations and upgrades to local interchanges and onramps.
VicRoads uses a Level of Service qualitative measure to assess the quality of traffic flows, based on the significance of congestion delays. Level of Service is measured using letters A through F. ‘A’ represents free flow conditions, ‘F’ represents a complete breakdown. The VicRoads target for a road or intersection is a minimum threshold of Level of Service ‘D’ during peak hours. Level of Service D refers to a traffic state close to the limit of stable flow and approaching unstable flow. All drivers are severely restricted in their freedom to select their desired speed and to manoeuvre within the traffic stream. The general level of comfort and convenience is poor, and small increases in traffic flow will generally cause operational problems.
At the moment in peak periods, traffic levels for the key Webb Dock intersections are approaching beyond Level of Service D. There is excess capacity at night at the local intersections. Night operations at Webb Dock could reach 50 per cent and not exceed the Level of Service D target. Considering only the capacity of the local intersections,it would be possible for Webb dock to reach a capacity of about 4.5 million TEU. This maintains a level of operation that is close to the limit of stable flows throughout theday. If traffic increases beyond this level, incidents would result in delays for port and non-port traffic through the day. We are assuming that 50 per cent night operationsis a maximum upper limit achievable by the freight industry. It represents a significant change in current supply chain arrangements that would likely take time and possibly require direct or indirect Government intervention to achieve. Our economic modelling will assess if avoiding day time congestion results in time and cost savings to justify a shift to increased night operations.
Should night operations only account for 24 per cent of movements, local intersections would only be able to accommodate about 2 million TEU capacity at Webb Dock and maintain Level of Service ‘D’. If night operations increased up to 30 per cent of movements, then local intersections could accommodate about 3.2 million TEU capacity at Webb Dock and maintain Level of Service ‘D’.
Swanson Dock
The Western Distributor is likely to provide a substantial boost to road capacity at Swanson Dock. The completion of the Western Distributor and a minor upgrade to the Sims Street/Footscray Road interchange and underpass (with a capital cost of about $50 million), means Swanson Dock can grow up to a 4 million TEU capacity without increasing truck night operations.
Based on the VicRoads Level of Service D standard, an achievable overnight increase for Swanson Dock from the current 28 per cent up to 50 per cent maintains enough intersection capacity to accommodate a capacity increase at Swanson Dock of about 6 million TEU.
Infrastructure Victoria Second Container Port Advice – Evidence Base48

The social impacts of a possible increase in night operations at Webb and Swanson Dock would need to be considered.
Figure 15. Landside port capacity overview
Source: Deloitte/Jacobs, Infrastructure Victoria Second Container Port Advice port landside transport modelling, 2017
Rail accessThe main rail services at or adjacent to the Port of Melbourne include:
regional intermodal trains grain trains some steel train operations associated locomotive provisioning and maintenance movements.
Victoria’s main interstate rail facilities are located at Dynon, just north of Swanson Dock. Port rail facilities are linked to Dynon where there is a mix of port and non-port rail freight operations. Rail mode share at the Port of Melbourne is about 10 per cent.
Currently there is no significant movement of containers around metropolitan Melbourne on rail.
The amount of network capacity available for more port freight trains in the future depends on what growth will happen on the public transport system and of interstate and regional
Infrastructure Victoria Second Container Port Advice – Evidence Base49

freight trains. Trains to the southeast have to use the broad gauge system mainly used by public transport. Trains to the west and north use the standard gauge network mainly used by freight. A key interface point and potential network constriction is the Sim Street Junction just north of Footscray Road and the port. This junction is an interface for trains of the metropolitan passenger network using Southern Cross Station and interstate trains operating at the Dynon Terminals.
The implementation of metropolitan rail port shuttle operations has been the subject of significant planning although minimal services currently operate to the port. Current capacity to the west of Melbourne on standard gauge can provide for about eight (one way) daily trips and at least this capacity is also available on the broad gauge to the south east of Melbourne, providing capacity for 300,000 to 400,000 TEU in the short term and the period to about 2025.
Key issues for scheduling of port rail shuttle trains on the existing networks involve avoidance of peak periods and agreed schedules around passenger and potential higher priority trains.
The capacity available on the networks is likely to provide some challenges in the future. If the system can be established, however, projects to increase capacity may be viable when demand for services nears capacity limits.
Which technical reports should I look at for more information? GHD, Infrastructure Victoria Second Container Port Advice – Estimated Capacity of
the Port of Melbourne, 2017 Jacobs, Infrastructure Victoria Second Container Port Advice port landside transport
modelling, 2017
QUESTIONS Have we got the right information on road and rail links around the Port of
Melbourne? How could a shift to 50 per cent night operation at Webb Dock be made possible? Is
this level of night operations desirable?
Capacity of the Port of Melbourne
Why is this important?Understanding the current capacity at the Port of Melbourne is critical to be able to provide advice about when Victoria will need a second container port. In providing advice we will consider evidence on:
how port capacity could be increased how much these capacity increases would cost whether any capacity increases would affect supply chain costs and transport
networks how residents and the environment would be affected.
Infrastructure Victoria Second Container Port Advice – Evidence Base50

The Port of Melbourne todayThe Port of Melbourne is Australia’s largest container port, handling 2.64 million TEU in 2015–16. By comparison, in 2015-16 Port Botany handled 2.3 million TEU and the Port of Brisbane 1.1 million TEU, while the ports in Fremantle and Adelaide are much smaller.
Port of Melbourne land is shown in figure 16. The Port of Melbourne has a number of precincts which handle different types of cargo, including international containers, Tasmanian trade, dry bulk, break bulk and liquid bulk. The remaining Port of Melbourne land is used for other port-related activities such as truck and rail arrival and loading areas, container storage, administration, maintenance and staff facilities.
Our main focus is on the container terminals which are located at Swanson Dock (East and West), and Webb Dock East, where a new international container terminal opened in January 2017.
The Port of Melbourne’s current capacity is about 5 million TEU per year, split between the capacity to handle about 3-4 million TEU a year at Swanson Dock East and West (based on the yard equipment each stevedore chooses to use) and the ability to handle about 1.4 million TEU per year at the new Webb Dock terminal.
Our evidence base focuses on the potential capacity for international containers at the Port of Melbourne.
There are a range of other trades and uses currently occupying the Port of Melbourne land, including the Coode Island chemical storage facility, various liquid bulk and dry bulk terminals and storage, and assorted administration buildings. The location of these facilities is unlikely to influence any of the key factors we are considering when providing advice on when a second container port will be required.
As we gathered our evidence, we considered other trades which could be moved to provide more space for handling international containers. For instance, we consideredthe potential to relocate trades such as automotive or Tasmanian trades, either within the Port of Melbourne’s existing land or to another Victorian commercial port.
This paper is focused on container capacity. To determine whether other trades can be relocated from the Port of Melbourne to increase container capacity we need to understand the capacity at the other Victorian ports. The key trades of liquid bulk, bulk break and automobiles, along with the Bass Strait trade all have modest rates of growth similar to the growth indicated in our TEU demand forecasts. More information on our review of non-containerised demand forecasts can be found in the Infrastructure Victoria Second container Port Advice container trade forecasts for Victoria report. Portland, Geelong and Hastings all have the capacity to increase the volumes of their current trades. They all also have capacity to take new trades, especially Hastings and Geelong. There is also substantial capacity for the Port of Melbourne to handle more bulk trades at its specialised bulk terminals. Overall, Victoria is well served with bulk port capacity and so all trades can be serviced for decades.
Infrastructure Victoria Second Container Port Advice – Evidence Base51

The Port of Melbourne currently occupies 510 hectares of land. Our concept designs for possible new ports at Bay West or Hastings only require about 240 hectares of land. This difference is mostly because we have focused on international container terminals to supplement or replace capacity at the Port of Melbourne, rather than a transfer of all Port of Melbourne activities to a new port.
Figure 16. Port of Melbourne today
Infrastructure Victoria Second Container Port Advice – Evidence Base52

Source: Adapted by Infrastructure Victoria from GHD, Infrastructure Victoria Second Container Port Advice – Estimated Capacity of the Port of Melbourne, 2017
Possible capacity improvements at the Port of MelbourneCapacity at the Port of Melbourne can be progressively increased with infrastructure investments in the channels, terminals and transport networks, and improvements in operating procedures. The sequence and timing of these upgrades will depend on future trade growth, vessel sizes, transport network development and congestion levels.
We have identified a number of possible options to further increase container capacity at the Port of Melbourne. Identifying possible options is important to help us answer the first part of our question – when are we likely to need a second container port in Victoria?
While all of the capacity expansion options we have identified are possible, at this stage we are not recommending that they should all be done. This phase of our work is about identifying all the investments that could be made to expand Port of Melbourne capacity, recognising that we should first explore options to getthe most out of our existing infrastructure.
Port capacity is determined by the interaction of different factors which can be grouped as: maritime approaches terminal operations landside transport networks.
All the possible capacity enhancements have a cost to complete, some of them incurring significant capital costs. Some of these costs will be borne by the port operator and stevedores and some will be borne by government because they relate to the transport network outside the port gate. The cost of capacity enhancement may provide a trigger for deciding to invest in a second port. For detailed descriptions and costs of potential capacity enhancements refer to the Estimated Capacity of the Port of Melbourne technical report.
Swanson Dock constraintsSwanson Dock is an indented dock on the north side of the Yarra River, upstream of the West Gate Bridge. Built between 1966 and 1972 it was Melbourne’s first dedicated container dock.
Infrastructure Victoria Second Container Port Advice – Evidence Base53

Swanson Dock is about 900 metres long and 210 metres wide. Two stevedores operate the container terminals – Patrick operates three berths at Swanson Dock East, and DP World operates three berths at Swanson Dock West. The largest vessels calling at Swanson Dock are Post Panamax ships with a capacity of between 5,000 and 7,500 TEU.
Swanson Dock is serviced by road and rail. Each terminal has its own truck waiting and loading areas. Trucks are required to book slots to enter the port and are givenone hour windows for pick up or deliveries. Slots are booked to help manage workload over the day and to reduce the number of trucks waiting to enter the portto avoid queuing congestion.
The main rail yards are located to the north of Footscray road in the Dynon precinct, with rail sidings servicing Swanson West, East and Appleton Dock. Rail sidings in the port cater for trains up to 1,500 metres in length however trains in West Swanson sidings to the north are limited to trains of 500-700 metres. About 10 per cent of Port of Melbourne trade is moved by rail, essentially, all of it trade from regional Victoria, South Australia or southern New South Wales. Rail does not handle a significant amount of metropolitan freight.
Further details of the terminals and analysis of capacity is given in the technical report Estimated capacity of the Port of Melbourne.
Maritime approaches
Swanson Dock’s major constraints relate to maritime approaches, rather than terminal infrastructure such as crane capacity and space for stacking containers, or transport connections.
Width – the dimensions of Swanson Dock, particularly its width, constrain the number of large ships that can be berthed in the Dock at once. To use all three berths on both sides, there needs to be room for a ship to be moored on either side of the dock, and room for a ship to pass alongside with its tug boats. Tug boats are compulsory for all ship movements in and out of the Port of Melbourne terminals.
Under its current configuration, Swanson Dock can operate with six 5,000 TEU ships at berth. It is possible to fit larger ships of about 7,500 TEU, but accommodating these ships reduces the availability of the other berths, limiting the number of ships that can be serviced.
Swinging basin – the Swanson Dock swing basin is limited to ships about 320 metres long, equivalent to about 7,000 to 8,000 TEU ships.
The West Gate Bridge – the air draught of the West Gate Bridge is 50.1 metres at Highest Astronomical Tide. This air draught is not a constraint at the moment, but will ultimately prevent access to Swanson Dock for ships with a capacity of greater than about 9,000 TEU.
Speed and beam restrictions in Yarra Channel – the width and depth of the Yarra River means ships with a capacity greater than about 7,500 TEU can generate large pressure waves as they travel up the channel. Pressure waves travel ahead of the ship and can be a hazard to infrastructure and other vessels up river. There are significant constraints to widening or deepening the Yarra to reduce the impact of pressure waves. Existing onshore
Infrastructure Victoria Second Container Port Advice – Evidence Base54

infrastructure restricts widening opportunities, while multiple service and pipeline crossings below the river make deepening difficult. Furthermore, the channel is one way, which limits the number of ships that can transit each day.
The height of the West Gate Bridge and the width and depth of the Yarra Channel are hard constraints that cannot be easily overcome, and we assume no further changeto either constraint. As a result, even with the possible enhancements described in the next section, we assume the practical limit to ship size in Swanson Dock is about 7,500 TEU.
Terminal operations
The maritime approaches limit Swanson Dock’s ultimate capacity. At the moment, we expect Swanson Dock’s capacity is limited to about 3 million TEU per year by the yard capacity, which uses straddle carriers to stack containers over a total stack area of 51 hectares.
Berth capacity is estimated at 3.4 million TEU per year, limited by the berth length – the quay lines are too short to fit three ships of 300 metres each – and by the number of ship to shore cranes.
These constraints could be lifted to increase capacity to about 4 million with further investment in operating equipment to improve land and berth productivity.
Gate capacity is not a limiting constraint on the capacity of Swanson Dock, and can be increased readily if required.
Landside transport network
The transport networks outside the port gate should continue to function well up to about 3 million TEU per year, assuming the construction of the Western Distributor. Our modelling shows that beyond about 3 million TEU per year, additional trucks accessing the port would need to progressively shift to night operations and there would need to be some intersection enhancement to service trucks heading east from Swanson Dock.
On-dock rail currently handles about 10 per cent of containers for Swanson Dock.
Swanson Dock possible enhancementsThere are a number of enhancements to the berth, yard and landside transport network capacity at Swanson Dock which could increase capacity up to about 5 million TEU per year without widening the dock, if there were enough trade on ships in the 5,000 to 7,500 TEU range to fill this capacity. The layout of Swanson Dock and possible enhancements are shown in figure 17.
Berth capacity
increase the number of ship to shore cranes improve the productivity of ship to shore cranes lengthen the basin 100 metres to the north, and add additional ship to shore cranes.
Yard capacity
expand footprint of container stacks to full area available in terminal
Infrastructure Victoria Second Container Port Advice – Evidence Base55

add on-dock intermodal rail terminal and implement Melbourne Intermodal System (rail port shuttles to suburban terminals)
switch container stacking system from straddle carriers to higher productivity system
Landside network capacity
upgrade Sims Street/Footscray Road intersection increase proportion of truck night operations
Figure 18 shows how each enhancement could increase the capacity of the berth, yard or landside transport network. All of these enhancements would be needed to reach the ultimate capacity.
Swanson Dock could be widened and the swing basin enlarged so the dock could handle six 7,500 TEU ships at once to maximise efficiency. These works would be costly and disruptive and only provide a marginal gain as ship size would still be constrained by the Yarra Channel.
We have identified a possible sequence of enhancements, and an investment pathway, to reach a theoretical capacity of 5 million TEU per year shown in figure 19. This is a theoretical exercise and is not the only plausible sequence. It is likely that other factors, such as the limits on marine approaches or environmental and social impacts, will prevent Swanson Dock from reaching this theoretical capacity.
Figure 17. Swanson Dock layout and possible capacity enhancement measures
Source: Adapted by Infrastructure Victoria from GHD, Infrastructure Victoria Second Container Port Advice– Estimated Capacity of the Port of Melbourne, 2017
Infrastructure Victoria Second Container Port Advice – Evidence Base56

Figure 18 Possible capacity enhancements for berth, yard and landside at Swanson Dock
Source: GHD, Infrastructure Victoria Second Container Port Advice – Estimated Capacity of the Port of Melbourne, 2017
Figure 19. Theoretical sequence of possible capacity upgrades at Swanson Dock
Source: GHD, Infrastructure Victoria Second Container Port Advice – Estimated Capacity of the Port of Melbourne, 2017
Webb Dock constraintsWebb Dock is an indented basin dock at the mouth of the Yarra River. It has been developed progressively from the 1960s and for much of its life has primarily served the Bass Strait trade. Today, there are three terminals at Webb Dock. Toll services the Bass Strait trade at Webb Dock East berths one and two; the recently opened Victorian International Container Terminal services the international container trade at Webb Dock
Infrastructure Victoria Second Container Port Advice – Evidence Base57

East berths three, four and five; and the Melbourne International Roll-on/Roll-off Automotive Terminal occupies Webb Dock West.
Webb Dock does not have a rail connection, so all cargo arrives and leaves the precinct by truck.
Much of the truck traffic can use the West Gate Freeway, (the West Gate Bridge), the Burnley Tunnel or the Bolte Bridge. Load limits on West Gate (68.5 Tonne) and Bolte Bridges limit larger trucks.
Large trucks have to use Lorimer Street to Wurundjeri Way to access Footscray Road or Tullamarine Freeway.
There is currently some volume of trade movements between Webb Dock and the Swanson/Dynon Precinct, mostly related to Tasmanian trades.
Maritime approaches
The new Victorian International Container Terminal at Webb Dock East can handle larger ships than Swanson Dock. It is downstream of the hard limits imposed by the West Gate Bridge and the width and depth of the Yarra River. The Dock is wide enough to handle the largest ships that can access the Port Phillip Heads at 14,000 TEU per year. Accommodating ships this large would require upgrades to the wharf structure, swing basin and approach channel.
Terminal operations
Berth Capacity along the 660 metres of quay line at the Victorian International Container Terminal limits Webb Dock capacity to about 1.4 million TEU per year.
The yard capacity at the Victorian International Container Terminal is close to 2 million TEU per year and the Webb Dock precinct has room to further expand its terminal, yard and gate capacity.
Landside transport network
High volumes of non-port related traffic around the port, specifically the intersections where trucks enter the West Gate Freeway, may constrain Webb Dock capacity in the future. With easily achievable operational measures, such as an average of 1.5 TEU per truck and 10 per cent of truck movements overnight but no infrastructure upgrades, we estimate the capacity of the local network for port traffic is about 2.2 million TEU per year.
Webb Dock possible enhancements
There are a number of possible enhancements to the maritime approaches, berth capacity, quay and transport networks at Webb Dock, which could increase capacity up to about 8 million TEU per year. The Webb Dock layout and possible enhancements are shown in figure 20.
Maritime approaches:
upgrade channels and swing basin to allow access for 14,000 TEU ships.
Infrastructure Victoria Second Container Port Advice – Evidence Base58

Berth capacity:
reconfigure quay at Webb Dock East berth three to give 90 metres additional quay length to the Victorian International Container Terminal and add an additional ship to shore crane
relocate automobile trade, extend basin 100 metres to create about 1,100 metres of quay line and convert Webb Dock West to an
international container terminal relocate Bass Strait trade, realign and extend quay line 100 metres north and convert
Webb Dock East berths one and two to an international container terminal create an island reclamation to expand Webb Dock East 750 metres south into Port
Phillip Bay to create two new container berths, plus yard area. This new terminal would add about 2 million TEU per year, which could increase the capacity of the Webb Dock precinct up to about 8 million TEU per year.
Landside transport network:
shift to truck night operations to avoid peak congestion upgrade intersections providing access to/from West Gate Freeway build ‘Freight Link’ – a new dedicated road and rail connection from Webb Dock to
the Tullamarine Freeway and Western Distributor.
These possible transport network upgrades would be needed progressively, to match any capacity enhancements within the Webb Dock precinct. Increasing night operations and upgrading intersections is likely to be able to handle about 4.5 million TEU per year. To unlock this constraint, ‘Freight Link’ is required, which is a significant investment in a dedicated freight road and rail corridor linking Webb Dock to the Western Distributor and the Tullamarine Freeway. Freight Link would cost about $3.4 billion and require an elevated corridor across Fishermans Bend and a new crossing of the Yarra alongside the Bolte Bridge. The Freight Link needs to bypass the West Gate and Bolte Bridges, which have weight restrictions preventing them from carrying High Productivity Freight Vehicles.
Figure 21 shows how enhancements to the capacity of the berth, the yard and the landside transport network could interact to increase the overall capacity of Webb Dock, noting that all would need to be increased to reach the ultimate capacity.
Trade relocationIt may be possible to relocate the Bass Strait and automotive trades at Webb Dock to allow a large increase in container capacity of the precinct. Converting the space to international container terminals could increase the capacity by about 2 million and 2.5 million TEU per year respectively.
It is possible to relocate the Bass Strait trade to the Port of Hastings, which has a large area of land zoned for port use or the Port of Geelong, although Geelong is more constrained than Hastings in terms of available land. It is also possible to move the Bass Strait trade elsewhere within the Port of Melbourne. The older sections of the port upstream of the West Gate Bridge may be less used in future due to constraints on ship size imposed by the West Gate Bridge and Yarra Channel.
Infrastructure Victoria Second Container Port Advice – Evidence Base59

For efficient supply chains to Tasmania the Bass Strait terminal would ideally to be located close to Melbourne’s distribution centres and the international container port. As the ships used on the Bass Strait trade are much smaller than international container ships this trade is well suited to relocation up the river at the Port of Melbourne.
Car carriers, the ships used by the automotive trade, are large vessels with a substantial air draught. Car carriers visiting Melbourne are within metres of the air draught limit of the West Gate Bridge. If the size of car carriers visiting Victoria in the future increases, relocating the automotive terminal upstream of the West Gate Bridge may not be viable. This will need future assessment of the size of the car carrier fleet at the time of any relocation decision.
The Port of Geelong or the Port of Hastings may be viable options for the automobile trade. Further work would be required to understand the feasibility, cost, economic and environmental impacts of each site before a final decision is made.
The Port of Portland is not considered as a viable option for either trade because of the lack of available land and its distance from Melbourne.
Figure 20. Webb Dock layout and possible capacity enhancement measures
Infrastructure Victoria Second Container Port Advice – Evidence Base60

Source: Adapted by Infrastructure Victoria from GHD, Infrastructure Victoria Second Container Port Advice – Estimated Capacity of the Port of Melbourne, 2017
We have identified a possible sequence of enhancements, and an investment pathway, to reach a theoretical capacity of about 9 million TEU per year as shown in Figure 22. This is a theoretical exercise and is not the only plausible sequence.
Figure 21. Possible capacity enhancements for berth, yard and landside at Webb Dock
Source: GHD, Infrastructure Victoria Second Container Port Advice – Estimated Capacity of the Port of Melbourne, 2017
Figure 22. Theoretical sequence of possible capacity upgrades at Webb Dock
Source: GHD, Infrastructure Victoria Second Container Port Advice – Estimated Capacity of the Port of Melbourne, 2017
Which technical reports should I look at for more information? GHD, Infrastructure Victoria Second Container Port Advice – Estimated Capacity of
the Port of Melbourne, 2017
Infrastructure Victoria Second Container Port Advice – Evidence Base61

AECOM, Infrastructure Victoria Second Container Port Advice – Navigation Study, 2017
Jacobs, Infrastructure Victoria Second Container Port Advice port landside transport modelling, 2017
Deloitte, Infrastructure Victoria Second Container Port Advice container trade forecasts for Victoria, 2017
QUESTIONS Can you identify other possible capacity improvements at the Port of Melbourne? Do you have any feedback on the possible capacity improvements we have
discussed? What would be the impact of the proposed relocation of Bass Strait and automotive
trades from Webb Dock if required to enable an increase in international container capacity?
Environmental and social considerations
Why is this important?Considering the social and environmental impacts of increasing capacity at the Port of Melbourne, alongside the economic costs, is critical to ensure our advice is comprehensive and balanced.
We recognise this is a significant issue for nearby communities, which was reflected in the submissions we received on our September 2016 discussion paper Preparing advice on Victoria’s future ports capacity.
SocialThere are several social factors related to increasing Port of Melbourne capacity. These factors are not hard constraints on development, but should be considered, assessed and potentially mitigated as part of any future development. We recognise that if social factors are not mitigated or managed appropriately, they may influence a decision about whether to increase capacity at the Port of Melbourne or invest in a second port.
Traffic amenity and healthWithout significant investment in landside transport networks, the Port of Melbourne operating at 2-5 times its existing capacity would place significant pressure on transport infrastructure and reduce amenity for those living near the port. We heard during consultation that some local residents feel the Port of Melbourne’s operation is not complementary with surrounding land uses, and has a social impact on nearby residents. The Port of Melbourne generates significant truck traffic, with close to 90 per cent of containers entering or leaving the port on trucks. Trucks can impact on residential areas through noise and vibration, the potential health impacts of diesel fumes, and safety concerns about heavy vehicles driving on suburban streets.
Infrastructure Victoria Second Container Port Advice – Evidence Base62

The main interaction between port-related trucks and residential areas is in the inner west. As the international terminal container at Webb Dock becomes busier there could be more interaction between trucks and residential areas around Port Melbourne.
In the west, some truck traffic travels through residential areas in Footscray, Yarraville and Seddon to access transport yards and empty container parks in the inner west. There are increasing competing land use demands between the Port and residential uses. Both have been there for over 150 years and have developed together, but it is not sustainable to substantially increase the number of trucks servicing the Port without addressing these land use issues.
The Environment Protection Authority measured major air pollutants associated with motor vehicle emissions on Francis Street, Yarraville in 2013. The final report of this monitoring program indicates the air quality and noise levels in Francis Street are worse than surrounding areas.
Increasing rail mode share may be part of the solution, but even 30 per cent rail mode (an aggressive target) will still not stop an increase in Port capacity from also increasing truck numbers.
Land use and community acceptanceThe Port is surrounded by a mix of industry, parkland and increasingly residential and commercial areas, shown in figure 23. Increasing densification, urban renewal and changing demographics surrounding the Port may, in time, lead to increased community advocacy to reduce port activities or to relocate the Port.
Expanding Port of Melbourne container capacity is not expected to require an increase of the Port’s footprint on land except for the possible reclamation at Webb Dock South. New and upgraded transport links, however, could directly impact on surrounding areas by reducing the amenity of adjacent properties though noise, pollution, or reduced community connections (i.e. form a barrier through the middle of a community).
Visual amenityThe possibility to extend Webb Dock East 750 metres south into Port Phillip Bay is the enhancement likely to have the most visual amenity impact. The extension would be visible on the eastern foreshore of the Bay from Sandridge to St Kilda. It would also be visible from the Williamstown foreshore and obscure the view of the city from Gem Pier and Commonwealth Reserve.
Changes to port activities within the existing port footprint are not likely to have major visual impacts on surrounding areas.
Infrastructure Victoria Second Container Port Advice – Evidence Base63

Figure 23. Port of Melbourne surrounding land use
Source: Prepared for GHD for Infrastructure Victoria based on VicMap planning zones data, 2017
Infrastructure Victoria Second Container Port Advice – Evidence Base64

HeritageThere is low potential for Aboriginal or historic heritage to present a major constraint to port development due to the significantly disturbed nature of areas around the Port of Melbourne.
EnvironmentalKey for any development of the Port, in particular the extension of Webb Dock to the south, are:
impact on terrestrial and marine environments through direct habitat loss or indirect effects such as turbidity from dredging
management and disposal of potentially contaminated sediment dredged from the Yarra or Webb Dock.
The Channel Deepening Project and Port Capacity Project successfully managed these risks and provide a precedent for how these issues could be managed for any future development. This includes existing capacity within dredge material disposal grounds within Port Phillip Bay. As a result, these issues are unlikely to present a major constraint on further development at the Port.
We acknowledge that noise and air quality issues need to be considered as part of any increased capacity at the Port of Melbourne, and we have considered them as part of our discussion on social amenity on page 64.
QUESTIONS Do you think we have correctly identified the environmental and social
considerations?
Which technical reports should I look at for more information? GHD, Infrastructure Victoria Second Container Port Advice – Environment & Social
Advice, 2017 Infrastructure Victoria consultation summary paper, 2017
Triggers to invest in a second container port
Why is this important?We have discussed enhancements that could increase the capacity of the Port of Melbourne. We also need to consider any other factors which could trigger an investment in a second container port rather than completing all of the Port of Melbourne capacity enhancements.
Considering all of the economic, social and environmental reasons that influence where we should invest in second container port capacity is important to make sure we provide comprehensive advice to the Minister in May.
Infrastructure Victoria Second Container Port Advice – Evidence Base65

Possible triggersIt is technically possible to significantly increase Port of Melbourne capacity, perhaps by four or five times. Potential capacity enhancements when considered in the context of commercial, transport network, environmental and amenity factors provide a view on when it may be more practical to create additional port capacity at a second container port.
Expansion is economically inefficient – significantly increasing Port of Melbourne capacity may cost more, for each additional TEU, than building capacity at Bay Westor Hastings. We are undertaking modelling to assess when the tipping point might occur, which will be released as part of our final advice to the Minister in May.
Ship size – if ship sizes grow faster than expected then Swanson Dock may struggle to remain competitive with Webb Dock. Swanson Dock is constrained by the height of the West Gate Bridge, the Yarra Channel, and the size of the turning basin and the width of the dock.
Transport network impacts – key intersections near the Port may become so inefficient that the ultimate technical capacity of the Port may be impossible to achieve. Freight vehicles are less than 20 per cent of metropolitan traffic, of which port-related trucks are a fraction. Commuter and other freight growth may create too much congestion for port-related freight networks to work efficiently. We are undertaking modelling to assess the impact of congestion, which will be released as part of our final advice to the Minister in May.
The opportunity cost of alternative land use – as Melbourne’s population increases, the Port of Melbourne and surrounding land may become increasingly valuable for commercial or residential redevelopment. There are a number of central city redevelopment sites identified in Plan Melbourne, the Government’s strategic planning document. These sites include completing Docklands, Fishermans Bend Urban Renewal Area, City North, E-Gate, Arden-Macauley, the Dynon corridor and the Flinders Street to Richmond Station corridor. Fishermans Bend alone is anticipated to accommodate 80,000 people and provide 60,000 jobs by 2050. In total, the urban renewal areas already under consideration are likely to provide sufficient residential and commercial land in the vicinity of the central city for many decades, which is likely to reducethe pressure to redevelop the Port of Melbourne land.
Ability to achieve a return on investment – investors need to consider whether there is sufficient time for the Port operator and stevedores to achieve a return on investment, or the government to release the benefits identified in a cost benefit analysis that makes increasing capacity at the Port of Melbourne worthwhile. Making a substantial investment is less attractive if the Port is unlikely to operate long enough to generate enough revenue to cover project costs or deliver on the anticipated benefits identified in a cost benefit analysis. If the Port of Melbourne eventually moves completely, major investments close to that point are unlikely to make commercial sense, so will potentially bring forward the investment in a second port.
Social amenity – The possibility of the Port of Melbourne operating at 2-5 times its existing capacity would place significant pressure on transport infrastructure and reduce amenity for those living near the port. If not managed appropriately, the negative congestion, noise and
Infrastructure Victoria Second Container Port Advice – Evidence Base66

air quality issues of port-related truck traffic may influence the decision about when to invest in a second port.
QUESTIONS Are there any other factors that could trigger investment in a second container port?
Evidence for where a second container port should be locatedThe Special Minister of State requested that Infrastructure Victoria provide advice on the optimal location of a second container port, and under what conditions, specifically identifying the suitability of sites at Bay West or Hastings.
All the evidence we have gathered is for comparison purposes and is at a strategic level based on the best available information. In order to compare Bay West and Hastings as potential locations for a new port it was necessary to develop a concept design for each site. If the government chose to build a new port at either Bay West or Hastings, it would complete significant additional work to fully develop a preferred option.
For both sites, we investigated what it would take to develop and operate the port, from deep water in Bass Strait, through to existing and planned land transport links outside the port gate. For each site we have examined:
port location, taking into account surrounding land use, social and environmental considerations
channel design dredging required to create channels, swing basins and berths reclamation – the creation of land in areas that are currently water in order to locate
container terminals and port facilities terminal design and configuration terminal operations transport connections beyond the port gate potential environmental and social impacts, and approvals risk.
We estimated the capital and operating costs of the two port concepts in line with the Department of Treasury and Finance’s high value/high risk guidelines. The guidelines set out a four stage process for approving projects with a total estimated investment of over $100 million. The first stage of the guidelines, ‘conceptualise’, require cost estimates to be made within an order of magnitude of -40/+60. This order of magnitude has been applied to our cost estimates and means the actual cost could be between 40 per cent less or 60 per cent more than our cost estimate. This certainty range is commonly accepted practice for our level of study.
We recognise that these estimates are high level and would need significant re-examination prior to starting a project. We have used the same methodology for developing cost estimates for expansions to the Port of Melbourne, and building a new port and the
Infrastructure Victoria Second Container Port Advice – Evidence Base67

necessary complementary infrastructure at either Bay West or Hastings, and we are confident these cost estimates are robust enough to be used for comparison.
Why have we chosen a total number of 9 million TEU?We have developed concept designs for a second port at Bay West and Hastings with an ultimate capacity of 9 million TEU, which can be delivered in three stages: 3 million, 6 million and 9 million.
9 million TEU is a very large port for Australia – today, the Port of Melbourne handles about 2.6 million TEU and all Australian ports handle about 8 million TEU in total.
We think 9 million TEU is sufficient for detailed planning, because it is likely to meet Victoria’s container demand for a long time. We also chose this number because we think it most likely the decision to invest in a second port will be as part of a gradual shift of international container capacity away from the Port of Melbourne.
We don’t know what future technology will mean for the freight industry – how much more manoeuvrable ships will be, or whether some disruptive technology will fundamentally change land or sea freight. We think planning for a capacity of 9 million TEU is sufficient to provide future decision makers with flexibility.
Even so, we will consider the ability for either location to expand to become much larger, perhaps handling 12-15 million TEU.
Second port design assumptionsFor each site we assume the port:
is an origin/destination port, rather than a transhipment port. The Port of Melbourne operates as a origin/ destination port, which is unlikely to change
has a ‘land-backed quay’ – the berth, container stacks and transport connection are all together
has a customs or quarantine facility.
We also made a number of assumptions related to terminal design and operation, road and rail transport access, and supply chains.
Terminal design and operationTo have an ultimate capacity of 9 million TEU, the port needs a quay line length of between 4-4.25 kilometres; a terminal immediately behind the quay line 600 metres deep to accommodate the container stacks, truck loading and rail terminal; and an area of about 240 hectares to be able to hold 18,000 TEU in container stacks. The GHD Estimated capacity at the Port of Melbourne report describes our planning benchmarks in more detail.
The port terminal with all the elements described above can be located on: land on the coast, on reclaimed land built out from the coast, or on an island detached from the coast with transport links back to land.
Infrastructure Victoria Second Container Port Advice – Evidence Base68

The Port of Melbourne is a historic river port with most wharves and terminals located along the banks of the Yarra River or indented basins such as Swanson Dock. New ports look quite different to this with terminals more commonly located on reclamations built out from the coast or on detached islands. The benefit of these arrangements are lower dredging volumes and the size of ships visiting the port is not constrained by the river or basin width.
A good example of the island terminal arrangement is Fisherman Island in the Port of Brisbane which accommodates three container terminals as well as coal, grain and automobile terminals. The island is connected to the mainland by a four lane road bridge and two track rail bridge. Khalifa Port in Abu Dhabi is a recent example of a port constructed off shore from dredge material and connected to the mainland by a bridge.
Webb Dock and London Gateway are examples of ports that are built out from the shore and connect directly to the land.
Transport access
RailRail freight access is a critical requirement for a second container port at either Bay West or Hastings. As roads become more congested, it will be important to movea proportion of import containers out of the port by rail. Rail access is also critical for exporters in Victoria’s regional areas to make sure they continue to have efficient access to international markets.
Rail marshalling yards – efficient rail access requires a rail marshalling yard near or at the port to break up and assemble long regional and interstate trains. Our rail marshalling yards are designed to accommodate regional trains between 1,200 metres and 1,500 metres which deliver exports to the Port and may grow to up to 1,800 metres long to allow for interaction with interstate trains. The marshalling yards will also be able to accommodate metropolitan freight trains starting at about 600 metres, and contemplating future lengths of as long as about 900 metres. These specifications are consistent with ongoing planning for the Melbourne Intermodal System, designed to move rail freight around metropolitan Melbourne to terminals in the west (Altona and Truganina), north (Somerton) and southeast (Lyndhurst). For planning purposes, the upper level of mode share for the Melbourne Intermodal System is 30 per cent on rail.
On-dock rail terminal – we designed both ports with an on-dock rail terminal, capable of handling containers equal to a 30 per cent of mode share, or about 3 million TEUper year once the port reaches an ultimate capacity of 9 million TEU. To achieve this, each port design includes a six-track rail terminal 100 metres wide, running the length of the port terminal.
RoadMoving containers in and out of the port by truck is likely to be the dominant transport mode for the foreseeable future, due to cost-effectiveness and flexibility. We have designed both ports with the capacity to handle a 90 per cent road mode share out of the container terminal ports at each stage.
Infrastructure Victoria Second Container Port Advice – Evidence Base69

Environmental and social impactsFor each site we have undertaken a review of the environmental and social values, focusing on the key differentiators in environmental value and impact between the two sites.
Which technical reports should I look at for more information? Infrastructure Victoria Second Container Port Advice – Concept Options – Bay West
and Hastings
Hastings port concept
Why is this important?To compare the Bay West and Hastings locations, we had to develop a concept design for a port at each site. Based on the best available information, we have adopted a port terminal to the north of Long Island Point. Our concept, described in more detail below, has been designed at a strategic level, and is not the only possible concept for a container port at Hastings. Should the government decide to build a second container port at Hastings, significant further work would need to be completed to evaluate and recommend a design that best responds to the conditions and objectives at the time.
Context
HistoryWestern Port has been used for port-related activities since the early 1900s. The town and port of Hastings are located in the North Arm on the western side of Western Port, about 60 kilometres south-east of Melbourne. The commercial Port of Hastings was developed in the late 1960s and early 1970s to export oil from Bass Strait oil fields. At the time, the government of the day identified and zoned further land in Hastings for port-related industrial uses, to preserve the state’s ability to further develop the port at Hastings. This land is reserved as ‘Special Use Zone 1’ (SUZ1) in the local planning scheme, and covers about 3,500 hectares. SUZ1 is divided into two areas,as shown in figure 24:
about 3,000 hectares north of Long Island Point about 500 hectares at Crib Point.
As a result of the land set aside in the 1970s, the Portof Hastings has been considered the possible location for a second container port for a number of years, appearing in several government documents, including the Port Strategic Framework (2004), Victorian Freight and Logistics Plan (2013), and Plan Melbourne (2014).
The Port of HastingsThe Port of Hastings does not currently handle any container trade. The Port is an important asset for Victoria’s import and export of bulk liquid commodities including refined fuel, oil and gas. The Port receives about 100-150 vessels each year. The Port’s bulk liquid capacity is
Infrastructure Victoria Second Container Port Advice – Evidence Base70

significantly under- used. During the peak of oil exports in the 1970s and 1980s the Port accepted over 600 ship visits a year.
Existing port operations are spread over four areas, across 8 kilometres of coastline, as shown in figure 24:
Long Island Point hosts one bulk liquid berth, used by Esso to export a proportion of the crude oil and gas from its platforms in the Bass Strait. The remaining crude oil is transferred to the Altona and Geelong Refineries via the Western Port – Altona – Geelong (WAG) pipeline. Trucks transport the remaining LPG for domestic consumption. A separate pipeline transfers the ethane to chemicals industries in Altona.
The steel producer, BlueScope, is located to the north of the Esso plant at Long Island Point and has one general cargo berth used to export steel product. There is one disused roll-on/roll-off berth, previously used to bring in steel product from the BlueScope foundry at Port Kembla.
Stony Point caters for tugs, passenger ferries, naval training vessels, the fishing industry and port administration and services.
Crib Point is the location for two bulk liquids berths (one inactive) operated by United Petroleum, used to import refined petroleum products (petrol, diesel). The products are piped to United’s Long Island Point terminal for distribution to its retail network throughout Victoria.
Stony Point Jetty, Crib Point Jetty and Long Island Point Jetty are owned by the State of Victoria through the Port of Hastings Development Authority. The Port of Hastings Development Authority is a public entity established under the Transport Integration Act 2010 (VIC), commencing operations on 1 January 2012. The land adjoining the State owned jetties is Crown land vested in the Port of Hastings. BlueScope Steel own the steelworks jetties and adjoining land. The Victorian Regional Channels Authority (VRCA) is responsible for port waters.
Hastings has the deepest channels of all the Victorian commercial ports at 14.8 metres. The large tidal range in Western Port further increases the size of ships that can access the port using tidal assist – transiting the channel at high tide. Hastings can take ships larger than all the other Victorian commercial ports.
The biggest ships to visit Victoria were bulk liquid tankers that visited Hastings in the 1980s: the Amazon Maru called in November 1987, carrying 132 kilotonnes of cargo, had a
Dead Weight Tonnage of 165 kilotonnes, 300 metre LOA and 14.9 metre draught. the BP Achiever called in January 1986, and had a 15.5 metre draught.
Current useAs well as the existing port and industrial facilities a variety of land uses and protected areas around Hastings constrain port development, as shown in figure 24:
HMAS Cerberus, a Royal Australian Navy training facility occupies a large parcel of land from Stony Point to Sandy Point
an unused refinery site within SUZ1 at Crib Point
Infrastructure Victoria Second Container Port Advice – Evidence Base71

the Esso Plant, the BlueScope Plant and the United Terminal, all at the southern end of SUZ1 to the north of Long Island Point
agriculture and a small number of residences use the balance of SUZ1 north of Long Island Point
residential or rural-residential areas including the townships of Hastings, Tyabb, Bittern, Cribb Point, Somers and Balnarring
two boat harbours for recreational and fishing boats at Yaringa and Hastings coastal reserves extending from Stony Point to Hastings and around Yaringa a Marine National Park north of Yaringa and on the north side of French Island.
Figure 24. Existing Port of Hastings and surrounding land use
Infrastructure Victoria Second Container Port Advice – Evidence Base72

Source: Adapted by Infrastructure victoria from GHD, Infrastructure Victoria Second Container Port Advice – Concept options – Bay West and Hastings, 2017
Site and concept selection
Site selectionThe site and concept selection process for Hastings involved a desktop review of previous studies including the Port of Hastings Container Expansion Project (2014), Victorian Freight and Logistics Plan (2013), and the Port Strategic Framework (2004).
Our site selection focused on the area between Stony Point and Yaringa on the western shore of the lower North Arm of Western Port. This area contains the existing port facilities, including shipping channels, and land zoned for port development.
Two parcels of land zoned SUZ1, at Crib Point and north of Long Island Point, present the best opportunities for port development. We think the land north of Long Island Point more suitable for a port development because:
more land is available, allowing room for port-related industrial and logistics development and buffers from residential areas and popular coastal reserves
transport corridors would be about 10 kilometres shorter and would not pass through or around the townships of Hastings, Bittern or Crib Point.
The main advantage of the Crib Point site is that it is closer to deep water and would require less dredging, however there is much less land available, and the potential site is much closer to residential areas.
We did not consider south of Stony Point suitable because of limited land availability and the exposure of this part of Western Port to ocean waves. We did not consider past Yaringa suitable because the upper North Arm of Western Port is very shallow and contains significant areas of valuable habitat including two marine national parks.
Further information on our assessment of different port locations at Hastings is provided in the ‘Concept options’ technical report.
Concept selectionAt our preferred location north of Long Island Point, we considered two container port options; a ‘dig out’ option and an ‘along shore’ option, shown in figure 25. Both options have the same stage one with a terminal and quay running north–south in the area between Long Island Point and BlueScope. The two options differ after stage one:
Infrastructure Victoria Second Container Port Advice – Evidence Base73

Along shore: subsequent stages run north–east from BlueScope with the terminal on reclaimed land detached from the coast. This option aims to minimise dredging volumes.
Dig out: an indented dock basin is cut into the land north of BlueScope. This option aims to minimise footprint on intertidal and marine habitat (but still has a substantial footprint). This option requires a lot more excavation, which increases cost. The indented dock is less flexible for future operations than the strait quay, especially to accommodate ships larger than currently exist.
The Port of Hastings Container Expansion Project (2014) considered several variations of the along shore option, with the terminal positioned either further in or further out from the land, in an attempt to find solutions that minimise both cost and footprint on sensitive habitat. While some of the further out variations have less direct impact on seagrass in the footprint, the seagrass and intertidal habitat would still be at high risk from indirect impacts related to hydrodynamic changes and turbidity from dredging. No solution has yet been identified that avoids a substantial impact on the sensitive habitat and a large footprint on the Ramsar site. These variations all require a higher volume of dredging and/or reclamation, and hence have higher costs and increased dredging-related environmental impacts during construction.
Both options described above and numerous variations are technically possible. We have selected the along shore option as shown, because it is more cost effective, and has more flexibility for terminal operation and accommodating larger ships.
More information comparing these options is available in the GHD Concept Options – Bay West and Hastings report.
Figure 25. ‘Along shore’ and ‘Dig out’ concepts for Hastings
Infrastructure Victoria Second Container Port Advice – Evidence Base74

Source: GHD, Infrastructure Victoria Second Container Port Advice – Concept options – Bay West and Hastings, 2017
Design vessel
The Hastings concept has been developed for an 18,500 TEU reference vessel, with dimensions based on the Maersk shipping line’s ‘triple E’ class, one of the largest container ships in the world today. The vessel used was the MV Maersk McKinney Moller, triple E class, 18,270 TEU capacity, 400 metres LOA, 59 metre beam, and 14 meter sailing draught.
The western entrance to Western Port is wide and deep enough that only minor modi cations are necessary to allow entry into Western Port of the largest container vessels in the world today (ultra large container ships, 18,500+ TEU), or even larger vessels.
At the entrance to the Western Port, dredging of about 2.6 million cubic metres is required to allow large ships to travel up the channel from around Sandy Point to the proposed site at Long Island point. Geotechnical investigations in 2014 identified a low risk of rock in this area and determined sediments could be easily dredged. This means there is no structural limit to the channel size that can be created, although the incremental environmental impacts of dredging would need to be assessed.
The ability to accept very large vessels is one of the key advantages of the Hastings option – it is effectively unconstrained with respect to the channels that can be created to accommodate increases in ship size.
We have also considered a second scenario of a slightly smaller, 14,000 TEU ship, to allow a direct comparison smaller ship are marginally lower, but all other elements of the port are the same.
Table 9 shows the vessel characteristics for the two scenarios we modeled.
Table 9. Design vessel characteristics for Hastings and Bay West
SCENARIO 1: 14,000 TEU – Constrained by existing Port Phillip Heads
SCENARIO 2: 18,500 TEU – Port Phillip Heads widened, not deepened
14,000 TEU New Post Panamax Based on MCS Daniela
366 metre LOA51.2 metre beam13.5 metre sailing draught
18,500 TEU Ultra Large Container Ship Based on Maersk, ‘triple E’ vessel
400 metre LOA59 metre beam14.0 metre sailing draught
Source: Infrastructure Victoria 2017
Hastings concept design
Terminal locationThe proposed location in the upper North Arm of Western Port is characterised by a deep channel (naturally 10 to 15 metres deep) and extensive shallows and intertidal areas. The
Infrastructure Victoria Second Container Port Advice – Evidence Base75

quay line is positioned on the edge of the deep channel to minimise both dredge volumes in front of the quay and reclamation volumes for the terminal behind the quay.
Stage one of the terminal and quay is partially built on the old Tyabb reclamation and partially on newly reclaimed land running north–south in the area between the Long Island Point and BlueScope jetties. The quay and terminal is attached to the land and has a quay length of about 1.5 kilometres, a land area of about 90 hectares and the capacity to handle about 2.7-3 million TEU per year.
Stages two and three extend the terminal and quay further north from BlueScope. In the middle of stage two the quay line angles to the northeast and continues in a straight line approximately parallel to shore. The terminal follows the quay line on a 600 metre wide reclamation separated from the shore. The port concept at Hastings does not impact the industrial facilities of either BlueScope or Esso. The Port needs to be designed in a way that maintains suitable marine access for both sites. The level of service they have will remain but the physical assets may change.
The full development has total quay length of about 4.25 kilometres, covers 250 hectares and has the capacity to handle 9 million TEU per year. Figure 26 shows all stages of the development.
Infrastructure Victoria Second Container Port Advice – Evidence Base76

Figure 26. Hastings concept – terminal and port environs
Source: Adapted by Infrastructure Victoria from GHD, Infrastructure Victoria Second Container Port Advice – Concept options – Bay West and Hastings, 2017
Transport corridorsRoad and rail transport corridors to the port follow the Western Port Highway north to join the South Gippsland Freeway (road) and Cranbourne line (rail) at Lyndhurst, just south of Dandenong.
We considered a corridor alignment running west to join with Peninsula Link. This is possible for the road connection, but was not suitable because the area is too hilly for an efficient rail
Infrastructure Victoria Second Container Port Advice – Evidence Base77

connection, and there are significant benefits from a combined corridor having less footprint and fewer impacts.
RoadAn upgrade of the north part of the Western Port Highway, north of Cranbourne-Frankston Road, to freeway standard is already planned due to population growth in the next few decades. The Western Port Highway south of Cranbourne- Frankston Road will need to be progressively upgraded to freeway standard, including service roads, to serve port traffic as the Port at Hastings expands.
RailThe immediate rail link from the port to the existing network involves a rail terminal up to 5 kilometres long positioned in the northern part of SUZ1 and a dual track along the median of the upgraded Western Port Highway to join the Cranbourne Line at Lyndhurst, just south of Dandenong.
Beyond Lyndhurst there is an issue with limited capacity for freight on the existing network. Many of the import containers would need to travel across Melbourne to destinations in the north and west of the city, and most of the export containers come on rail from the west and north of Victoria, so need to cross the city in the other direction to reach the port.
The Melbourne–Dandenong–Cranbourne rail corridor, primarily used for metropolitan and regional passenger services, currently has limited capacity for additional freight movements, primarily in off peak times. It is expected that this capacity will reduce in future as other traffic increases and be effectively zero by about 2040.
To accommodate a 10 per cent rail mode share at Hastings an additional one track with passing loops would be required from Dynon, through Melbourne, to Dandenong and Lyndhurst. To accommodate the target 30 per cent rail mode share an additional two tracks would be required. This possible upgrade was generally described in Infrastructure Victoria’s 30-year strategy as ‘Regional Rail East’, with commentary that this is a particularly high cost solution and further network planning is required.
The main driver for Regional Rail East is the freight capacity required for a port at Hastings. There would also be the additional benefit of more access for regional train services from Gippsland. As a primary driver of requiring a new connection, the cost of providing rail to Hastings from the city is part of our Hastings concept.
The corridor is very constrained and adding additional tracks would be expensive and disruptive:
East of Oakleigh: the corridor has similar complexity of the brown field construction of Regional Rail Link.
Oakleigh – Caulfield: build new tracks between elevated rail lines, demolish stations on the inside of tracks and rebuild them on the outside of tracks.
Caulfield – South Yarra: modify heritage stations for one track or tunnelling for two tracks.
Infrastructure Victoria Second Container Port Advice – Evidence Base78
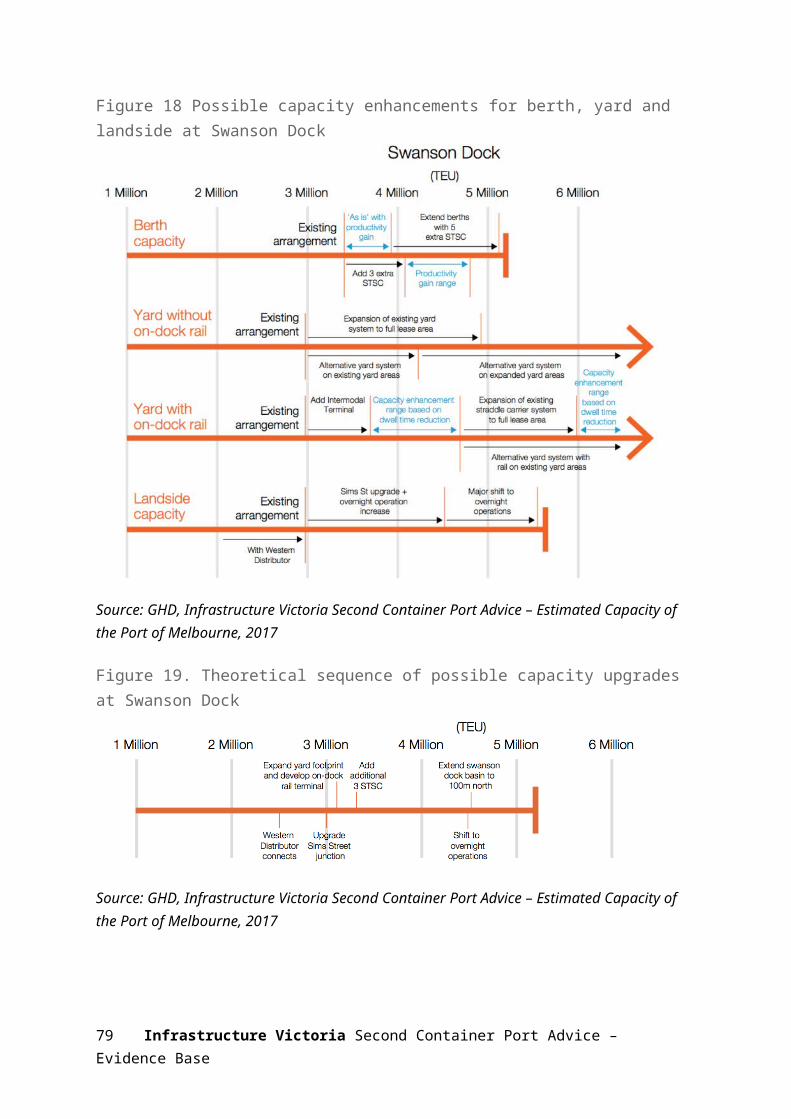
Through the CBD: enlarge the viaduct between Flinders Street and Southern Cross to add tracks.
Regional Rail East is a very complex proposal and there are several possible operating concepts. One of either the Frankston or Dandenong passenger services would need to move underground to free up space for two new freight tracks on the surface. A major difference in operating concepts is whether any underground stations are required. A concept without underground stations would cost about $5 billion but a concept with new underground stations would cost about $6.5 billion.
The operational concept selected would depend on conditions at the time. Given that Regional Rail East may not be required for more than 40 years, conditions and cost at the time of any construction may be very different from today. We have selected the simplest operating concept, without underground stations, as it is suitable for a strategic assessment of this type. There is significant uncertainty when looking at an asset of this type so far into the future that has to interact with a dynamic public transport system.
We considered two alternative options for a freight rail corridor across the city, but neither presents a better option than Regional Rail East:
The Frankston line: a very constrained corridor, which faces the same challenges as the Dandenong corridor from Caulfield to Dynon.
A new line following East Link and the Eastern Freeway: a much longer route which requires significant tunnelling. Estimated to cost four times as much as Regional Rail East.
Refer to the Raylink Consulting Regional Rail East and Hastings Rail Link and GHD Concept Options – Bay West and Hastings reports for more information on all of the options we considered to provide the necessary rail access to Hastings.
Port PrecinctThere are a number of port services that must be located close to the terminal, such as maintenance, administration and staff facilities, and customs and quarantine stations. There is enough room for all these facilities within the 3,000 hectares reserved as ‘Special Use Zone 1’ (SUZ1) north of Long Island Point. As described previously, this area has been reserved for port use or industrial use related to the port since the 1970s.
The SUZ1 area also has ample room for a port-centred logistics precinct at Hastings, providing warehousing, distribution centres, empty container parks, as well as broader industrial development that could benefit from proximity to the port.
The size of SUZ1 also allows for the necessary buffers from the coastline and residential areas, and the protection of pockets of remnant vegetation that exist within the zone.
Infrastructure Victoria Second Container Port Advice – Evidence Base79

Figure 27. Existing channels at the Port of Hastings
Source: AECOM, Second Container Port Advice – Navigation Study, 2017
Channel, swing basins and berthsAccess to the Hastings port location is via the existing Western Channel and North Arm Channel. There is also an anchorage in the East Arm north of Phillip Island. The current configuration of channels in Western Port is shown in figure 27.
Channels – previous navigation simulations undertaken by the Port of Hastings Development Authority have shown that the channels into the Port of Hastings only need minor modifications to accept the design vessel of 18,500 TEU. At the entrance to Western Port, the Western Channel needs to be slightly realigned. Over the 30 kilometres of channel
Infrastructure Victoria Second Container Port Advice – Evidence Base80

there is 2.6 million cubic metres of dredging required to make it suitable for ultra large container ships.
Port area – the port area needs a turning basin, so that ships entering the port could be swung around to face seaward with the assistance of tugs before being berthed. The turning basin is positioned in front of the stage one area between Long Island Point and BlueScope. Due to the high tidal currents experienced in Western Port the swing basin needs to be an oval shape, rather than a circle, as the ships will move with the tide as they are swung. Once swung around, ships are berthed in the stage one/ two area or dragged backwards by tugs to berths further north in the stage three area. Proposed swing basins and berth pockets, as shown in figure 26 involve a dredge volume of about 21.6 million cubic metres.
Dredging and reclamation
The total dredging required to the channels and the port area is about 24 million cubic metres. The dredging is split between some minor dredging in the channels and more significant dredging around the port area.
Geotechnical investigations found that the soil profile in the port area consists of a surface layer of soft marine clays over firmer soils consisting of layers of mixed silts, clays and sands. These investigations found no rock at depths that would affect dredging in the port area.
Ideally the material dredged to create the channels and manoeuvring areas would be reused in the creation of the reclamation. Due to the nature of the material to be dredged and constraints of the site this does not seem possible at Hastings. This mean an alternative source of material for reclamation is needed.
A desktop review did not identify any suitable sources of reclamation material in the Hastings area, either onshore or in Western Port, however there is likely to be significant quantities of suitable and accessible sand in Bass Strait.
Under any of the dredging and reclamations scenarios considered at Hastings, excess dredge material would need to be disposed of. No suitable sites for dredge material grounds were identified within Western Port, as most of Western Port is either too shallow or experiences high currents which would remobilise any placed material.
As a result, the dredging and reclamation methodology proposed is to dredge sediments from the port area and take them about 50 kilometres offshore to Bass Strait for unconfined sea disposal. After discharging, the dredger would reload with sand from the seafloor of Bass Strait for the return trip to Hastings, to be used to build the island reclamation.
Although the turnaround time for a dredger traveling 100 kilometres per cycle is long, this method is preferred because it is less risky to build the reclamation out of sand than poor quality silt and clay materials.
The proposed dredge method also seeks to minimise turbidity and environmental impact.
Infrastructure Victoria Second Container Port Advice – Evidence Base81

To construct the reclamation about 5 million cubic metres of soft surface sediment need to be dredged from the reclamation footprint, and about 18 million cubic metres of sand brought in from Bass Strait.
This means the total dredge volume for the Hastings concept is about 47 million cubic metres, made up of 24 million cubic metres for the channels and port area, 5 million cubic metres for the reclamation footprint and 18 million cubic metres for the sand dredged from Bass Strait to build the reclamation.
These dredging volumes are to accommodate a 18,500 TEU ship. About 45 million cubic metres of dredging would be required to accommodate a 14,000 TEU ship.
Staging and constructionThe Hastings concept can be built in a number of stages. We have considered three stages of 3, 6 and 9 million TEU per year for the purpose of comparison with Bay West.
Stage one at Hastings, located between the existing Long Island Point and BlueScope jetties, requires the least dredging and reclamation of all the stages. Significant investment in the road corridor will be required to connect to the existing network at stage one.
Cost estimateWe have prepared a cost estimate for the Hastings concept as set out in figure 28. Some of the elements shown on this figure, such as North-East Link, are not included in the costing. The main driver for building North- East Link is not freight related or due to a port at Hastings. The cost benefit analysis for North-East Link is positive, as discussed in Infrastructure Victoria’s 30-year strategy, before even considering a port at Hastings. We assume it will likely be built independent of the decision on the future port location.
The target accuracy of our cost estimate is -40 per cent to +60 per cent, in accordance with Department of Treasury and Finance’s ‘high value/high risk’ guidelines for the ‘conceptualise’ phase.
Costs are outlined in Tables 10 and 11, and are in 2017 dollars with no allowance for contingency or risk. The cost of land acquisition is not included in the estimates, because our transport corridor design is not sufficiently detailed to allow a robust estimate of how many properties would need to be acquired. This may be significant at Hastings as there is a need to acquire residences within SUZ1 and along the Western Port Highway. Further detail of the cost estimates can be found in the GHD Concept Options – Hastings and Bay West report.
Regional Rail East is included in our cost estimates because we consider the main driver for the project is the freight capacity required for a port at Hastings.
We are still considering when the investment in Regional Rail East would be required. The timing will depend on the capacity of the existing network when stage one is developed and the extent to which the Port of Melbourne is operating with rail access at that time.
Infrastructure Victoria Second Container Port Advice – Evidence Base82

For now we have assumed that the very high cost of Regional Rail East and the rail corridor will be delayed until stage 2. However, if rail access is a priority when the port is developed these costs may need to be brought forward to stage 1.
Figure 28. Hastings concept, elements included in costing
Infrastructure Victoria Second Container Port Advice – Evidence Base83

The cost estimate for the Hastings concept includes: dredging of channels and manoeuvring areas reclamation to create land for container terminal construction of quay and container terminal road corridor to the Western Port Highway and upgrade of the Western Port Highway
to the Cranbourne-Frankston Road two track rail corridor to Lyndhurst Regional Rail East – two new freight tracks from Dynon to Lyndhurst along the
Dandenong corridor.
Source: Adapted Infrastructure Victoria from GHD, Second Container Port Advice – Concept options – Bay West and Hastings, 2017
Table 10. Cost estimate for Hastings concept 14,000 TEU design vessel ($ millions)
STAGE 1: 3 million TEU
STAGE 2: 6 million TEU
STAGE 3: 9 million TEU
TOTAL
Dredging and reclamation
$625 $693 $477 $1,795
Port terminal and quay
$1,399 $1,190 $837 $3,426
Road and rail connections (to existing network)
$1,032 $1,541 $2,573
Sub total $3,056 $3,424 $1,314 $7,794Regional Rail East (upgrade to network, Dynon to Lyndhurst)
$5,000 $5,000
TOTAL $3,056 $8,424 $1,314 $12,794Source: Adapted by Infrastructure Victoria from GHD, Infrastructure Victoria Second
Table 11. Cost estimate for Hastings concept 18,500 TEU design vessel ($ millions)
STAGE 1: 3 million TEU
STAGE 2: 6 million TEU
STAGE 3: 9 million TEU
TOTAL
Infrastructure Victoria Second Container Port Advice – Evidence Base84

Dredging and reclamation
$692 $709 $486 $1,887
Port terminal and quay
$1,399 $1,190 $837 $3,426
Road and rail connections (to existing network)
$1,032 $1,541 $2,573
Sub total $3,123 $3,440 $1,323 $7,886Regional Rail East (upgrade to network, Dynon to Lyndhurst)
$5,000 $5,000
TOTAL $3,123 $8,440 $1,323 $12,886Source: Adapted by Infrastructure Victoria from GHD, Infrastructure Victoria Second
Potential environmental and social impactsWe have undertaken a desktop review of existing environmental, heritage and social assets, values and uses to identify issues that are likely to be differentiators between the Bay West and Hastings sites. We considered issues identified by our specialist consultants and those raised by community members and stakeholders in the first round of consultations. Our assessment considered the risks posed by the development footprint, construction and operation of the port.
Our assessment is based on available data and understanding of issues. We did not collect any new data for this study. More data collection, better understanding of the issues and more design work to mitigate the identified risks could change the risk profile of the Hastings proposal.
Below we discuss the issues we consider to be major differentiators between the Bay West and Hastings concepts. For more detail on these and other issues considered, and the risk assessment methodology, see the GHD Environment and social advice report.
The footprint of our Hastings concept is overlayed on the key vegetation types and Ramsar site in figure 29, to give an indication of the habitat directly impacted.
Infrastructure Victoria Second Container Port Advice – Evidence Base85

Figure 29. Hastings development footprint overlayed on selected habitat map and Ramsar site
Source: Adapted by Infrastructure Victoria from GHD, Second Container Port Advice – Environment & Social Advice, 2017
Environmental issues – major differentiatorsIn conjunction with our environmental consultants, we assessed the risk of 24 environmental issues, of which seven were assessed as major differentiators between the two locations:
1. SeagrassSeagrass is a cornerstone habitat providing shelter and food for marine animals, plants and some birds. It is listed as a critical ecosystem component of the Western Port Ramsar site.
At Hastings there are high quality seagrass meadows within the port development footprint that would be lost, and other seagrass areas would be at high risk of impacts from turbidity generated during construction.
Infrastructure Victoria Second Container Port Advice – Evidence Base86

2. SaltmarshSaltmarsh is listed as a vulnerable ecological community under the Commonwealth Environment Protection and Biodiversity Conservation (EPBC) Act 1999 and impacts to saltmarsh would also need to be assessed under the Victorian Biodiversity Assessment Guidelines. It provides roosting and foraging habitat for shorebirds.
At Hastings the development footprint contains some areas of saltmarsh and we have assessed the risk of impact as medium.
3. MangrovesMangrove stands on the shoreline provide several environmental services including filtering pollutants, trapping sediments, protecting the shoreline from erosion and providing habitat for a number of species.
At Hastings the development footprint contains some areas of mangroves and we have assessed the risk of impact as low to medium.
4. ShorebirdsThe coastal areas of Western Port are an important habitats for shorebirds that roost and feed in the various habitats of the intertidal zone, including the saltmarsh, mangroves and mudflats.
These habitats are recognised as critical ecosystem components in the Western Port Ramsar site. Port development at Hastings could impact directly on shorebirds through loss of habitat in the development footprint and though disturbance by noise and light associated with construction and operation of the port. We have assessed the risk to shorebirds from the Hastings concept as high.
5. Orange Bellied ParrotThe Orange Bellied Parrot is listed as critically endangered under the Commonwealth Environment Protection and Biodiversity (EPBC) Act 1999 and threatened under the Victorian Flora and Fauna Guarantee Act 1998. The parrot spends most of the year in Tasmania and migrates to southern Victoria for a few months over winter, which it spends in coastal saltmarsh habitat.
Although the Orange Bellied Parrot has not been recorded in the Hastings area for many years, the Hastings concept does impact on the parrot’s potential saltmarsh habitat.On this basis we assessed the risk at Hastings as medium.
6. FishWestern Port has a high diversity of fish linked to habitat diversity and is an important breeding/nursery ground for some recreationally and commercially valuable species. Fish are listed as a critical ecosystem component of the Western Port Ramsar site. Fish may be impacted by habitat loss in the development footprint and by turbidity during construction. We have assessed the risk of impact on fish as high for the Hastings concept.
Infrastructure Victoria Second Container Port Advice – Evidence Base87

7. Blue carbonCoastal and shallow marine vegetation including saltmarsh, mangroves and seagrass are some of the most efficient carbon sinks in the natural world. The carbon captured and stored in these systems is known as ‘blue carbon’. The impact on blue carbon should be proportional to the area of these vegetation types lost in the development footprint.
At Hastings, saltmarsh, mangroves and seagrass are all present within the development footprint and we assessed the risk as high.
Social issues – major differentiators
Land acquisition, land access and impact on surrounding land useThe port terminal at Hastings is remote from residential areas and important community facilities such as parks and reserves. Major impacts on surrounding uses are however expected to arise from the development of the transport corridors.
Upgrade of the Western Port Highway is likely to involve acquisition of land on at least one side of the corridor and have some disruption to residences, businesses and community facilities on both sides of the corridor.
The Port Precinct development within SUZ1 would also require acquisition of land from BlueScope and several smaller land holders, including some residences.
CongestionAlthough port traffic is only a small proportion of metropolitan traffic, any impact on congestion can have a significant impact on the amenity of other road users, especially at a local level near the port. In the next phase of the project we will complete traffic modelling to compare the congestion impacts of expanding container capacityat the port of Melbourne, Hastings or Bay West.
Recreational fishingThe North Arm of Western Port around Hastings is a popular area for recreational fishing and the proposed port expansion footprint at Hastings includes a valued recreational fishing location known as Tyabb Bank.
Currently at the Port of Hastings fishing is allowed in the port waters and the shipping channels (anchoring is prohibited in the channels) but not in the exclusion zones around jetties. If a container port were developed there would be an increase in commercial shipping traffic and the channels would likely become ‘transit only zones’ similar to the channels in Port Phillip Bay where fishing is effectively restricted. Fishing should still be allowed in port waters outside the channels, as it is in Port Phillip Bay. The waterway area that may be lost to fishing due to container port development is estimated at about 2,100 hectares, or 5 per cent of the low tide area of Western Port.
Infrastructure Victoria Second Container Port Advice – Evidence Base88

Aboriginal and historic cultural heritageThere is potential for disturbance of items of Aboriginal cultural significance at Hastings and we assessed the risk as medium. These risks could be managed and we do not consider it a major differentiator between the two sites.
Approvals and offsets
The Western Port Ramsar Wetland – what is it and what does it mean for our assessment?The Ramsar Convention on Wetlands of International Importance is an international treaty providing a framework for the protection of ecologically important wetlands, focusing on wetlands used by migratory birds. In Australia, Ramsar wetlands are managed under the Commonwealth Environment Protection and Biodiversity Conservation (EPBC) Act 1999. Each Ramsar site has an ecological character description which defines the critical ecosystem components and the limits of acceptable change as a basis for management of the wetland.Development of a port within a Ramsar site, or impacting on a Ramsar site, would require approval of the Commonwealth Environment Minister under the Act. The Act requires offsets to mitigate any significant impact to the ecological character of Ramsar sites.
The presence of a Ramsar site does not mean development cannot occur, but it does mean that the development must respond to the Ramsar values and make it more complicated to get a development approved.
The Western Port Ramsar site includes most of the intertidal and sub-tidal area of Western Port, including the proposed terminal and port dredging areas as shown on figure 29.
The critical ecosystem components of the Western Port Ramsar site are: wetland bathymetry geomorphology and sedimentation seagrass saltmarsh significant species (limited to coastal woodlands) waterbirds marine invertebrates fish.
The proposed port at Hastings has the potential to have a significant impact on several of the critical ecosystem components, mainly through direct loss of habitat in the development footprint within the Ramsar site in the order of 10 square kilometres. To gain approval it would be necessary to demonstrate that loss of habitat had been avoided and minimised where possible and residual losses would need to be offset.
We considered several alternative concepts at Hastings with the terminal positioned further out, or with the basin dug into the land, but none of these would avoid a substantial footprint on the Ramsar site.
Infrastructure Victoria Second Container Port Advice – Evidence Base89

ApprovalsWe have reviewed the approval requirements for the Hastings and Bay West proposals, based on current legislation. While the list of approvals required is broadly similar, there are a number of key differences in the complexity of attaining those approvals at either site. We discuss the key differences below. For further information on approvals that could be required refer to the Environment and Social technical report.
Environment Protection (Sea Dumping) Act 1981 (Commonwealth) – disposal of Hastings dredge material and dredging of sand in Bass Strait greater than 3 nautical miles offshore in Commonwealth waters requires approval under this act.
Environment Protection and Biodiversity Conservation Act (EPBC) 1999 – a container port at Hastings would likely be deemed a ‘controlled action’ and thus require approval under the Act due to the potential to impact on Matters of National Environmental Significance, in particular saltmarsh and the Western Port Ramsar site.
OffsetsOffsets are likely to be required under the Environment Protection and Biodiversity Act (EPBC) 1999, due to the impact on the Western Port Ramsar site. Offsets may be required for a number of ecological components and vegetation types including saltmarsh, seagrass and mudflats.
Offsets may also be required under Victoria’s Native Vegetation Framework for clearing of native vegetation, based on assessed risk to biodiversity.
Offsets involve protection or improvement of an area of similar size and value to that impacted by the development. More than 90 per cent of the offsets must be ‘directoffset’ which involve the protection and/or improvement of equivalent habitat. Up to 10 per cent of the offsets can be ‘indirect offsets’ which include targeted research and education. To be acceptable the offset package must deliver an overall conservation outcome that improves or maintains the viability of the aspect of the environment that is protected. For example, if the project required the removal of 3 hectares of mangroves then a direct offset could be revegetation of a 1.5 hectare area with mangroves and protecting a further 2 hectares of existing mangroves.
Potential offsets within Western Port are not readily identifiable, as equivalent habitat is in public parks, reserves or Crown land and therefore already protected. There may be suitable sites for revegetation within Western Port, but more work is needed to identify them.
Creation of new habitat on private land adjacent to the Ramsar site or offsets in other Ramsar sites, such as Port Phillip Bay or Corner Inlet, could be considered but negotiations with the Commonwealth Department of Environment and Energy would be required to determine if these were acceptable.
Where offsets involve revegetation or creation of new habitat the offset needs to be developed in advance of the port development to demonstrate it is effective and sustainable.
Infrastructure Victoria Second Container Port Advice – Evidence Base90

Establishing this type of offset could add additional time, up to several years, to the development timeframe.
Which technical reports should I look at for more information? GHD, Infrastructure Victoria Second Container Port Advice – Concept Options – Bay
West and Hastings, 2017 GHD, Infrastructure Victoria Second Container Port Advice – Environment & Social
Advice, 2017 Cardno, Infrastructure Victoria Second Container Port Advice – Hydrodynamics,
2017 AECOM, Infrastructure Victoria Second Container Port Advice – Navigation Study,
2017 Baggerman Associates, Ports Planning Advice Engineering Services – Dredging and
Reclamation, 2017 Environmental Geosurveys, Infrastructure Victoria Second Container Port Advice –
Geomorphology, 2017 Raylink Consulting, Regional Rail East and Hastings Rail Link – Concept of
Operations Report, 2017
QUESTIONS What is your feedback on the Hastings concept? Do you have information to challenge our findings on the concept design, transport
corridor, channel, swing basins and berths, dredging and cost estimates? Do you think we have accurately assessed the environmental and social factors that
are likely to be differentiators?
Bay West port concept
Why is this important?To compare the Bay West and Hastings locations, we developed a concept design for a port at each site. Based on the best available information, for Bay West we chose an island port terminal to the south of the Werribee River and in front of the 115 East treatment ponds at the Western Treatment Plant. Our concept, described in more detail below, has been designed at a strategic level, and is not the only possible concept for a container port at Bay West. Should the government decide to build a second container port at Bay West, significant further studies and work would need to be done to evaluate and recommend a design that best responds to the conditions and objectives at the time.
ContextThe study area for the Bay West site is on the northwest coastline of Port Phillip Bay between Point Lillias and Point Cook as shown on figure 30. The study area has a number of current and past uses but is less developed than much of the Port Phillip Bay coastline.
Infrastructure Victoria Second Container Port Advice – Evidence Base91

History and current useThe Melbourne Water Western Treatment Plant occupies a significant part of the study area, 10,568 hectares between the Werribee River and Point Wilson. The Plant treats 52 per cent of Melbourne’s sewage (about 500 mega litres per day). The Plant has a mix of conservation ponds and lagoons dedicated to sewage treatment, generally in the eastern half of the site, and agribusiness, generally located in the western and northern part of the site. The entire Plant is included in the Port Phillip Bay (Western Shoreline) and Bellarine Peninsula Ramsar Site. The Plant provides vital sewage treatment services to Melbourne as well as high value habitat for many protected species. One of our key considerations in developing the Bay West concept is to minimise impacts on the Plant’s operations (both current and future) and environmental values.
There are a range of other uses within the study area, as shown in figure 30, including:
Australian Department of Defence site at Point Wilson: the site has been an explosives facility since the early 1960s and covers 325 hectares. The site contains four explosive handling and storage buildings, and a 2.7 kilometre jetty constructed in the late 1950s and used to load and unload explosive ordinance. The jetty is not in use after the Victorian Regional Channels Authority Harbour Master deemed the jetty unsafe.
Point Cook – Royal Australian Air Force Base: the base was the first military aviation base in Australia and features an extensive complex of military aviation buildings. The base is registered on the National Heritage List and houses a Royal Australia Air Force museum.
Werribee Irrigation District: the area north of the Werribee river has been used for irrigated agriculture since the late 1800s. The district is located on the flood plain of the Werribee River and is bounded by the river, Port Phillip Bay, Point Cook and the Princes Freeway.
Residential areas: within or adjacent to the study area are the town of Werribee and suburb of Point Cook, and the smaller communities of Werribee South and Wyndham Cove, all located east of the Werribee River.
Werribee Park Tourism Precinct: an area on either side of the Werribee River south of the Princes Freeway including the Werribee Open Range Zoo, Werribee Mansion, National Equestrian Centre, a winery and golf club.
Werribee River Boat Ramp: a large, multi-lane facility for recreational fishing and boating on the Werribee River at Werribee South.
Avalon Airport: located towards the southern end of the study area, Avalon Airport covers an area of 4,333 acres slightly inland from Port Phillip Bay and was founded by the Commonwealth in 1952. The Commonwealth sold the airport to transport and logistics company Linfox in 1997. The airport hosts domestic commercial flights and holds a biennial air show.
Quarry: the Mountain View Quarry is a basalt quarry between the old Cheetham Saltworks, Avalon Airport and Point Wilson. The quarry is operated by the Barro group.
Infrastructure Victoria Second Container Port Advice – Evidence Base92

The Spit Wildlife Reserve: located on the coast between Point Wilson and Kirk Point, the reserve has high environmental value intertidal sand spits, saltmarsh and mudflats. It is used by migratory birds and is part of the Port Phillip Bay (western shoreline) and Bellarine Peninsula Ramsar site.
Point Lillias: a thin peninsula at the very south of the site which abuts the former Cheetham Saltworks. Point Lillias is listed as a wetland of international importance under the Ramsar convention as part of the Port Phillip Bay (western shoreline) and Bellarine Peninsula Ramsar site.
Infrastructure Victoria Second Container Port Advice – Evidence Base93

Figure 30. Bay West study area and surrounding land use
Source: Adapted Infrastructure Victoria from GHD, Second Container Port Advice – Concept options – Bay West and Hastings, 2017
Site and concept selectionThe Bay West port location has not previously been precisely defined.
Infrastructure Victoria Second Container Port Advice – Evidence Base94

We undertook a two-stage site selection process within our study area to select a representative Bay West location and concept to compare with the Hastings port concept.
The first stage was a broad desktop review of the major technical, land use, environmental and social considerations within the study area.
Our initial assessment ruled out the area east of the Werribee River because of: the difficulty of locating road and rail corridors through this area the proximity of residential areas such as Point Cook, Wyndham Cove and Werribee
South valued social/recreational assets such as the Point Cook Coastal and Marine
Reserve, Wyndham Harbour, Werribee South Boat Ramp and the foreshore between Werribee South and Point Cook Royal Australian Air Force base
incompatible existing land uses such as the Werribee Irrigation District, Wyndham Cove, and the Werribee Park Tourism Precinct.
We also ruled out the area to the west of Point Wilson, due to the difficulty and cost of dredging an access channel. The particular issues with creating a channelto this area, as opposed to the area east of Point Wilson, are significantly:
higher dredge volume larger amount of dredge material to be disposed of more time, cost and environmental impact of dredging basalt (likely to require
blasting).
The northwestern part of Port Phillip Bay is relatively shallow and extensive dredging would be required to create a shipping channel to access a port in the Bay West study area. The initial review identified marine geotechnical conditions, specifically the presence of rock, as a major knowledge gap. The presence of significant rock presents a constraint on dredging, because it is slow and expensive to dredge, typically more than ten times the cost of dredging sands, silts or clay.
Hard basalt rock is known to occur in the study area in outcrops along the coast; there is a basalt quarry on Point Wilson and basalt occurs in the Geelong Channel southeast of Point Wilson. To fill this knowledge gap we commissioned a geophysics survey of the sea bed to map the extent of shallow basalt (for more information refer to Bay West Geophysics technical report).
The geophysics survey found shallow basalt at each end of the study area, an extensive area south and east of Point Wilson, and a smaller area extending offshore of Point Cook. The area in the middle, about 7 kilometres either side of the Werribee River mouth, has less rock and where rock is present it is deeper and close to shore. The extent of basalt in the study area is shown in figure 31.
Ruling out the areas east of the Werribee River and west of Point Wilson narrowed our focus to the area in front of the Western Treatment Plant and the Spit Wildlife Reserve.
In the second stage of the site selection process, we developed three location concepts for the Bay West port as shown in figure 31. All three concepts feature a quay and container
Infrastructure Victoria Second Container Port Advice – Evidence Base95

terminal located on a reclaimed island in Port Phillip Bay, with a road and rail link back to the shore on a bridge or causeway. We proposed this arrangement because:
Locating the port closer to deep water reduces dredging volumes, costs and associated environmental impacts.
Reusing the material dredged from the channels to construct the reclamation, if suitable, may reduce the cost and environmental impact of disposing of dredge material elsewhere.
There is reduced impact on the coastline and existing land users along the coast, especially the Western Treatment Plant.
Figure 31. Initial location concepts for Bay West
Source: Adapted by Infrastructure Victoria from GHD, Infrastructure Victoria Second Container Port Advice – Concept Options – Bay West and Hastings, 2017
The ‘Werribee River’ option consists of a 4 kilometre long island terminal with a strait quay located south of the Werribee River mouth, offshore of the Western Treatment Plant. The transport corridor crosses the coast to the west of the Werribee River then heads north and east around the Western Treatment Plant treatment lagoons to the future Outer Metropolitan Ring Road junction with the Princes Freeway. The access channel heads straight for deep water in the middle of the bay.
The ‘Point Wilson’ and ‘Kirk Point’ options have similar terminal locations on the eastern edge of the Point Wilson basalt flow. The terminal and quays are broken into two parallel islands due to the restricted area available between the basalt and the existing channel to
Infrastructure Victoria Second Container Port Advice – Evidence Base96

Geelong, and the desire to minimise the wave shadow impact on the Spit Wildlife Reserve and the Western Treatment Plant discharge mixing zones. For both these options the channel alignment with the least dredge volume is to follow and enlarge the existing Geelong Channel.
The Kirk Point and Point Wilson options feature different transport corridor alignments: Kirk Point: the corridor heads north from the terminal, crosses the shoreline around
Kirk Point and heads north across the agricultural zone of the Western Treatment Plant to the future Outer Metropolitan Ring Road junction.
Point Wilson: the corridor heads west from the terminal and crosses the coast on the undeveloped land owned by the Mountain View Quarry, in between the Point Wilson Defence site and the Spit Wildlife Reserve. It then heads north between the Western Treatment Plant and Avalon Airport to join the Princes Freeway south of Little River.
The Point Wilson transport corridor alignment is 12 kilometres longer than either of the other options for the majority of road freight to and from Melbourne. It does however offer the advantage of a substantial area of industrial land located closer to the port. For the other options, the closest available land may be north of the Princes Freeway due to the location of the Western Treatment Plant.
The Werribee River option was selected as the best representative concept for comparison with Hastings. We considered all of the options possible, and other options may exist in the area between Werribee River and Point Wilson. The location assessment could be revisited in the future if conditions change or more information is available. Details of the evaluation are provided in the GHD Concept Options – Bay West and Hastings report.
Our reasons for selecting the Werribee River location are: It has the lowest chance of impact on Western Treatment Plant discharge mixing
zones. The highest value environmental areas occur on the western part of the Western
Treatment Plant and in the Spit Wildlife Reserve. The Werribee River location largely avoids these areas.
The coastline behind the Werribee River location is experiencing erosion and has been armoured to protect treatment lagoons. Locating the port offshore would protect this area from further wave attack.
The transport corridor crosses the treatment-focused eastern half of the Western Treatment Plant, not the more conservation-focused western half crossed by the Kirk Point corridor.
It has the shortest road transport corridor to Melbourne. It has the smallest channel dredging volumes and therefore least cost and lower
environmental impact. Lower risk of encountering rock offshore mean these is greater flexibility in location of
the reclamation, which gives greater opportunities to reduce dredging volume or to balance cut and fill, reducing the need to dispose of dredge material elsewhere in the bay.
Infrastructure Victoria Second Container Port Advice – Evidence Base97

Design vesselsFor the Bay West concept we have considered two design vessels. The first is a 14,000 TEU vessel, the largest vessel that can transit the existing channels through Port Phillip Heads, as established by navigation simulations carried out at the Australian Maritime College.
The second scenario is a larger 18,500 TEU vessel, included for direct comparison with Hastings. Navigation simulations indicated that for vessels of this size to safely transit the heads it would be necessary to widen the Great Ship Channel from 245 metres to about 425 metres. This option is included for comparison purposes, at this stage we are not proposing any further dredging of the Great Ship Channel at the Port Phillip Bay Heads.
Table 12 shows the vessel characteristics for the two scenarios we modeled.
Table 12. Design vessel characteristics for Bay West and Hastings
SCENARIO 1: 14,000 TEU – Constrained by existing Port Phillip Heads
SCENARIO 2: 18,500 TEU – Port Phillip Heads widened, not deepened
14,000 TEU New Post Panamax Based on MCS Daniela366 metre LOA51.2 metre beam13.5 metre sailing draught
18,500 TEU Ultra Large Container Ship Based on Maersk, ‘triple E’ vessel.400 metre LOA59 metre beam14.0 metre sailing draught
Source: Infrastructure Victoria 2017
Bay West concept design
Terminal locationIn the selected Werribee River concept the container quay and terminal are located on a reclaimed island in Port Phillip Bay, south of the Werribee River mouth and about 1.5 kilometres offshore of the Western Treatment Plant. There is a 4.1 kilometre strait quay line backed by a 600 metre deep terminal area, providing about 250 hectares of land and a capacity of 9 million TEU per year.
The terminal area includes ship to shore cranes, a container stacking area and road and rail loading and unloading. The island also accommodates some port services and maintenance functions. Figure 32 shows the terminal location.
Infrastructure Victoria Second Container Port Advice – Evidence Base98

Figure 32. Bay West concept terminal and port environs
Source: Adapted by Infrastructure Victoria from GHD, Infrastructure Victoria Second Container Port Advice – Concept options – Bay West and Hastings, 2017
Transport corridorsA bridge or causeway carrying road, rail and services connects the terminal island to the shore west of the Werribee River. The main road and rail transport corridor then heads north and west around the current Western Treatment Plant treatment lagoons and planned future treatment areas to join the future Outer Metropolitan Ring Road junction with the Princes Freeway.
We have not included the cost of the Outer Metropolitan Ring Road in our cost estimates. A commitment to the Outer Metropolitan Ring Road is likely to have a positive project cost benefit analysis without considering Bay West, as discussed in Infrastructure Victoria’s 30-year Strategy. We assume that population and business growth in Melbourne’s west will drive the road’s construction, independent of a future port location.
A second possible road alignment runs north to join the Princes Freeway south of Werribee, saving about 10 kilometres for traffic heading east on the Princes Freeway.
We have discussed both alignments with Melbourne Water, and the alignments have been designed to minimise the impact on the Western Treatment Plant’s current and future operations.
Infrastructure Victoria Second Container Port Advice – Evidence Base99

The rail line follows the main corridor and links withthe main Geelong–Melbourne line at the future Outer Metropolitan Ring Road junction. The future Outer Metropolitan Ring Road proposal includes a rail line to the proposed Western Interstate Freight Terminal at Truganina.
A rail yard up to 3 kilometres to break up long trains into shorter units is located to the west of the future Outer Metropolitan Ring Road alignment. We have assumed that the longest interstate trains will be broken up at the Western Intermodal Freight Terminal proposed for Truganina. This means that the Bay West rail terminal can be smaller than the proposed Hastings terminal. This rail terminal is about 17 kilometres from the port, so for efficient operations another set of 600 metre sidings is required at the coast where trains can wait to access the port terminal.
The possible road and rail alignments, the rail terminal and the additional rail sidings are all shown in Figure 32.
Port precinctThere are a number of port services that must be located close to the terminal, such as maintenance, administration and staff facilities, and customs and quarantine stations. These critical port services would be located on the island reclamation.
Other port-related logistics tasks such as warehousing, distribution centres, and empty container parks would need to be located further away, to avoid disrupting operation of the Western Treatment Plant. The closest potentially available land is north of the Princes Freeway, 13 or more kilometres from the port gate. There is also ample suitable land along the Princes Freeway and the Outer Metropolitan Ring Road between the port and its market. Much of the logistics industry is already based in the western suburbs and may choose to remain in their current locations, as there is suitable vacant industrial land, which could host port-related businesses.
Channel, swing basins and berthsFor ships to reach the port at Bay West, dredging is required to create a deep access channel, a turning basin and berth pockets where the ships sit alongside the quay.
Ships accessing Bay West would use the existing channels through the Port Phillip Heads. Once in Port Phillip Bay the conditions for navigating up the Bay West channel and manoeuvring onto the berth are relatively benign, as the northwestern part of the Bay does not experience strong currents or large waves. Extreme winds may impact vessel handling, as it can at many other ports.
The berth and manoeuvring areas in front of the quay are 250 metres wide and there is a turning basin in the middle of the quay about 650–700 metres wide (for the 14,000 and 18,500 TEU design vessels).
From the swing basin there is a one-way channel about 10 kilometres long, which heads east to the deep water in the middle of the Bay. This channel has a declared depth of 14.5 metres for the 14,000 TEU design vessel or 15 metres for 18,500 TEU design vessel.
Infrastructure Victoria Second Container Port Advice – Evidence Base100

Dredging and reclamationDredging will be required to construct the channels, turning basin and berth pockets. The total dredge volume to create channels, turning basin and berths is estimated at 19 million cubic metres for the 14,000 TEU design vessel or 20 million cubic metres for the 18,500 TEU design vessel. These figures include dredging of 0.1 million cubic metres to widen the Great Ship Channel for the 18,500 design vessel.
The dredge material is likely to consist of a small amount of soft surface sediments, and a larger amount of underlying stiff to hard clays. It should be possible to reuse much of the dredge material to build the island reclamation, which would need to be confirmed by further investigations. Our cost estimates are based on this construction method.
Although we propose reusing dredge material in the reclamation, an additional 9 million cubic metres of sand would need to be dredged from elsewhere in Port Phillip Bay to construct the reclamation.
This means the total dredge volume for the Bay West concept is about 28 million cubic metres, made up of 19 million cubic metres for the channels and port area and 9 million cubic metres of sand dredged from elsewhere in Port Phillip Bay to build the reclamation.
These dredging volumes are to accommodate a 14,000 TEU ship. About 29 million cubic metres of dredging would be required to accommodate a 18,500 TEU ship.
Staging and constructionThe Bay West concept can be built in a number of stages. We have considered three stages of 3, 6 and 9 million TEU per year for the purpose of comparison with Hastings.
Stage one of the potential Bay West development has a relatively large capital expenditure, because the full channel, turning basin and berth pockets must be constructed to begin operating the port.
Cost estimateWe have prepared a cost estimate for the Bay West concept as set out in figure 33. Costs are outlined in Tables 13 and 14, and are in 2017 dollars with no allowance for contingency or risk. Further detail of the cost estimates can be found in the GHD Concept Options – Hastings and Bay West report.
We have not included the cost of the Outer Metropolitan Ring Road. A commitment to the Outer Metropolitan Ring Road is likely to have a positive project cost benefit analysis without considering Bay West, as discussed in Infrastructure Victoria’s 30-year Strategy. The Outer Metropolitan Ring Road is included in the VITM 2046 Reference Case, and we assume that population and business growth in Melbourne’s west will drive the road’s construction, independent of a future port location.
Infrastructure Victoria Second Container Port Advice – Evidence Base101

The target accuracy of our cost estimate is -40 per cent to +60 per cent, in accordance with Department of Treasury and Finance’s ‘high value/high risk’ guidelines for the ‘conceptualise’ phase.
We are still considering when the investment in rail network upgrades would be required. The timing will depend on the capacity of the existing network when stage one is developed and the extent to which the Port of Melbourne is operating with rail access at that time. Similarly, widening of the shipping channel through the Heads may not be required but it is a possible option that could be activated.
Figure 33. Bay West concept, elements included in costing
Infrastructure Victoria Second Container Port Advice – Evidence Base102

The cost estimate for the Bay West concept includes: dredging of channels and manoeuvring areas reclamation to create land for container terminal construction of quay and container terminal road corridor to the Princes Freeway–Outer Metropolitan Ring Road junction rail corridor to the Geelong-Melbourne line–Outer Metropolitan Ring Road junction a rail terminal west of the Outer Metropolitan Ring Road Upgrades to the existing rail network to provide two freight tracks from Outer
Metropolitan Ring Road junction to Dynon.
Source 46. Adapted by Infrastructure Victoria from GHD, Second Container Port Advice – Concept options – Bay West and Hastings, 2017
Table 13. Cost estimate for Bay West concept 14,000 TEU design vessel ($ millions)
STAGE 1: 3 million TEU
STAGE 2: 6 million TEU
STAGE 3: 9 million TEU
TOTAL
Dredging and reclamation
$1,221 $181 $119 $1,521
Port terminal and quay
$1,680 $952 $919 $3,551
Road and rail connections (to existing network)
$746 $23 $13 $782
Sub total $3,647 $1,156 $1,051 $5,854Regional Rail East (upgrade to network, Dynon to Lyndhurst)
$290 $290
TOTAL $3,647 $1,446 $1,051 $6,144
Infrastructure Victoria Second Container Port Advice – Evidence Base103

Source: Adapted by Infrastructure Victoria from GHD, Second Container Port Advice – Concept options – Bay West and Hastings, 2017
Table 14. Cost estimate for Bay West concept 18,500 TEU design vessel ($ millions)
STAGE 1: 3 million TEU
STAGE 2: 6 million TEU
STAGE 3: 9 million TEU
TOTAL
Dredging and reclamation
$1,281 $181 $119 $1,581
Port terminal and quay
$1,736 $952 $919 $3,607
Road and rail connections (to existing network)
$746 $23 $13 $782
Sub total $3,763 $1,156 $1,051 $5,970Regional Rail East (upgrade to network, Dynon to Lyndhurst)
$290 $290
Widening of Great Ship Channel option
$160 $160
TOTAL $3,763 $1,606 $1,051 $6,420
Source: Adapted by Infrastructure Victoria from GHD, Second Container Port Advice – Concept options – Bay West and Hastings, 2017
Potential environmental and social impactsWe have undertaken a desktop review of existing environmental, heritage and social assets, values and uses to identify issues that are likely to be differentiators between the Bay West and Hastings sites. We considered issues identified by our specialist consultants and those raised by community members and stakeholders in the first round of consultations. Our assessment considered the risks posed by development footprint, construction and operation of the port.
Our assessment is based on available data and understanding of issues. We did not collect any new data for this study. More data collection, better understanding of the issues and more design work to mitigate the identified risks could change the risk profile of the Bay West proposal.
Below we discuss the issues we consider to be major differentiators between the Bay West and Hastings concepts.
For more detail on these and other issues considered, and the risk assessment methodology, see the GHD Environment and social advice.
Infrastructure Victoria Second Container Port Advice – Evidence Base104

The footprint of our Bay West concept is overlayed on the key vegetation types and Ramsar site in figure 34, to give an indication of the habitat directly impacted.
Figure 34. Bay West development footprint overlayed on selected habitat map and Ramsar site
Source: Adapted by Infrastructure Victoria from GHD, Infrastructure Victoria Second Container Port Advice – Environment & Social Advice, 2017
Environmental issues – major differentiatorsIn conjunction with our environmental consultants, we assessed the risk of 24 environmental issues, of which seven where assessed as major differentiators between the two locations:
1. SeagrassSeagrass is a cornerstone habitat providing shelter and food for marine animals, plants and some birds.
At Bay West there is no significant seagrass identified within the development footprint. There are some scattered and sparse areas of seagrass close the shore, but these are remote from the development and we have assessed the risk of indirect impacts from turbidity during construction as low.
Infrastructure Victoria Second Container Port Advice – Evidence Base105
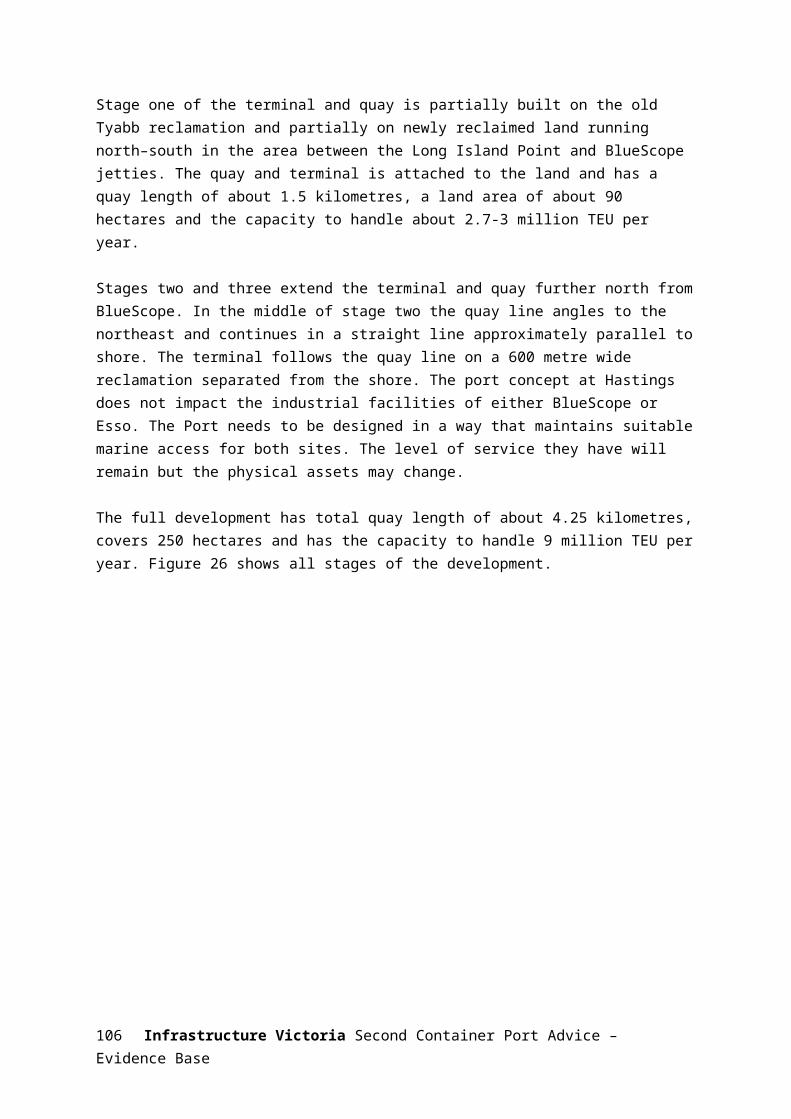
2. SaltmarshSaltmarsh is listed as a vulnerable ecological community under the Commonwealth Environment Protection and Biodiversity Conservation (EPBC) Act 1999 and impacts to saltmarsh would also need to be assessed under the Victorian Biodiversity Assessment Guidelines. It provides roosting and foraging habitat for shorebirds including the Orange Bellied Parrot.
At Bay West the development footprint does not contain any known saltmarsh and we have assessed the risk of impact as negligible.
3. MangrovesMangrove stands on the shoreline provide several environmental services including filtering pollutants, trapping sediments, protecting the shoreline from erosion and providing habitat for a number of species.
At Bay West the development footprint and surrounding area do not contain any known mangroves.
4. ShorebirdsThe western coast of Port Phillip Bay contains important habitats for shorebirds that roost and feed in the various habitats of the intertidal zone, including saltmarsh and mudflats.
At Bay West, the Western Treatment Plant and intertidal zone west of the proposed development is an important habitat for shorebirds including threatened species such as the Orange Bellied Parrot, Fairy Tern and Australian Painted Snipe. Waterbirds, invertebrates living in the mudflats, and the intertidal mud flats themselves are recognised as a critical ecosystem component in the Port Phillip Bay and Bellarine Peninsula Ramsar Wetland. The port development footprint is removed from the intertidal zone, saltmarsh and freshwater lagoons used by birds so there would be little or no direct impact. There may be some disturbance by noise and light associated with construction and operation of the port. We assessed the risk as low to medium for footprint and operation but high during construction.
5. Orange Bellied ParrotThe Orange Bellied Parrot is listed as critically endangered under the Commonwealth Environment Protection and Biodiversity (EPBC) Act 1999 and threatened under the Victorian Flora and Fauna Guarantee Act 1998. The parrot spends most of the year in Tasmania and migrates to southern Victoria for a few months over winter, which it spends in coastal saltmarsh habitat.
The last Orange Bellied Parrots in the wild have been recorded using saltmarsh in the Western Treatment Plant as their winter habitat. The development footprint avoids this area, but due to their conservation status we assess the overall risk as high.
6. FishPort Phillip Bay has 11 protected species/groups of fish. Some of these species could be impacted through habitat loss within the footprint or turbidity during construction. We have
Infrastructure Victoria Second Container Port Advice – Evidence Base106

assessed the risk as low, as the Bay West footprint is not important habitat for listed species and has low habitat diversity.
7. Blue carbonCoastal and shallow marine vegetation including saltmarsh, mangroves and seagrass are some of the most efficient carbon sinks in the natural world. The carbon capturedand stored in these systems is known as ‘blue carbon’. The impact on blue carbon should be proportional to the area of these vegetation types lost in the development footprint.
At Bay West, very little of this vegetation occurs within the development footprint and we assessed the risk as low.
Social issues – major differentiators
Land acquisition, land access and impact on surrounding land use At Bay West the terminal is offshore and the transport corridor is located mainly within the Western Treatment Plant which is already owned by the State. The transport corridor has been designed to have minimal impact on the current and future operations of the Plant. Some private rural land would need to be purchased for the rail marshalling yard located west of the future Outer Metropolitan Ring Road alignment, but the impact on surrounding land use in this area is expected to be relatively small due to its rural character.
CongestionAlthough port traffic is only a small proportion of metropolitan traffic, any impact on congestion can have a significant impact on the amenity of other road users, especially at a local level near the port. In the next phase of the project we will complete traffic modelling to compare the congestion impacts of expanding container capacityat the port of Melbourne, Hastings or Bay West.
Recreational fishingPort Phillip Bay is a very popular waterbody for recreational fishing, but the Bay West site in itself is not thought to be a particularly valued fishing ground. There is a large boat ramp at Werribee South, and the proposed port could increase travel times from this ramp to the fishing grounds of Corio Bay. This impact could be mitigated by providing additional boat launching facilities to the west of the port, for example at Kirk Point.
The waterway area that may be lost to recreational fishing is estimated at about 880 hectares, or less than 1 per cent of the area of Port Phillip Bay, consisting of the Bay West terminal, exclusion zone and the new Bay West Channel. Existing channels in Port Phillip Bay are not included as they are already ‘transit only’ zones where anchoring and drifting are not allowed, effectively restricting fishing.
Aboriginal and historic cultural heritageThere is potential for disturbance of items of Aboriginal cultural significance at Bay West, although much of the site is already disturbed. We assessed the risk as medium. The risks could be managed and we do not consider it a major differentiator between the two sites.
Infrastructure Victoria Second Container Port Advice – Evidence Base107

Enlarging shipping channels at Port Phillip HeadsAs an option in the Bay West case we have considered the possibility of widening the Great Ship Channel through Port Phillip Heads from 245 to 425 metres, so that larger ships can access Port Phillip Bay. Widening of the shipping channel through the Heads may not be required, but it is a possible option that could be activated. It would be possible to accept ships up to 14,000 TEU at Bay West without modifying the Heads at all.
If the channels through the Heads were to be widened under water, there are a number of environmental and social issues that would need to be considered in more detail:
Possible impacts on beaches surrounding the Heads inside the Bay: any enlargement of the channel in this area could allow more wave energy to enter the Bay from Bass Strait, which could lead to changes on nearby beaches. Preliminary modelling of the channel widening considered for this project indicated that there would be a small increase in wave energy entering the Bay and reaching some of the beaches inside the Heads. The area most at risk would be Observatory Point on the Bay side of Point Nepean. Before any works on the shipping channel in the Heads were undertaken, more detailed assessments would be required to properly quantify the impact on surrounding beaches and identify mitigation measures to limit impacts.
Possible impact on the reef habitat and sponge communities in the Heads: this includes in the canyon which runs across the Great Ship Channel.
Impact on tidal range within Port Phillip Bay: any enlargement of the channel in this area will allow more water into the Bay on a flood tide and increase peak water levels in the Bay. Modelling of the channel widening considered for this project indicated it could lead to a rise in high tide levels by 6 to 8 millimetres. To put this in context, this is equivalent to about three years of sea level rise at current (2016) rates.
For more information on the environmental issues associated with enlarging the shipping channels through the Heads see the following technical reports:
• Infrastructure Victoria Second Container Port Advice – Environment & Social Advice
• Infrastructure Victoria Second Container Port Advice – Hydrodynamics study • Infrastructure Victoria Second Container Port Advice – Geomorphology
Approvals and offsets at Bay West
The Port Phillip Bay and Bellarine Peninsula Ramsar Wetland – what is it and what does it mean for our assessment?Ramsar Convention on Wetlands of International Importance is an international treaty providing a framework for the protection of ecologically important wetlands, focusing on wetlands used by migratory birds. In Australia, Ramsar wetlands are managed under the Commonwealth Environment Protection and Biodiversity Conservation (EPBC) Act 1999. Each Ramsar site has an ecological character description which defines the critical ecosystem components and the limits of acceptable change as a basis for management of the wetland.
Infrastructure Victoria Second Container Port Advice – Evidence Base108

Development of a port within a Ramsar site, or impacting on a Ramsar site, would require approval of the Commonwealth Environment Minister under the Act. The Act requires offsets to mitigate any significant impact to the ecological character of Ramsar sites.
The presence of a Ramsar site does not mean development cannot occur, but it does mean that the development must respond to the Ramsar values and make it more complicated to get a development approved.
The Port Phillip Bay and Bellarine Peninsula Ramsar Wetland includes several discrete areas on the western shoreline of Port Phillip Bay. The Avalon area of the Ramsar site includes the Western Treatment Plant and the coast of Port Phillip Bay to a depth of 2 metres, as shown on figure 34.
The critical ecosystem components of the Port Phillip Bay and Bellarine Peninsula Ramsar site are:
geomorphic – intertidal mudflats, the Spit and tidal lagoon hydrology – tidal regime and maintained water levels in freshwater lagoons primary production – high biomass in lagoons and near shore areas vegetation – seaweed, seagrass, saltmarsh, freshwater vegetation invertebrates – worms, shellfish and snails on intertidal flats, invertebrates in
freshwater lagoons fish – freshwater and estuarine species waterbirds – 105 species including threatened species.
The proposed terminal and channels for Bay West are located more than 1 kilometre outside of the Ramsar site. The transport corridor enters the Ramsar site at the coast in a location where there are little or no intertidal mudflats, seagrass or saltmarsh, and travels for about 10 kilometres through the Ramsar site to the northern boundary atthe Princes Freeway, with a total footprint in the Ramsar site in the order of 1 square kilometre. There is a potential for some impact on critical ecosystem components along the corridor, but we expect these could be successfully minimised and offset, as demonstrated by Melbourne Water’s continued development of sewage treatment infrastructure in this part of the site.
ApprovalsWe have reviewed the approval requirements for the Hastings and Bay West proposals, based on current legislation. While the list of approvals required is broadly similar, there are a number of key differences in the complexity of attaining those approvals at either site. We discuss the key differences below. For further information on approvals that could be required refer to the Environment and Social technical report.
Environment Protection (Sea Dumping) Act 1981 (Commonwealth) – disposal of dredge material and dredging in Bass Strait greater than 3 nautical miles offshore in Commonwealth waters requires approval under this act. This is would not be required for Bay West as all dredging and reclamation works are within state waters in Port Phillip Bay.
Infrastructure Victoria Second Container Port Advice – Evidence Base109

Environment Protection and Biodiversity Act (EPBC) 1999 – a container port at Bay West would likely be deemed a ‘controlled action’ and thus require approval under the Act due to their potential to impact on Matters of National Environmental Significance, in particular the Ramsar wetland and endangered species such as the Orange Bellied Parrot.
OffsetsOffsets are likely to be required under the Environment Protection and Biodiversity Act (EPBC) 1999, due to the impact on the Western Port Ramsar site. Offsets may be required for a number of ecological components and vegetation types including saltmarsh, seagrass and mudflats.
Offsets may also be required under Victoria’s Native Vegetation Framework for clearing of native vegetation, based on assessed risk to biodiversity.
Offsets involve protection or improvement of an area of similar size and value to that impacted by the development. More than 90 per cent of the offsets must be ‘direct offsets’ which involve the protection and/or improvement of equivalent habitat. Up to 10 per cent of the offsets can be ‘indirect offsets’ which include targeted research and education. To be acceptable the offset package must deliver an overall conservation outcome that improves or maintains the viability of the aspect of the environment that is protected. For example, if the project required the removal of 3 hectares of mangroves then a direct offset could be revegetation of a 1.5 hectare area with mangroves and protecting a further 2 hectares of existing mangroves.
The development of a port at Bay West may require offsets for a number of ecological components and vegetation types occurring along the transport corridor. Potential offsets within the Western Treatment Plant are readily identifiable.
Which technical reports should I look at for more information? GHD, Infrastructure Victoria Second Container Port Advice – Concept Options – Bay
West and Hastings, 2017 GHD, Infrastructure Victoria Second Container Port Advice – Environment & Social
Advice, 2017 Cardno, Infrastructure Victoria Second Container Port Advice – Hydrodynamics,
2017 AECOM, Infrastructure Victoria Second Container Port Advice – Navigation Study,
2017 Baggerman Associates, Ports Planning Advice Engineering Services – Dredging and
Reclamation, 2017 Environmental Geosurveys Victoria Second Container Port Advice –
Geomorphology, 2017 Guy Holdgate and Associates, Bay West Preliminary Geotechnical Investigation,
2016 GHD, Bay West Project Geophysical Investigation, 2016
Infrastructure Victoria Second Container Port Advice – Evidence Base110

QUESTIONS What is your feedback on the Bay West concept? Do you have information to challenge our findings on the concept design, transport
corridor, channel, swing basins and berths, dredging and cost estimates? Do you think we have accurately assessed the environmental and social factors that
are likely to be differentiators?
Next steps – developing our adviceSo far, we have focused on gathering the evidence we need to prepare our advice. This paper sets out our evidence base, so that you can provide feedback on the information that will underpin our advice. We will consider any additional evidence in preparing our advice.
This section describes our methodology for analysingour evidence and preparing advice to the Minister on when and where Victoria should invest in new ports capacity.
All of our analysis to date indicates that the need for a second container port is likely to be some time away. Our current forecasts and assumptions, over time, may prove to be different from what occurs. To account for this is in our analysis we will use sensitivity testing to consider the “what ifs”. We will test different scenarios to determine how emphasising different key factors, such as whether the amenity value people place on land use or the future availability of road and rail links impacts when you need a second container port, and where it would be located.
Preparing our advice on when Victoria should invest in a second container portWe will recommend a timeframe during which the government should invest in a second port.
We will discuss how capacity should expand at the Port of Melbourne and the cost of each additional stage of capacity.
To recommend a timeframe, we will use a least economic cost per TEU assessment, which compares the long-run average cost of increasing the capacity of the Port of Melbourne against the long-run average cost of building a new port at either Bay West or Hastings, as well as the costs and benefits of externalities and amenity impacts. We will assess this cost at the different demand levels provided by our demand forecast. The first assessment will be at the point we project the existing capacity of the Port of Melbourne is reached. As we assess each additional tranche of capacity, at some point there is likely to be a lower economic cost of investing in a second port, rather than further expanding the Port of Melbourne.
While we apply the principle of maximising the efficiency of the Port of Melbourne, this does not necessarily mean making the Port of Melbourne as large as technically possible. A social, environmental, land use or transport network opportunity or constraint may mean the
Infrastructure Victoria Second Container Port Advice – Evidence Base111

best decision is to invest in a new port before the Port of Melbourne reaches its ultimate technical capacity. This assessment will include transport modeling using the Victorian Government’s statewide strategic transport model, the Victorian Integrated Transport Model. We also acknowledge making this decision means making trade-offs. Our analysis will consider how valuing factors differently may change the conclusion.
Preparing our advice on where Victoria should locate a second container portWe will recommend the best location for a second container port, based on current information.
To provide advice on where to locate a new port, we will assess the economic, environmental, social and amenity impacts of a new port at either Bay West or Hastings. We will also undertake further transport modelling to determine the congestion around the potential port sites and the general road network and a separate supply chain analysis for each site. We will bring all these criteria together using a multi-criteria analysis, a commonly used tool for assessing quantitative and qualitative indicators of environmental, economic, social and amenity impacts. We will weight each of the indicators in the framework, then use them to assess and compare the Bay West and Hastings options. We will also run the multi-criteria analysis with different weightings, to test whether a particular factor would change the outcome of our assessment. The economic analysis will consider the regional, statewide and national impacts of expanding the Port or changing it’s location.
We will provide the full list of indicators, weightings and the scores from our multi-criteria analysis to the Minister as part of our advice.
An overview of how we will prepare our advice on the two parts of the question is shown in figure 35.
Infrastructure Victoria Second Container Port Advice – Evidence Base112

Figure 35. Methodology overview
Source: Infrastructure Victoria/Deloitte, 2017
Getting involvedWe have presented the information, data and analysis we have collated over the past six months to give everyone an opportunity to consider our evidence before we deliver our final advice to the Minister.
In this phase of engagement on the evidence base, we want to hear from you about: any information that is different to the evidence we have put forward, or any evidence that expands the amount of data we can draw on.
Making a submissionYou can provide feedback by making a formal submission at yoursay.infrastructurevictoria.com.au.
We would like you to consider the questions we have posed throughout this paper and the following key topics when making your submission:
ship sizes channel capacity of Port Phillip Heads demand forecasts Port of Melbourne – capacity, supply chains, environmental and social considerations
and transport links Bay West concept
Infrastructure Victoria Second Container Port Advice – Evidence Base113

Port of Hastings concept Bay West and Hastings economic, social, amenity and environmental impacts.
Submissions will be published on the Infrastructure Victoria website. Please advise us if you do not wish for your submission to be published online.
Please note that only one document can be uploaded per submission. If your submission consists of several documents or attachments you will need to merge them or refer to URL links in your submission. Where possible please submit in Word format.
We will use feedback on our evidence base to inform our final advice to the Minister in May 2017.
Community drop-in sessionsInfrastructure Victoria is holding community drop- in sessions at Melbourne, Hastings and Wyndham for local communities to find out more about Infrastructure Victoria’s work on the port advice.
Visit yoursay.infrastructurevictoria.com.au to register your interest and find out details of the sessions.
Sources
Infrastructure Victoria publicationsInfrastructure Victoria, Preparing advice on Victoria’s future ports capacity – discussion paper, 2016
Infrastructure Victoria, Second container port advice – consultation summary paper, 2017
Infrastructure Victoria, Victoria’s 30-Year infrastructure strategy, 2016
Advice to Infrastructure VictoriaAECOM, Infrastructure Victoria Second Container Port Advice Navigation Study, 2017
Baggerman Associates, Ports Planning Advice Engineering Services – Dredging and Reclamation, 2017
Cardno, Infrastructure Victoria Second Container Port Advice Hydrodynamics Study, 2017
Deloitte, Infrastructure Victoria Second Container Port Advice container trade forecasts for Victoria, 2017
Deloitte, TEU Cost Assessment, 2017
Infrastructure Victoria Second Container Port Advice – Evidence Base114

Deloitte/Aurecon, Victorian infrastructure capability assessments: transport, http://www.infrastructurevictoria.com. au/sites/default/files/files/160229%20-Transport%20-%20 Final.pdf, 2016
Deloitte/Jacobs, Infrastructure Victoria Second Container Port Advice port landside transport modelling, 2017
Drewry, Container Ship Fleet Forecast and Maritime Economic Assessment, 2017
Environmental Geosurveys, Infrastructure Victoria Second Container Port Advice Geomorphology, 2017
GHD, Infrastructure Victoria Port Phillip Bay Geophysics Survey, 2016
GHD, Infrastructure Victoria Second Container Port Advice – Concept Options – Bay West and Hastings, 2017
GHD, Infrastructure Victoria Second Container Port Advice – Estimated Capacity of the Port of Melbourne, 2017
GHD, Infrastructure Victoria Second Container Port Advice Environmental & Social Advice, 2017
Guy Holdgate and Associates, Bay West Preliminary Geotechnical Investigation, 2016
Raylink Consulting, Regional Rail East and Hastings Rail Link – Concept of Operations Report, 2017
RPS, Workshop summary report, 2016
Victoria University Institute for Supply Chain and Logistics,Indicative Estimates of Commodities and Truck Volumes from Container Destinations in Melbourne, 2017
Documents prepared for Port of Hastings Development Authority and used by Infrastructure VictoriaAecom, Land Use Planning Desktop Assessment, 2014
Aecom/GHD, Channel Design for Construction – Stage 1 Preliminary Recommendations for Dredging Tolerances and Batter Slopes, 2014
Aecom/GHD, Initial Berth Alignment and Terminal Footprint, 2014
Aecom/GHD, Vessel Clearances and Safety Zones at Long Island Point, 2014
Infrastructure Victoria Second Container Port Advice – Evidence Base115

Andrew Long + Assoc for GHD/Aecom, Aboriginal Cultural Heritage Desktop Assessment, 2014
Andrew Long + Assoc for GHD/Aecom, Aboriginal Cultural Heritage Predictive Model Report, 2015
Aurecon, Marine Geophysics Survey Final Interpretative Report, 2014
Biosis – for GHD/Aecom, Port of Hastings: SUZ1 and Land Transport Corridor – Desktop Flora and Fauna Assessment, 2014
Biosis – for GHD/Aecom, Port of Hastings: Flora and Fauna Assessment of Crown land and BlueScope Steel property (within SUZ1), 2014
Biosis for GHD/Aecom, Waterbirds – desktop review and study design, 2014
Capire – for GHD/Aecom, Preliminary Desktop Studies – Social Desktop Assessment, 2014
Cardno, Port of Hastings 2013 Description Report – Hydrodynamics, 2013
CEE for GHD/Aecom Seagrass – desktop review and study design, 2014
Deakin University – for GHD/Aecom, Benthic Habitat Mapping in Western Port – desktop review and study design, 2015
GHD, Port of Hastings Container Expansion Project – Ecology Description – Final Report, 2013
GHD/Aecom, Basis of Design, 2015
GHD/Aecom, Channel Design for Navigation Report, 2015
GHD/Aecom, Concept Channel Design & Channel Development Strategy, 2015
GHD/Aecom, Dredging & Reclamation – Ground Improvement, 2015
GHD/Aecom, Interim Structural Design Options Assessment Report, 2015
GHD/Aecom, Port Precinct and Environs Preliminary Planning Concepts, 2015
GHD/Aecom, Preliminary Review and Analysis of recreation, Amenity and Heritage Issues, 2013
GHD/Aecom, Real Time Navigation Simulation Report, 2015 GHD/Aecom, Services & Utilities Assessment, 2015
GHD/KPMG, Review of Preliminary Container Demand Work, 2014
Infrastructure Victoria Second Container Port Advice – Evidence Base116

Lovell Chen – for GHD/Aecom, HSUZ1 Area and Land Transport corridor – Historical Heritage Desktop Assessment, 2014
Raylink Consulting & John Hearsch, Rail-Port Interface Facility Preliminary Concept Investigation, 2014
Raylink Consulting, Frankston–Stony Point Rail Corridor Suitability for Container Freight to the Proposed Hastings Container Port, 2014
Raylink Consulting, Hastings Rail-Port Interface Facility Preliminary Cost Estimate, 2014Report Royal HaskoningDHV, Dredging History in Western Port, 2015
Royal HaskoningDHV, An Alternative Port Concept Design, 2015
Royal HaskoningDHV, Constraints and Opportunities Mapping in Marine Areas for Dredge Material Management Purposes, 2015
Royal HaskoningDHV, Dredging and Reclamation Options Report, 2015
Royal HaskoningDHV, Early Hydrodynamic Modelling Report, 2014
Royal HaskoningDHV, Hydrodynamic Input for 2D Vessel Simulations, 2015
Royal HaskoningDHV, Preliminary Siltation Analysis Western Port Shipping Channel and Berth Pockets, 2014
University of Melbourne – for GHD/Aecom, Marine Fish – desktop review and study design, 2014
WorleyParsons, Factual Report on Marine Geotechnical Investigation, 2014Last accessed February 2017
Victorian Government documentsDepartment of Treasury and Finance, High Value/High Risk Guidelines, http://www.dtf.vic.gov.au/Investment-Planning- and-Evaluation/Investment-professionals-toolkit/Investment- lifecycle-and-High-Value-High-Risk-products. Last accessed February 2017
Environment Protection Authority, Francis Street Monitoring Program – Final report December 2013, http://www.epa.vic.gov.au/~/media/Publications/ 1546%201.pdf. Last accessed February 2017
KPMG, Project Blue Scoping Study, 2014 file:///C:/Users/QSH/Downloads/KPMG-Scoping-Study.pdf. Last accessed February 2017
Infrastructure Victoria Second Container Port Advice – Evidence Base117

Port of Melbourne Corporation, Port of Melbourne and Dynon Rail terminals: 2009 container logistics chain study full report, http://trove.nla.gov.au/ work/153401912?selectedversion=NBD47280916. Last accessed February 2017
VicRoads, Supplement to Austroads Guide to Traffic Management Part 3: Traffic Studies and Analysis, published October 2015, https://www.vicroads.vic.gov.au/ .../guidelines/traffic.../temvolume1part23agtm3traffic.
Victorian Government, Fishermans Bend Urban Renewal Project, http://haveyoursay.delwp.vic.gov.au/fishermans-bend. Last accessed February 2017
Victorian Government, Plan Melbourne, 2014, www.planmelbourne.vic.gov.au/home. Last accessed February 2017
Victorian Ports Corporation (Melbourne), Harbour Master’s Directions, 2015
Victorian Ports Corporation (Melbourne), Port Information Guide, 2016
Commonwealth Government documentsBITRE, Research report 138. Maritime, Containerised and non-containerised trade through Australian ports to 2032-33, 2014
Department of Defence, Point Wilson, Victoria information sheet, http://www.defence.gov.au/id/_Master/docs/NCRP/ VIC/1315PointWilsonVic.pdf, 2013
OtherOECD, Competitiveness of Global Port Cities Synthesis Report, 2014
About usInfrastructure Victoria is an independent advisory body, which began operating on 1 October 2015 under the Infrastructure Victoria Act 2015.
It has three main functions: preparing a 30-year infrastructure strategy for Victoria, to be refreshed every three to
five years providing written advice to government on specific infrastructure matters publishing original research on infrastructure-related issues
Infrastructure Victoria will also support the development of sectoral infrastructure plans by government departments and agencies.
The aim of Infrastructure Victoria is to take a long-term, evidence-based view of infrastructure planning and raise the level of community debate about infrastructure provision.
Infrastructure Victoria Second Container Port Advice – Evidence Base118

Infrastructure Victoria will not directly oversee or fund infrastructure projects.
Photo credit: HiVis Pictures/Peter Glenane/Port of Melbourne Corporation/Melbourne Water/Neville Rosengren.
This publication may be of assistance to you, but the State of Victoria and its employees do not guarantee that the publication is without flaw of any kind or is wholly appropriate for your particular purposes and therefore disclaims all liability for any error, loss or other consequence that may arise from you relying on any information in this publication. You should seek appropriately qualified advice before making any decisions regarding your particular project.
Printed by Infrastructure Victoria
March 2017
© Copyright State of Victoria 2017
Except for any logos, emblems, trademarks, figures and photography this document is made available under the terms of the Creative Commons Attribution 3.0 Australia licence. It is a condition of this Creative Commons Attribution 3.0 licence that you must give credit to the original author, who is Infrastructure Victoria.This document is also available in PDF and accessible Word format at yoursay.infrastructurevictoria.com.au.
ISBN: 978-1-925632-14-9
Infrastructure Victoria Second Container Port Advice – Evidence Base119