Embed Size (px)
Citation preview

S3331 Series Handheld Spectrum Analyzer User Manual
Saluki Technology Inc.
Tel: 886.2.2175 2930 Email: [email protected]
www.salukitec.com
2
The manual applies to the cable & antenna tester of the following models: S3331A handheld spectrum analyzer (9kHz-3.6GHz).
S3331B handheld spectrum analyzer (9kHz-7.5GHz).
Standard Accessories of S3331 handheld spectrum analyzer Item Name Qty
1 Main Machine 1 Set
2 AC/DC Adaptor 1 pcs
3 Battery 1pcs
4 CD 1 pcs
Options of the S3331 handheld spectrum analyzer: Option Number Item
S3331-01 Tracking signal source1.5/3.2GHz (1.5GHz tracking source for S3331A, 3.2GHz tracking source for S3331B)
S3331-02 FFT 1Hz RBW
S3331-03 Audio demodulation & measurement
S3331-04 EMI near field probe
S3331-05 Kit bag
S3331-06 Portable soft package
S3331-07 Backup battery
S3331-09 PC Software

Tel: 886.2.2175 2930 Email: [email protected]
www.salukitec.com
3
Preface Thanks for choosing S3331 handheld spectrum analyzer produced by Saluki Technology Inc. Please read this quick starter manual carefully for your convenience.
Manual No. S3331-03-02
Version Rev01 2017.02 Saluki Technology
Manual Authorization The information contained in this Manual is subject to change without notice. The power to interpret the contents of and terms used in this Manual rests with Saluki.
Saluki Tech owns the copyright of this Manual which should not be modified or tampered by any organization or individual, or reproduced or transmitted for the purpose of making profit without its prior permission, otherwise Saluki will reserve the right to investigate and affix legal liability of infringement.
Product Quality Assurance The warranty period of the product is 18 months from the date of delivery.
Product Quality Certificate The product meets the indicator requirements of the manual at the time of delivery. Calibration and measurement are completed by the measuring organization with qualifications specified by the state, and relevant data are provided for reference.
Quality/Environment Management Research, development, manufacturing and testing of the product comply with the requirements of the quality and environmental management system.
Precautions
"Warning" indicates danger. It reminds the user to pay attention to a certain operation process, operation method or similar situations. Noncompliance with the rules or improper operation may result in personal injuries. You must fully understand the warning and all the conditions in it shall be met before the next step
"Attention" indicates important prompts and no danger. It reminds the user to pay attention to a certain operation process, operation method or similar situations. Noncompliance with the rules or improper operation may result in damage to the instrument or loss of important data. You must fully understand the caution and all the conditions in it shall be met before the next step.

Tel: 886.2.2175 2930 Email: [email protected]
www.salukitec.com
4
Contacts
Service Tel: 886.2.2175 2930
Website: www.salukitec.com
Email: [email protected]
Address: No. 367 Fuxing N Road, Taipei 105,Taiwan (R.O.C.)

5
Tel: 886.2.2175 2930 Email: [email protected]
www.salukitec.com
Content 1. BRIEF INTRODUCTION............................................................................................................................................................................. 7
1.1. Key Feature ............................................................................................................................................................................................ 7 1.2. Typical Applications ................................................................................................................................................................................ 7 1.3. Measurement Functions ......................................................................................................................................................................... 7
2. SAFETY INSTRUCTIONS .......................................................................................................................................................................... 9
2.1. Device safety .......................................................................................................................................................................................... 9 2.2. Precautions on personal safety. ............................................................................................................................................................. 9
3. OVERVIEW ................................................................................................................................................................................................ 11
3.1. Front Panel Overview ............................................................................................................................................................................ 11 3.2. Function Keys description .................................................................................................................................................................... 12 3.3. Soft Keys .............................................................................................................................................................................................. 12 3.4. Interfaces on Side ................................................................................................................................................................................ 13 3.5. User Interface ....................................................................................................................................................................................... 14
4. MENU DESCRIPTION .............................................................................................................................................................................. 15
4.1. Menu Structure ..................................................................................................................................................................................... 15 4.2. AMP...................................................................................................................................................................................................... 16 4.3. BW/SWP .............................................................................................................................................................................................. 17 4.4. FREQ ................................................................................................................................................................................................... 18 4.5. Marker .................................................................................................................................................................................................. 19 4.6. Meas..................................................................................................................................................................................................... 21 4.7. Mode .................................................................................................................................................................................................... 23 4.8. PEAK .................................................................................................................................................................................................... 27 4.9. Span ..................................................................................................................................................................................................... 28 4.10. System ................................................................................................................................................................................................. 29 4.11. Trace .................................................................................................................................................................................................... 30
5. TYPICAL OPERATION ............................................................................................................................................................................ 33
5.1. Prepare................................................................................................................................................................................................. 33 5.2. Continuous Signal Measurement ......................................................................................................................................................... 33 5.3. Measure two signals with small frequency interval .............................................................................................................................. 34 5.3.1. Resolving Two Signals of Equal Amplitude ...................................................................................................................................... 34 5.3.2. Resolving Signals of Different Amplitudes ....................................................................................................................................... 36
5.4. N dB Bandwidth Measurement............................................................................................................................................................. 38 5.5. Adjacent Channel Power ...................................................................................................................................................................... 39 5.6. Channel Power Measurement .............................................................................................................................................................. 40 5.7. Occupied Bandwidth Measurement ..................................................................................................................................................... 41 5.8. Use Pre-amplifier to Capture Weak Signals ......................................................................................................................................... 42 5.9. Harmonic Distortion Measurement ....................................................................................................................................................... 43

6
Tel: 886.2.2175 2930 Email: [email protected]
www.salukitec.com
5.10. TOI Distortion Measurement ................................................................................................................................................................ 44
6. REMOTE CONTROL ................................................................................................................................................................................ 46
6.1. OS supported ....................................................................................................................................................................................... 46 6.2. Software Installation Procedures.......................................................................................................................................................... 46 6.3. Connection ........................................................................................................................................................................................... 49 6.3.1. USB Port Connection ...................................................................................................................................................................... 49 6.3.2. LAN connection ............................................................................................................................................................................... 50
6.4. UI .......................................................................................................................................................................................................... 50 6.4.1. Key Zone ......................................................................................................................................................................................... 51 6.4.2. Softkey Zone ................................................................................................................................................................................... 51 6.4.3. SCPI control Zone ........................................................................................................................................................................... 51 6.4.4. Display Zone .................................................................................................................................................................................... 51 6.4.5. Menu Bar ......................................................................................................................................................................................... 51
7. TROUBLE SHOOTING ............................................................................................................................................................................ 55
7.1. Start S3331 but the screen does not light. ........................................................................................................................................... 55 7.2. Keys not respond or the response is incorrect: .................................................................................................................................... 55 7.3. No signal display after normal power on: ............................................................................................................................................. 55 7.4. The frequency of the signal display is not accurate: ............................................................................................................................ 55 7.5. The amplitude of the signal is not accurate: ......................................................................................................................................... 55
8. S3331 SPECIFICATIONS ......................................................................................................................................................................... 56
8.1. Frequency ............................................................................................................................................................................................ 56 8.2. Amplitude ............................................................................................................................................................................................. 56 8.3. Input /Output......................................................................................................................................................................................... 56 8.4. RBW ..................................................................................................................................................................................................... 57 8.5. DANL .................................................................................................................................................................................................... 57 8.6. Phase Noise ......................................................................................................................................................................................... 57 8.7. Sweep Time ......................................................................................................................................................................................... 58 8.8. Spurious Response .............................................................................................................................................................................. 58 8.9. Tracking Generator (Option) ................................................................................................................................................................ 58 8.10. General................................................................................................................................................................................................. 58
S3331 HANDHELD SPECTRUM ANALYZER PROGRAMMING MANUAL ......................................................................................................... 60
7
Tel: 886.2.2175 2930 Email: [email protected]
www.salukitec.com
1. Brief Introduction S3331 handheld spectrum analyzer is designed for field use. It has a low weight, compact structure and a good performance. S3331 can be operated in field for 4 hours with battery power supply. It also provides telecommunication ports such as USB and LAN for remote data collection and remote control
1.1. Key Feature
Great Specifications Wide frequency range
S3331A: 9kHz – 3.6GHz
S3331B: 9kHz - 7.5GHz
DANL: <–140 dBm for full span, min. <-161dBm (typ.)
Phase noise: <–100 dBc/Hz at 100 kHz offset
Fast sweep speed, <50ms for full span sweep.
Level accuracy: 1.5dB
Build - In Tracking source Frequency 100kHz – 1.5GHz for S3331A, 100kHz - 3.2GHz for S3331B, covers most of the applications.
Output power -30dBm - 0dBm in 1dB steps .
With an external coupler, user can make approximate scalar network operations
1.2. Typical Applications EMI debugging
RF design debugging
Interference analysis (spectrogram)
Education and training
Spectrum monitoring
Signal location
RF transmitter testing and maintenance
1.3. Measurement Functions Spectrum Analyzer
Interference Analyzer (Spectrogram)
Field Strength

8
Tel: 886.2.2175 2930 Email: [email protected]
www.salukitec.com
Limit Line
User-defined mask
Channel Power
OBW(Occupied Bandwidth)
ACPR (Adjacent Channel Power Ratio)
AF/FM demodulation
Audio demodulation
Scalar network measurement with external coupler

9
Tel: 886.2.2175 2930 Email: [email protected]
www.salukitec.com
2. Safety Instructions Please read safety instruction carefully and Strictly follow!
We will spare no efforts to ensure that production process comply with latest safety standards so as to safeguard the safety of our users. The design and tests of our products and accessory equipment comply with relevant safety standards. We have established quality assurance system so that we can better supervise product quality and ensure that all products accord with standards in the system. To maintain the sound state of equipment and ensure safe operation, please comply with the following instruction. Contact us if you have any questions.
It is also your responsibility to use this product in correct manner. Suitable for industrial, laboratory and field uses, this equipment, however, must be used in correct manner so as to prevent personal injuries and property damages. For problems caused by misuses, liabilities rest on users. By proper use, it means that users should use this product according to prescriptions in the product document and in the required conditions. As sufficient expertise is required, only professional technicians and people that have been strictly trained and have mastered necessary skills are qualified to use this product. Please keep safety manual and product document in a proper manner, and deliver them to the end user. To forestall personal injuries and property loss, please abide by these safety instructions. Prior to using this product, please read carefully and comply with these instructions accordingly.
2.1. Device safety a) Use designated packing container in shipping and avoid falling or violent collisions in moving, which may cause damages to the
device.
b) Use AC-DC adapter shipped with the device to supply power/charge to the product. Using other power adapters may cause damages to internal hardware.
c) Ensure that power supply is well connected to the ground to prevent damages to the device caused by poor connection or false connection.
d) Injection of DC signal into input end is prohibited. Signal power needs to be lower than 0.5W. If not, damage to the device may occur.
e) If device uses external or internal batteries, replace these batteries with the same or equivalent type of batteries. When using other types of batteries, blast may occur.
f) Both insertions of objects into the gap of the device housing and dumping of liquids over device housing or into device are prohibited, which may cause short circuit, electric shock, fire or personal injuries.
g) Notches or gaps in the device, designed to help internal ventilation and whereby prevent overheat, must not be covered. The device must not be put on couch, wrapped with carpet, or placed in airtight housing unless ventilation is good
h) This device must not be placed on radiator, dish heater and other heating devices. Ambient temperature must not surpass the maximal temperature prescribed in this manual
i) Attention: Once this device is on fire, it may release toxic gases or liquids.
2.2. Precautions on personal safety. a) When moving the device, use proper tools and move the device softly so as to avoid personal injuries caused by the falling of the
device.
b) Device should be proper grounded so as to prevent personal injuries caused by poor or false grounding

10
Tel: 886.2.2175 2930 Email: [email protected]
www.salukitec.com
c) When cleaning the device, please unplug the device to avoid electric shock. Use dry or moist soft cloth to clean the device. Do not clean the internal of the device.
d) Before using this device, personnel need to be trained. When using the device, concentration is required. Operation by unqualified people may cause personal injuries and property losses.
e) Use of this device when power line is broken is prohibited. Regular check on power line is necessary. Proper measures should be taken to keep power line in good state and prevent stumble and electric shock.
f) Field use of the device when there is lightning is prohibited, which may cause personal injuries and property loss.
11
Tel: 886.2.2175 2930 Email: [email protected]
www.salukitec.com
3. Overview This chapter will help the user get to know S3331 quickly. This chapter includes introductions of:
Front Panel
Interface on side
UI
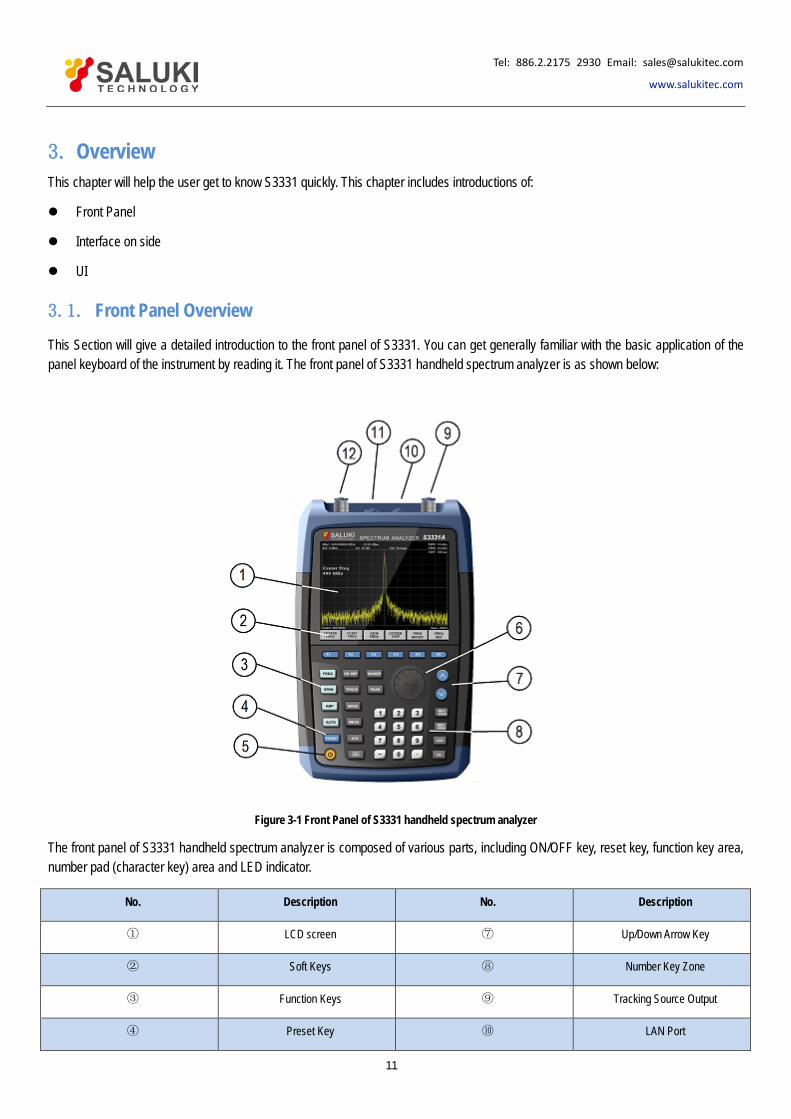
3.1. Front Panel Overview This Section will give a detailed introduction to the front panel of S3331. You can get generally familiar with the basic application of the panel keyboard of the instrument by reading it. The front panel of S3331 handheld spectrum analyzer is as shown below:
Figure 3-1 Front Panel of S3331 handheld spectrum analyzer
The front panel of S3331 handheld spectrum analyzer is composed of various parts, including ON/OFF key, reset key, function key area, number pad (character key) area and LED indicator.
No. Description No. Description
① LCD screen ⑦ Up/Down Arrow Key
② Soft Keys ⑧ Number Key Zone
③ Function Keys ⑨ Tracking Source Output
④ Preset Key ⑩ LAN Port

12
Tel: 886.2.2175 2930 Email: [email protected]
www.salukitec.com
No. Description No. Description
⑤ Power Switch ⑪ USB Port
⑥ Knob ⑫ RF input
3.2. Function Keys description
Frequency settings.
Include Start Frequency, Stop frequency, center frequency
Frequency span setting
Amplitude Settings.
Include Reference level, antenuator, pre-amplifier, scale settings.
Bandwidth/Sweep settings.
Include RBW, VBW, average, sweep time settings.
Trace settings:
Include detector, max hold, min hold settings
Auto measurement
Mode settings
Include tracking source settings, demodulation settings, trigger, pass-fail functions
Measurement mode selection:
Include Spectrum, adjacent channel power, occupied bandwidth, Channel Power etc.
System settings
Marker functions
Peak search functions
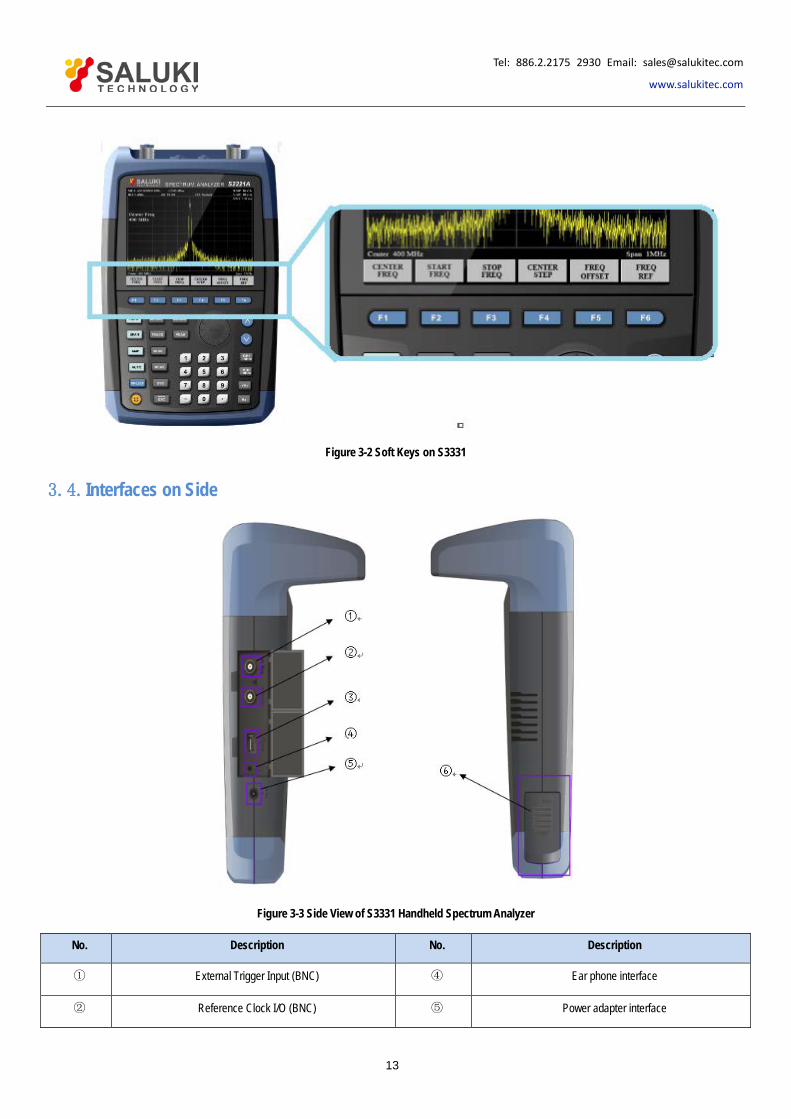
3.3. Soft Keys When press a function key, a soft key menu will appear on the bottom of the screen. User can use a row of physical key (F1 - F6) to select the soft key show on screen. Please see the figure below.
13
Tel: 886.2.2175 2930 Email: [email protected]
www.salukitec.com
Figure 3-2 Soft Keys on S3331
3.4. Interfaces on Side
Figure 3-3 Side View of S3331 Handheld Spectrum Analyzer
No. Description No. Description
① External Trigger Input (BNC) ④ Ear phone interface
② Reference Clock I/O (BNC) ⑤ Power adapter interface

14
Tel: 886.2.2175 2930 Email: [email protected]
www.salukitec.com
No. Description No. Description
③ USB Port ⑥ Battery hatch
3.5. User Interface
Figure 3-4 User Interface of S3331 Handheld spectrum analyzer
NO. Name
① Trace Display Format
② Detector Type
③ Attenuator
④ RBW
⑤ VBW
⑥ Trace
⑦ Sweep time
⑧ Span
⑨ Center Frequency
⑩ Scale
⑪ Reference level
⑫ Battery Status

15
Tel: 886.2.2175 2930 Email: [email protected]
www.salukitec.com
4. Menu Description This chapter will provide a full function – menu mapping and will give description of each menu option.
4.1. Menu Structure This section provides the structure of all buttons and soft-keys. Detail function description will be provided in section 4.2.
S3331 has following function keys on front panel. Following paragraphs will show the menu structure of these keys.
AMP
BW/SWP
FREQ
MARKER
MEAS
MODE
PEAK
SPAN
SYS
TRACE
In following paragraphs, F1-F6 are corresponding keys to operate the menu shown in the screen. Different menu levels will be shown in different colors.
Level 1 Level 2 Level 3 Level 4

16
Tel: 886.2.2175 2930 Email: [email protected]
www.salukitec.com
4.2. AMP
Pop up menus related to parameter setting of Amplitude, including [Reference Level], [Attenuator▶], [Preamplifier ON OFF], [Scale Type
Logarithm Linear], [Scale/Division], [Ref Unit], [Ref Offset]. Please refer to following diagram for the menu structure.
Ref Level
Menu description: The reference level can be adjusted with the number keys, step keys or knob. The reference level corresponds to the top of the coordinate top. Measure signal at reference level position to get highest accuracy. The input attenuator of the signal/spectrum analyzer is coupled to the reference level, which can be automatically changed to avoid compression of input signal.
[Attenuator Auto Man]
Menu description: In the manual mode, set attenuator to lower the distortion of large signal. Maximum can be set to 39dB
[Preamplifier ON OFF]
Menu description: to control the ON OFF status of the preamplifier. Preamplifier is provided as a standard component.
[Scale/Div]
Menu description: to select the scale/division 1, 2, 4, 10dB/division. This menu is only valid when the scale type is logarithm.
[Scale type Log Lin]
Menu description: to select the Y Axis Scale Type as Logarithm or Linear. In general, the logarithm scale unit is dBm and the linear scale unit is mV. Other unit types will be manually selected through the [Ref Unit].
[Ref Unit]
Menu description: to select the Ref unit from [dBm], [dBuW], [dBpW], [dBmV], [dBuB], [W], [V]. The instrument will automatically calculate the trace data and marker readout based on the Y axis scale unit.
[Ref Offset]
Menu description: to introduce offset for all amplitude readout (e.g., reference level and marker amplitude). It will not change the trace position on the screen. This offset unit is dB and is not affected by the scale and unit. Use number keys, stepping keys or knob to input the offset value.

17
Tel: 886.2.2175 2930 Email: [email protected]
www.salukitec.com
4.3. BW/SWP Pop up the soft menus for setting of resolution bandwidth ,video bandwidth and sweep, including [RBW Auto Manual], [RBW Mode Det Count], [VBW Auto Manual], [Average], [Sweep Time], [Sweep Point], [Sweep Single], [Sweep Count], [EMI BW]
[RBW Auto Manual]
Menu description: to change the resolution bandwidth of spectrum analysis, ranging from 1Hz to 3MHz, which is stepped by 1, 3, 5. The resolution bandwidth can be changed with the number keys, step keys and knob. The shaded character indicates the currently selected mode.
[RBW Mode Def Count]
Menu description: Manually change the RBW by step or continuously.
[VBW Auto Manual]
Menu description: to change the video bandwidth within the active function area, ranging from 10Hz to 20MHz, which is stepped by 1, 3, 5. Use number keys, stepping keys or knob to change The current mode is shaded.
[Average]
Menu description: to smooth the trace based on the average factor N.
[Sweep time Auto Manual]
Menu description: to change the sweep time of signal/spectrum analyzer by number keys, stepping keys or knob. When it is under Manual mode, it indicates that sweep time can be set manually. When it is under Auto mode, the sweep time will be automatically coupled based on resolution bandwidth, span and video bandwidth
The sweep time is coupled with the sweep type, resolution bandwidth, video bandwidth, average function and span. Changing those parameters will result in change of the sweep time or triggering of the limit setting of sweep time.
[Sweep Continuous] / [ Sweep Single]
Menu description: to set continuous sweep or single sweep. Continuous sweep is the default measurement control method; when enable [Sweep Single], sweep will be done only one time.
[EMI BW]
Menu description: to enable/disable EMI BW function. When [EMI BW] is enabled, user can select EMI bandwidth from 1MHz, 120kHz,

18
Tel: 886.2.2175 2930 Email: [email protected]
www.salukitec.com
30kHz, 9kHz.
4.4. FREQ The [Frequency] key on the front panel is used to set parameters related to the signal/spectrum analyzer frequency, including [Center Frequency], [Start Frequency], [Stop Frequency], [CF Step Auto ON OFF], [Frequency Offset]. User can configure the frequency measurement scope through the [Start Frequency] and [Stop Frequency], or through the [Center Frequency] and [Span]. Press the [Frequency] key to enable any soft menu from [Center Frequency], [Start Frequency] and [Stop Frequency], and corresponding parameter input area will display current parameters.
Following diagram gives a direct view of the menu structure
[Center Freq]
Menu description: to enable the center frequency and set the signal/spectrum analyzer into the center frequency/span mode. Use number keys, stepping keys or knob to change the center frequency. If the set center frequency is inconsistent with the current span, the settings will automatically adjusted to the value best suitable for desired frequency
[Start Freq]
Menu description: to enable the start frequency and set the signal/spectrum analyzer into the start frequency/stop frequency mode. Use number keys, stepping keys or knob to change the start frequency. In changing the start frequency, if the selected start frequency is larger than the stop frequency, the latter one will automatically increase till equaling to the sum of start frequency plus minimum span
[Stop Freq]
Menu description: to enable the stop frequency and set the signal/spectrum analyzer into the start frequency/stop frequency mode. Use number keys, stepping keys or knob to change the stop frequency. In changing stop frequency, if the selected stop frequency is less than the start frequency, the latter one will automatically decrease till equaling to the difference of stop frequency minus minimum span.
[CF Step Auto Manual]
Menu description: to change the steps of center frequency, start frequency or stop frequency. When the center frequency is active, press the step key, the frequency step changes 1/10 of the span. When it is under Manual mode, use the number keys, stepping keys or knob for change. At this time, reactivate the [Center Frequency], and press the step key, the center frequency will change by setting step. This function is very useful to quickly change the center frequency to the input signal harmonic. For example, observe the harmonic of

19
Tel: 886.2.2175 2930 Email: [email protected]
www.salukitec.com
300MHz input signal, and set the [CF Step Auto Manual] as Manual, and input 300MHz. If the current center frequency is 300MHz, press the stepping key to increase the center frequency to 600MHz. Press the stepping key again to increase the center frequency by 300MHz to 900MHz. The shaded status of [CF Step Auto Manual] menu indicates whether the step is set as Auto or Manual. When the step is under Manual, select the Auto from [CF Step Auto Manual] to return to Auto status.
[Frequency Offset]
Menu description: to add the set frequency offset to the displayed frequency value, including marker frequency value, but this does not affect the sweep span. Use number keys, stepping keys or knob to change the offset.
[Frequency Ref]
Menu description: to switch between internal reference signal and external reference signal. When use external reference, need to connect a 10MHz reference source to the Ext Ref port.
4.5. Marker Pop up the soft menu related to markers, including [Marker 1 2 3 4 5], [Trace 1 2 3 4 5], [Delta], [Normal], [OFF], [All off], [Marker Table ON/OFF], [Marker ->], and [Marker Function].
[Marker 1 2 3 4 5]
Menu description: S3331 supports 5 markers simultaneously. Only one is activated. [Marker 1 2 3 4 5] is used to select the activated marker. If the selected marker is not created, user can use [Normal] or [Delta] to create and activate the marker.
[Trace 1 2 3 4 5]
Menu description: Move the selected marker to other traces.

20
Tel: 886.2.2175 2930 Email: [email protected]
www.salukitec.com
[Normal]
Menu description: Create a new normal maker, or change the active marker from a delta marker to a normal marker. Normal marker will information is displayed on screen (X axis value, Y axis value)
[Delta]
Menu description: Create new reference marker/delta marker, or add a reference marker to the active normal marker. The reference marker will be set at the same X-axis value of the delta maker. If user want to move the reference marker, first move the delta marker to the wanted place then press [Delta] again, then the reference marker will move to the same position. Delta marker information will be display on screen ( X axis, Y axis value difference between reference marker and delta marker).
[Off]
Menu description: Turn off the selected marker.
[All Off]
Menu description: Turn off all markers.
[Marker Table On Off]
Menu description: to turn on/off the marker table display. Where there are many markers, it is convenient for data measurement.
[Marker Function]
Menu description: The [Marker Function] key is used for turning on the control instrument marker functions. The Marker Function performs post-processing on the marker data. Its soft menu includes [Marker Noise ON/OFF], [NdB ON/OFF], [Freq Count]
[Marker Noise On Off]
Menu description: when this menu is ON, it activates the noise maker. Read out the noise power that normalizes the noise into 1Hz bandwidth near the active marker. At that time, the detector is under Sample Detector mode.
[Freq Count ]
Menu description: to turn on or off marker Freq Count. If there is no active marker, enabling this function will activate an active marker at the center of screen. The Marker Count readout is not affected by the Frequency Offset. To facilitate normal function of Freq Count, the SPAN/RBW should be less than 500.
[NdB ON/OFF]
Menu description: to turn on or off the NdB measurement of bandwidth values descending from signal peak point. You can input the NdB value to be measured from the front panel.
[Marker->]
Pop up soft menus related to Marker->Function. Such menus are related to the frequency, span and marker type
[Marker → CF]
Menu description: to set the Center Frequency equal to the Marker Frequency. It can quickly move the signal to the center position of the screen.
[Marker → CF Step]
Menu description: to set the Frequency Step equal to the Marker Frequency. The menu changes the value of frequency step.
[Marker → Start]

21
Tel: 886.2.2175 2930 Email: [email protected]
www.salukitec.com
Menu description: to set the Start Frequency equal to the Marker Frequency. The menu changes the value of start frequency.
[Marker → Stop]
Menu description: to set the Stop Frequency equal to the Marker Frequency. The menu changes the value of stop frequency.
[Marker → Reference Level]
Menu description: to set the Reference Level equal to the Marker Amplitude. The menu changes the value of reference level.
[Delta Marker →Span ]
Menu description: to set the Span equaling to frequency difference of the Delta Marker. The menu changes the value of frequency span.
[Delta Marker → CF]
Menu description: to set the Center Frequency equal to frequency difference of the Delta Marker. The menu changes the value of center frequency.
4.6. Meas
[Measure Off]
Menu description: Turn off current measurement functions.
[Time Spec]
22
Tel: 886.2.2175 2930 Email: [email protected]
www.salukitec.com
Menu description: This function will provide a waterfall diagram to show the possibility of a signal. It is very helpful to do interference analysis.
[Field Strength]
Menu description: Turn on field strength function. Detailed settings to be done in [Meas Setup].
[ACPR]
Menu description: Turn on adjacent channel power rate measurement function. Detailed settings to be done in [Meas Setup]. ACPR is used to measure the power rate between the adjacent channel and the main channel.
[Channel Power]
Menu description: Turn on channel power measurement function. Detailed settings to be done in [Meas Setup]. The channel power is measured based on the channel bandwidth settings.
[OBW]
Menu description: Turn on occupied bandwidth measurement function. Detailed settings to be done in [Meas Setup]. User can set the power percent in [Meas Setup] to calculate the occupied bandwidth.
[Meas Setup]
Menu description: Settings for measurement functions. These settings are channel bandwidth, channel interval, channel qty and power percent.

24
Tel: 886.2.2175 2930 Email: [email protected]
www.salukitec.com
Press [Mode] key, following function buttons will pop out. These functions are [Track Gen], [Demod], [Trig], [Pass-
Fail], [FD].
[Track Gen]
Menu description: to enable and disable the tracking source and make tracking source output settings. Tracking source is an option of S3331 series handheld analyzer.
[Track Gen On Off]
Menu description: to enable and disable the tracking source.
[Output Level]
Menu description: to set the output power of tracking source. Setting range 0dBm - -30dBm

25
Tel: 886.2.2175 2930 Email: [email protected]
www.salukitec.com
[Network Meas]
Menu description: Network Meas is mainly used for frequency-amplitude measurement. The frequency of tracking source and the spectrum analyzer are coupled. S3331 acts as a scalar network analyzer.
[Network Meas On Off]
Menu description: Turn On Off Network measurement function
[Output Level]
Menu description: Set the output power of the tracking source
[Ref level]
Menu description: User can set the reference level for a better view.
[Normalize]
Menu description: This function is provided for user to do the calibration. Connect the RF output port to RF input port and press [Normalize]. The track will be a straight line at 0Db.
[DEMOD]
Menu Description: Audio analysis function. Support audio signal input from [FMW], [FM], [AM], [USB], [LSB], user can hear the audio output via the load speaker or a earphone.
[Demod On Off]
Menu Description: Turn On Off Audio analysis function
[Demod Mode]
Menu Description: Select the audio input
[Volume]
Menu Description: Set the volume of load speaker/earphone
[Radio]
Menu Description: Preset Radio frequencies.
[Digital DEMOD]
Menu Description: Analog demodulation functions. FM/AM are supported
[Trig]
Menu Description: Set the trigger mode. S3331 supports both internal and external trigger.
[Auto Run]
Menu Description: Free run
[Video]
Menu Description: Set the trigger mode to Video trigger
[External]

26
Tel: 886.2.2175 2930 Email: [email protected]
www.salukitec.com
Menu Description: Tigger signal from external trigger source. [POS] rising edge and [NEG] falling edge are supported.
[Pass-Fail]
Menu Description: S3331 provide a powerful Pass-fail function with [Window Meas] and [Limit Meas]
[Window Meas]
Menu Description: [Window meas] will provide 4 limit lines ( 2 vertical, 2 horizontal) and create a [Pass- Fail] window.
[Window Meas On Off]
Menu Description:Turn on/off the window meas function
[Limit Line On Off]
Menu Description: Turn on/off the horizontal limit lines ( for amplitude)
[Freq Line On Off]
Menu Description: Turn on/off the vertical limit lines ( for frequency)
[Window Sweep On Off]
Menu Description: If turn on window sweep, only the trace in the limit window is free-run, trace outside the window is hold.
[Ampt/Freq]
Menu Description: Adjust the limit line position
[Limit Meas]
Menu Description: Limit Meas provides 2 lines to set limit on amplitude. User can add or delete point on each line to make it to a user-defined mask.
[Limit Meas On Off]
Menu Description:Turn on/off the limit meas function
[Line Up On Off]
Menu Description: Turn on/off the upper line
[Line Low On Off]
Menu Description: Turn on/off the lower line
[Edit]
Menu Description: User can add/delete/move any point of the limit line to make it a user-defined mask.

27
Tel: 886.2.2175 2930 Email: [email protected]
www.salukitec.com
4.8. PEAK The [Peak] key on the front panel. is used to turn on the peak search for traces by the control instrument and turn on marker for display, including [Next Peak], [ Right Peak], [Left Peak], [Marker->CF], [Continuous Max ON OFF], [Min Search].
[Next Peak]
Menu description: Taking the Amplitude of the point where the current marker is located, search for the next peak of current test trace.
[Right Peak]
Menu description: to search for the peak to the right of the current test trace marker position.
[Left Peak]
Menu description: to search for the peak to the left of the current test trace marker position.
[Marker → CF]
Menu description: to set the Center Frequency equal to the Marker Frequency. It can quickly move the signal to the center position of the screen.
[Continuous Max On Off]
Menu description: when Continuous Max is ON, the current marker will perform one Peak Search after each sweep. If the Continuous Peak Search is OFF, no operation is made.
[Min Search]
Menu description: to turn on the Min Search.

28
Tel: 886.2.2175 2930 Email: [email protected]
www.salukitec.com
4.9. Span Press the [Span/X Axis] on the front panel to enable the span function and set the signal/spectrum analyzer into center frequency/span mode. Press the [Span] key to pop up [Span], [Full Span], [Zero Span] and [Previous Span] at the same time.
[Span]
Menu description: the span can be set by number keys, stepping keys or knob. Use number keys or select [Zero Span] to set the span as zero.
[Full Span]
Menu description: to set the signal/spectrum analyzer into the center frequency/span mode. Set the span as maximum value.
[Zero Span]
Menu description: to set span as 0Hz. It is good for observing signal at time domain, in particular, good for observation of modulating signal.
[Previous Span]
Menu description: to set the signal/spectrum analyzer back to the previous span.

29
Tel: 886.2.2175 2930 Email: [email protected]
www.salukitec.com
4.10. System
[System]
Menu description: To check system information and system log. Including serial number, device type, hardware version, network settings, power supply etc.
[Language]
Menu description: To change the language.
[Date/Time]
Menu description: To change the time settings
[PowerOn/Preset]
Menu description: To customize the preset configuration
[File]
Menu description: File operations, view/delete/export/recall a screenshot/state file/trace file.
[Save]
Menu description: Save operations, user can save screenshot, trace data and user state.
[Print]
Menu description: Print settings
[Display]
Menu description: Display settings
[Brightness]

30
Tel: 886.2.2175 2930 Email: [email protected]
www.salukitec.com
Menu description: Set the screen brightness
[Calibration]
Menu description: Calibrated the instrument
[Service]
Menu description: This function is not open for end user.
4.11. Trace Press [Trace] key on the front panel to pop up corresponding soft menu. Including: [Trace 1 2 3 4 5], [Clear Write], [Max. Hold], [Min. Hold], [Bland], [View], [Detector], [Operation ].
[Trace 1 2 3 4 5]
Menu description: to select trace. The signal/spectrum analyzer provides 5 trace lines Trace 1, Trace 2, Trace 3, Trace 4, Trace 5.
[Clear Write]
Menu description: to set the current trace processing as Clear Write, i.e., clear all data of displayed trace and continue the signal trace receipt under sweep status.
[Max. Hold]
Menu description: to set the current trace processing method as maximum hold, i.e., the new trace data will be assigned with maximum

31
Tel: 886.2.2175 2930 Email: [email protected]
www.salukitec.com
value of previous measured trace data.
[Min. Hold]
Menu description: to set the current trace processing method as minimum hold, i.e., the new trace data will be assigned with minimum value of previous measured trace data.
[Blank]
Menu description: Clear all displayed traces. Trace save in register will not be deleted.
[View]
Menu description: Hold current trace and not refresh. Easy for checking.
[Detector]
Pop up soft menus related to setting the detector type for the currently selected trace, including [Auto], [Normal], [Pos Peak], [Sample], [Neg Peak].
[Auto]
Menu description: to set the detector command for the currently selected trace as Auto. That means, the signal/spectrum analyzer will automatically select most suitable detector based on the parameter setting of currently selected trace, including trace processing method, trace average type, noise marker function, etc.
[Normal]
Menu description: to set the detector command for the currently selected trace as Normal. i.e., display the measurement results of positive peak and negative peak at the same time to achieve display effect similar to the analog instrument.
[Positive Peak]
Menu description: to set the detector command for the currently selected trace as Positive Peak. i.e., take the maximum value from sampling data assigned to each trace point.
[Sample]
Menu description: to set the detector command for the currently selected trace as Sample. i.e., take the last value from sampling data assigned to each trace point.
[Negative Peak]
Menu description: to set the detector command for the currently selected trace as Negative Peak. i.e., take the minimum value from sampling data assigned to each trace point.
[Trace Operation]
Menu description: to start up trace mathematical operation and set the methods and rules. The soft menus include [1<-->2], [2-DL->2], [2<-->3], [1->3], [2->3].
[1<-->2]
Menu description: Exchange the data in trace register 1 and trace register 2 and display
[2-DL->2]
Menu description: Data in trace register 2 minus current trace and save the result in trace register 2 and display.

32
Tel: 886.2.2175 2930 Email: [email protected]
www.salukitec.com
[2<-->3]
Menu description: Exchange the data in trace register 2 and trace register 3 and display
[1->3]
Menu description: Put data in trace register 1 into trace register 3 and display.
[2->3]
Menu description: Put data in trace register 2 into trace register 3 and display.

33
Tel: 886.2.2175 2930 Email: [email protected]
www.salukitec.com
5. Typical Operation This chapter will show how to use S3331 handheld spectrum analyzer, following functions are included:
Continuous signal measurement
Measure two signals with small frequency interval
N dB bandwidth measurement
Chanel power measurement
Occupied bandwidth measurement
Weak signal capture
Harmonic distortion measurement
TOI distortion measurement
5.1. Prepare
Press the power button to turn on S3331 handheld spectrum analyzer.
This chapter means to show the basic operations of S3331. So signal generators are used to simulate the signal source. Signal can be transmitted/received via a test cable or a pair of antennas.
Before any test, please ensure power level of input signal should not exceed +30dBm(1W), otherwise the instrument would be damaged.
5.2. Continuous Signal Measurement 1) Set S1103 signal generator to generate a 300MHz, -10dBm continuous signal. Please refer to document S1103-03-01 for more
details to set S1103 signal generator.
2) Connect S1103 signal generator output to S3331 handheld spectrum analyzer input. Or use antennas to transmit/receive the signal.
3) Preset the Instrument
Press【PRESET】 key . The instrument will return to default settings。
4) Frequency settings
Press 【FREQ】 key.Frequency menu will show on the screen.
Select [Center Frequency].
Use number keys, knob or up/down arrow key to set the center frequency to 300MHz
5) Span setting
Press【SPAN】 key . Span menu will show on the screen

34
Tel: 886.2.2175 2930 Email: [email protected]
www.salukitec.com
Select [Span]
Use number keys,knob or up/down arrow key to set span to 5MHz
By now the signal is show in the screen as shown in figure 4-1.
6) User a marker to measure the frequency and amplitude of the signal
Press【Marker】 key→[Marker]→1,activate Marker1.
Press 【Peak】 key, the marker will be moved to signal peak automatically. Marker information will be shown in up-right corner.
7) Readout the test result
Fig 4-1: Continuous signal Test result
5.3. Measure two signals with small frequency interval Signal resolution is determined by the resolution bandwidth (RBW). When a signal passes through the filter, the spectrum analyzer will use the signal to sweep and display the band pass shape of the IF filter. So, when the spectrum analyzer receives two signals with equal amplitude and close frequency interval, the top of one band-pass filter waveform nearly covers another one, making two signals like one. If two signals of different amplitudes but close frequency interval, small signals may be totally hidden by large signals.
5.3.1. Resolving Two Signals of Equal Amplitude
Generally, to resolve two signals of equal amplitude, the resolution bandwidth must be less than or equal to the frequency interval of the two signals. For example, to resolve two signals of equal amplitude and a frequency interval of 100 kHz, the resolution bandwidth of the spectrum analyzer should be set less than or equal to 100 kHz.
Example Take measuring two signals of equal amplitude with a frequency interval of 100kHz as an example, the measurement steps are as follows:
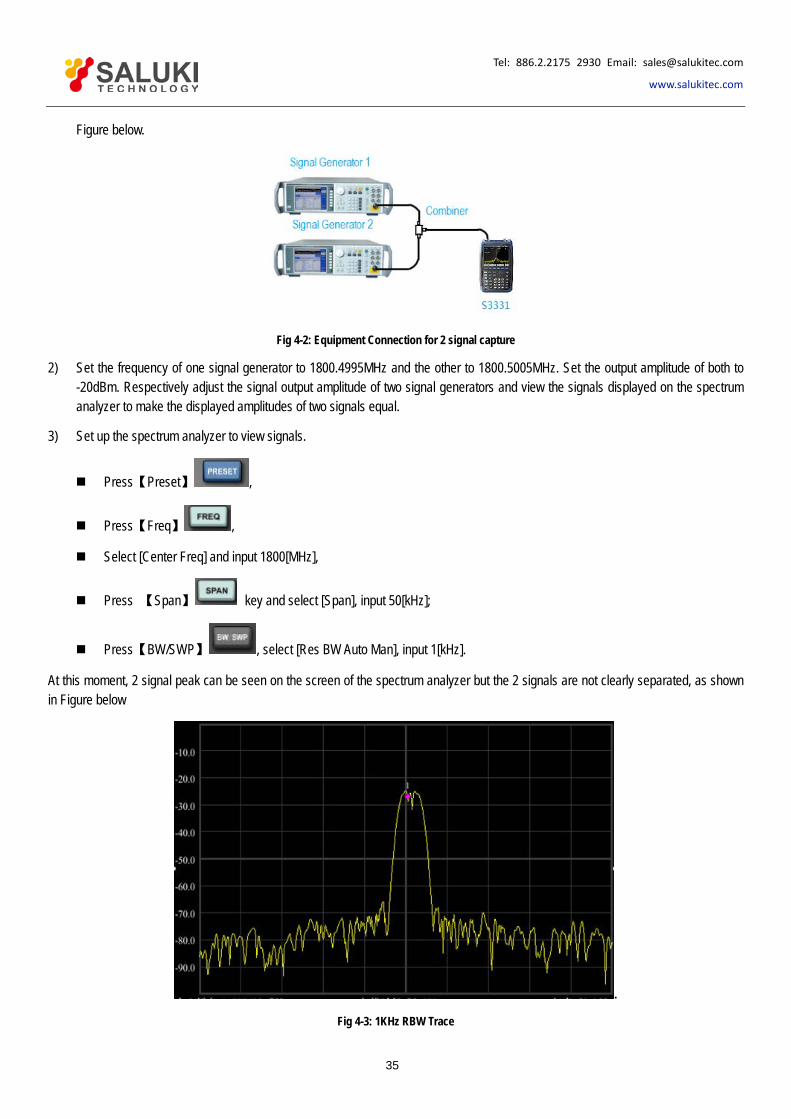
1) Connect the outputs of two signal generators to the spectrum analyzer RF input port using a T-shaped connector, as shown in
35
Tel: 886.2.2175 2930 Email: [email protected]
www.salukitec.com
Figure below.
Fig 4-2: Equipment Connection for 2 signal capture
2) Set the frequency of one signal generator to 1800.4995MHz and the other to 1800.5005MHz. Set the output amplitude of both to -20dBm. Respectively adjust the signal output amplitude of two signal generators and view the signals displayed on the spectrum analyzer to make the displayed amplitudes of two signals equal.
3) Set up the spectrum analyzer to view signals.
Press【Preset】 ,
Press【Freq】 ,
Select [Center Freq] and input 1800[MHz],
Press 【Span】 key and select [Span], input 50[kHz];
Press【BW/SWP】 , select [Res BW Auto Man], input 1[kHz].
At this moment, 2 signal peak can be seen on the screen of the spectrum analyzer but the 2 signals are not clearly separated, as shown in Figure below
.
Fig 4-3: 1KHz RBW Trace

36
Tel: 886.2.2175 2930 Email: [email protected]
www.salukitec.com
4) Optimize the test result. Lower the RWB to 100kHz.
Press【BW/SWP】 , [Res BW Auto Man], input 100[Hz]
Then the 2 signals are clearly shown in screen as shown in figure below
Fig 4-4: 100Hz RBW Trace
5.3.2. Resolving Signals of Different Amplitudes
To resolve two signals of different amplitudes, the resolution bandwidth must be equal to or less than the frequency interval of the two signals (same as resolving two signals of equal amplitude). But the maximum resolution bandwidth for resolving two signals with different amplitudes mainly depends on the squareness factor of IF filters other than the bandwidth 3dB.
Squareness factor is defined as the ratio of 60dB bandwidth to 3dB bandwidth of the intermediate frequency filter, as shown in Figure below.
Figure 4-5 Schematic of Bandwidth and Squareness Factor
Example Take resolving two signals of different amplitudes with frequency difference of 50 kHz and amplitude drop of 40dB as an example to

37
Tel: 886.2.2175 2930 Email: [email protected]
www.salukitec.com
explain the testing steps:
1) As shown in Figure 3-5, connect the outputs of two signal generators to the spectrum analyzer input.
2) Set the frequency of one signal generator to 1800MHz and amplitude to -10dBm. Set the frequency of the other signal generator to 1800.05MHz and signal output amplitude to -50dBm. Turn on the RF outputs of the two signal generators.
3) Set the spectrum analyzer to observe the signal:
Press【Preset】 ;
Press【Freq】 , [Center Freq], 1800.025[MHz].
Press【Span】 , 500[kHz].
Press【BW/Swp】 , [Res BW Auto Man], 30[kHz].
The squareness factor of the resolution bandwidth filter of S3331 Handheld Microwave Spectrum Analyzer is 5:1, when the resolution bandwidth is 30kHz, the bandwidth on 60dB point is 115kHz, the half bandwidth is 57.5kHz, which is wider than the frequency interval of 50kHz, so the two input signals cannot be resolved, as shown in Figure 4-6.
Figure 4-6: 30KHz RBW
4) Reduce the resolution bandwidth to view the small signals hidden.
Press【BW/SWP】 , [Res BW Auto Man], 1[kHz].
At this moment, the half bandwidth is narrower than the frequency interval of 50 kHz, so the two input signals can be resolved. The two signals could be clearly seen on the screen.
5) Read the frequency difference and amplitude difference by the marker.
Press【Peak】 and put the marker on the peak of the large signal;
Press【Marker】 , [Delta], to enable the delta marker;

38
Tel: 886.2.2175 2930 Email: [email protected]
www.salukitec.com
Press【Peak】 , [Next Peak] to put the delta marker on the peak of small signal.
Now, the frequency difference and amplitude difference of the two signals with difference amplitudes can be read, as shown in following figure.
Figure 4-7: 1KHz RBW
5.4. N dB Bandwidth Measurement Following example uses a S1103 signal generator and generates a 500MHz, -10dBm continuous signal.
Example 1) Connect the signal generator output port to S3331 RF test port.
2) Press 【Preset】 key to return the instrument to default status
3) Set test frequency.
Press 【FREQ】 key
Select [Center FREQ] and input 500MHz
Press 【SPAN】 key
Select [Span] and input 1MHz
4) Press 【BW/SWP】 key,
Select [Res BW Auto Man] and input 30kHz.
Now the signal trace is displayed on screen as shown in following figure.
5) Press 【Marker】 key, select [Next Page], select [Marker Function]

39
Tel: 886.2.2175 2930 Email: [email protected]
www.salukitec.com
6) Select [NdB On Off], turn on the NdB bandwidth measure function. The default value of NdB is 3dB. The value can be changed by selecting [NdB] and input the required value.
7) Read out the result
Figure 4-8: 3dB Bandwidth Test Result
5.5. Adjacent Channel Power Following example uses a S1103 signal generator and generates a 500MHz, -10dBm continuous signal.
Example 1) Connect the signal generator output port to S3331 RF test port.
2) Press 【Preset】 key to return the instrument to default status
3) Set test frequency.
Press 【FREQ】 key
Select [Center FREQ] and input 500MHz
4) Press 【Meas】 key.Select [Adjacent Power]
The trace will be displayed as shown in the figure below.
5) Read out the result
40
Tel: 886.2.2175 2930 Email: [email protected]
www.salukitec.com
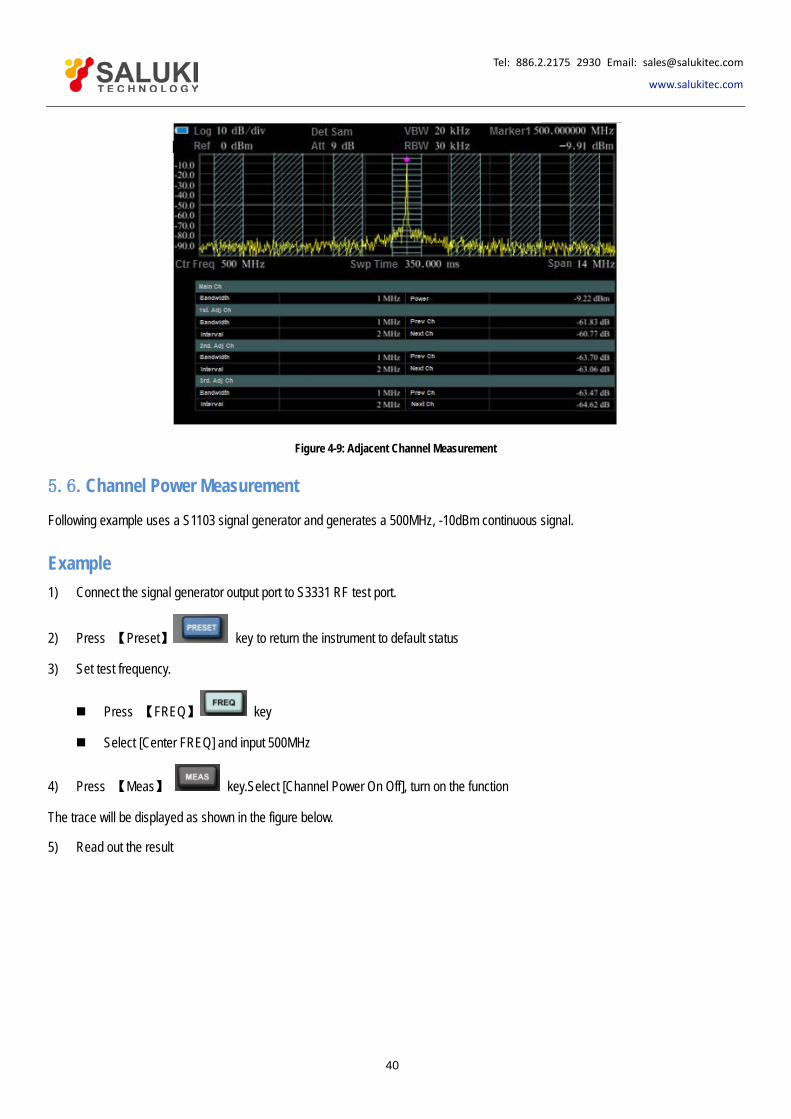
Figure 4-9: Adjacent Channel Measurement
5.6. Channel Power Measurement Following example uses a S1103 signal generator and generates a 500MHz, -10dBm continuous signal.
Example 1) Connect the signal generator output port to S3331 RF test port.
2) Press 【Preset】 key to return the instrument to default status
3) Set test frequency.
Press 【FREQ】 key
Select [Center FREQ] and input 500MHz
4) Press 【Meas】 key.Select [Channel Power On Off], turn on the function
The trace will be displayed as shown in the figure below.
5) Read out the result
41
Tel: 886.2.2175 2930 Email: [email protected]
www.salukitec.com
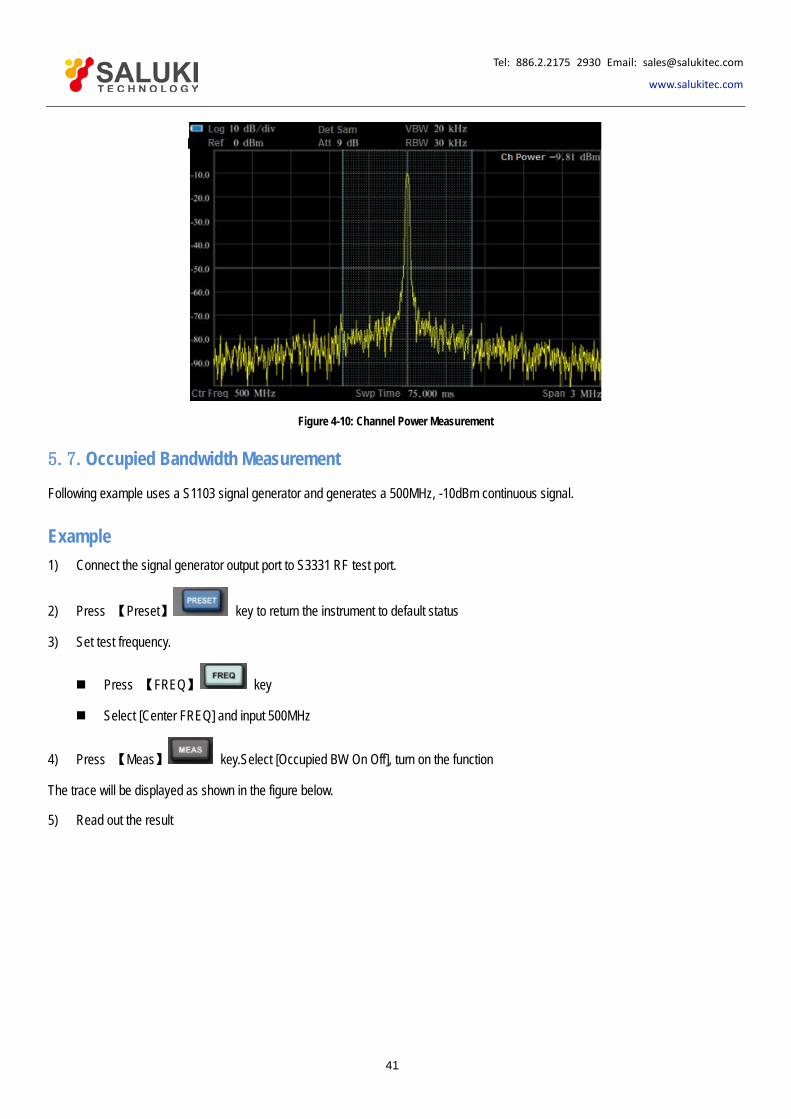
Figure 4-10: Channel Power Measurement
5.7. Occupied Bandwidth Measurement Following example uses a S1103 signal generator and generates a 500MHz, -10dBm continuous signal.
Example 1) Connect the signal generator output port to S3331 RF test port.
2) Press 【Preset】 key to return the instrument to default status
3) Set test frequency.
Press 【FREQ】 key
Select [Center FREQ] and input 500MHz
4) Press 【Meas】 key.Select [Occupied BW On Off], turn on the function
The trace will be displayed as shown in the figure below.
5) Read out the result
42
Tel: 886.2.2175 2930 Email: [email protected]
www.salukitec.com
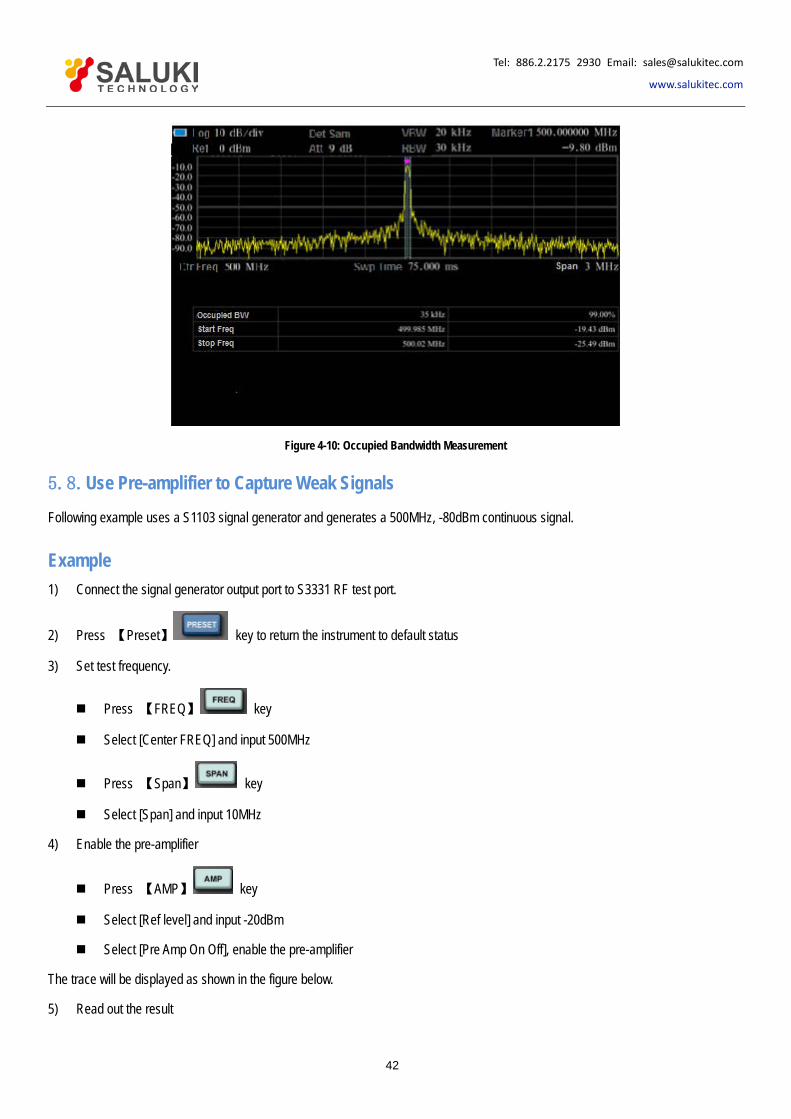
Figure 4-10: Occupied Bandwidth Measurement
5.8. Use Pre-amplifier to Capture Weak Signals Following example uses a S1103 signal generator and generates a 500MHz, -80dBm continuous signal.
Example 1) Connect the signal generator output port to S3331 RF test port.
2) Press 【Preset】 key to return the instrument to default status
3) Set test frequency.
Press 【FREQ】 key
Select [Center FREQ] and input 500MHz
Press 【Span】 key
Select [Span] and input 10MHz
4) Enable the pre-amplifier
Press 【AMP】 key
Select [Ref level] and input -20dBm
Select [Pre Amp On Off], enable the pre-amplifier
The trace will be displayed as shown in the figure below.
5) Read out the result

43
Tel: 886.2.2175 2930 Email: [email protected]
www.salukitec.com
Figure 4-11: Pre-amplifier On Measurement
5.9. Harmonic Distortion Measurement Following example uses a S1103 signal generator and generates a 300MHz, -10dBm continuous signal.
Example 1) Connect the signal generator output port to S3331 RF test port.
2) Press 【Preset】 key to return the instrument to default status
3) Set test frequency.
Press 【FREQ】 key
Select [Start FREQ] and input 200MHz
Select [Stop FREQ] and input 1GHz
The trace will be displayed as shown in the figure below. There are 3 peaks, signal, the second harmonic and the third harmonic.
4) Use 【Peak】 and 【Marker】 keys to do the analyze.
Press 【Peak】 key, S3331 will search the MAX value and mark it with a marker 1. In this example, the marker 1 is located at 300MHz and -10dBm signal which is the input signal.
Press 【Marker】 key
Select [Delta], a Marker 2 is activated and it is a Delta marker, the reference marker is Marker 1.
Press 【Peak】 key. Then Marker 2 will be located to the second harmonic. Read out the frequency and amplitude

44
Tel: 886.2.2175 2930 Email: [email protected]
www.salukitec.com
difference.
Press 【Peak】 key and select [Next Peak], then marker 2 will move to the third harmonic. Read out the frequency and amplitude difference.
Fig4-12: Harmonic Distortion Measurement
5.10. TOI Distortion Measurement In following example, use 2x signal generator to generate a 500MHz, -10dBm Sine signal and a 501MHz, -10dBm sine signal.
Example 1) Connect the outputs of two signal generators to the spectrum analyzer RF input port using a T-shaped connector, as shown in
Figure below.
Fig 4-13: TOI Distortion Measurement Connection
2) Press 【Preset】 key to return the instrument to default status
3) Set test frequency.
Press 【FREQ】 key

45
Tel: 886.2.2175 2930 Email: [email protected]
www.salukitec.com
Select [Ctr FREQ] and input 500MHz
Press 【SPAN】 key
Select [SPAN] and input 5MHz
Press 【BW/SWP】 key
Select [Res BW Auto Man] and input 1kHz
4) Use 【Peak】 and 【Marker】 keys to do the analyze.
Press 【Peak】 key, S3331 will search the MAX value and mark it with a marker 1.
Press 【Marker】 key
Select [Delta], a Marker 2 is activated and it is a Delta marker, the reference marker is Marker 1.
Press 【Peak】 key. Select [Next Peak].
5) Readout the value of Marker 2. It is the TOI distortion
Fig 4-14: TOI Distortion Measurement
46
Tel: 886.2.2175 2930 Email: [email protected]
www.salukitec.com
6. Remote Control User can program the S3331 via the standard SCPI (Standard Commands for Programmable Instruments) command. For a detailed description of the commands and programming, refer to Appendix A S3331 Handheld Spectrum Analyzer Programming manual.
Users can also use the the PC software (SA Remote Control) provided by Saluki to get remote access to S3331 via LAN or USB port.
When S3331 is connected to controller, all operations should be done on controller. The keys on S3331 will not work. When disconnect S3331 from the controller, press ESC key to unlock other keys.
6.1. OS supported USB connection: Win XP, Win 7(32bit)
LAN connection: Win XP, Win 7(32bit/64bit)
6.2. Software Installation Procedures
1.Copy the installation file zip pack into controller or a PC and un-zip it.
Saluki provide 2 installation for different Operation Systems
SALUKI SARemoteControl_x64 for Windows 7 64bit
SALUKI SARemoteControl_x86 for Windows 7 32 bit or Windows XP.
User may select the installation file based on their own operation system.
2.Open the folder and following items are contained in it.
DotNetFX40 is the netframe work 4.0, if the controller already have framework 4.0 or higher revision installed, user do not need to install it.
WindowsInstaller3_1 is NI VISA support. It is a necessary component of the software
SALUKI SARemoteControl: The installation file of the software.
Setup: double click this file, it will run and detect the installation environment. Then install the software automatically.
3.Double click the “setup” file, following window pops out. Click “Next”

47
Tel: 886.2.2175 2930 Email: [email protected]
www.salukitec.com
4.In following window, browse the folder to install the software, then click “Next”
48
Tel: 886.2.2175 2930 Email: [email protected]
www.salukitec.com
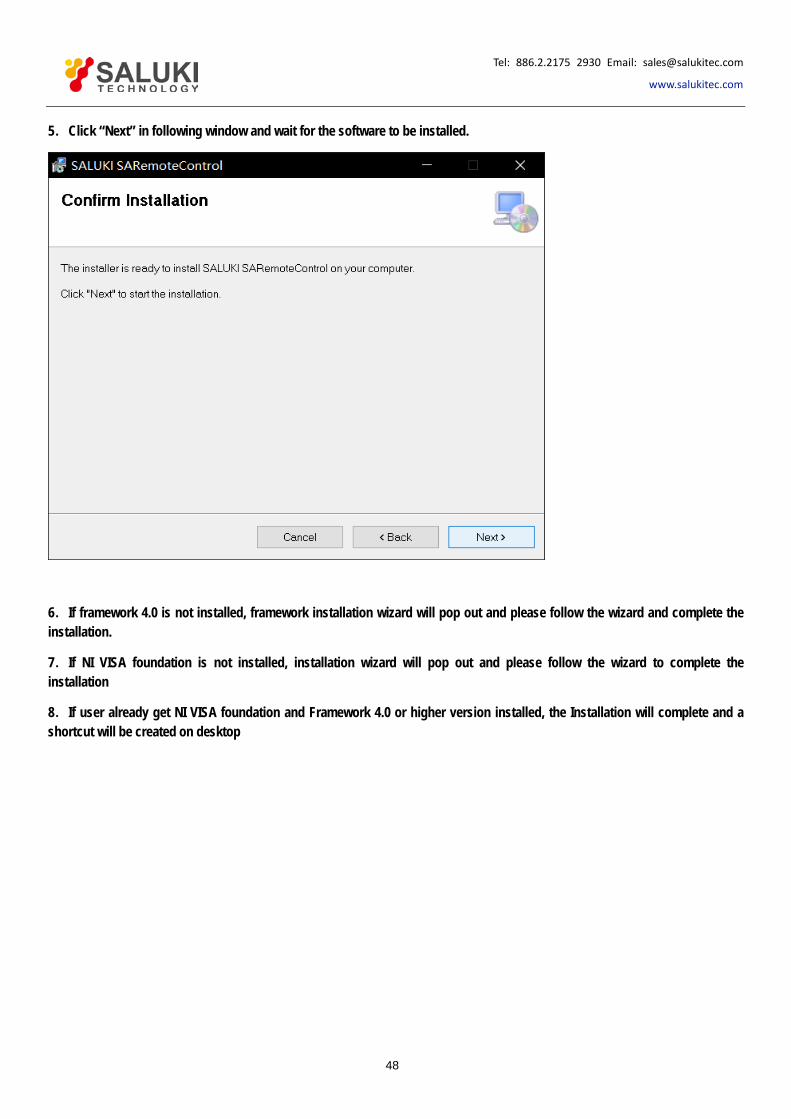
5.Click “Next” in following window and wait for the software to be installed.
6.If framework 4.0 is not installed, framework installation wizard will pop out and please follow the wizard and complete the installation.
7.If NI VISA foundation is not installed, installation wizard will pop out and please follow the wizard to complete the installation
8.If user already get NI VISA foundation and Framework 4.0 or higher version installed, the Installation will complete and a shortcut will be created on desktop

49
Tel: 886.2.2175 2930 Email: [email protected]
www.salukitec.com
6.3. Connection
6.3.1. USB Port Connection
S3331 series handheld spectrum analyzer can be connected to a controller via USB port. This function supports Window XP and Windows 7 32bit/64bit operation system. More OS will be supported in future. The USB connection support SCPI command control only.
9.Connect S3331 to PC via USB port
Connect the USB A type port( photo below) on the top of the instrument to a PC
10.Install the USB driver
When S3331 is connected to PC, a driver installation window will pop out. If the driver window is not pop out, please open the device manager, and find the USB device with a yellow triangle sign with an exclamation in it. Right click it and load the driver manually. All USB drivers are saved in the installation directory folder. (default path is C:\Program Files (x86)\SALUKI\SALUKI SARemoteControl\USB Driver\usb2030). Please select the driver based on your operation system.

50
Tel: 886.2.2175 2930 Email: [email protected]
www.salukitec.com
11.Check the device status
Open Device manager and check the device status. If the driver is installed successfully, it will under NI-VISA USB devices, please see the screen shot below:
12.Telecommunication
Double click SARemoteControl software. Select USB table and click connect. No warning pops out and S3331 is connected. User can type in SCPI command to control or fetch data.
6.3.2. LAN connection
S3331 can be connected to LAN, user can use the Saluki remote control software to manage S3331. LAN connection not only provide SCPI command control, but also provide a UI. It is a mapping of the keys and display of the S3331.
1.Connect S3331 into LAN
Use CAT6 cable connect S3331 to a LAN or to PC directly.
2.Set PC and S3331 in the same sub-network
For example, set IP address to 192.168.1.1 (255.255.255.0), set S3331 IP address to 192.168.1.2 (255.255.255.0)
3.Double click the software icon
Fill S3331 IP address, use default port number and delay. Then click “Connect”
6.4. UI Saluki SA Remote Control software provides 2 method for remote control.
SCPI command (USB connection can only use this way)
Keys and display (LAN connection only)
51
Tel: 886.2.2175 2930 Email: [email protected]
www.salukitec.com
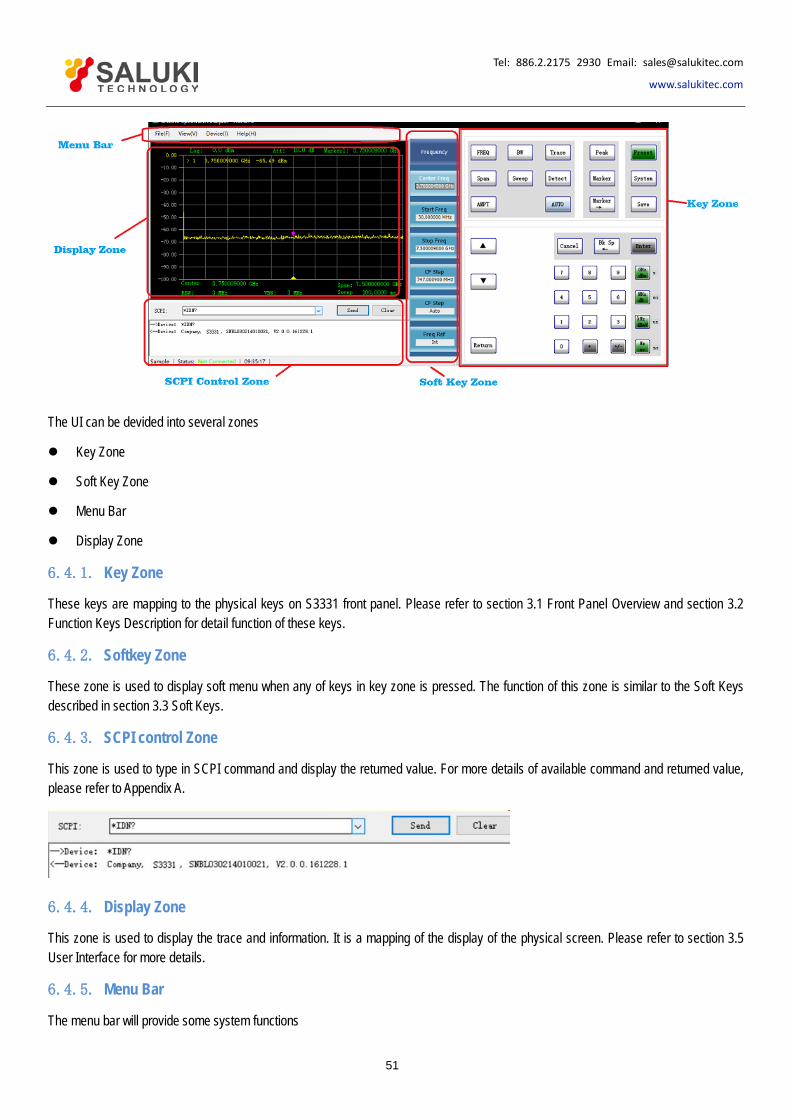
The UI can be devided into several zones
Key Zone
Soft Key Zone
Menu Bar
Display Zone
6.4.1. Key Zone
These keys are mapping to the physical keys on S3331 front panel. Please refer to section 3.1 Front Panel Overview and section 3.2 Function Keys Description for detail function of these keys.
6.4.2. Softkey Zone
These zone is used to display soft menu when any of keys in key zone is pressed. The function of this zone is similar to the Soft Keys described in section 3.3 Soft Keys.
6.4.3. SCPI control Zone
This zone is used to type in SCPI command and display the returned value. For more details of available command and returned value, please refer to Appendix A.
6.4.4. Display Zone
This zone is used to display the trace and information. It is a mapping of the display of the physical screen. Please refer to section 3.5 User Interface for more details.
6.4.5. Menu Bar
The menu bar will provide some system functions

52
Tel: 886.2.2175 2930 Email: [email protected]
www.salukitec.com
6.4.5.1. File
Save image
It can be used to save the current display as a picture and save locally.
6.4.5.2. View
View menu is used to set the display of each function zone of the software. For example if Ctrl, SCPI and
Virtualkey is unpicked, the software UI will be like following screenshot and gives a better view for Uset to observe
the measurement result

53
Tel: 886.2.2175 2930 Email: [email protected]
www.salukitec.com
6.4.5.3. Device
Device menu is main used to control the connection
6.4.5.4. Help
Help menu is used to get the software information

55
Tel: 886.2.2175 2930 Email: [email protected]
www.salukitec.com
7. Trouble Shooting
7.1. Start S3331 but the screen does not light. Please following the procedures below
1. Check whether the fan is running:
If the fan runs normally, it is possible that the display cable is loose. Please contact Saluki.
If the fan does not run, the instrument does not start normally. In this case, check steps (2), (3) or (4).
2. If using battery powered: Make sure the battery is in good condition and installed correctly.
3. If the instrument is powered via adapter: Make sure the power adapter model is correct and working well.
4. If the power is ok, but the instrument does not work, the fuse inside may be burned. Please contact Saluki.
7.2. Keys not respond or the response is incorrect: 1. If all the keys are not responding, it is possible that the keyboard cable is loose.
2. If the key value is wrong, there may be damage on keyboard, please contact Saluki to repair.
7.3. No signal display after normal power on: If the monitor does not display the signal, please follow the steps below:
1. Connect 10MHz reference outputs port to RF input port
2. If there is no signal Display, there may be machine hardware failure, please contact the manufacturer to solve.
7.4. The frequency of the signal display is not accurate: During the measurement, the read signal frequency exceeds the acceptable error range or the signal is shaking on the display:
1. Check if the input signal is stable, and if so, check in step 2.
2. Check whether the internal and external reference of the spectrum analyzer is normal, and select the reference for internal reference or external reference according to different test conditions: Press 【Frequency】 [Frequency reference internal external]
3. If the problem is not solved, please contact Saluki.
7.5. The amplitude of the signal is not accurate: The amplitude of the signal is inaccurate
Recalibration: Set a signal generator frequency 440MHz, power -20dBm, connect this signal to the RF analyzer RF input port, click: 【System】 [Next] [Next] [User calibration] [Start calibration].
If the problem is not solved after recalibration, please contact Saluki
56
Tel: 886.2.2175 2930 Email: [email protected]
www.salukitec.com
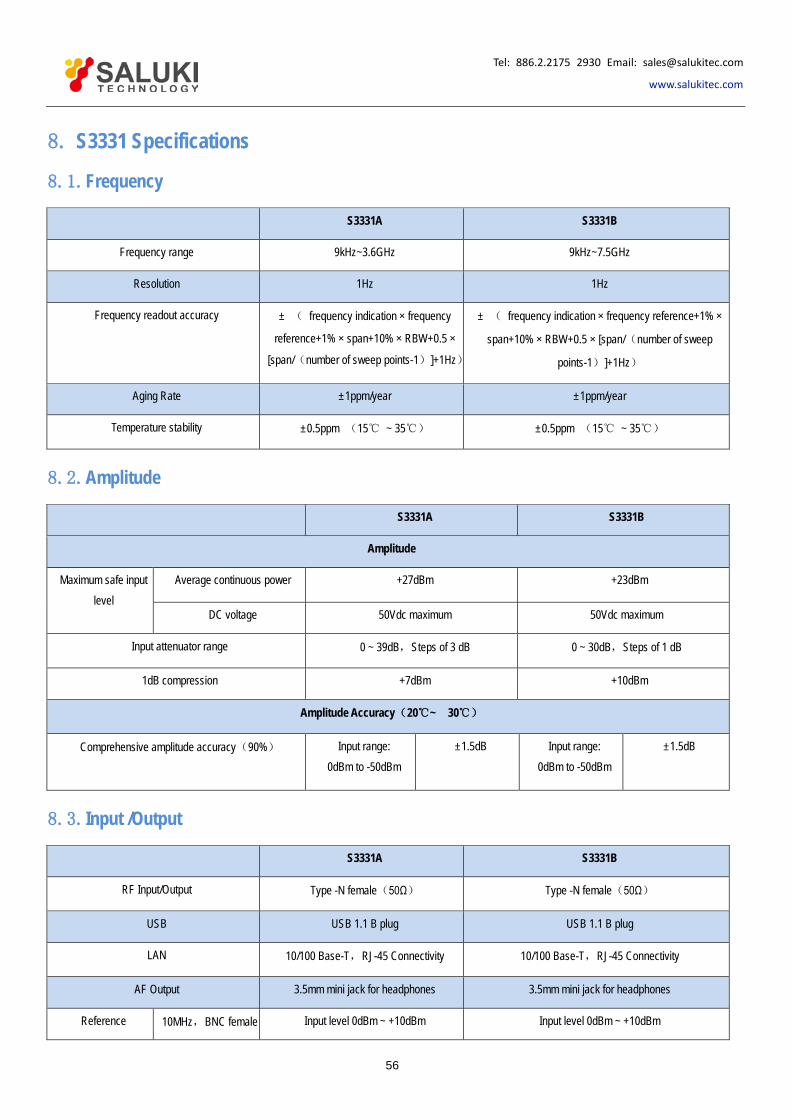
8. S3331 Specifications
8.1. Frequency
S3331A S3331B
Frequency range 9kHz~3.6GHz 9kHz~7.5GHz
Resolution 1Hz 1Hz
Frequency readout accuracy ± ( frequency indication × frequency
reference+1% × span+10% × RBW+0.5 ×
[span/(number of sweep points-1)]+1Hz)
± ( frequency indication × frequency reference+1% ×
span+10% × RBW+0.5 × [span/(number of sweep
points-1)]+1Hz)
Aging Rate ±1ppm/year ±1ppm/year
Temperature stability ±0.5ppm (15℃ ~ 35℃) ±0.5ppm (15℃ ~ 35℃)
8.2. Amplitude
S3331A S3331B
Amplitude
Maximum safe input level
Average continuous power +27dBm +23dBm
DC voltage 50Vdc maximum 50Vdc maximum
Input attenuator range 0 ~ 39dB,Steps of 3 dB 0 ~ 30dB,Steps of 1 dB
1dB compression +7dBm +10dBm
Amplitude Accuracy(20℃~ 30℃)
Comprehensive amplitude accuracy(90%) Input range: 0dBm to -50dBm
±1.5dB Input range: 0dBm to -50dBm
±1.5dB
8.3. Input /Output
S3331A S3331B
RF Input/Output Type -N female(50Ω) Type -N female(50Ω)
USB USB 1.1 B plug USB 1.1 B plug
LAN 10/100 Base-T,RJ-45 Connectivity 10/100 Base-T,RJ-45 Connectivity
AF Output 3.5mm mini jack for headphones 3.5mm mini jack for headphones
Reference 10MHz,BNC female Input level 0dBm ~ +10dBm Input level 0dBm ~ +10dBm

57
Tel: 886.2.2175 2930 Email: [email protected]
www.salukitec.com
S3331A S3331B
input/output Output level 0dBm±2dB Output level 0dBm±2dB
Trig input BNC female 5V TTL(±10V,100mA maximum) 5V TTL(±10V,100mA maximum)
8.4. RBW
S3331A S3331B
Range 1Hz - 500kHz, 1MHz, 3MHz 1Hz - 500kHz, 1MHz, 3MHz
Resolution filter shape factor(60dB/3dB) <5:1 (Typ.) <5:1 (Typ.)
Accuracy <5% (Typ.) <5% (Typ.)
Video bandwidth (VBW) 10Hz - 3MHz 10Hz - 3MHz
8.5. DANL
S3331A S3331B
Frequency Preamp off Preamp on Preamp off Preamp on
100kHz ~ 1MHz <-100dBm-3×(f/100kHz)dB <-120dBm-3×(f/100kHz)dB <-95dBm-3×(f/100kHz)dB <-110dBm-3×(f/100kHz)dB
1MHz ~ 10MHz <-130dBm <-150dBm <-125dBm <-140dBm
10MHz ~ 1GHz <-135dBm <-155dBm <-133dBm <-148dBm
1GHz ~ 3.4GHz <-130dBm <-148dBm <-130dBm <-143dBm
3.4GHz - 3.6GHz <-130dBm <-148dBm <-130dBm <-143dBm
3.6GHz - 5GHz - - <-133dBm <-145dBm
5GHz - 7.5GHz - - <-127dBm <-138dBm
8.6. Phase Noise
S3331A S3331B
SSB phase noise (RBW=1kHz,Sample detector,Trace avgerage≥10)
CF=500MHz Carrier offset 30kHz -90dBc/Hz Carrier offset 30kHz -80dBc/Hz
Carrier offset 100kHz -100dBc/Hz Carrier offset 100kHz -90dBc/Hz
Carrier offset 1MHz -110dBc/Hz Carrier offset 1MHz -110dBc/Hz

58
Tel: 886.2.2175 2930 Email: [email protected]
www.salukitec.com
8.7. Sweep Time
S3331A S3331B
Sweep time
Full Span 3ms ~ 3000s 3ms ~ 3000s
zero span 1ms ~ 3000s 1ms ~ 3000s
Sweep mode Continuous,single Continuous,single
8.8. Spurious Response
S3331A S3331B
TOI >30MHz +13dBm +15dBm
SHI +30dBm +40dBm
Input related spurious <-60dBc <-60dBc
Inherent residual response <-85dBm <-85dBm
8.9. Tracking Generator (Option)
S3331A S3331B
Frequency range 100kHz - 1.5GHz 100kHz - 3.2GHz
Output level -30dBm To 0dBm Stepped by 1 dB -30dBm To 0dBm Stepped by 1 dB
Output flatness ±3dB ±3dB
8.10. General S3331A S3331B
Display 6.5 inch TFT LCD 6.5 inch TFT LCD
Resolution 600*480 Resolution 600*480
Dimensions 288(H)×182(W)×142(D)mm 288(H)×182(W)×142(D)mm
Weight 2.8kg (Including battery) 3kg (Including battery)
Operating Temperature range 0℃ to 50℃ 0℃ to 50℃
Storage Temperature range -20℃ to +70℃ -20℃ to +70℃
Power Battery Capacity 7.4V 6600mAh Capacity 7.4V 6600mAh
Supply time About 4 hours Supply time About 3.5 hours
Charging time About 4 hours Charging time About 4 hours

59
Tel: 886.2.2175 2930 Email: [email protected]
www.salukitec.com
S3331A S3331B
Power adapter Input Voltage 100V~240V 50/60Hz 1.5A Input Voltage 100V~240V 50/60Hz
1.5A
Output Voltage 9V 4000mA Output Voltage 9V 4000mA
60
Tel: 886.2.2175 2930 Email: [email protected]
www.salukitec.com
Appendix A:
S3331 Handheld Spectrum Analyzer Programming Manual