Embed Size (px)
Citation preview

S2M The economics of Australia’s small-to-medium visual arts sector

Executive SummaryIntroduction and BackgroundSurveying the Small-to-Medium (S2M) Visual Arts Sector in AustraliaMeet the S2M OrganisationsSurvey Results — OutputsPeopleRevenueSpendingCase StudiesComparison with Major GalleriesConclusionReferencesAppendix — Survey
31334
38535966788091939597
TABLE OF CONTENTS
© National Association for the Visual Arts, 2017
Rod Campbell, Cameron Murray, Sam Brennan, Jordie PettitS2M: The economics of Australia’s small-to-medium visual arts sector
ISBN: 978-0-9585474-5-1
Economists at LargeMelbourne, AustraliaPhone: +61 3 9005 0154Email: [email protected]: ecolarge.com
National Association for the Visual Arts (NAVA)PO Box 60Potts Point NSW 1335Phone: +61 2 9368 1900Email: [email protected]: visualarts.net.au
This project is an initiative of the National Association for the Visual Arts and has been supported by the City of Sydney.
Front cover: Contemporary Art Centre of South Australia, Richard Bell, Morphett Street Mural, production view, 2016. Photo: Marie Falcinella

EXECUTIVE SUMMARY
Key points
1 // Art shapes the preferences and views of the community, influencing patterns of consumption and production, and therefore has an important economic role.
2 // ‘Art literacy’ has similar public benefit to that of text literacy and numeracy in providing the value that comes from having an educated public.
3 // The arts function like an ecosystem with diverse types of interdependent organisations. Australia’s small-to-medium (S2M) visual arts sector (which itself consists of different types of organisations that perform a variety of functions) is an essential element in supporting the production, distribution and appreciation of contemporary Australian art.
4 // The S2M sector is producing more art, supporting more artists and engaging with wider and more diverse audiences than ever before.
5 // The S2M sector facilitates the production of four times as many new works as the major galleries commission and acquire, but operates on little more than a quarter of their budgets.
6 // Arts funding for the S2M sector has not kept pace with inflation and population growth, let alone the increased outputs of the sector and the demands placed upon it.
7 // These increased pressures have seen declining numbers of full time arts professionals and the casualisation of the sector’s workforce. Arts professionals are paid a fraction of average earnings, generally well below recommended industry rates.
EXECUTIVE SUMMARY 3 || 4
8 // These trends predate recent federal government funding cuts and will be exacerbated by them. Federal funding cuts affect a number of well-known organisations that are the link between communities, artist-run initiatives and major national and international galleries and art events (including biennales and art fairs).
9 // Cuts to federal funding of these organisations:
+ Reduce their ability to support and promote Australia’s most talented artists
+ Exacerbate already intense competition for state and local government funding and other revenue
+ Impact adversely on the organisations that promote early stage artists and also on the major arts organisations
+ Diminish the public’s access to Australian art.
10 // Arts funding policy needs to be developed in a coordinated way between the three levels of government and other funders and informed by close consultation with the arts sector. Policy makers need to understand the different roles, outputs and support structures of different S2M arts organisations.
11 // This report provides extensive quantitative data to assist in this policy development process.

EXECUTIVE SUMMARY
Recommendations
1 // Restore the federal arts budget to reverse recent cuts and the 17.5% decline in real per capita arts spending between 2008 and 2013. This increase would recognise the importance of the organisations that rely most on federal funding, the role they play in the arts ecosystem and the value that arts and cultural industries provide in a changing economic and social environment
2 // At an absolute minimum, mandate that arts funding from all levels of government keeps pace with inflation and population growth
3 // Recognise the erosion of baseline funding to the visual arts and craft sector since 2003 and commission analysis similar to the 2002 Myer Inquiry which led to the Visual Arts and Craft Strategy (VACS) including an increase in funding
4 // Ensure the non-politicisation of arts funding with decisions made at arms’ length from governments. This applies not just to the federally-funded Australia Council, but also to state and local-government funding, where some innovative governance arrangements are already in place
5 // Work to achieve co-ordination across the three levels of government so that financial and other sorts of support are complementary and respond appropriately to the different models of organisation in the S2M sector
6 // Work towards parity of state/territory funding for the visual arts, at least at $6 per capita per year
7 // Ensure that funding of S2M arts organisations keeps pace with the expectations put on these organisations. Currently, funding bodies are pushing for greater and more diverse public outputs without a concomitant increase in funding or provision of human resources to enable these organisations to build their capacity appropriately
8 // In assessing the value delivered by the S2M sector, move away from a focus on numbers of events held and event attendance as measures of success and towards measures such as the development and distribution of Australian content and appropriate payments to artists according to industry standards
9 // Ensure that S2Ms are sufficiently well resourced to pay staff at least at the wage levels recommended in the Code of Practice for the Professional Australian Visual Arts, Craft and Design Sector, published by NAVA, which sets national best practice standards for the sector. Current wages in the S2M sector are at the bottom end of recommended levels
10 // Allocate $5 million per year to support S2M public galleries to meet arts industry standards in the payment of artists’ fees
11 // Find additional effective ways to provide operational support to artist run initiatives (ARIs) which play a crucial role in the career development of Australian artists, but often have short organisational lives due to an over-reliance on volunteer labour
12 // At local and state government level, make a commitment to ensure suitable cultural space for S2Ms is provided in new urban development
13 // Recognise the value delivered by S2Ms at a local level through providing in-kind assistance and finding ways to apply regulations to ensure S2Ms are able to fulfil their functions effectively
14 // Restore the role of the ABS in providing annual statistical data and analysis of the arts sector.
Australia is one of the richest countries in the world, at one of the richest points in our history. If ever there has been a community able to develop its artistic potential, it is us. It is essential that governments demonstrate an understanding of the S2M sector and the different roles the sector plays
in the careers of artists and the cultural life of the community. To enhance the capacity of S2Ms to play their vital role in shaping our culture, identity and preferences, arts policies by all three levels of government must:
Major changes are occurring in arts funding in Australia. These changes are occurring largely in the absence of detailed information on what arts organisations actually do and how they finance these activities. This report provides data on the small-to-medium (S2M) visual arts sector, based on a survey of 79 organisations from around Australia. The report has been commissioned by the National Association for the Visual Arts (NAVA), the peak body for the Australian visual arts sector.
The S2M sector is crucial to Australian art. It is S2M organisations that support the production of almost all of Australia’s contemporary visual art and present and promote that art to its initial audiences. While major galleries generally display the work of well-known, established artists both living and dead, S2M organisations assist the production, presentation and critical discussion of new art and develop the careers of living Australian artists. In 2016, we estimated the 250 main organisations that make up the S2M sector will have:
• assisted the production of almost 26,000 new works of art
• supported over 7,000 artists• held over 13,000 exhibitions and events• run 15,000 workshops and classes• received 6.2 million visits.
This will have been achieved with just:
• 583 full time staff, 599 part time staff and 848 casual staff
• 7,772 volunteers who provide over 278,000 hours of volunteer time, worth $17 million
• total revenue of around $103 million, consisting of:
o $42 million from local governmentso $19 million from state governmentso $12 million from federal governmento $30 million from other sources.
To put the funding of the S2M sector in context, the $103m revenue that funds new visual art is equivalent to:
• around 0.03% of the $360 billion Australian Federal budget
• less than 1/3 the $368 million revenue of Australia’s major galleries
• about equal to the $100 million 2016 revenue of the National Gallery of Victoria
• less than 1/5 of the $553 million NSW will raise from traffic fines and other penalties this year.
From an economic perspective, public funding of art is important for several reasons. Art shapes the preferences and views of the community; this is precisely why so much art and design work is commissioned by the advertising industry. Nearly all economic theories and models rest on the idea that people have rational and consistent preferences for the goods and services they consume and produce and the tax, fiscal and economic systems that the communities create. While all economists acknowledge preferences are important and incorporate them into their economic models, very little attention is paid to how preferences are formed and changed.
Art is an important part of these processes. Art helps form a social set of views and cultural norms that help a community communicate ideas with each other. ‘Arts literacy’ among the community provides similar public benefits to literacy and numeracy, in that they all assist an educated public to communicate and understand new ideas and views. The public benefit of all members of a community having access to these skills is the basis for a strong degree of public support. Public funding of arts was strongly supported by possibly the most famous economist of the 20th Century, John Maynard Keynes, who said artistic endeavours “cannot be successfully carried on if they depend on the motive of profit and financial success”.
Summary
EXECUTIVE SUMMARY 5 || 6

Keynes was involved in setting up independent arts funding bodies similar to the Australia Council for the Arts. Recent cuts and changes to the Australia Council have been at the centre of debate around arts funding. Much of this debate has been overtly political and without any context which provides analysis of long-term trends and challenges for arts organisations.
The first long-term trend to note is that in real per capita terms, federal funding of arts in Australia has been declining since at least 2008. While nominal funding has increased, allowing governments and funding bodies to claim record levels of arts funding, if we allow for inflation and population growth, arts funding has gone backwards in Australia:
Federal funding has declined by 17.5% in just the six years from 2008 to 2013, well before the current (2014–16) controversial cuts. Figure S1 below shows the decline of per capita federal funding against the relatively steady levels of state and local funding. This trend has continued and particularly affects S2M organisations, as shown in responses to our survey.
Local
State
Fed ex. broadcast and film
$60
$50
$40
$30
$20
$10
$ pe
r per
son
2008 2009 2010 2011 2012 2013
Figure S1 — Real public arts funding per capita 2008-2013
Figure S2 below shows federal funding for S2M respondents through both the Australia Council and other agencies declining from 29% to 24% between 2012 and 2016.
This cut to Federal funding shown in Figure S2 will be exacerbated by the 50% of S2M visual arts organisations previously supported by the Australia Council losing their operational funding from the beginning of 2017.
The changing balance of visual arts funding shown in Figure S2 does not affect all organisations in the same way. Australia’s arts ‘ecosystem’ is complex, with different types of organisations performing different roles, funded in different ways and so are affected differently by this change.
34%
37%
7%
22%
33%
37%
8%
22%
35%
36%
6%
23%
39%
36%
6%
20%
39%
36%
6%
18%
2012 2013 2014 2015 2016
Figure S2 — Proportions of government funding to S2M visual arts organisations
EXECUTIVE SUMMARY 7 || 8
Local
State
Federal - other
Australia Council

This study analyses six different types of S2M visual arts organisations, summarised in Table S1.
Table S1 shows that the organisations most supported by federal government funding are contemporary arts organisations (CAO), service organisations and craft and design centres (C&DCs). They are vital in advocating for artists’ rights and developing their professional experience. CAO and C&CD are generally the larger and more recognised S2M organisations that, while fewer in number, play important roles in exposing the work of living artists to larger audiences, attracting the interest of curators and elevating their artists’ work onto major national and international stages. Funding cuts to any of these kinds of organisations will limit the ability of Australia’s best artists to promote their work and develop to their full potential.
Reduction in federal funding serves to push more organisations into competition for state and local government funding, as well as other sources such as corporate sponsorship and philanthropy. This exacerbates already intense competition for all kinds of funding, a result of declining real per capita arts funding while the S2M sector tries to support growing numbers of artists and connect them to growing numbers and varieties of audiences. Artists supported by S2M organisations increased by 23% between 2012 and 2016, while visitors to exhibitions and events increased by a similar amount, to over 6 million visitors expected in 2016. While the activities of the S2M sector are keeping up with population growth, clearly their funding is not.
Table S1 — Classifying the S2M arts ecosystem
Primary input/funding
Role in arts ecosystem
Artist run initiatives (ARIs)
Volunteers Supporting creation of new artwork, experimentation and risk.
Contemporary arts organisations (CAO)
State and federal
government
Exposing art to larger audiences, international connection, critical curatorial practice, advocacy and professional opportunities.
Craft and design centres (C&DCs)
Sales, state and federal government
Craft skills development, exhibition and making spaces. Exposure and retail.
Metro galleries State and local government
Exhibition spaces. Commercial enterprises, studio spaces.
Regional galleries
Local government
Bringing art to the regions and supporting regional artists. National Exhibitions Touring Support (NETS) touring.
Service organisations
State and federal
government
Advocacy, research, sector co-ordination, service provision and professional development.
Increased competition for arts funding has resulted in more conditions and requirements attached to grants from all government and private sector supporters. Organisations established to develop, curate and promote art find their funding now linked to much wider government policies and donor priorities. For example, engagement with Indigenous Australians, people with disability, disadvantaged communities and areas seen as politically important (eg Western Melbourne and Western Sydney) is often linked to funding for S2M art organisations.
While the survey respondents usually welcome engagement with these audiences, such requirements often go well beyond the basic purposes of the organisations and their goals in supporting the S2M sector.
Working with these parts of the community often involves skills rarely found in S2M organisations and developing them is difficult. One respondent felt that the arts community was being pushed to help solve much larger policy challenges relating to cultural change and infrastructure; a sense that government was passing some responsibility for these issues on to arts organisations. Put simply, artists and arts administrators are being asked to provide social services which may have little to do with developing and promoting art.
Funding requirements for outreach often take the form of events, workshops and special functions. Exhibitions, events, workshops, etc have increased by around 60% since 2012.
2012 2013 2014 2015 2016
2,5122,815 2,899
3,2833,583
2012 2013 2014 2015 2016
2,6963,337 3,245
3,9214,352
Figure S3 — Total respondent numbers of exhibitions and events
Figure S4 — Total respondent numbers of workshops, classes, outreach functions
EXECUTIVE SUMMARY 9 || 10

Several respondents noted that it is easier to get funding for projects that involve events and that funding can be tied to conducting workshops and community engagement functions. One respondent put it directly that “the difficulty in securing funding for operations results in S2M arts orgs feeling the pressure to host more events, more exhibitions, do more (as they receive project funding instead) within an organisation that is already at capacity in terms of staff resources.”
The push to hold more events is contributing to a casualisation of the workforce of S2M organisations. While overall numbers of workers in the sector is increasing, this is driven by casual staff for events.
Figure S5 — Respondents’ events and casual staff in regional public galleries
Events, workshops, etc.
Casual staff1000
900
2012 2013 2014 2015 2016(projected)
Casual staffEvents, workshops, etc.
800
700
600
500
400
300
200
100
80
70
60
50
40
30
20
10
Within respondent organisations, full time staff numbers peaked in 2013 at 197 and have since declined by 9% to 180, as shown in Figure S6 below.
This demonstrates a key challenge for S2M arts organisations in attracting and keeping full time staff to perform core management functions.
One respondent explained a key challenge was being able to provide “wages that support and attract high quality and experienced arts administrators.” This challenge is made even greater by the low wages paid to S2M full time staff. We estimate earnings are just 52% to 78% of average Australian full time earnings.
233
175
188
249
177
197
256
186
185
244
181
275
189
180
2012 2013 2014 2015 2016
Figure S6 — Reported staffing levels
EXECUTIVE SUMMARY 11 || 12
180
Casual
Part time
Full time

Australia is one of the richest countries in the world at one of the richest points in our history. Having seen off the global financial crisis in a way few other countries did and enjoying a record stretch of uninterrupted economic growth, ironically our country is currently embroiled in a debate over how, how much and even whether we can afford to fund art.
While recent changes to federal arts funding made headlines, they represent the latest development in trends going back some years. The retreat from funding arts by the federal government predates the current federal government and several before it. It is not necessarily a problem that the level of government funding for arts should change over time. Change in the roles and priorities of different levels of government is also inevitable. What is most concerning about these trends and the latest cuts is that arts funding policy is being changed with very little data to guide it.
This is particularly problematic as art in Australia is far from a homogenous sector, but more like a complex ecosystem. The visual arts ecosystem alone includes national and state/territory public galleries and museums; private galleries; university galleries; contemporary arts spaces and craft/design entities in each state and territory; a network of regional galleries; a diversity of artist run enterprises; specialist Indigenous art centres in regional and remote areas of Australia; a diversity of service organisations; art education institutions; residencies and studios; events (including major exhibitions, art fairs and festivals ); a spread of contemporary art publications and online information resources; and independent artists, curators, writers, educators, consultants and other visual arts professionals.
Each part of the visual arts ecosystem has its own focus and while each makes an important contribution alone, all are interdependent. Artists’ careers are not hierarchical or sequential.
Artists frequently move within this ecology as each part offers unique opportunities to develop artistic practice and agency. Partnerships are common both within and beyond the arts ecosystem, as has been noted by the federal government art body, The Australia Council for the Arts:
The Australian contemporary visual art sector has grown in depth and complexity to become a variegated structure, made up of multiple spheres of activity. Growth has been steady over a few decades and the past decade has seen determined growth. New large-scale initiatives are raising the profile of contemporary art, and the small to medium sector is full of lively activity across commercial galleries, contemporary art spaces, design centres, artist-led projects, university galleries, Indigenous art centres, public and regional galleries, and other ‘post institutional’ collectives. (Murray 2014)
This report addresses the data gap that exists around what different parts of the arts ecosystem do and how they are financed, with a focus on the small-to-medium (S2M) visual arts sector. Much of the report is based on the results of a survey of S2M organisations. The survey results provide quantitative data on S2Ms’ artistic outputs, the people they support, serve and employ as well as information on funding and spending. Qualitative data relating to how each organisation fits into the wider arts ecosystem and the challenges facing the S2M sector was also collected. Commissioned by the National Association for the Visual Arts (NAVA), we hope this report will provide a solid evidence base to assist policy making around the S2M sector.
The first section of the report provides a background to the economics of arts and the economic justification for public funding of art. Art has several aspects of a ‘public good’ and is important in shaping the views and preferences of the community. While many economic models are based on assumptions around people’s preferences, little attention is paid to the factors that actually influence these preferences.
1. INTRODUCTION AND BACKGROUND 1. INTRODUCTION AND BACKGROUND 13 || 14
More background is provided on art funding in Australia. The arts is funded by different levels of government and different bodies within these governments. Federal, state and local government bodies all have important roles in funding arts organisations, as do some private sector entities.
The second section of the report outlines the development of the survey and its results. An important part of the analysis is the identification and definition of different types of S2M arts organisation. Much of our analysis focuses on the different roles of six types of organisation:
• Artist run initiatives (ARIs) • Contemporary arts organisations (CAO) • Craft and design centres (C&DCs) • Metropolitan galleries • Regional galleries • Service organisations
Results for the S2M sector in total and by organisation type are presented in several sub sections relating to:
• Artistic outputs • People • Funding and spending • In-depth case studies of six S2M organisations (one of each type).
A final section compares the results of the S2M survey with the activities and funding of major galleries in Australia, before conclusions and policy recommendations.
Analysis of the Indigenous art centres in regional and remote areas is beyond the scope of this study and has been dealt with by others.

From an evolutionary economics perspective, the preference-formation role of the arts could be classified as follows: established artists, galleries and musical groups transmit established culture, while grass roots, young, alternative artists, provoke and challenge, forming the engine of cultural evolution that adapts and develops the next generation’s prevailing culture (Baronne, 2016). Representatives of the major performing arts organisations support this view, noting that smaller artistic enterprises allow for ‘risk’ or ‘experimentation’, and are a source of new Australian works that ultimately enter the large publicly subsidised organisations (Cultural Ministers Council Standing Committee, 2002). As indicated above, obviously the same holds true for the visual arts.
These core economic views on art sit firmly outside standard economic thinking, yet highlight an interesting economic conundrum: art in modern society appears to be a fundamental, yet hidden, ingredient in shaping economic life, but also at risk from forces arising in other parts of the economy that may lead to some art becoming the purview of the wealthy only. According to standard economic thinking, neither part of this conundrum provides a clear basis for public funding. It could be argued, for example, that the preference-formation role of art has ‘public good’ or ‘mixed good’ characteristics, meaning that the benefits of this have value for wider society (Throsby and Zednick, 2008). But then again, many artistic public goods are provided by the market, such as broadcast film and television. As such, a recourse to standard economics in discussing the merits of public arts funding is bound to be incomplete. Yet some insights remain, particularly when it comes to identifying when art falls outside the realm of standard consumption goods because of its social elements.
Private art
Private art markets for collectors (both individual and corporate) exist and flourish. They can because of the main characteristic of the art as excludable, ie other viewers cannot freely access it. This type of art can be funded through purchase of the good, either outright (like books, music, paintings and sculptures) or through tickets (like theatre, music, and cinema).
Public art
Public art made accessible through being shown in public spaces, has a characteristic whereby people cannot be excluded from its consumption. One person’s consumption does not limit consumption by others, for example artworks displayed in a public gallery. This type of art is generally funded by public organisations. Because of its broad accessibility, it is this type of art that often contributes the most to preference-formation across society, as it is easy for many people to enjoy and discuss without having to purchase their share of the art.
This ‘art literacy’ is similar to the public benefits of text literacy and numeracy benefits that come from having an educated public and that can be justified on purely economic grounds.
1. INTRODUCTION AND BACKGROUND 15 || 16
Economics of arts and of funding the artsEconomic characteristics of art
Art presents many challenges for economists. Many characteristics of art do not have a market value, or, when some do, opinion varies widely on whether that value is the ‘right’ one. Prominent Australian cultural economist David Throsby explains:
Cultural value [is] multi-dimensional, unstable, contested, lacks a common unit of account, and may contain elements that cannot be easily expressed according to any quantitative or qualitative scale. The characteristics of cultural goods which give rise to their cultural value might include their aesthetic properties, their spiritual significance, their role as purveyors of symbolic meaning, their historic importance, their significance in influencing artistic trends, their authenticity, their integrity, their uniqueness, and so on. (Throsby 2003)
While economists often struggle to incorporate such qualities into analysis, considering them is vital if we are to understand the economic role of art in society, including the way we fund art, share art, and promote artistic activity across society.
The field of cultural economics has sought to understand this difference for several decades. Pioneering articles brought to the attention of the economics profession that in all civilisations, current and historical, art formed a large part of cultural life, including being the underlying motivation for many iconic investments in buildings and city infrastructure. Art has always been a large part of religious, social, and economic life.
Art has been brought into the realm of modern economics from a number of angles. First, was by William Baumol, who noted in 1965 that while there are generally efficiency gains to be made across the economy, a string quartet still requires four people to perform, as it has for centuries (Baumol and Bowen, 1965). Because of this, the players of the quartet would have to be paid the growing wages they could get in other more efficient parts of the economy, and this rising price would stifle demand for performances, and hence stifle all artistic endeavours that are
similarly unable to be improved in efficiency. This observations become known as Baumol’s cost disease, and is widely considered relevant to funding not just of the arts, but other services with a degree of social benefit such as healthcare and education, services that cannot keep pace with overall efficiency gains in the economy.
There are valid criticisms of this view as efficiency gains do come, for example, with larger theatres, recorded music, and the ability of musicians to travel more cheaply to access larger live audiences. A recent study on the corporatisation of State symphony orchestras showed that where access to larger facilities was limited, so too was the scope for efficiency gains, showing that indeed there can be efficiency gains from such sources (Boyle and Throsby, 2012).
A second integration of arts and economics stems from the key point that art in society makes a significant contribution to shaping people’s individual tastes and preferences (Blaug, 2001). Most art is enjoyed not only for the way it stimulates individual thought and reflection, but the way it stimulates conversations, discussion and debate amongst a broad range of people. By doing so it ultimately contributes to crafting a social set of views of the world, and is often a means to pass down ‘cultural norms’ across generations. This type of argument forms part of the basis for requirements on broadcasters to provide Australian-produced content, along with other arguments based on potential economies of scale overwhelming local production (McNair and Goldsmith, 2015)
The core theories of economics stem from the idea that each individual has a set of preferences that decide what goods and services they will consume. Yet these theories are silent on how such preferences arise. Clearly culture and art play a big part in this process of shaping individual preferences, and aligning preference across individuals, and subsequently indirectly shaping major investment and consumption decisions that are based on those preferences.

Public funding
Given the difficulties that art presents for most economic analysis, it is ironic that politics often requires that public spending on arts be rationalised by economic reasoning. The conflict between the free expression and challenging thinking seen in the arts, and the political and economic environment, has been a driving factor behind the ‘arms-length’ arrangement for public funding that has dominated for the latter part of the 20th century.
It was one of the world’s most famous economists, John Maynard Keynes, who promoted the first arms-length public funding model with the establishment of the pioneering Arts Council of Great Britain in 1946, of which he became the initial chairman. His view was that artistic endeavours “cannot be successfully carried on if they depend on the motive of profit and financial success” (Keynes, 1936). Similar bodies were
soon created across the Anglosphere, such as the Canada Council for the Arts in 1957, the National Endowment for the Arts (NEA) in the US in 1965, followed finally by the creation of the Australia Council in 1975 (Barone, 2016).
These arrangements have allowed for a mix of private funding, from donations, sponsorships, and ticket sales, with public funding, to support a vibrant arts sector in these countries, while the finer details of mechanisms for granting and approving funding have evolved over time. According to Barone (2016), however, there remain risks even to this model of public funding:
The downside to such an approach is the risk that the art that is produced is simply that which marries with the tastes and views of the elite. In other words, the government patron model merely makes real and reinforces the world-view of the ruling classes, and not artistic excellence.
Overview of arts funding in Australia
Local
State
Fed ex. broadcast
$1,600
$1,400
$1,200
$1,000
$800
$600
$ m
illio
ns
1999 2003 2007 2011
Figure 1 — Public arts funding, Australia
$400
$200
Public funding to the arts at all levels of government was reported in the annual Survey of Cultural Funding by Government by the ABS from 1994 onwards, until it was discontinued in 2014. The definition of ‘cultural funding’ includes items classified as heritage, such as libraries, museums, and botanical gardens, and items classified as art, which is further broken down into sub categories including visual art and design.
Importantly, in the ABS data ‘art’ funding includes activities not directly relevant for discussion of visual art funding. In particular, federal art funding includes spending on the public broadcasters (ABC and SBS), which dramatically increases federal spending. For example, in 2012-13 federal art funding totalled $1.76 billion, $1.28 billion of which was spent on ‘radio and television services’. The remaining $475 million was spent on literature, music, drama, dance, visual arts and crafts, design and several other categories.
For local government cultural funding, this level of detail is not available and spending is not broken down by type of cultural spending. The total figure includes some sport and recreation spending in addition to arts and in some cases spending on local museums.
In the analysis that follows, broadcast services have been excluded from federal government spending. State and federal government figures refer only to art spending while all aspects of local government cultural spending are included.
With this in mind, Figure 1 shows historical data on arts funding by Australian governments using ABS data. In total around $2.9 billion of public funding was provided to the arts sector at last estimate (in 2012-2013), a substantial increase from the $1.4 billion in 1999:
1. INTRODUCTION AND BACKGROUND 17 || 18

The increases shown in Figure 1 appear to be a good news story for the arts in Australia. However, in per capita terms and adjusting for inflation, funding is stagnant and federal funding declining, as shown in Figure 2.
Figure 2 shows that per capita arts funding from the Federal Government has declined 17.5% from $20.20 per year in 2008 to $16.68 in 2013 (in constant 2008 dollar terms). Recent funding cuts to the Australia Council and the major national cultural institutions will exacerbate this trend.
This major decline in federal arts funding has been offset by increases in per capita funding from local and state governments. Overall, per capita spending on arts increased from $106 in 2008 to $111 in 2012, before declining to $109 in 2013. More recent budget cuts will see overall arts funding decline further on a per capita basis.
While this overall decline has been modest, in later sections of this report we see that the decline in federal funding places particular strains on particular types of organisations, which play particular roles in Australia’s arts ecosystem.
Without these organisations Australian artists have limited opportunity to progress from community based arts organisations to the national and international stages; and public recognition of their rights and the overall conditions for their work and income can be jeopardised. A key recommendation is that the decline in per capita federal arts spending is reversed and restored to at least 2008 levels of $20.20 per person from current levels of around $16.68 per person. Such an increase is modest compared to the federal funding boost seen in Canada under its new government, which has a broadly comparable arts funding system. (Canada Council, 2016)
$ m
illio
ns
Figure 3 — Australia Council funding and grants
$250
$200
$150
$100
$50
02014 2015 20162011 2012 20132009 2010
Total fundingGrants made
Grants to major performing arts
The Australia Council
Around $200 million of federal government arts funding is distributed through the Australia Council, which is about half of all federal arts funding (excluding film and broadcasting). As shown in Figure 3 below, the Australia Council’s total budget grew 22% between 2009 and 2014, a little lower than the growth in federal government tax revenue of 26% over the period.
Figure 3 shows that the Australia Council distributes around 90% of their funds through grants, and therefore only around 10% is spent on administrative expenses. This indicates a high degree of efficiency in the role of allocating funds. As a comparison, the Australian Sports Commission (ASC), which received around $270 million in federal funding in 2015, spent $180 million on grants, representing a substantially lower 67% of revenues (Australian Sports Commission, 2015).
The structure and roles of these organisations differ somewhat. This is not meant as a criticism of the ASC, but to demonstrate that the Australia Council is a highly efficient organisation in terms of its ability to channel government funds to their intended recipients.
Figure 3 also shows that around half of the Australia Council grants go to major performing arts organisations, which are predominantly state-based symphony orchestras, opera and theatre companies. Trends in the relative dispersion of Australia Council funding by types of art are in Figure 4, showing that orchestras receive the lion’s share of Australia Council funding. By comparison, visual arts, for example, has been granted $17 million in 2015-16, down from $21 million in the prior year, as shown in Figure 4.
1. INTRODUCTION AND BACKGROUND 19 || 20
Local
State
Fed ex. broadcast
$60
$50
$40
$30
$20
$10
$ pe
r per
son
2008 2009 2010 2011 2012 2013
Figure 2 — Real per capita arts funding by level of government

In 2015, federal government budget measures cut the Australia Council’s budget by $28.5 million over the four-year forward estimates. The decline in funding of the Australia Council has predominantly affected already low-spending areas, such as theatre, visual arts, music and literature, which can be seen in Figure 4.
In May 2015, the then Federal Arts Minister, Senator George Brandis, announced that $105 million over four years would be diverted from the Australia Council to a newly created program called the National Programme for Excellence in the Arts, that would sit within the Arts Ministry and give the minister substantial discretion over funding decisions. This represents around 11% of the Australia Council’s funding, which had already been cut by 4% in the prior year. The current Arts Minister Mitch Fifield reversed some of this plan, giving back $32 million of the planned cuts to the Australia Council, and renaming the new, now smaller, program “Catalyst”.
A Senate inquiry into the proposed funding changes of May 2014/5 recommended a reversal of the decision, given that there was no policy objective or credible rationale given for the decision. At the time of writing, these funding decisions were still highly politicised, and final outcomes were uncertain (Gill, 2016).
Regardless of the outcome, Recommendation 4 of the Senate committee report was that if Catalyst was to proceed, it should prioritise small-to-medium arts organisations, and that the funds would complement, rather than duplicate, those granted via the Australia Council (Senate Legal and Constitutional Affairs Committee, 2015). This recommendation makes sense in light of the data showing that around half of the Australia Council grants go to major performing arts organisations, and that previous funding cuts had predominately fallen on smaller organisations and less well-funding types of art. Indeed, the Review of Private Sector Support for the Arts, conducted by Harold Mitchell in 2011, recommended extending and formalising support for small-to-medium size arts organisations seeking to raise private funding, as they rely heavily on such support to facilitate their fundraising activities (Creative Australia, 2016). While the Catalyst program has adopted an S2M priority for its project funding, this in not necessarily reflected in funding decisions, nor does it compensate for the loss of operational funding resulting from the Australia Council cuts.
Visual Arts and Craft Strategy
The Visual Arts and Craft Strategy (VACS) is a joint initiative of the federal, state and territory governments which aims to build a strong, sustainable and dynamic visual arts sector. Since 2003 it has increased funding to the sector, building to around $14 million a year. The initial four year commitment has been renewed three times since its establishment. VACS funding is invested in a variety of ways but principally supports the visual arts and craft infrastructure and grants for artists. This commitment was agreed on the understanding that the needs of the visual arts and craft sector had substantially outgrown the allocation by government. It has been sustained despite government cuts to the baseline funding on which the VACS was intended to build.
The VACS resulted from advocacy led by NAVA which persuaded the Commonwealth Government to commission the first-ever Australia-wide examination of the contemporary visual arts and craft sector — the so called ‘Myer Inquiry’. The resulting report found that the sector was at a point where strategic interventions were needed to capitalise on existing strengths and ensure that the sector’s potential is realised (Department of Communications, Information Technology and the Arts, 2002). As much of the data in this report shows, the visual arts and craft sector has reached a similar point again and would benefit from a new Myer-style report and coordinated strategy based on such a report.
1. INTRODUCTION AND BACKGROUND 21 || 22
Figure 4 — Distribution of Australia Council funding by artform
Orchestras$60
$50
$40
$30
$20
$10
$mill
ions
2010 2011 2012 2013 2014 20150
2016
TheatreOperaDanceVisual ArtsOther Music
Literature

At the state government level, a large proportion of arts funding goes to maintaining performing arts venues, which have historically made up around a third of total state arts funding budgets, which was $270 million out of the $843 million in the last ABS survey in 2012-13 (ABS, 2014). Funding for all arts is shown in Figure 5 below, with funding for visual arts, craft and design shown separately:
As can be seen from Figure 5, funding for visual arts and design is a small percentage of total state government arts funding. The lowest shares of visual arts and design funding are seen in Victoria and NSW (4%), while the highest is in the ACT (10%). It should be remembered that the ACT does not have local government, so the territory government fills that role too. Separate visual arts figures for the Northern Territory were not available.
As shown in Figure 5, the states with large populations, ie NSW and Victoria, have the highest levels of total funding for arts, while the smaller states spend the least. In per capita terms however, this pattern is reversed, as shown in Figure 6 below:
Figure 6 shows that NSW, Victoria and Queensland spent just $1 per person on visual arts and craft in 2012-13. Higher levels of per capita funding were reported in SA, WA and Tasmania. Again it needs to be remembered that the ACT has no local government and that separate visual arts funding figures for the Northern Territory were not available.
The following sections assess state government funding in more detail.
Figure 7 — Arts funding by New South Wales government
300
250
200
150
100
50
0
2008 2009 2010 2011 2012 2013
Total arts
Arts ex museums
New South Wales
According to ABS data, the NSW State Government funded $282 million of arts activities in 2012-13, rising from $161 million in 2010-11, as Figure 7 shows. For perspective, this represents around 0.4% of NSW government’s $69 billion budgeted revenue for that year (NSW, 2016).
In 2012-13 the state funding body, Arts NSW, funded 270 organisations, 30 individuals and over 400 projects with grants totalling $54.7 million (Arts NSW, 2014). Overall funding to the government’s arts portfolio which comprises Arts NSW, Screen NSW and the NSW cultural institutions (the Sydney Opera House, the State Library of New South Wales, the Museum of Applied Arts and Sciences, the Art Gallery of New South Wales and the Australian Museum) was $386 million in 2012-13 (Trade and Investment, 2013).
1. INTRODUCTION AND BACKGROUND 23 || 24
State arts funding
Figure 5 — State government funding for all arts and visual arts, craft and design 2012-13
$millions
Total arts fundingVisual arts, craft and design
ACT
NT
TAS
WA
SA
QLD
VIC
NSW
$31
$12
$12
$128
$93
$134
$192
$242
$3
$1
$8
$6
$7
$7
$10
Source: ABS (2014)
Figure 6 — Per capita state government funding for all arts and visual arts, craft and design 2012-13
$ per person
$82
$49
$23
$52
$56
$29
$34
$33
$8
$2
$3
$4
$1
$1
$1
Source: ABS (2014)
ACT
NT
TAS
WA
SA
QLD
VIC
NSW
All arts funding per capitaVisual arts, craft and design per person

Victoria
The Victorian Department of Economic Development, Jobs, Transport and Resources reports that $120 million was spent on arts agencies, with funding predominantly to the nine state-owned “creative organisations” overseen by the government body, Creative Victoria, in 2014-15. For perspective, that is about 0.2% of the Victorian Government’s $53 billion in revenue budgeted for 2014-15 (Department of Treasury and Finance, 2015a).
Table 1 shows the government funding received by some of the major State-owned arts organisations in the past five years, with Arts Centre Melbourne, Australian Centre for the Moving Image, and the National Gallery of Victoria receiving the bulk of the funding, and around 85% of Victorian arts funding going to the four organisations listed.
Compared with ABS data on a broader picture of Victorian arts funding, in Figure 8 below, we can see an overall cyclical pattern that is not reflected in the funding to the major arts organisations in Table 1, suggesting that political variation in Victorian arts funding primarily affects other smaller and more independent organisations.
Figure 9 — Arts funding by Queensland government
200
180
160
140
120
100
80
60
40
20
0
$ m
illio
n
2008 2009 2010 2011 2012 2013
Total arts
Arts ex museums
Arts ex museums and screen
Source: ABS (2014)
Queensland
The Labor government, elected in 2015, boosted state arts funding significantly, reversing numerous budget cuts to Arts Queensland that were introduced by the previous Liberal National government (Queensland Government, 2015). In 2014-15, just $17.8 million of grants and subsidies was provided by the Queensland Government to major organisations through Arts Queensland. In 2015-16, that amount was $85.3 million (Department of Premier and Cabinet, 2016). Table 2 summarises the grants and subsidies for major entities receiving support over the past five years. Once again, comparing to total state government budgeted revenue, that is about 0.2% (Queensland Treasury, 2015).
In addition, Arts Queensland provides a number of other grants and funds focussing on regional Queensland, Indigenous art, and a leverage fund that matches “eligible cash sponsorship and philanthropy dollar for dollar” (Arts Queensland, 2016).
Compared with data in earlier years compiled by the ABS, we can see that arts funding in 2011-12 was $134 million, falling to $124 million in 2012-13. Given the above data on the major Queensland arts organisations, it is clear that a variety of cut backs on arts funding occurred at this time, with the major arts organisations seeing only some temporary reductions in funding.
1. INTRODUCTION AND BACKGROUND 25 || 26
Table 1 — State government funding recieved by some Victorian major arts organisations, $million
2011-12 2012-13 2013-14 2014-15 2015-16
Arts Centre Melbourne N/A N/A N/A 21.8 22.0
National Gallery of Victoria 42.8 43.4 43.6 53.0 56.1
Melbourne Recital Centre 3.9 3.9 3.9 3.9 3.9
Australian Centre for the Moving Image 19.8 20.2 20.8 22.5 24.4
Total N/A N/A N/A 101.2 106.4
Sources: Arts Centre Melbourne, 2016;, ACMI, 2016; NGV, 2016; Melbourne Recital Centre, 2016.
Figure 8 — Arts funding by Victorian government
350
300
200
150
100
50
02008 2009 2010 2011 2012 2013
Total arts
Arts ex museums
250
$mill
ions
Arts ex museums and screen
Source: ABS (2014)
Table 2 — Arts Queensland State government funding, $millions
2011-12 2012-13 2013-14 2014-15 2015-16
Queensland Art Gallery (QAGOMA) 8.4 31.3 31.5 7.2 29.5
Queensland Museum 5.1 21.1 21.4 5.5 24.1
Queensland Performing Arts Trust 2.7 8.0 9.1 2.0 9.3
Queensland Theatre Company 0.7 2.6 2.6 0.7 2.6
Screen Australia 2.4 9.8 9.8 2.5 18.6
Total 19.3 72.8 74.4 17.8 85.2
Sources: Department of Premier and Cabinet, 2016; DSITIA, 2014.
South Australia
The major state funding body in South Australia is Arts South Australia, which is part of the Department of State Development. Arts and culture is supported through legislation that has created 11 statutory authorities and two public corporations: Art Gallery of South Australia, State Library of South Australia, South Australian Museum, History SA, Carrick Hill Trust, State Theatre Company of South Australia, Windmill, State Opera of South Australia, South Australian Film Corporation, Adelaide Film Festival, Adelaide Festival Corporation, Adelaide Festival Centre Trust, Country Arts SA.
Total arts and cultural spending by the Department of State Development in 2014-15 was $128 million (DSD, 2016). Prior to this total cultural spending was $131 million in 2013-14, and $141 million in 2012-13 (DPC, 2014). Arts spending in South Australia is equal to about 0.7% of state government revenue (Department of Treasury and Finance, 2015b).
The ABS reporting in earlier years is roughly consistent with these overall figures, being $135 million in 2012-13 for arts and cultural spending. Figure 10 shows the ABS data for arts spending only by the South Australian government in earlier years, with a decrease in film funding since 2011 reducing overall art spending, but some consistent growth in other arts spending (excluding museums) since that time.
Figure 11 — Arts funding by Western Australian government
140
120
100
80
60
40
20
0
$ m
illio
n2008 2009 2010 2011 2012 2013
Total arts
Arts ex museums
Arts ex museums and screen
Source: ABS (2014)
180
160
Western Australia
Arts funding in Western Australia is undertaken through the Department of Culture and the Arts (DCA), which has numerous grants programs (DCA, 2016). In 2015-16, 800 funding applications were received, and 370 funded. The overall arts funding by Western Australia is summarised in Table 3, with major agencies and performing arts companies receiving the majority of the funding.
Figure 11 shows total arts spending from earlier ABS data, which classifies arts spending more broadly. Like Queensland, there was a decline in overall arts funding in 2012-13. However, the above data suggests that arts funding has grown since, with funding via DCA increasing 50% since 2012-13. Overall arts funding in 2013 was $156 million, which is around 0.3% of $42 billion in government revenue that year (Government of Western Australia, 2015).
1. INTRODUCTION AND BACKGROUND 27 || 28
Figure 10 — Arts funding by South Australian government
140
120
100
80
60
40
20
0
$ m
illio
n
2008 2009 2010 2011 2012 2013
Total arts
Arts ex museums
Arts ex museums and screen
Source: ABS (2014)
Table 3 — Arts funding by Western Australian government, $million
2010-11 2011-12 2012-13 2013-14 2014-15 2015-16
Major Arts Agencies 20.5 18.3 11.9 17.4 15.5 15.3
Major Performing Arts Companies 6.5 9.8 9.5 9.1 8.9 15.0
Creative Regions N/A N/A N/A N/A 2.4 4.5
Minor Works 1.2 1.9 0.6 2.7 4.6 3.5
Screen West 2.5 2.0 3.2 2.0 2.5 2.5
Bell Tower Foundation 0.4 0.4 0.4 0.2 0.3 0.3
Total 32.8 36.1 27.2 32.1 34.5 41.2
Source: DCA (2016)

Tasmania
Arts Tasmania is part of the Department of State Growth, and is the primary agency used to fund artistic endeavour in the state. Spending in 2014-15 was $19.1 million, comprising $11.7 million for the Tasmanian Museum and Art Gallery, and $7.4 million for arts industry development, with $2.8 million of that in the form of grants (Department of State Growth, 2016). This matches closely the historical record compiled by the ABS of overall arts funding being $19.1 million in 2012-13. The historical spending is in Figure 12.
Total arts funding in Tasmania is about 0.4% of the $5 billion in annual state revenue (Department of Treasury and Finance, 2015c).
Figure 13 — Arts funding by Northern Territory government
20
15
10
5
0
$ m
illio
n
2008 2009 2010 2011 2012 2013
Total arts
Arts ex museumsArts ex museums and screen
Source: ABS (2014)
25
30
Northern Territory
Northern Territory arts funding comes from the Department of Arts and Museums. Ongoing funding to established museums and galleries is provided, along with a variety of grants for arts and film projects, and funding contributions to festivals and cultural events. In 2014-15 $19.2 million in grants were given, up from $12.5 in 2013-14 (Department of Arts and Museums, 2015), mostly going to libraries, museums and galleries. Figure 13 shows the recent patterns of arts funding in the Northern Territory, showing the relatively strong focus on museums, less focus on screen, and recent shifts in the balance of funding.
NT government arts spending represents around 0.3% of its $6.5 billion annual revenue (NT Department of Treasury and Finance, 2016).
1. INTRODUCTION AND BACKGROUND 29 || 30
Figure 12 — Arts Funding by Tasmanian government
20
15
10
5
0
$ m
illio
n
2008 2009 2010 2011 2012 2013
Total arts
Arts ex museums
Arts ex museums and screen
Source: ABS (2014)
25

Australian Capital Territory
Arts funding primarily occurs via artsACT, which offers numerous grants to local artists. One important consideration of ACT government arts funding is that there is no local government, meaning that funding covers many activities that are typically funded by local governments in other states. One pattern is clear in Figure 14, which is that arts funding peaked around 2012, only to flatline, which is common in the state-level funding analyses in this section.
The $32 million in arts funding shown in Figure 14 represents around 0.7% of government revenue (Treasury ACT, 2016).
Figure 15 — Local government arts and cultural funding by state
$mill
ions
2008 2009 2010 2011 2012 2013
500
450
400
350
300
250
200
150
100
50
0
NSW
Vic
Qld
SAWA
TasNT
As discussed earlier, local governments are a major funding source for Australian art. However, the difficulty of fully understanding the contribution of local governments to artistic endeavour is that many other cultural activities are included, such as spending on sporting and community events and facilities. Aggregate spending on cultural and artistic endeavours by local governments is growing in all states, as can be seen in Figure 15.
In real per capita terms, local government arts and cultural funding was growing as well during the period of available data, shown in Figure 16. This contrasts with the federal funding earlier discussed, which declined 17.5% over the 2008 to 2013 period. Nationwide, local government cultural and arts funding has increased 9% in real terms over the same period.
1. INTRODUCTION AND BACKGROUND 31 || 32
Figure 14 — Arts funding by Australian Capital Territory government
20
15
10
5
0
$ m
illio
ns
2008 2009 2010 2011 2012 2013
Total arts
Arts ex museums
Arts ex museums and screen
Source: ABS (2014)
25
30
35
40
Local government arts funding
Source: ABS (2014)

One form of local government support of the S2M sector that is not considered in ABS statistics is its facilitation of access to space. Many buildings utilised by the S2M sector are local government buildings and as a planning authority, councils could provide more substantial opportunities for arts and cultural participation. Recent work in the UK could be a potential model to ensure new urban development includes suitable cultural space for S2Ms (such as the Community Infrastructure Levy, contained within Section 106 of the UK Town and Country Planning Act). This would break the cycle of reliance on short term tenancies or ‘pop up’ use of brownfields development.
Further to the above, local government’s role in the planning system could be used to reduce regulatory barriers for arts organisations. Clearer regulatory pathways, such as specific planning classifications for small to medium, low risk cultural spaces and guidelines for the adaptive re-use of existing buildings, would significantly benefit the cultural sector, and allow funding to be focused on programming and artists, rather than building and planning consultancies.
The overall picture of arts funding at various levels of government in recent times can be summarised as follows. First, federal funding, primarily through the Australia Council, mainly focuses on major established performing arts organisations (opera and theatre), whose funding seems relatively unaffected by political decisions about support for the arts. Overall federal funding to arts has declined substantially in real per capita terms in the past eight years. State arts funding is also mainly directed to the major state arts organisations, with a common pattern of a funding drop for all types of arts funding around 2013. Local government arts funding, which is hard to isolate from a wide variety of other cultural spending, has shown consistent growth overall, and in real per capita terms.
0
50
100
150
200
$ m
illio
n
250
2008 2009 2010 20112006 2007
Figure 17 — Private sector arts support
Source: AbaF (2011)
Figure 18 — Type of private support for major performing arts organisations
0
25
30
35
40
$ m
illio
n
45
2008 2009 2010 2011
5
10
15
20
Donations
Sponsorships
Source: AbaF (2011)
Figure 16 — Local government arts and cultural funding by state, real per capita
$per
per
son
2008 2009 2010 2011 2012 2013
80
70
60
50
40
30
20
10
0
NSW
Vic
Qld
SA
WA
Tas
NT
Source: ABS (2014)
Arts funding has also long been financed by private parties, through philanthropy, commercial interests and sponsorship, direct commissions and through ticket sales. Quite often the same performances or exhibitions are funded in multiple ways through private and public sources. Ticket sales for performing arts are by far the largest private sources of funding, with an estimated $1.5 billion spent on tickets across Australian in 2013 (Australian Council, 2015). An estimate of private sector arts support up to 2011 was made by the Australia Business Arts Foundation (now Creative Partnerships Australia), with results shown in Figure 17 below:
In Figure 17 are survey estimates of total private sector support for the arts (excluding ticket sales), reaching $221 million in 2011 when the last survey was conducted. Of that, around $69 million was giving to the major performing arts sector, which can be seen in Figure 18, comprising donations and corporate sponsorship. In contrast to the federal level public funding, which gives around half of its funds to the major performing arts, the private sector support for arts is more diverse, giving only 31% to these major organisations. Where gifts and sponsorships are tax-deductible, there remains an implicit component of public support even in these private funding arrangements through tax forgone.
Private sector arts support
1. INTRODUCTION AND BACKGROUND 33 || 34

2. SURVEYING THE SMALL-TO-MEDIUM VISUAL ARTS SECTOR IN AUSTRALIA
The small-to-medium visual arts (S2M) sector in Australia is comprised of a diverse range of organisations with different functions and artistic outputs, located in varying cultural and geographical settings around Australia. S2M organisations play many roles within what is often referred to as Australia’s arts ‘ecosystem’. These organisations provide support and other services to artists, each other, the public and the major arts organisations in each state and territory and nationally.
The organisations included in this research not only support production of art but also display, promote or sell paintings, sculpture and installation, crafts, moving image works and other forms of visual art. The service organisations provide important support such as professional advice, industry advocacy and representation and training. Generally, organisations in the S2M sector have less than 10 employees and receive less than $1 million in revenue each year.
To better understand how different types of organisation function, this analysis divides the S2M sector into six types of organisation:
• Craft and Design Centres (C&DCs) are a recognised network of organisations from all states and territories that present work, and represent and support the professional craft and design sector.
• Artist Run Initiatives (ARIs) are generally small organisations and/or collectives. As the name suggests, these are run by artists. ARIs exist for variable periods of time and offer artists, curators and arts writers at all stages of their careers, opportunities to experiment with ideas and/or further develop their professional practice. ARIs can be, but aren’t limited to, spaces, residencies, studios, festivals, one-off projects or publications. In some instances, ARIs have successfully developed into established CAO spaces.
• Service organisations provide a diverse range of services to artists, other arts professionals and organisations and local communities. Some provide professional services such as legal advice and professional skills training while others are peak bodies, which undertake research, advocacy and sector co-ordination, and represent the sector as a whole or particular sectoral groups eg artists or galleries. Several also host professional development programs and exhibitions and run workshops, forums, conferences and festivals.
• Contemporary Arts Organisations (CAO) are a recognised network of independent arts spaces in each state and territory that focus on the work of living artists. These high-profile organisations both display and support artists to generate new works of art. They create important international connections, support critical writing and contemporary curatorial practices.
• Metropolitan galleries (Metro galleries) are other galleries and organisations in capital cities that are not part of the CAO network and are not artist led projects. Many, but not all, are operated by local governments, and some are focussed on the commercial sale of artists’ work.
• Regional galleries are mainly closely related to local governments, although some are independent and privately funded. While some are relatively remote and modest, others are large and recognised as important cultural centres. These organisations support artists and encourage access to diverse audiences. A handful have over 10 full time employees.
2. SURVEYING THE SMALL-TO-MEDIUM ARTS SECTOR IN AUSTRALIA 35 || 36
Other types of organisation that do not easily fit into these categories include residency spaces and small-to-medium sized festivals. Due to the small number of these organisations they were included in one of the above categories based on assessment of their websites. Comment is often provided where the nature of these organisations can skew results – for example where a biennial event changes section results in on and off years.
Most organisations were classified by their own self-identification in the survey. However, there is a grey area between these classifications.
For example, deciding where metro areas end and regional areas begin requires subjective decisions around large cities like Sydney and Melbourne. The difference between ARIs and other galleries can be minimal where artists are involved in operation and management. Regional and metro galleries often provide services to communities and artists, while service organisations can include a gallery and host exhibitions. However, while some organisations could fit into several categories, overall survey results show that there are distinct differences between these categories.
Survey Development
Key results of this report are based on a survey of Australia’s S2M visual arts organisations. The survey was developed in conjunction with the National Association for the Visual Arts (NAVA) and addressed key topics relating to the performance and funding of these organisations.
The full survey is in the Appendix, with questions on:
• Background of the organisation
• Activities and artistic output in the years 2012 to 2016 including:
o New works createdo Number of artists paid/commissionedo Number of exhibitions, events, workshops and exhibiting days
o Number of visitors• Staff and volunteer numbers and volunteer hours
• Income sources• Funding level• Major areas of spending• The organisation’s role in the wider arts ecosystem
• Key funding challenges for the organisation and wider S2M community
The survey was emailed in June 2016 to a list of 258 organisations identified by NAVA as being the key S2M visual arts organisations in each state and territory. Reminders by email and phone were conducted through July, August and early September.
79 organisations returned the survey, a response rate of 31 percent. High response rates were recorded for CAO, service organisations and C&DCs, while the larger numbers of regional galleries, ARIs and metro galleries had reduced response rates, as shown in Table 4.

Table 4 — Survey response by type of organisation
Total S2M organisations Returned surveys Response rate
Craft and Design Centre (C&DC)
11 6 55%
Artist Run Initiative (ARI) 65 21 32%
Service organisation 19 11 58%
Contemporary Arts Organisations (CAO)
14 9 64%
Metro Gallery 43 10 23%
Regional Gallery 102 22 22%
Total 254 79 31%
Table 5 — Survey response by state and territory
State Total S2M organisations Returned surveys Response rate
NSW 81 30 37%
Vic 73 19 26%
Qld 39 6 15%
SA 20 8 40%
WA 15 5 33%
ACT 9 3 33%
Tas 9 5 56%
NT 8 3 38%
Total 254 79 31%
The most responses were received from organisations in NSW and Victoria, while the states with smaller populations had higher proportional response rates. Only six responses were received from organisations in Queensland, as shown in Table 5. Survey are relatively detailed and this level of response is sufficient to give a good understanding of the operations and funding of the overall S2M sector and themes across the different types of organisations. More detailed interviews were conducted by phone and in person with case study organisations to further examine these issues.
3. MEET THE S2M ORGANISATIONS
The six identified S2M classifications are differentiated by their funding types, size, and role in the arts ecosystem, as shown in Table 6.
Table 6 — Classifying the S2M arts ecosystem
Primary input/funding Role in arts ecosystem
Artist run initiatives (ARIs) Volunteers Creating new artwork Experimentation and risk
Contemporary arts organisations (CAO)
State and federal government
Exposing art to larger audiences, international connection, advocacy and
professional development.
Craft and design centres (C&DCs)
Sales, state and federal government
Craft skills development and exposure and retail
Metro galleries State and local government
Exhibition spaces. Attracting attention from larger galleries
Regional galleries Local government Bringing art to the regions and supporting regional artists
Service organisations State and federal government
Advocacy, sector co-ordination, service provision and professional development
37 || 38
Response Summary of Classification

Artist run initiatives (ARI) play a key role in the Australian arts ecosystem, with respondents seeing their organisations as important in offering:
…opportunities to all artists, both emerging and established, to present their work. We pride ourselves on being able to offer opportunities to a huge number of artists, having a high level of artistic activity, and offering space to those artists who aren’t shown elsewhere. We show work that is experimental, on the periphery and not shown in other spaces. We are a space which supports art practice in all its forms and allows a supportive space for experimentation and professional development.
These spaces are often focused on the production and exploration of new arts practices, and run for the purposes of providing exhibition opportunities for the benefit of artists and local communities.
Many respondents emphasised ARIs’ importance for early career artists:
• … a fundamental role in providing initial steps in artists’ careers
• [ARIs] facilitate the work of emerging and experimental artists
• … space for mentoring and practice development. Our core practice is to assist artists in the furthering of their professional careers through exhibitions and curatorial projects
• We lecture, mentor and provide peer support to emerging artists and groups
Being run by artists themselves, ARIs allow for artistic boundaries to be pushed. In the words of one respondent, the ARI “model of governance allows us to champion risk and encourage ambition”.
The downside of being artist-run and championing risk is that many ARIs are not long-lived organisations.
One respondent lamented that they were often seen as “voluntary and temporary”, while another emphasised that closures “left a gap for artists working in live art and sound”, with new and remaining organisations providing “much needed opportunities for these artists.”
Not all ARIs are short-lived. Some key organisations have operated for decades and such organisations are able to help artists “reach beyond current audiences and stakeholders”. There is a strong sense of collaboration between these ARIs, which see themselves as “part of a dynamic group of long running, small-scale, art galleries”:
[We try] to capitalise on, rather than compete against, [our] neighbours. Extended opening hours where multiple openings are taking place in the precinct is one strategy trialled in 2015, supported with targeted marketing and media messaging from all institutions encouraging audiences to visit multiple spaces;
We have built a strong community around our practice … enabling our comrades to be part of a global dialogue that connects and supports experimental art forms.
ARIs receive the least funding support, so there is often an attempt to “connect multiple sources and community stakeholders and to not rely on government funding.” Money is scarce, output is high and artistic risks are taken, but high standards are always the goal:
We are one of the cheapest ARIs to exhibit at in Australia while still providing a relatively professional outcome.
Many do provide professional outcomes, with the consequence that many members of ARIs become established professionals. ARIs can have close links to better known Contemporary Arts Organisations (CAO) and well known metropolitan and regional galleries. They also have links to art schools and universities, and sometimes collaborate with community, social services and organisations for people with disabilities.
Table 7 — Average and total ARI outputs 2015-16
Average per ARI organisation Estimated ARI sector total
Years of operation 14 N/A
New works produced 289 18,785
Exhibitions, events held 57 3,705
Exhibition days 183 11,895
Workshops, etc 17 1,105
Publications 11 715
Website hits 31,086 2,020,602
Increasingly, ARIs are also using their websites as:
… unique online galleries, [to] present the work of local video artists in the gallery and throughout the website, which enables them to have their work viewed globally. This is giving a huge geographic reach to local Australian artists.
Table 7 presents the average responses from ARI respondents in relation to their organisation and its outputs. Multiplying this average across the 65 main ARIs identified by NAVA gives an estimate of the total outputs of Australia’s main ARIs:
As shown in Table 7, among survey respondents, the average ARI has been in operation for 14 years. It is important to note, however, that this average derived from operating organisations ignores the fact that many ARIs cease operations. Many ARIs did not respond to the survey as they had closed. According to NAVA the average life of an ARI is between three and ten years, substantially less than the average age of other types of arts organisations, discussed below.
Artistic output is high, with the average ARI producing 289 works in 2015-16, far more than the average for other types of organisation.
In terms of numbers of works produced, the estimated 18,785 works produced and shown by ARIs in 2015-16 is the bulk of new visual art work produced in Australia.
ARIs are dependent on artists and volunteers. Few are able to employ full time staff, relying on very few part-time and casual staff, with the average ARI having 17 volunteers on average, compared to 4 part-time and casual staff, as shown in Table 8.
Table 8 also shows that the average ARI received over 1,804 hours of volunteer time in 2015-16, with an average of 106 hours per volunteer, with the monetary value of this time being over $74,000 (Based on Australian average hourly wages. See Section 7. Spending for more details.). This represents the largest economic input into ARIs, 32% greater in value than the average funding received, which is little compared to other types of S2M arts organisations.
Table 8 — Average and total ARIs - people, 2015-16
Average per ARI organisation Estimated ARI sector total
Artists supported* 20 1,300
Visitors* 5,250 341,250
Residencies 9 585
Full time staff 0 19
Part time staff 2 130
Casual staff 2 130
Volunteers 17 1105
Volunteer hours 1,804 117,260
Value of volunteer hours $74,059 $4,813,865
3. MEET THE S2M ORGANISATIONS 39 || 40
Artist Run Initiatives (ARI)
* Median used due to wide and unbalanced distribution of responses

The average and estimated total funding of ARI organisations in 2015-16, from all source is in Table 9. Typical major expenses are also shown, with wages and rents being the major expenses of ARIs.
Most financial support for ARIs comes from state and local governments. However, in terms of the
economic value of inputs, private contributions in the form of volunteer time is the major input (57%), followed by government funding (30%) and other private funding in the form of sponsorship, philanthropy, sales and other (12%). Many ARIs are also subsidised by renting out gallery space to other artists. The breakdown of average economic inputs for ARIs is in Figure 19.
Table 9 — ARIs - average and total revenue and spending 2015-16
Average per ARI Estimated ARI
Australia Council funding $2,768 $179,911
Other Federal funding $286 $18,571
State government funding $21,805 $1,417,316
Local government funding $14,038 $912,476
Sales revenue $4,452 $289,405
Workshop revenue $0 $0
Sponsorship revenue $762 $49,524
Philanthropic funding $3,729 $242,357
Other revenue or funding $8,429 $547,857
Total revenue and funding $56,268 $3,657,420
Wages $14,133 $918,658
Rent $17,642 $1,146,709
Commissions $6,007 $390,483
Equipment/ IT $7,280 $473,179
Other expenses $11,634 $756,225Figure 19 — ARI revenue and spending chart
Note: See Figure 53: Average annual funding by organisation type for a comparison of funding sources by organisation type.
Volunteer 57%
Aust Council 2%
State Gov 17%
Local Gov 11%
Sales 3%Sponsorship 1%
Philanthropy 3%
Other Funding 6%
Contemporary Arts Organisations (CAO) are a recognised network of independent arts spaces in each state and territory that focus on the work of living artists. These relatively high-profile organisations both display and generate new works of art, and are an important stepping stone for many Australian artists. Most of them have strong international connections for collaboration and exchange. Through their formal network they help in “building a context for that work and connecting artists with audiences”. Because of their focus on contemporary art by living artists, providing residencies, training, education and development are also key roles of these organisations. (For more detail see Contemporary Arts Organisations Australia website: www.caos.org.au)
Survey respondents made the following comments about the role of their organisation in the arts ecosystem, supporting these overarching themes.
Advocacy, audience development, community engagement, education, international partnerships, professional development.
…enhance audience experience and our greater culture through a deeper engagement with contemporary art.
…support future pathways at early and pivotal points in a practitioner’s development. It frequently provides the first opportunity for new and recently graduated artists to exhibit their work in a public gallery, reaching a broad audience that includes the local community, artists, museum directors and curators.
…[CAO] might be understood as an incubator: providing resources, mentoring and support for both emerging and mature artists whilst promoting new and emerging ideas, forms and practices to the broader community
In similar vein to ARIs, CAO play a role in developing artistic careers, with a more formal focus on professional development and reaching larger audiences both in Australia and overseas, including making connections with major galleries and major exhibitions like biennales, as well as the commercial sector. While ARIs allow risk and innovation with less pressure on artists (except economic), CAO are more high profile with more pressure on standards - only one CAO respondent mentioned their role in providing “a site for experimentation, critical analysis, discussion and debate”. The high standards, profile and government funding of CAO give them less appetite for risk and artists less room for failure.
The emphasis on reaching audiences can be seen by the number of days of exhibitions of 357 per year, compared to 183 for ARIs (shown in Table 4). CAO are able to have larger, longer and simultaneous exhibitions due to having more space and greater funding to support the necessary fulltime paid staff, of which the average CAO has four.
3. MEET THE S2M ORGANISATIONS 41 || 42
Contemporary Arts Organisations (CAO)

The focus on building audiences is also clear in the data in Table 11. The average artist supported by CAO gets an audience of 956 people, compared to 263 for the average artist supported by ARIs. Table 11 also shows the reliance on employed staff to ensure these organisations are able to provide this level of support, with far less reliance on volunteer time than ARIs. The economic value of volunteer time is just 7% of the value of financial revenues for CAO, while it was 1.32 times larger than the financial revenues received by ARIs.
Table 12 shows the average CAO funding and expense structure, with state and federal governments providing 68% of funding on average. Wages are the major expense for CAO.
Incorporating the economic value of volunteer inputs, Figure 20 shows the breakdown of average funding of CAO. These organisations are much more formally organised and funded, with a strong input of state and federal funding.
Table 10 — Average and total CAO outputs 2015-16
Average per CAO organisation
Estimated CAO sector total
Years of operation 29 N/A
New works produced 66 924
Exhibitions, events held 33 462
Exhibition days 357 4,998
Workshops, etc 64 896
Publications 4 56
Website hits* 135,000 1,890,000
Table 11 — Average and total CAO - people, 2015-16
Average per CAO organisation
Estimated CAO sector total
Artists supported* 89 506
Visitors* 85,141 483,910
Residencies 9 126
Full time staff 4 54
Part time staff 3 40
Casual staff 8 112
Volunteers 35 490
Volunteer hours 1,237 17,318
Value of volunteer hours $50,769 $710,766
Figure 20 — Funding breakdown of CAO
Note: See Figure 53: Average annual funding by organisation type for a comparison of funding sources by organisation type.
Volunteer 6%
Aust Council 24%
State Gov 36%
Local Gov 2%
Sales 5%
Sponsorship 11%
Philanthropy 6%
Other Funding 5%
Table 12 — CAO - average and total revenue and spending 2015-16
Average per ARI Estimated ARI
Australia Council funding $187,993 $2,631,907
Other Federal funding $27,824 $389,531
State government funding $282,312 $3,952,368
Local government funding $15,863 $222,077
Sales revenue $41,150 $576,100
Workshop revenue $7,875 $110,250
Sponsorship revenue $84,770 $1,186,782
Philanthropic funding $47,981 $671,739
Other revenue or funding $39,780 $556,920
Total revenue and funding $735,548 $10,297,674
Wages $304,061 $4,256,852
Rent $52,871 $740,197
Commissions $170,794 $2,391,120
Equipment/ IT $12,445 $174,237
Other expenses $198,598 $2,780,372
Federal other 4%
Workshops 1%
3. MEET THE S2M ORGANISATIONS 43 || 44
* Median used due to wide and unbalanced distribution of responses
* Median used due to wide and unbalanced distribution of responses

Most Craft and Design Centres (C&DCs) are part of the network of Australian Craft and Design Centres, the recognised national network of organisations across the states and territories. These organisations vary considerably in their scope. Some specialise in particular crafts focussed on certain materials and techniques, such as glass, ceramics, and tapestry. Some are mainly production sites while others are largely exhibition and sales venues. For more detail, see www.object.com.au/we-love/acdc-network/.
While the role of C&DCs varies widely, a key differentiator between these and other organisations is the role of the sales of merchandise (contemporary craft works), and the focus on craft workshops. Survey respondents noted the role of C&DCs in the arts community as one of connecting craftspeople/designers, identifying new talent and providing a platform for design innovation, as the following comments attest.
Seed bed for testing new ideas in innovation and design and promoting an awareness of the value of design as a driver of innovation (and jobs and growth!!)
Promoting and developing emerging artists. Promoting and developing Alice Springs as a vibrant arts area
We liaise with the University in regards to best practice and student engagement
Only tapestry workshop in Australia. Actively collaborate with wide range of arts organisations on diverse range of programs.
C&DC organisations are a relatively small part of the arts ecosystem, but they are typically long-established (an average of 42 years), emerging from local craft guilds and slowly professionalising. Table 13 shows the average and total artistic output of this sector, revealing that these organisations are relatively focused on constant exhibiting of items, and conducting workshops focussed on developing practitioners in their specialised craft fields.
Table 13 — Average and total C&DC outputs 2015-16
Average per C&DC organisation
Estimated C&DC sector total
Years of operation 42 N/A
New works produced 8 88
Exhibitions, events held 55 605
Exhibition days 415 4,565
Workshops, etc 116 226
Publications 15 165
Website hits 36,000 396,000
Table 14 — Average and total C&DC - people, 2015-16
Average per C&DC organisation Estimated C&DC sector total
Artists supported 111 572
Visitors 70,670 264,000
Residencies 4 44
Full time staff 2 22
Part time staff 6 66
Casual staff 4 44
Volunteers 27 297
Volunteer hours 1,317 14,487
Value of volunteer hours $36,953 $406,478
C&DC organisations are relatively professionalised compared to ARIs, with an average of two full time staff and 10 part-time and casual (see Table 14), while still relying on some volunteer labour.
The value of volunteer labour is just 3% of the value of financial revenues, compared to 7% for CAO, and 132% for ARIs. Table 15 shows the average C&DC funding and expense structure, with state and federal governments providing 39% of funding on average. Sales account for 38% of average C&DC revenue. However, while sales are a major source of income for some C&DCs, for others they are not particularly significant.
For comparison, sales provide 8% of revenue to ARIs, and 6% to CAO. Wages are the major expenses for C&DC organisations. Workshop revenue is 5% of total revenues on average, which is far higher than ARIs (0%) and CAO (1%).
Incorporating the economic value of volunteer inputs, Figure 21 shows the breakdown of average funding of C&DCs, putting into perspective the relative importance of sales revenue to these organisations, and their role as providers of craft workshops to build artistic and design skills.
Table 15 — C&DC - average and total revenue and spending 2015-16
Average per C&DC organisation
Estimated C&DC sector total
Australia Council funding $115,900 $1,274,902Other Federal funding $56,623 $622,851State government funding $325,533 $3,580,863Local government funding $4,917 $54,087Sales revenue $494,706 $5,441,766Workshop revenue $62,250 $684,750Sponsorship revenue $85,696 $942,656Philanthropic funding $83,560 $919,160Other revenue or funding $63,826 $702,086Total revenue and funding $1,293,011 $14,223,121Wages $637,166 $7,008,822Rent $49,974 $549,712Commissions $249,869 $2,748,558Equipment/ IT $112,441 $1,236,851Other expenses $199,895 $2,198,846
Figure 21 — Funding breakdown of C&DCs
Note: See Figure 53: Average annual funding by organisation type for a comparison of funding sources by organisation type.
Volunteer 3%Aust Council 9%
State Gov 25%
Local Gov 0%Sales 37%
Sponsorship 6%
Philanthropy 6%
Other Funding 5%
Federal other 4%
Workshops 5%
3. MEET THE S2M ORGANISATIONS 45 || 46
Craft And Design Centres (C&DCS)

Metropolitan galleries (Metro galleries) are galleries and other organisations in capital cities. Many are operated by local governments, although there are also non-government community organisations, and some also function as commercial businesses. Survey respondents in this category of arts organisation saw their role in the arts ecosystem as mainly to support local artists and provide them with exposure, typically capitalising on their facilities, such as studios and gallery spaces, and connecting them with national and international galleries. Being largely funded by local and state governments, metro galleries often have a focus on promoting local art and artists. Survey respondents made the following comments about the roles of their organisations.
…providing quality, affordable studio and gallery space. [Our organisation] encourages experimentation, innovation, risk taking and critical dialogue… [Our organisation] continues to foster the careers of graduating artists from the [nearby university]…
We will continue to create new partnerships with like national and international galleries, theatre and dance companies (of similar aesthetic/thematic styles, organisational structure, resource base and scale) to co-commission new contemporary works through residencies and collaborations with Australian and international artists…
…brings artist from all over Australia and exposes them primarily to Sydney’s north shore. Provides exhibition spaces for artists to hire and exhibit their work, provides affordable artist studio space for local artists. Council offers small grants to local artists and arts organisations
We promote outstanding work in craft and design through our own regional and metropolitan galleries and through nationally touring exhibitions. We host residencies for national and international artists. We connect designer-makers to local manufacturers and a national distribution network. We provide studio spaces for independent artists.
Table 16 — Average and total metro gallery outputs 2015-16
Average per metro gallery Estimated metro gallery total
Years of operation 35 N/A
New works produced 30 1,290
Exhibitions, events held 94 4,042
Exhibition days 249 10,707
Workshops, etc 87 3,741
Publications 4 172
Website hits 21,556 926,908
Table 17 — Average and total metro gallery - people, 2015-16
Average per metro gallery Estimated metro gallery total
Artists supported 58 1,075
Visitors 50,313 1,010,500
Residencies 4 172
Full time staff 3 120
Part time staff 2 86
Casual staff 4 172
Volunteers 27 1,161
Volunteer hours 982 42,209
Value of volunteer hours $58,122 $2,499,246
Metro galleries typically hold many exhibitions and events, being 94 per year, which is far above the number held by other arts organisations. They also hold a relatively high number of workshops.
These metro galleries are professionally run, employing three full-time staff on average, and six part-time and casual staff, as well as relying on a small amount of volunteer time, of which the economic value of that time is 10% of financial revenues (above the 7% for CAO and 3% for C&DCs).
Table 18 shows the average metro gallery funding and expense structure, with local government providing 43% of funding on average, suggesting that these organisations are one of the primary arts activities funded by local governments. Incorporating the economic value of volunteer inputs, Figure 22 shows the breakdown of average funding of metro galleries. These organisations can be considered a local government contribution to the arts ecosystem, with a focus on supporting local artists and providing exposure to local artists.
Table 18 — Metro galleries - average and total revenue and spending 2015-16
Average per metro gallery Estimated metro gallery total
Australia Council funding $60,724 $2,611,116
Other Federal funding $4,545 $195,455
State government funding $81,663 $3,511,513
Local government funding $224,636 $9,659,364
Sales revenue $22,421 $964,083
Workshop revenue $30,091 $1,293,909
Sponsorship revenue $9,693 $416,815
Philanthropic funding $17,755 $763,445
Other revenue or funding $72,573 $3,120,651
Total revenue and funding $524,101 $22,536,351
Wages $199,907 $8,596,008
Rent $50,913 $2,189,245
Commissions $61,395 $2,639,973
Equipment/ IT $82,508 $3,547,865
Other expenses $129,528 $5,569,698
Figure 22 — Funding breakdown of metro gallery
Note: See Figure 53: Average annual funding by organisation type for a comparison of funding sources by organisation type.
Volunteer 9% Aust Council 10%
State Gov 14%
Local Gov 39%
Sales 4%
Sponsorship 2%
Philanthropy 3%
Other Funding 13%
Federal other 1%
Workshops 5%
3. MEET THE S2M ORGANISATIONS 47 || 48
Metro Galleries

Regional galleries are mainly closely related to local governments, although some are independent and privately funded. While some are relatively remote and modest, others are important cultural centres recognised within their state and relatively large. A handful have over 10 full time employees. There are also many more regional art galleries across the country than metro galleries, or even CAO and C&DCs, making them a large part of the overall arts ecosystem.
What differentiates the regional galleries is their focus on touring exhibitions and regional artists. Some have collections and can specialise in a particular artform. They also act as a hub for the cultural life of the regional community offering work and meeting space for members of the local artistic community. They expose the regions to art from elsewhere, and help regional artists get exposure locally and elsewhere. The following comments attest to this role of bring art to the regions.
Our aim is to bring the highest quality visual art to regional NSW.
[We have] developed and toured a number of exhibitions nationally
Host travelling exhibitions from major institutions Australia wide…
Showing and sometimes touring regional art, and supporting local regional artists.
…we collaborate with a range of touring companies, galleries, artists, curators and arts organisations.
In terms of offering local support to regionally-based artists, the survey respondents highlighted this part of their role in the arts ecosystem with the following comments.
Plays an important role in assisting career paths for regionally based artists
We offer arts professionals in our region formal employment opportunities as well as work experience and internships for students.
The output of the average regional gallery from survey responses is in Table 19, with a high number of exhibition days, given the touring nature of many exhibitions.
Table 19 — Average and total regional gallery outputs 2015-16
Average per regional gallery Estimated metro regional total
Years of operation 27 N/A
New works produced 41 4,182
Exhibitions, events held 40 4,080
Exhibition days 351 35,802
Workshops, etc 78 7,956
Publications 5 510
Website hits 30,000 3,060,000
Table 20 — Average and total regional gallery - people, 2015-16
Average per regional gallery Estimated regional gallery total
Artists supported 33 3,366
Visitors 40,257 4,106,182
Residencies 2 204
Full time staff 3 311
Part time staff 2 241
Casual staff 3 352
Volunteers 39 3,978
Volunteer hours 643 65,632
Value of volunteer hours $76,708 $7,824,216
Table 21 — Regional galleries - average and total revenue and spending 2015-16
Average per regional gallery Estimated regional gallery total
Australia Council funding $2,082 $212,345
Other Federal funding $64 $6,491
State government funding $22,732 $2,318,645
Local government funding $297,961 $30,392,050
Sales revenue $28,336 $2,890,318
Workshop revenue $4,814 $490,991
Sponsorship revenue $8,091 $825,273
Philanthropic funding $9,477 $966,682
Other revenue or funding $3,985 $406,465
Total revenue and funding $377,542 $38,509,261
Wages $209,536 $21,372,640
Rent $32,469 $3,311,796
Commissions $26,098 $2,661,953
Equipment/ IT $20,809 $2,122,540
Other expenses $88,368 $9,013,574
3. MEET THE S2M ORGANISATIONS 49 || 50
Regional Galleries
The number of local artists supported is not particularly high on average, though there is a lot of variation, partly due to the relative size of the organisations themselves. Though in terms of visitor numbers, regional galleries have about 80% of the numbers of metro galleries on average, with 40,000 per year, compared to 50,000 per year for metro galleries.
Like metro galleries, regional galleries are predominantly funded by local government, with 79% of revenue from this source, and 86% of funding from all levels of government. Average revenues are about 72% of the average of metro galleries, at $377,542 per year. The major costs for these organisations are the wages of their staff, with three full-time staff on average.
Figure 23 shows the breakdown of average funding of regional galleries. Like metro galleries, regional galleries are predominantly funded by local governments, but with a greater reliance on volunteers to keep them running.
Figure 23 — Funding breakdown of regional galleries
Note: See Figure 53: Average annual funding by organisation type for a comparison of funding sources by organisation type.
Volunteer 17%
Aust Council 0%
State Gov 5%
Local Gov 66%
Sales 6%
Sponsorship 2%
Philanthropy 2%
Other Funding 1%
Federal other 0%
Workshops 1%

Service organisations provide a diverse range of services to artists, communities and other arts organisations. Some are membership based and provide professional services such as legal and professional advice and skills training while others are peak bodies, representing particular groups of artists or galleries or in one case, the sector as a whole. Several also host workshops, forums, exhibitions and run festivals. Most don’t provide exhibition space or commissioning services. This group is rather diverse, and the organisations fulfil a range of roles in the arts ecosystem, but the main ones are advocacy and professional development.
Survey respondents noted their ability to give artists a say in the regulatory environment affecting the artistic community, noting their roles of:
Advocacy on issues affecting Australian creators – e.g. artists fees, freedom of expression, social security, copyright, privacy, Indigenous cultural and intellectual property
…representative voice to both government and the media for all things relating to the visual arts sector
In terms of training and professional development, survey respondents reported their role in such matters with comments such as:
Education and professional development on legal and business issues
…mentorship and affordable peer to peer skills development and training
…professional development specifically targeted to arts professionals
While the service organisations are a diverse group, on average they have been established for over 30 years (see Table 22).
Like other S2Ms, service organisations rely on volunteer time, which has a value of about 7% of the total revenue and funding, which is about the same as CAO.
Table 24 — Service organisations - average and total revenue and spending 2015-16
Average per service organisation Estimated service organisation total
Australia Council funding $134,585 $2,557,118
Other Federal funding $88,216 $1,676,097
State government funding $246,542 $4,684,298
Local government funding $15,575 $295,927
Sales revenue $153,636 $2,919,084
Workshop revenue $8,327 $158,213
Sponsorship revenue $12,127 $230,413
Philanthropic funding $33,531 $637,089
Other revenue or funding $54,553 $1,036,505
Total revenue and funding $747,092 $14,194,745
Wages $410,070 $7,791,338
Rent $29,303 $556,749
Commissions $24,073 $457,386
Equipment/ IT $40,509 $769,671
Other expenses $243,137 $4,619,601
Figure 24 — Funding breakdown of service organisations
Note: See Figure 53: Average annual funding by organisation type for a comparison of funding sources by organisation type.
Volunteer 8%
Aust Council 21%
State Gov 37%
Local Gov 2%
Sales 3%
Sponsorship 2%
Philanthropy 5%
Other Funding 8%
Federal other 13%
Workshops 1%
3. MEET THE S2M ORGANISATIONS 51 || 52
Table 22 — Average and total service organisation outputs 2015-16
Average per service organisation Estimated arts organisation total
Years of operation 32 N/A
New works produced 31 589
Exhibitions, events held 20 380
Exhibition days 246 4,674
Workshops, etc 62 1,178
Publications 11 209
Website hits 90,000 1,710,000
Table 23 — Average and total service organisation - people, 2015-16
Average per service organisation Estimated service organisation total
Artists supported 69 456
Visitors 47,695 38,000
Residencies 4 76
Full time staff 3 57
Part time staff 2 36
Casual staff 2 38
Volunteers 39 741
Volunteer hours 1,119 21,261
Value of volunteer hours $49,214 $935,066
Service Organisations

4. SURVEY RESULTS — OUTPUTS
Survey respondents reported on facilitation of the production of new works of art between 2012 and their projection for 2016. Number of works created has increased slightly over the survey period, as shown in Figure 25.
The increase in numbers of works produced underscores a common theme in comments by respondents – that the key challenges for their organisations are in core management functions, rather than a lack of artwork being produced and talented artists. Ensuring the quality of the work, curating, managing and promoting its display to the public is a constant challenge, while simply facilitating the production of numbers of works is relatively straightforward. As one respondent explained, “We are not short of good ideas and valuable initiatives that would benefit our members greatly. However, access to project funding to help get these initiatives off the ground is limited and competition is very high.”
ARIs provide support for the greatest quantity of new works, accounting for nearly three quarters of the new artworks produced by the S2M community. Public galleries in metro and regional areas also support production of new works, as shown in Figure 26.
The average ARI supports the production of over 250 new works per year, although many of these are small works that may never go on to public exhibition or sale. Conversely, C&DCs help produce far fewer works, but they are complex and time consuming works such as tapestries that take months to produce. Survey data takes no account of complexity or quality of new works produced.
Figure 25 — New works created 2012 to 2016
2012 2013 2014 2015 2016(projected)
4,6584,919 4,972
5,2185,535
Source: Ecolarge/NAVA survey
Figure 26 — New works by type of organisation
C&DC 1%
ARI 74%
Service Organisation
6%
Metro Gallery
4%
Regional Gallery 8%
CAO 7%
Numbers of exhibitions and events held by survey respondents increased dramatically from 2012 to projections for 2016. An increase of nearly 60% of numbers of exhibitions and events occurred during this period, as shown in Figure 27 below:
In particular, ARIs, metro gallery and regional gallery respondents reported increasing numbers of exhibitions and events. CAO and C&DCs also reported increases, as shown in Figure 28 below:
Figure 27 — Numbers of exhibitions
2012 2013 2014 2015 2016(projected)
2,5122,815 2,899
3,2833,583
Figure 28 — Respondent events and exhibitions by organisation type
2012 2013 2014 2015 2016 (projected)
1,200
Metro Gallery
ARI
Regional Gallery
C&DC
Service Org
CAO
1,000
800
600
400
200
4. SURVEY RESULTS — OUTPUTS 53 || 54
New Works Exhibitions and Events

While the number of exhibitions and events has been increasing rapidly, the number of days per year available for exhibiting remains fairly constant, with organisations having exhibitions open an average of 320 days per year. Some organisations are able to host separate exhibitions at the same time and count these separately. Overall, numbers of exhibition days has increased, but at a far slower rate than numbers of exhibitions, as shown in Figure 29 below.
With numbers of exhibitions increasing, but exhibition days relatively steady, exhibitions are becoming shorter and/or organisations are hosting more exhibitions at the same time. This reflects a common response in the survey that funding is being increasingly directed towards exhibitions and events and away from funding the management and general operation of S2M organisations.
One respondent that organises a biennial event explained that the funds they receive are “purely project based, meaning there are no funds to cover the work required during the ‘down’ year”. This trend is seen even more clearly in numbers of workshops, classes, outreach functions, etc, hosted by survey respondents; a 61% increase is shown in Figure 30.
While the nature of these events, workshops, etc, varies between organisations, from small opening nights to major festivals, the trend of large increases in numbers of events hosted is almost universal across survey respondents. From small regional galleries to the best known metropolitan organisations, almost every organisation reported increasing numbers of events, workshops and other functions.
Figure 29 — Numbers of exhibiting days
2012 2013 2014 2015 2016(projected)
15,995 16,974 17,055 17,398 16,776
Figure 30 — Total respondent numbers of workshops, classes, outreach functions
2,696
3,337 3,245
3,9214,352
Several respondents noted that it is easier to get funding for projects that involve events and that funding can be tied to conducting workshops and community engagement functions. One respondent put it directly that “the difficulty in securing funding for operations results in S2M arts orgs feeling the pressure to host more events, more exhibitions, do more (as they receive project funding instead) within an org that is already at capacity in terms of staff resources.”
Often organisations are only eligible for ongoing program funding if they have been successful in obtaining funding for events on other occasions. Many respondents emphasised that events, public classes, workshops and community engagement days were requirements for funding. Often these are aimed at specific parts of the community – local community, youth, Indigenous Australians, people from areas of the city or state seen to be disadvantaged or politically important, such as Western Sydney.
Most organisations offered increasing numbers of events through this period, with the most in public galleries in metro and regional areas, as shown in Figure 31 below.
Figure 31 shows a small decline in the number of workshops and classes held by C&DCs. Some C&DCs hold hundreds of community classes each year, while others hold less than ten specialised workshops. The changes in Figure 31 are dominated by the organisations with many classes, which have seen some reductions, while organisations less focused on teaching have seen modest increases in workshop numbers.
Figure 31 — Respondents workshops, classes, etc by organisation type
2012 2013 2014 2015 2016 (projected)
1,400
Metro Gallery
ARI
Regional Gallery
C&DC
Service Org
CAO
1,200
800
600
400
200
1000
0
4. SURVEY RESULTS — OUTPUTS 55 || 56
2012 2013 2014 2015 2016(projected)

Other outputs such as numbers of publications and research papers have also increased, though not to the same extent as events and exhibitions as shown in Figure 32 below.
While some increase is seen across most of the respondents, types of publications varied considerably. Some refer to printed newsletters, while others are substantial catalogues of exhibitions or research papers published in academic journals.
Most of the increase seen in Figure 32 is driven by smaller publications such as newsletters rather than a reported increase in publishing of major artistic or academic work. This can be seen in Figure 33 below, with relatively stable levels of publications reported by service organisations, which focus more on research and advocacy, with increases reported by ARIs referring more to information about exhibitions and events:
Figure 32 — Publications and research papers
318357 359 366 391
2012 2013 2014 2015 2016 (projected)
140
Metro Gallery
ARI
Regional Gallery
C&DC
Service Org
CAO
120
80
60
40
20
100
0
Figure 33 — Reported publications by organisation type
Almost all respondents reported increased online activity, as would be expected given increased use of the websites and different social media platforms, as shown in Figure 34 below.
Comparison and aggregation is difficult, however, as different organisations use and prioritise different online tools.
Overall website and social media traffic had more than doubled for most organisations between 2012 and 2015. On average the increase was 154%, although this varies widely. One organisation reported an increase in website hits from 925 in 2012 to over 23,000 in 2015, while some more established organisations saw only small increases.
Organisations that run biennial festivals see large variations in website hits, partly explaining the pause in growth in 2015 seen in Figure 34.
Average website hits by type of organisation in 2015-16 is reported below.
Despite the overall increase in website and social media traffic, few organisations identified IT, websites or social media challenges for their organisation. Spending on IT and equipment was also a relatively small part of expenditure, as discussed in the spending section below though periodic major redesign of websites posed a challenge.
Figure 34 — Reported website and social media hits
2,788,545
4,137,168
5,028,854 4,830,495
6,458,311
CAO
Service Organisation
C&DC
ARI
Regional Gallery
Metro Gallery
135,000
95,456
40,000
31,086
30,000
21,566
Figure 35 — Average website hits by organisation type 2015-16
4. SURVEY RESULTS — OUTPUTS 57 || 58
Publications, Research Papers and Online
Websites and Social Media
2012 2013 2014 2015 2016(projected)
2012 2013 2014 2015 2016(projected)

The S2M sector provides payment, commissions and other in-kind support to thousands of artists each year. Artist fees are crucial to new work development and artists’ career longevity. A risk identified by one respondent if this sort of support did not continue was that “artists will have to take on alternative work, rendering their practice ‘a hobby’ or something that is done in their [own] space and time.”
With the loss from 2017 of operational funding for 50% of the visual arts S2Ms previously funded by the Australia Council, there is expected to be a big impact on artists.
NAVA is calling for a government allocation of $5 million a year to assist underfunded S2M organisations to be able to pay artists fees at least at the minimum level recommended in the Code of Practice for the Professional Australian Visual Arts, Craft and Design Sector.
Until the end of 2016, respondents reported a steady increase in numbers of artists supported every year, a 23% increase between 2012 and 2016, as shown in Figure 36.
This data refers to direct commissioning, payment or provision of service such as studio space for artists, rather than professional services or representation of the wider sector.
5. PEOPLE
Figure 36 — Artists supported by respondents
2,540 2,5842,795 2,906
3,116
This is why service organisations report relatively low numbers, while on a per-organisation basis C&DCs support the most artists, as shown in Figure 37.
Figure 37 shows that C&DCs support or commission the largest numbers of artists directly, assisted by several having a retail focus.
However, the large numbers of regional galleries, metro galleries and ARIs mean they support the largest numbers of artists across the entire Australian S2M community, as shown in Figure 38.
Figure 38 shows that in terms of numbers of artists supported in Australia, regional galleries are very important, with such a large number of galleries and often a focus on the local community.
C&DC
Metro Gallery
ARI
Service Organisation
CAO
Regional Gallery
111
58
57
53
45
33
Figure 37 — Average number of artists supported by type of organisation, 2016
Regional Gallery
ARI
Metro Gallery
C&DC
CAO
Service Organisation
3,366
1,300
1,075
572
560
456
Figure 38 — Total estimate of artists supported by S2M organisation type
5. PEOPLE 59 || 60
Artists Supported or Commissioned
2012 2013 2014 2015 2016(projected)
Regional Gallery

Numbers of residencies hosted by respondents has increased by almost 50% between 2012 and 2016, as shown in Figure 39.
The increase in residencies stems largely from ARIs, CAO and regional galleries, while the other organisation types show no clear trend, as shown in Figure 40.
One respondent suggested that as studio space has become more expensive, more S2M organisations are being pushed to host residencies for artists that can no longer afford space independently.
Figure 39 — Residencies hosted by respondents
190 194227
271 280
Figure 40 — Respondent residencies by organisation type
2012 2013 2014 2015 2016 (projected)
Metro Gallery
ARI
Regional GalleryC&DC
Service Org
CAO
120
80
60
40
20
100
0
The S2M organisations that responded to the survey receive over two million visits each year. Overall attendance to these organisations has increased by 22% since 2012, as shown in Figure 41 below.
Overall, there is a clear trend of growth in visitor numbers, while some variation is seen in Figure 41 above, as some organisations run biennial festivals that attract hundreds of thousands of visitors in one year and far fewer visitors to their permanent premises the next. This can be seen clearly in Figure 42 below, where a particularly well attended festival by an arts organisation increased numbers substantially in 2014.
Figure 42 shows strong growth in visitors to regional galleries. Several large regional galleries opened or completed major renovations during this period, fuelling this increase. On a per-organisation basis, CAO and C&DCs attract the most visitors, as shown in Figure 43 below:
Visitation to arts service organisations vary widely between organisations. Some concentrate on providing professional and training services to artists and service organisations and receive relatively few visitors. Others run events, festivals and exhibitions at their premises and have much higher numbers of visitors.
Figure 41 — Visitors to S2M arts organisations
3,097,2872,905,2082,948,8842,882,701
2,541,181
CAO
C&DC
Metro Gallery
Service Organisation
Regional Gallery
ARI
85,141
70,670
50,313
47,695
42,385
12,473
Figure 43 — Average annual visitation by organisation type 2015-16
Figure 42 — Respondent visitors by organisation type (refer over page)
2012 2013 2014 2015 2016 (projected)
Metro Gallery
ARI
Regional Gallery
C&DCService Org
CAO
90,0000
0
80,0000
70,0000
60,0000
50,0000
40,0000
30,0000
20,0000
10,0000
5. PEOPLE 61 || 62
Residencies Visitors
2012 2013 2014 2015 2016 (projected)
2012 2013 2014 2015 2016 (projected)

A key challenge for S2M arts organisations is attracting and keeping full time staff to perform core management functions. One respondent explained the main challenge was being able to provide “wages that support and attract high quality and experienced arts administrators.” Across the 79 organisations that submitted surveys they reported just 180 full time staff, a figure that had declined from a peak of 197 in 2013. Reported numbers of part time staff had increased slightly, while steady growth in casual staff numbers has been reported since 2013, as shown in Figure 44.
Staffing levels vary widely between types of organisations. Most organisations are run by one to three full time staff, with two part time staff and varying numbers of casual staff, as shown in Figure 45.
Some organisations reported increasing numbers of casual staff, closely related to the increased numbers of events, workshops and community engagement functions that they are being pushed to conduct. Such events require staff for short periods, rather than longer term employment. Organisations experiencing funding cuts report cutting back on core operational staff, most likely to be full time workers, and moving to run events and discrete projects favoured by funders.
Figure 45 — Average staffing levels by type of organisation 2016
CAO
C&DC
Regional Gallery
Metro Gallery
Service Organisation
ARI
4 3 9
42 5
3 32
0 22
3 42
3 32
188
175
233
197
177
249
185
186
256
180
181
244
180
189
275
2012 2013 2014 2015 2016
Casual
Part Time
Full Time
Figure 44 — Reported staffing levels
This pattern is clearly shown in Figure 46 below, which compares the numbers of events held by responding regional galleries. With more events, more casual workers are required:
While overall employment in the S2M arts community may be increasing, most of these people work on events and outreach rather than developing, curating or promoting Australia’s visual art, or managing the institutions that do. Few survey respondents expressed any negativity towards increased requirements to hold events; most see this as a desirable and central part of the role of their organisations and the S2M community.
Serious concern is expressed, however, that there are insufficient and declining resources directed to core operations, while events and other funding requirements continue to grow. Unpaid overtime hours, personal stress and an impression that many organisations and their staff are stretched to breaking point is clear from many responses.
Part of the response to these pressures has been to rely on volunteers. Hours donated by volunteers has been increasing steadily since 2012. The responding organisations reported volunteer hours increasing by almost 15% through this period from over 107,388 hours to nearly 124,114 hours, as shown in Figure 47.
Events, workshops,
Casual staff1000900
2012 2013 2014 2015 2016(projected
Casual staffEvents, workshops, etc.
800700600500400300200100
80
70
60
50
40
30
20
10
Figure 46 — Respondents’ events and casual staff in regional public galleries
124,114120,932115,878113,615
107,388
Figure 47 — Respondents volunteer hours
5. PEOPLE 63 || 64
Staff and Volunteers
2012 2013 2014 2015 2016 (projected)
Casual
Part Time
Full Time

This increase has been driven primarily by ARIs and regional galleries. Several regional galleries opened and had expansions through this period, as did a handful of ARIs that reported increasing volunteer contributions, as shown in Figure 48.
The average volunteer hours and full time equivalent employment by organisation type is reported in Table 25.
Table 25 shows that among respondents, public regional galleries receive the greatest input from volunteers, just under 1,900 hours per year, equivalent to a full time position, or equivalent of $76,708 in wages. ARIs also benefit on average from almost one full time equivalent worker in volunteer hours, or around $74,000 in wages, while other organisations receive slightly less support. Averages obscure wide variation between organisations.
One service organisation reports receiving over 10,000 hours of volunteer hours per year, much of it from highly-skilled professionals. Several organisations of all types reported receiving many thousands of volunteer hours every year. Overall, assuming volunteer time is worth the equivalent of Australian average wages, respondents received over $4 million worth of volunteer time each year, and $4,704,000 has been projected for 2016.
This underscores the support the S2M sector receives from volunteers. As shown in the next section, this volunteer time is equivalent to almost 25% of the total government support given to the sector.
Table 25 — Average volunteer hours and FTE by organisation type
Average 2016 hours
Full time equivalent Equivalent average wage
Craft and Design Centre (C&DC)
1,317 0.5 $ 54,060
Artist Run Initiative (ARI) 1,804 0.9 $ 74,059
Service organisation 1,199 0.7 $ 49,214
Contemporary Arts Organisations (CAO)
1,237 0.7 $ 50,769
Metro Gallery 1,416 0.5 $ 58,122
Regional Gallery 1,868 1.0 $ 76,708
Note: Based on Full-time adult average weekly ordinary time earnings of $1,516, see Australian Bureau of Statistics (2016)6302.0 - Average Weekly Earnings, Australia, http://www.abs.gov.au/ausstats/[email protected]/mf/6302.0
2013 2014 2015 2016
Metro Gallery
ARI
Regional Gallery
C&DC
Service Org
CAO45,000
30,000
25,000
20,000
40,000
0
Figure 48 — Trends in volunteer hours by organisation type
35,000
15,000
10,000
5,000
0
6. REVENUE
The S2M sector receives funding from federal, state and local governments as well as own-source revenue, sponsorship and philanthropy. While there are many funding sources available, competition for each is intense and the priorities of different funding bodies and conditions attached to their grants vary widely.
Applying for grants and ensuring all requirements are completed and documented is identified by many respondents as a major organisational challenge as explained by a respondent: “unstable funding sources make organisational growth difficult as already limited time and resources are directed to lobbying, re-strategizing and fund-seeking instead of focussing on an organisation’ core remit and vision.”
Non-government
Government $mill
ions
22.8 24.4
11.1
24.3
12.7
24.5
11.19.9
21.9
9.9
Note that these totals exclude several one-off grants for capital expenditure, discussed in ‘Other Federal Government funding’ section.
Figure 49 — Overall funding to respondents, government and non-government sources
4.8
1.6
8.1
7.4
Local
State
Federal - other
Australia Council
5.1
1.8
8.3
7.5
5.5
1.5
8.9
8.4
4.8
1.4
8.7
9.4
4.5
1.6
8.8
9.6
Note that these totals exclude several one-off grants for capital expenditure, discussed in ‘Other Federal Government funding’ section.
Figure 50 — Funding from government sources
65 || 66
Respondents reported total funding of between $33 million and $40 million in each of the years between 2012 and 2016. Almost three quarters of funding comes from government sources, with the remaining quarter coming from various other sources, as shown in Figure 49.
Figure 49 shows that overall government spending increased in this period initially and plateaued from 2014.
A strong year for non-government funding saw overall funding for respondents peak in 2015. Government and non-government funding are explored in more detail through this section.
Figure 50 shows the funds received from all government sources by respondents, splitting federal funding into Australia Council and ‘Federal-other’ funding.
Overall Trends and Totals
2012 2013 2014 2015 2016
$mill
ions
2012 2013 2014 2015 2016

A key trend to note in Figure 50 is the large contribution to S2M organisations from state and local governments. Local governments’ contributions have been increasing in absolute terms and as a proportion of all government funding. This continues the trend observed in earlier ABS data in the Background section. In Figure 51 below, funding from each level of government is presented as a percentage of total government support:
Figure 51 shows that local government support of S2M organisations has increased from 34% of total government funding to 39% in this period while total federal government support has declined overall from 29% to 24%. This reflects observations by many respondents that they have felt the Federal Government has been abandoning the S2M community over a long period of time.
Highlighting the need for support across the three levels of government one respondent explained that they are “currently receiving triennial funding from local government, however were recently unsuccessful in state government and federal government 4 year funding, reducing our ability to grow and develop the organisation and plan for the future.”
The results in Figure 51 understate the trend of reduced Federal government support. Importantly, these results do not include the large reductions and changes to federal funding that will begin in 2017. As a respondent explained “the capping of operational funding from the Australia Council at $300,000/annum, with no opportunity to seek project funds for the duration of the operational funding period (4 years) means a substantial reduction in funding support for larger ‘small-to-medium’ organisations.”
Furthermore, these results understate the contributions of local government (and to some extent state governments) as they do not consider the free and discounted premises many organisations receive from local government. Unfortunately, a respondent explained that there “is little opportunity for growth in operational funding within the local government context”, highlighting the challenging funding situation S2Ms find themselves in even with increasing local government support.
The most important sources of non-government funding are shown in Figure 52.
All funding sources are discussed in more detail in the following sections.
34%
37%
7%
22%
33%
37%
8%
22%
35%
36%
6%
23%
39%
36%
6%
20%
39%
36%
6%
18%
Figure 51 — Proportions of government funding to respondents
3.7
0.7
2.0
1.4
2.1
3.9
0.91.3
1.5
2.3
3.8
0.71.4
3.1
2.1
4.7
1.0
2.1
2.6
2.4
4.5
1.0
1.6
1.7
2.4
$mill
ions
Figure 52 — Non-government revenue to respondents 2012-2016
6. REVENUE 67 || 68
Local
State
Federal - other
Australia Council
2012 2013 2014 2015 2016
Other
Philanthrophy
Sponsorships
Sales
2012 2013 2014 2015 2016
Workshops

6. REVENUE 67 || 68
Different types of S2M organisation receive different amounts of income and are funded by different sources. Figure 53 below shows the annual average funding for the average of each organisation type and breaks down the average proportions of that funding. Figure 53 also includes the monetary value of volunteer time, discussed in the volunteer section.
Figure 53 shows that C&DCs on average have the highest levels of overall revenue. As discussed in the Sales section below, some C&DCs have very high sales, while others have relatively little. Excluding the ‘Big 2’ sales organisations sees funding for C&DCs adjust to a very similar magnitude and structure to CAO. Regional and metro galleries receive much of their funding from local government – around 80% for regional galleries.
ARIs operate on budgets generally well below $100,000 per year and are heavily reliant on volunteer time.
The funding proportions in Figure 53 are shown more clearly in the pie charts in the ‘Meet the S2Ms’ section, which break down funding and volunteer support as percentages for each organisation type.
Behind these averages is considerable variation. For example, at least one ARI is funded entirely by sales, while one regional gallery receives no local government assistance. Overall, however, these averages illustrate how different types of S2M organisations differ from each other in terms of the support they receive and the challenges they face. The following sections discuss these results in more detail.
Figure 54 — Australia Council funding to all respondents 2012-2016
4.454.82
5.545.07
4.78
$ m
illio
ns
Figure 53 — Average annual funding by organisation type
Overall Revenue by Organisation Type
200,000 400,000 600,000 800,000 1,000,000 1,200,000 1,400,000
C&CD
CAO
Service Organisation
Public gallery - Metro
Public gallery - Regional
ARI
Aust Council
Federal other
State gov
Local gov
Sales
Workshops
Sponsorship
Philanthropy
Other funding
Volunteer
The Australia Council is the Federal Government’s arts funding and advisory body. 30 of 73 respondents received some funding from the Australia Council between 2012 and 2016, with 19 receiving some funding in every year. In total, respondents received around $4.9 million from the Australia Council in each year, as shown in Figure 54 below. This represents a quarter of Australia Council visual arts funding through this period which ranged between $16 million and $22 million (See Australia Council (2015) Annual report page 22).
The substantial increase in 2014 was caused by three organisations. Two arts service organisations received funding increases of over $200,000 for particular projects, while one regional gallery received over $100,000 for a one-off fellowship and a specific exhibition. The increase to these service organisations is evident in Figure 55.
Figure 55 shows that among respondents, most Australia Council funding of respondents goes to service organisations and CAO.
However, with federal government funding cuts to the Australia Council, several of these key organisations have not secured ongoing funding from the Australia council with significant reductions seemingly set for the coming years. ARIs and regional public galleries receive relatively little funding from the Australia Council so are not affected directly.
As discussed in the Background section, many S2M visual arts organisations have had their Australia Council operational funding cut as part of reductions in overall Australia Council funding, which cannot be compensated by project funding. This is causing major problems for the future of many in the S2M community. As one respondent explained, “recent changes to the Australia Council for Arts have created uncertainty for program funding into the future”. Another respondent stated that a “loss of operational funding from the Australia Council has severely impacted our ability to work with artists at the level that we have previously, and has forced us to re-scale our business model and proposed future activities”.
Australia Council
2012 2013 2014 2015 2016 (projected)
Figure 55 — Australia Council funding of respondents by organisation type
Metro Gallery
ARIRegional Gallery
C&DC
Service OrgCAO
2,500,000
0
2,000,000
1,500,000
1,000,000
500,000
02012 2014 2015 2016 2013

Other federal government agencies provide funding to S2M arts organisations. Examples include the Department of Foreign Affairs and Trade, which funds projects that engage with international artists and organisations, and the Department of Regional Australia, Local Government, Arts and Sport, which funds the building of metropolitan and regional arts centres. Some of these investments are one-off funding for specific construction or building renovation projects or other capital investments.
As a result of the one-off nature of most capital spending from the federal government, it varies substantially from year to year. These large capital expenditure grants are important for individual organisations (usually regional galleries), but provide little insight into the operational funding of the S2M sector and can distort average results.
Therefore they have been omitted from most total and averages in this report, but are shown as a separate series in Figure 56.
Most non-capital expenditure, non-Australia Council Federal Government spending goes to service organisations, and smaller amounts to C&DCs, CAO and regional galleries. ARIs and metro galleries rarely receive other federal funding, as shown in Figure 57 below:
A significant portion of the funding to service organisations shown in Figure 57 above goes to those that work with Indigenous artists in remote areas. C&DC funding also focuses on regional or remote engagement, while regional galleries and CAO funding tends to be project-based.
2012 2013 2014 2015 2016
1.541.821.57 1.59
3.50
1.00
$mill
ions
1.41
4.00
Figure 56 — Other federal government funding of respondents
Figure 57 — Other federal operational funding by organisation type
2012 2013 2014 2015 2016
Metro GalleryRegional Gallery
C&DC
Service Org
CAO
1,400,000
0
1,200,000
1,000,000
600,000
400,000
800,000
200,000
6. REVENUE 69 || 70
Other Federal Government Funding
State Government Funding
Operational and project funding
Capital expenditure
State and territory governments also contribute to funding S2M arts organisations, with funding to respondents showing little change between 2012 and 2016, as shown in Figure 58 below.
State funding to respondents primarily goes to service organisations, CAO and C&DCs as shown in Figure 59.
It is important to note that Figure 59 refers to totals reported by respondents. Because there are only small numbers of service organisations, CAO and C&DCs, high rates of which responded to our survey, Figure 59 could give the impression that this is where most state government funding of S2Ms goes.
However, it is important to remember that there are far larger numbers of regional and metro galleries and ARIs, with fewer responding to our survey. Based on the average funding to each type of organisation, our estimates of total state funding to each organisation type is shown in Figure 60.
Figure 60 shows a total of $19.47 million in estimated state government funding of the S2M sector in 2015-16. This corresponds with ABS estimates presented in Figure 5, where state government funding for visual arts, craft and design for all organisations totalled $38 million. The higher ABS figure also includes visual arts, craft and design funding to larger organisations and state galleries.
Figure 58 — State government funding to respondents
2012 2013 2014 2015 2016(projected)
8.788.678.918.348.14
$ m
illio
ns
Figure 59 — State government funding of respondents by organisation type
2012 2013 2014 2015 2016
Metro GalleryRegional Gallery
C&DC
Service Org
CAO
3,000,000
0
2,500,000
2,000,000
1,000,000
500,000
1,500,000
ARI

Local government provides substantial financial support to many S2M organisations, particularly regional and metro galleries
Figure 61 shows that local government funding to survey respondents increased by 30% during this period. Not only was this a substantial increase in absolute terms, but as a portion of total funding to the S2M sector, local government funding has increased substantially. Local government funding to all respondents increased from 34% of respondent government funding to 39% during this period. (See Figure 51.)
The shift towards greater local government funding has been met with mixed feelings by respondents. Local government support is warmly welcomed and the opportunity to work with local communities and decision makers through local government is seen as a positive. However, the risks of being exposed to rapidly changing local politics and the whims of the council and councillors of the day were emphasised as a source of instability. Local government funding is considered closely tied to very local politics. One respondent explained that “significant changes to the Local Government environment can have unplanned and significant impacts” with another stating that they “are vulnerable to changes in policy within Council and lack resources to develop our public programs and collection to their potential”.
Public galleries in regional areas receive the most funding from local governments among respondents, followed by metro area galleries. Other types of organisations received far less, as shown in Figure 62.
Local government funding is critically important for regional public galleries, accounting for 66% of all funds on average in 2015-16. Across Australia we estimate local government support of S2Ms at $41.5 million in 2015-16. $30.3 million of this goes to regional galleries, $9.6 million to metro galleries and less than a million to each of the other organisation types.
While Figure 62 shows that C&DCs, ARIs and service organisations received less funding from local governments overall, for some individual organisations this funding can be significant, particularly for small scale ARIs. As shown in Figure 19, the average ARI received 11% of its total economic support and 36 percent of government funding from local governments.
Figure 61 — Local government funding to respondents 2012-2016
2012 2013 2014 2015 2016(projected)
9.659.448.42
7.527.43
$ m
illio
ns
Figure 62 — Local government funding of respondents by organisation type
2012 2013 2014 2015 2016
Metro Gallery
Regional Gallery
Service OrgCAO
7,000,000
0
6,000,000
5,000,000
3,000,000
2,000,000
4,000,000
ARI1,000,000
C&DC
6. REVENUE 71 || 72
Local Government Funding
Service Orgs
CAO
C&DC
Metro Gallery
Regional Gallery
ARI
$4.68
$3.95
$3.58
$3.51
$2.32
$1.42
Figure 60 — Estimated total state funding to S2M sector by organisation type 2015-16
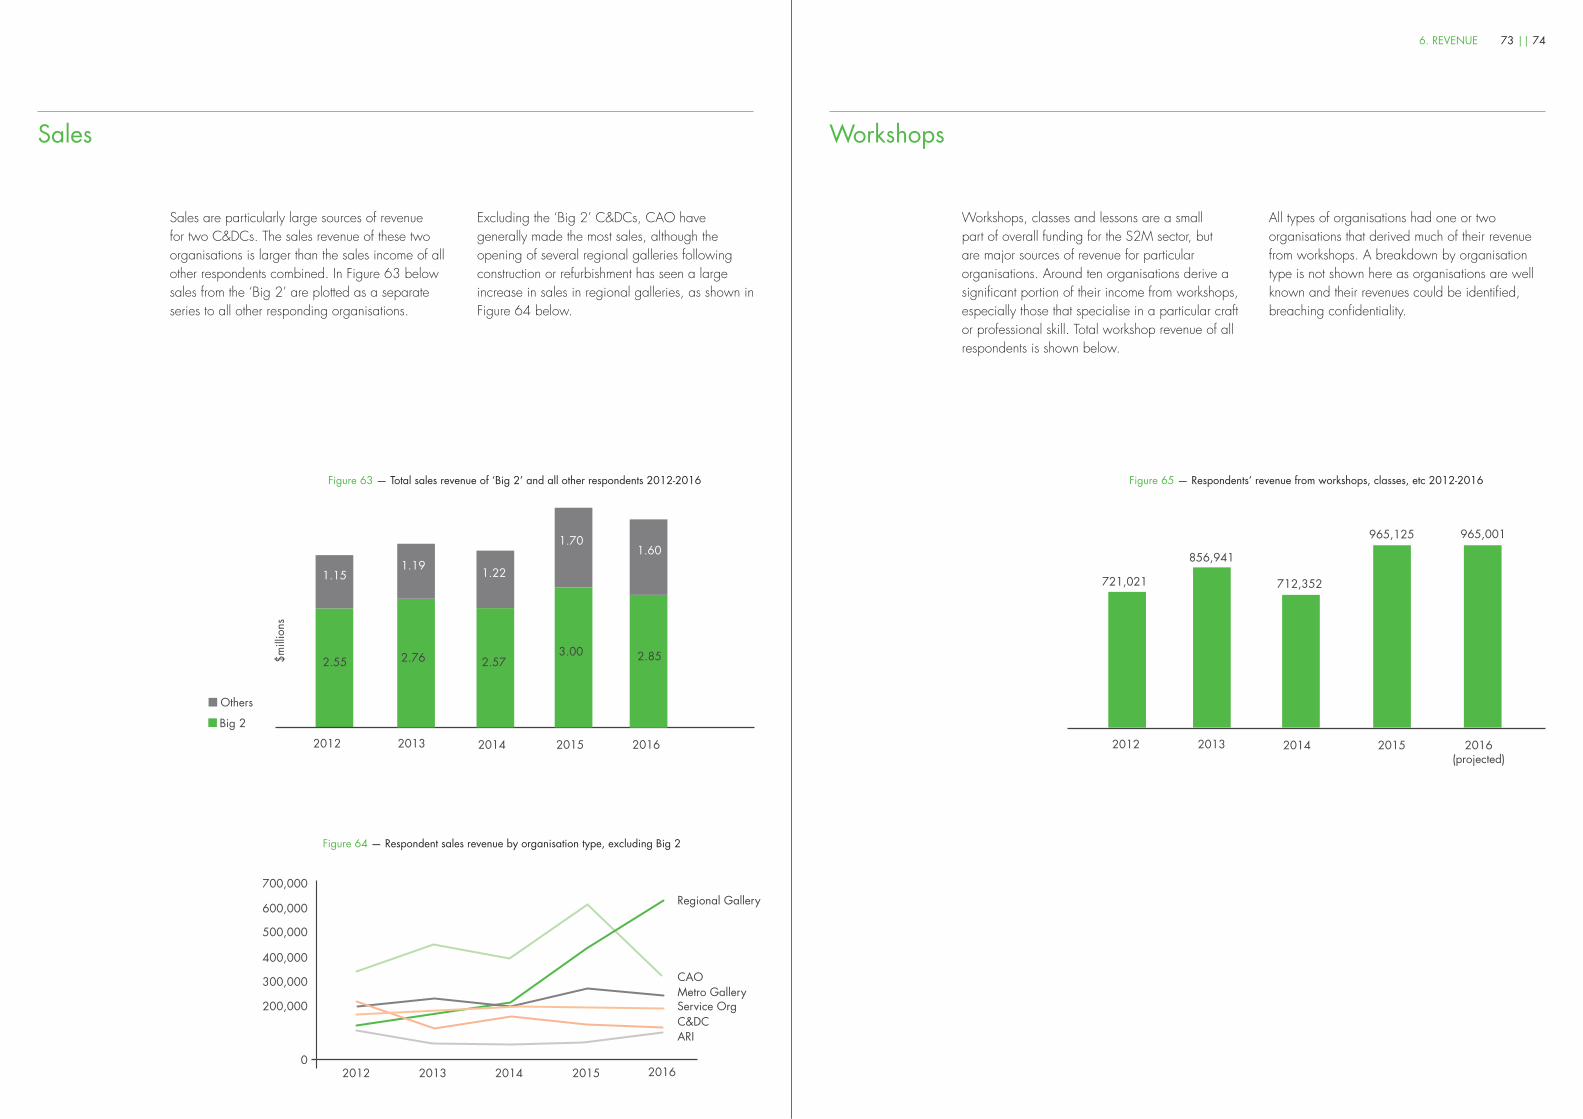
Sales are particularly large sources of revenue for two C&DCs. The sales revenue of these two organisations is larger than the sales income of all other respondents combined. In Figure 63 below sales from the ‘Big 2’ are plotted as a separate series to all other responding organisations.
Excluding the ‘Big 2’ C&DCs, CAO have generally made the most sales, although the opening of several regional galleries following construction or refurbishment has seen a large increase in sales in regional galleries, as shown in Figure 64 below.
2012 2013 2014 2015 2016
2.572.762.55 2.85
1.70
1.22
$mill
ions
3.00
1.151.19
1.60
Figure 63 — Total sales revenue of ‘Big 2’ and all other respondents 2012-2016
Figure 64 — Respondent sales revenue by organisation type, excluding Big 2
2012 2013 2014 2015 2016
Metro Gallery
Regional Gallery
C&DCService Org
CAO
700,000
0
600,000
500,000
300,000
400,000
ARI
200,000
Workshops, classes and lessons are a small part of overall funding for the S2M sector, but are major sources of revenue for particular organisations. Around ten organisations derive a significant portion of their income from workshops, especially those that specialise in a particular craft or professional skill. Total workshop revenue of all respondents is shown below.
All types of organisations had one or two organisations that derived much of their revenue from workshops. A breakdown by organisation type is not shown here as organisations are well known and their revenues could be identified, breaching confidentiality.
Figure 65 — Respondents’ revenue from workshops, classes, etc 2012-2016
2012 2013 2014 2015 2016(projected)
965,001965,125
712,352
856,941
721,021
6. REVENUE 73 || 74
Sales Workshops
Big 2
Others

Sponsorship from corporations and businesses varies from small, regular contributions from local businesses to large, one-off corporate donations often related to construction or major acquisitions. Because of this, total revenue to respondents from sponsorship varies greatly between years, as shown in Figure 66.
Galleries in metro areas report larger numbers of smaller, more regular sponsorship revenue because of their proximity to the business community, high visitor numbers and well-known positions in major cities.
ARIs receive very little corporate funding and view this as a major challenge, feeling that while some businesses are willing to support them, they can offer little in return due to their scale and often short organisational lives. A respondent from a smaller organisation explained that it was “too hard to compete against large organisations who can offer bang for buck and who have more than one full time employee dedicated to relationship building with donors.” Regional galleries and service organisations received occasional large sponsorships, as shown in Figure 67.
Figure 66 — Respondents’ total sponsorship revenue 2012-2016
2012 2013 2014 2015 2016(projected)
1,626,366
2,056,840
1,372,4721,300,817
1,977,654
2013 2014 2015 2016
Metro Gallery
Regional Gallery
C&DC
Service Org
CAO
1,000,000
0
900,000800,000
600,000
400,000
700,000
ARI
500,000
300,000
100,000
200,000
2012
Figure 67 — Sponsorship revenue by organisation type
Around half of respondents reported receiving some philanthropic funding and donations through 2012-2016, 35 organisations out of 79 respondents. One respondent explained: “as federal and state funding becomes scarcer, alternative sources of revenue, such as private philanthropy, are becoming increasingly competitive and harder to access.”
On two occasions respondents reported major philanthropic donations relating to capital expenditure on new buildings. This is plotted separately to other funding in Figure 68.
Excluding capital expenditure, most philanthropic funding goes to C&DCs, CAO and service organisations, as shown in Figure 69.
Other
1.431.511.37Capex
1.74
1.051.70
$mill
ions
1.59
Figure 68 — Respondents’ total philanthropic funding 2012-2016
Figure 69 — Philanthropic funding to respondents by organisation type
Metro GalleryRegional Gallery
C&DC
Service OrgCAO
0
600,000
400,000
700,000
ARI
500,000
300,000
100,000
200,000
6. REVENUE 75 || 76
Sponsorship Philanthropy
2012 2013 2014 2015 2016
2013 2014 2015 20162012

The survey included an option for ‘other’ funding sources. Totals from these sources to respondents are shown in Figure 70 below.
‘Other funding’ is very significant for particular organisations, and can represent payments from departments for service delivery (such as working with people with disabilities), fees for membership, studio space rental and side businesses (such as cafes attached to galleries).
Figure 70 — Respondents’ other funding revenue 2012-2016
2012 2013 2014 2015 2016(projected)
2.362.382.11
2.272.09
$ m
illio
ns
Figure 71 — Other funding revenue by organisation type
2013 2014 2015 2016
Metro Gallery
Regional Gallery
C&DC
Service Org
CAO
0
600,000
400,000
700,000
ARI
500,000
300,000
100,000
200,000
2012
800,000
900,000
56%
9%7%6%
23%
53%
4%7%5%
30%
51%
4%
20%
9%
16%
41%
12%
21%
13%
27%
38%
10%
12%
16%
25%
27%
30%
11%
13%
21%
Regional Gallery
Service Org C&DC CAO ARIMetro Gallery
7. SPENDING
Respondents were asked to estimate their organisation’s proportional spending on wages, rent, commissions, equipment and other spending. Responses are divided into averages for each type of organisation in Figure 72 below.
Figure 72 shows that all organisations spend a significant amount of their total expenses on wages. For most organisations wages are their single biggest expense item, particularly C&DCs, service organisations and regional galleries. Despite wages being a large portion of S2M, staff in the S2M sector are not highly paid. While the survey does not break down wage expense by full time, part time and casual employees, broad estimates can be made of full time employees’ income.
Multiplying each organisation type’s percentage spending on wages by their income gives a total S2M sector total of $49.9 million on wages in 2015-16. The portion of this paid to full time workers is unknown, but is likely to be between 50% and 75%. In Table 26 total staff numbers and total wage estimates are presented. If we assume different percentages of the total S2M wage expense are paid to full time workers, we can estimate the average annual wage paid to full time workers.Table 26 shows the full time wage estimates for S2M workers assuming that 100%, 75%, 50% and 25% of total wages are paid to full time workers. Even if 100% of wages were paid to the sectors approximately
583 full time staff, their average wage would be $85,725. This is only slightly above the average full time Australian annual wage of $81,921 (See ABS (2016) 6302.0 - Average Weekly Earnings, Australia, May 2016. Note that both ABS and survey estimates are pre-tax and other deductions are considered). Clearly not 100% of wage expenditure is paid to full time workers. More realistically, if between 50% and 75% of total sector wages are paid to full time workers, average wages are between $43,000 and $64,000 per year, between 52% and 78% of average Australian full time earnings. This range sits at the bottom end of wage levels recommended in the Code of Practice for the Professional Australian Visual Arts, Craft and Design Sector, published by NAVA, which sets national best practice standards for the arts sector.
The low wages and difficulty in keeping full time staff emphasises the point made by many respondents that securing funding for core management and other essential administration roles is one of their most pressing concerns – one of their biggest expenditures – and their most important organisational roles are some of the most difficult to attract funding for. One respondent summarised the “primary challenge facing the S2M arts community is the increasingly competitive and restrictive environment for multi-year operational funding for the small to medium sector, which is critical for operational sustainability.”
Figure 72 — Spending by type of organisation
77 || 78
Other Funding
Other
Commissions
Equipment/IT
WagesRent

Another respondent that successfully secured core funding for the next 4 years explained that their “main challenge will be ensuring that we can maintain that level of funding after the initial 4 year period,” highlighting that even when core funding is secured, organisations are well aware that this may cease in a few years’ time, serving as a continuous distraction.
Another respondent said that as funders’ demands for community engagement conditions had increased markedly, they had applied for funding to employ a community engagement officer repeatedly but without success. Some of the wages expenditure is also directed to the increasing numbers of casual staff that S2M organisations employ to operate their increased load of events and exhibitions.
Respondents spent relatively little on commissions, with CAO galleries spending proportionally the most on this, 21%. This reflects several factors. Often artists have their own direct funding sources and work in partnership with the S2M sector to display their work rather than galleries specifically commissioning a particular artist. The full time staff of some organisations are also developing art works themselves which goes on display and is not counted here as a commission. This is particularly the case for C&DCs and ARIs. One respondent outlined an objective to “increase art sales in order to make commissions a reliable income source.” Many service organisations produce very little art themselves, focussing on providing services to other organisations and other types of services to artists.
Rent accounts for a small portion of the expenditure of most S2M organisations. Many receive free or subsidised rent, without which they would not be able to function. Often their premises are owned by local governments. The provision of cheap or free premises to S2M organisations by local governments means that the already high and increasing level of support provided by local governments is heavily understated. Funding estimates above do not include the value of this rent foregone by local governments. If an economic value of this support was included local government levels of support would increase significantly.
The exception on rent expenditure is ARIs, which spend 30% of their income on their premises. This reflects the reality that many ARIs have very small budgets and even discounted rent represents a significant proportion of their expenditure. A handful of ARIs are venues run by commercially oriented artists that pay standard commercial rent. These respondents spent 70-80% of their income on rent.
Metro galleries, CAO and ARIs also spent the highest proportion of income on equipment and IT, reflecting the high levels of art production in many of these organisations. Despite the increasing use of IT and social media reported by most organisations, few respondents mentioned IT as an area that they had difficulty resourcing. One responding organisation suggested that skills with IT, design and social media “came with the territory” in the modern S2M sector.
Table 26 — Estimates of S2M full time worker wages
S2M sector total
Full time staff 583
Part time staff 599
Casual staff 848
Total wages paid $49,944,317
Annual full time wage, 100% FT $85,725
Annual full time wage, 75% FT $64,294
Annual full time wage, 50% FT $42,863
Annual full time wage, 25% FT $21,431
8. CASE STUDIES 79 || 80
Karen Millar in her Artsource O’Connor Studio, 2017. Photo by Christophe Canato. Image courtesy of Artsource.

Fontanelle is an artist-run initiative, gallery and artspace that is now located in Port Adelaide. Fontanelle began in 2012, in Bowden, Adelaide, with facilities that included studio space for 26 artists and two show spaces that host 20 to 30 shows per year.
Fontanelle’s initial location in a former industrial area in Adelaide’s inner north has been central to its development and operations. The Bowden area is being redeveloped by Renewal SA, the state government’s urban renewal agency, turning it into a largely residential suburb. Fontanelle has been provided with subsidised premises as part of the social marketing or ‘place making’ for the new suburb.
Fontanelle is unique in that it does not receive or apply for operational funding. Partly this is due to an understanding that such funding is very finite - “if we got funded, someone else would get defunded.” Furthermore, Director Brigid Noone emphasises that to secure and maintain operational funding “would cost a lot in time and independence…and we probably wouldn’t get that much anyway.”
Maintaining artistic independence is difficult for many organisations that need to meet funders’ expectations, particularly from state government departments. Funding conditions and regulations requirements have made some ARIs look like “outsourced public servants” according to Brigid.
Staying truly artist run and independent has been important for everyone involved in Fontanelle. Securing the space and subsidised rent has enabled this independence, along with some income from studio space rental and sponsorship and most importantly the passion of its directors, Brigid and Ben Leslie. Largely unpaid, they receive in-kind use of facilities. They form the core of the 15 volunteers who run the gallery in addition to the 26 artists who use the studios.
Change has arrived for the Fontanelle team. While the Bowden location will continue running as a sister gallery, the organisation is in the process of opening a new location in the Port Adelaide area. Directors Brigid Noone and Ben Leslie work with Mary-Jean Richardson to form the main management committee which will continue to manage the 26 studios at Bowden while handing over the Bowden gallery space to Ash Dantonio and Mia Van den Bos who will run the new gallery ‘Sister’ as a Fontanelle project under the mentorship of Brigid and Ben.
As before, the organisation aims to bring artists, energy and activity to an area “ripe for a boost in contemporary arts activity.” Again they will received space at peppercorn rent, from Port Adelaide Enfield City Council, and have secured $30,000 to fit the space out through the state government’s Fund My Idea initiative, which sees funding allocated through a local community voting process.
Again, they have not sought operational funding, partly to maintain independence, but Brigid also reflects that “now that we’ve shown that we don’t need that funding, perhaps we’ve trapped ourselves outside the [government operational] funding world.” A key challenge is “how to grow financially without changing what we do and how we run our organisation; how to grow and increase income while maintaining an autonomous, authentic, artist run model?”
Possible answers to these questions include renting some of their space to Tutti, an organisation that supports artists with a disability, as well as a café/bar. These rental agreements are on Fontanelle’s own terms, however, and if they begin to feel compromised by hosting a café/bar and another organisation they can discontinue the sub-lease. The only key requirement under their arrangement for access to premises is to host a minimum of 8 community events per year.
ARI: Fontanelle — South Australia
Fontanelle demonstrates that the energy, colour and community engagement that S2M arts organisations can bring to a neighbourhood is something valuable to governments and the private sector. Such arrangements are a potential opportunity for S2Ms in many locations, but Brigid emphasises that the organisation’s brand, background and the personal reputations of key people are all very important.
Maintaining relationships without being pushed around has also been vital. Fontanelle is often leant on to participate in events related to local property development, with approaches such as “can some artists come and do a mural at our event?” Such proposals are welcome, but the assumption is that Fontanelle’s artists will participate for free. Balancing the interests of the organisation and the relationship with Renew SA and commercial property developers is an ongoing challenge and one other organisations going down this path should note. Fontanelle is optimistic about developing its new partnership with the Port Adelaide Enfield City Council.
Photo by Daniel Noone. Image courtesy of Fontanelle.
8. CASE STUDIES 81 || 82

Artspace is an independent art space dedicated to the production and presentation of contemporary art, and is located in Woolloomooloo, Sydney. They are a member of the Contemporary Arts Organisations (CAO), a network of fourteen contemporary arts organisations that represent each state and territory in Australia. While Artspace’s core activities are exhibitions, commissioning new work, studio residencies, public programs and publishing they see their role as ‘so much more’, according to Deputy Director, Michelle Newton. They aim to be strong advocates for the arts sector, with a mission to support artists across all generations and to place them in dialogue with the Australian public as well as their international peers, colleagues and new audiences.
Artspace presents over 25 exhibitions per year in Australia and internationally, and host an annual studio program which is ‘free’ for artists that supports risk and experimentation. They also host an International Visiting Curators Program and invite up to five international curators who are introduced to a range of artists, curators, academics, writers, galleries and museums across Australia.
Artspace receives multi-year funding from the Australia Council for the Arts and Arts NSW to support operations and programming with increasingly different priorities and reporting requirements across both agencies. For example, Arts NSW and the NSW state government are committed to outreach in Western Sydney and to regional NSW. The prioritising of these areas has meant that arts organisations are being asked to engage with these communities, which is welcome, but this requires skills and resources related to youth, education and community engagement programs as well as partnerships with local services. Newton explains that while arts organisations are supportive of such goals, they may not necessarily have the human and/or financial resources required to achieve as much impact as they might like in this area.
Newton goes on to explain that these activities are a high priority for funding agencies, and need to be balanced with support for artists, and the delivery of artistic programs. The organization is arguably operating at a ‘critical capacity’ with seven employees, who each routinely work ‘around the clock, from home, or wherever’ to deliver the organisation’s objectives. Increased funding for operations and programming is critical to the capacity of Artspace, and the small to medium sector as a whole.
Artspace is the main tenant of Woolloomooloo’s historic Gunnery building, which is owned by the NSW government. Annual rental increases add additional pressure to their operating budget and by 2018 Artspace’s rental expense will represent up to 20 per cent of the funding revenue it receives from their funder and landlord, Arts NSW.
CAO: Artspace — New South Wales
Each financial stakeholder has their own expectations and managing these expectations creates additional administration for arts organisations. These changes in conditions and priorities have increased pressure on organisations like Artspace, with their stretched administrative resources, to cross-check and re-purpose data to meet reporting requirements. Newton agrees that transparency and accountability are key responsibilities in terms of public funding, however it is important that arts organisations such as Artspace continue to develop their own priorities to ensure the long-term sustainability of the organisation.
The high-level advocacy and support for artists, such as Artspace’s studio program is difficult to quantify as a figure in their annual financial statements. The space provided for artists to test new ideas and experiment with their practice cannot simply be represented as an expense to the organization in the same way as an artist’s fee or an employee’s salary. Artspace fundraises over $150,000 per annum to ensure the studio program remains free for artists. Therefore, this ‘intangible’ support can be difficult to quantify in terms of the financial KPIs required and scrutinized by some funders. Similar sentiments have been expressed by other small to medium visual arts organisations.
8. CASE STUDIES 83 || 84
Photo by Zan Wimberley. Image courtesy of Artspace.

Design Tasmania hosts exhibitions of Australian and national designers and acts as a hub for design in the state. A member of the Australian Craft and Design Centre (ACDC) network, the organisation runs professional development activities for designers such as group retreats, portfolio development and competitions. In 2016 they are celebrating their 40th anniversary with 40 designers contributing to two exhibitions to mark the milestone.
Design Tasmania is based in Launceston in an architecturally significant building. The original building was a church hall, later used as a theatre, which had major modifications and additions at the turn of the century. While the building is a highlight for many visitors, the management arrangements of the building underscore some of the challenges that Design Tasmania faces.
As with many S2M visual arts organisations, Design Tasmania’s premises are provided by the local council for a peppercorn annual rent. Design Tasmania is not a council body, however, it is an independent not-for-profit organisation that raised the money for the renovated premises, built on council land and gifted the building to the council in return for its ongoing use. Design Tasmania remains responsible for rates, insurance and all building maintenance and expenses which, as the building ages, are becoming more significant. Such costs which are “ultimately taking money away from programming”, according to new CEO Karina Clarke.
While an independent organisation, Clarke emphasises the importance of the relationship with council. She hopes to strengthen this relationship by helping the local government understand the contribution that Design Tasmania makes to the community. Design Tasmania is “positioned to service the community in terms of culture and education and ensuring people can see and buy designers’ work. We want council to be proud of this and of its role in it.”
As a member of the ACDC network and a recognised craft and design centre, Design Tasmania works with designers from around the state and the country. One recent retreat organised with the National Gallery of Victoria focused on nationally recognised, mid-career artists and Design Tasmania has close links with designers on the mainland through other network members such as the Australian Design Centre and South Australia’s JamFactory. Like many organisations in Tasmania, most visitors are tourists from overseas or the mainland, with a 70:30 split between tourists and local visitors. Although located outside of Australia’s main cities, Design Tasmania plays a state-wide and national role.
Reflecting this, most Design Tasmania funding comes from Arts Tasmania, a body that Clarke finds “accessible and supportive, that listens and answers questions and you can really collaborate with.” An example is their collaboration on Arts Tasmania’s Aboriginal Arts Program.
Design Tasmania does receive funding from the Australia Council and has been successful in applying for funding for a further four years. However, with Design Tasmania’s ambitious program always pushing budget boundaries, many challenges lie ahead. Further funding needs to come from a range of sources to assist in completing their program.
C&DC: Design Tasmania — Tasmania
Design Tasmania aims to put on exhibitions of a national standard, equal with anything in Sydney or Melbourne. This is increasingly difficult, however, as they have only one full time staff member and one three-quarter time staff member. Design Tasmania would ideally like to employ a full-time program coordinator and an education officer to engage with the community and get the most out of their location and exhibitions, but funding makes this impossible at present.
Tasmania’s cultural identity has developed substantially in recent years. While major galleries such as Hobart’s MONA have helped put the state’s art on the map, Clarke believes that the cultural life of the state has always been there, but is now being better promoted. Design Tasmania is also a part of this growth, with Clarke noting that they have very high rates of return visits from mainland and international tourists. Clearly Design Tasmania impresses its visitors, but faces unique challenges as a state and nationally focused organisation in a regional city.
8. CASE STUDIES 85 || 86
Photo by Joffre Productions. Image courtesy of Design Tasmania.

Monash Gallery of Art (MGA) is a prominent suburban gallery in Melbourne’s southeast. Established in 1990 it is the only institution in Australia to have a collection entirely devoted to Australian photography. Located in a small reserve on the site of a historic homestead, MGA is a popular destination for the local community and visitors interested in Australian photography. The facility, including a café and local library, attracts local, interstate and international visitors with attendance driven by its Australian and international photography exhibitions.
MGA is largely funded by local government, the City of Monash, with an operating budget of around $900,000 including $40,000 for acquisitions. The gallery is responsible for raising a significant portion of their operating budget through their own fundraising activities. Their four full-time, three part-time and three casual staff equate to 7.3 full time equivalent positions.
Despite having a strong reputation within Australian photography and hosting exhibitions of internationally significant photographers, like most council-funded S2Ms, relations with the council, individual councillors and the CEO of the council’s operations are all important.
This was demonstrated most starkly 12 years ago when council conducted a midnight meeting and voted to close the gallery. Only community backlash and protest saved MGA’s existence, by forcing a special general meeting of council and reversing the decision. Local government politics are a “constant issue”, according to Education & Public Programs Coordinator, Stephanie Richter.
In the fallout from the attempted closure changes were made to MGA’s governance and funding. A Committee of Management was formed, including two councillors and eight to ten other volunteers. The Committee’s role is mainly oversight but also includes some responsibility for fundraising. The Committee and the MGA are supposed to raise half of its funds independently of council, as part of the deal struck to keep MGA open.
Unfortunately, as a suburban gallery opportunities for corporate sponsorship are limited, competition for philanthropy is fierce and state governments often see galleries as a local government responsibility. The MGA Committees of Management have often not met this goal and responsibility for it lies with the Committee of Management and the Gallery Director.
Richter observes that gallery directors are now more likely to need fundraising and corporate management experience than in previous years. Recent sponsorship success with a local car dealer, a wine company and a bank has been welcome following a long period of minimal corporate assistance. An operational grant from Creative Victoria has also been secured. Galleries such as MGA have a complex framework of supporters and funding agreements that require gallery directors to have a changing skill-set and flexibility within their role, as fundraising increases in importance.
In addition to the Committee of Management, MGA also has a Foundation which raises funds for their annual Bowness Photography Prize. The $25,000 prize is one of the country’s most prestigious photography prizes, judged this year by filmmaker Fred Schepisi and one of Australia’s most respected commercial photographers, John Gollings. There is also a Friends of MGA group that raises $8,000-10,000 through events each year.
Metro Gallery: Monash Gallery of Art — Victoria
8. CASE STUDIES 87 || 88
Reconciling the national role and international focus of MGA with the local needs of council can be difficult. Despite having a prominent place in Australia’s photography landscape and attracting support from such eminent Australians, local government politics can influence the management of MGA. The gallery is often seen by some as a “luxury item”, described as a “nice to have” rather than a core community concern.
The Committee of Management, a MGA strategic plan and an ability to muster community support does give the MGA more autonomy. Further diversifying their funding is seen as important for keeping local politics at arm’s length, and to enable the gallery to focus on connecting the Monash community with the best of Australian and international photography.
Photo by Brendan Finn. Image courtesy of Monash Gallery of Art.

The Gold Coast is better known for beaches and theme parks than for arts, presenting challenges and opportunities for the Gold Coast City Gallery. Part of the Gold Coast Arts Centre, which includes a theatre, cinema and function facilities, the Gallery is part of a concerted effort by the Gold Coast City Council (GCCC) to change this perception and promote a more balanced view of the region. “Everyone says there’s no culture here,” says Sarah Lewis, Public Programs Coordinator at the Gallery, “but this isn’t the case. There are lots of independent arts organisations here, particularly in the last few years. The thing is that the GoldCoast has a lot of little villages spread out through the city, without a central concentration or hub for them.”
This is set to change in 2017-18 as the Gallery and Arts Centre move to a new cultural precinct site, bringing to fruition a long-held plan to develop a purpose-built gallery site. These changes have also been driven by new board members, new staff and a new Director who began her career at the gallery.
Unlike most regional galleries, the Arts Centre and Gallery are set up as a company with GCCC as the major shareholder. While the council funds the company and offers support in other ways, the gallery is not considered part of the facilities and institutions managed by council, giving the gallery considerable independence.
Historically visitation to the gallery has been consistent, between 40 and 50,000 visits per year. Lewis puts this down to their tendency to attract repeat visits from local people and visitors who are also going to cinema or theatre at the Arts Centre. However, this is changing with more capacity to do specific exhibitions such as the current show on the history of ABC’s Play School, which has tripled normal attendance.
Competition is stiff for such discretionary visits. Not only do they compete against the Gold Coast’s beaches and other attractions, but also with Brisbane’s art venues such as the Gallery of Modern Art (GOMA). The Tweed Regional Gallery and Margaret Olley Art Centre are also nearby and offer high-quality exhibitions and shows. All these galleries have close professional relationships and work collaboratively on touring exhibitions, partnerships and supporting each other’s exhibitions.
Although expanding its capacity to host larger exhibitions, the Gold Coast City Gallery maintains a strong interest in showing the world of Gold Coast artists both current and historic. It has a strong focus on mid twentieth century art from artists that relate to the Gold Coast such as Elizabeth Cummings and William Robinson. The Gallery is also proud of its role in the careers of current artists such as:
• Victoria Reichelt – painter and photographer has been involved in their public programs and the gallery has purchased her work.
• Michael Candy – visual artist whose first exhibition was at Gold Coast City Gallery has participated in the Gallery’s programs and prises for young artists.
• Abbey McCulloch – painter who had early exhibitions at the Gallery and has gone on to exhibit internationally be a finalist in the Archibald Prize.
The Gallery’s prizes are acquisitional and for many of their winners this has been their earliest inclusion in a public art collection. Such acquisitions are an important part of young artists’ efforts to build their reputations and profiles.
While the Gold Coast’s beaches will likely remain the main drawcard, the visual arts community also looks set to consolidate in the region. With new premises and strong support from local government and other arts organisations, 2017 should be an exciting year for art in the Gold Coast.
Regional Gallery: Gold Coast City Gallery — Queensland
Artsource is the membership body for visual artists in Western Australia and a not-for-profit service organisation, core funded by the Department of Culture and the Arts WA (DCA). The purpose of the organisation is “to engage with and support Western Australian visual artists with practical, affordable and relevant services that support professional practice.” The head office is in Fremantle, in the Old Customs House building, which also houses studios for 24 artists. Artsource started life as the Fremantle Artists Foundation in 1986, and expanded to become the Artists Foundation of Western Australia, later Artsource. A key strategy of the organisation is “to contribute to market and audience development to foster an environment where art is valued and artists flourish.”
Artsource provides a diverse range of services to its 900 members and associates. Membership of Artsource starts at $100 for artists and supporters, $200 for professional artists with $300 for MAX membership which includes insurance cover. Associates of Artsource, who might be affiliates or clients, can subscribe annually for $180. Services to artists include industry information and advice, opportunities for promotion (of work, news, exhibitions and events), studios and residencies, professional development and opportunities to network and present work and ideas.
Altogether, Artsource offers 83 studios in 6 buildings across Perth with 99% occupancy and a strategy to increase the number of studios over time. Employment opportunities are facilitated through public art consultancy and project management. Arts management consulting and advocacy on behalf of visual artists are key roles. Core funded by the DCA to deliver services to visual artists, Artsource also generates income through public art consulting, studio rental and membership fees. Patronage and grants have been strong sources of income for Artsource over the years, but fundraising in the private sector has been tough in the last two years.
A significant issue for visual artists in Western Australia has been the loss of representation and affordable exhibition space in Perth, with the contraction of the local art market and the closure of a number of commercial galleries. The global financial crisis, a downturn in mining fortunes and changes to art collecting by self-funded superannuation schemes have all contributed to the contraction. Some artists have adapted, and are working collectively and individually to reach wider markets; including ‘over East’ and in other countries. But the fact remains that more Western Australian artists face turning their talents to other forms of employment, or leaving town.
With this tough market backdrop, static government investment in the visual arts has been a source of increasing frustration for WA artists as well as small to medium arts agencies, including Artsource. The long standing under-investment in the arts in WA by the federal government, has been exacerbated in recent times by changes that have reduced funding to the small to medium agencies, further damaging the local arts economy.
According to Kate Roberts, Head of Membership Services at Artsource, “Western Australia has an arts ecology that will richly reward investment and nurturing. Artsource supports the call from the Chamber of Arts and Culture WA for the state government to immediately inject $100 million into the arts and culture portfolio to prevent a serious decline in activity and employment.”
Further information on the S2M sector in WA can be found in Strickland (2014) A Report on Desktop Research Undertaken into Western Australia’s Small-to-Medium Arts Sector (S2), Chamber of Arts and Culture WA.
Service Organisation: Artsource — Western Australia
8. CASE STUDIES 89 || 90

9. COMPARISON WITH MAJOR GALLERIES
To put the outputs and funding of the S2M visual arts sector in a wider institutional context, some results from previous sections are compared with information reported by the following major galleries:
• Museum and Art Gallery of the Northern Territory
• Art Gallery of NSW• Art Gallery of South Australia• Art Gallery of Western Australia• National Gallery of Australia• National Gallery of Victoria• Queensland Art Gallery and Gallery of Modern Art (QAGOMA)
• National Portrait Gallery• Museum of Contemporary Art Australia• Australian Centre for Contemporary Art
These institutions play a different role in the Australian arts ecology to most S2M organisations, a role more focused on showcasing established Australian, international and historical artists as well as collecting, conserving and documenting their work. Exhibited works may be part of curated visiting exhibitions or drawn from their own collections or a combination of the two. By contrast S2Ms generate, develop and promote new art by living, Australian artists. The comparison below serves to illustrate these different roles, but also to emphasise the resource constraints faced by the large number of small organisations that support the production of Australia’s new art.
Table 27 shows that major galleries do not play a major part in creating new works, although they do acquire thousands of new works each year, many of which come through the S2M sector. The S2M visual art sector facilitates the production of four times as many new works as the major galleries commission and/or acquire.
Table 27 — Comparison of S2M and major galleries 2016
S2M sector total 10 major galleries
Art works 25,858 new works 126 new works 5,799 acquisitions
Visits 6,243,842 8,376,634
Full time staff 583 1,160
Total staff 2,030 1,488
Volunteers 7,772 992
All government revenue 73,377,279 196,368,072
All other revenue 30,041,292 172,012,280
Total revenue and funding 103,418,571 368,380,352
Sources: Major gallery annual reports
91 || 92
Major galleries attract large crowds, over 8 million visits in 2016 with their headline grabbing art exhibitions, famous buildings and prime locations. Despite lacking these advantages, the S2M sector attracted over 6 million visits in 2016 showing that Australians are very supportive of new and emerging artists.
Staffing levels show a major difference between the two sectors. S2M organisations get by on a skeleton of full time staff, a common challenge discussed in the preceding sections. The vast majority of paid staff in S2M organisations are casual or part time. Casual staff numbers are often driven by events outside of normal working hours as well as budget constraints. Major galleries by contrast have mainly full time staff, although some annual reports report only full time equivalent staff numbers, possibly exaggerating this number. Major galleries employ relatively few casual staff as they are able to offer regular work with fixed opening hours.
As discussed in preceding sections, volunteers are a huge asset to the S2M sector, with almost 8,000 volunteers estimated across the 254 key S2M organisations. As may be expected from a sector with considerable full time staff, the major galleries have far fewer volunteers, with the ten organisations reporting 992 volunteers between them.
The real difference between the two sectors, however, is funding. The major galleries receive more than 2.5 times more revenue from government than S2Ms and almost six times more from other sources. In total, the $103 million in revenue to the S2M sector in 2016 represents little more than a quarter of the $368 million allocated to the 10 major galleries.
This is not to suggest that the major galleries are generously funded. As discussed in the background section, federal arts funding in Australia has been declining in real, per capita terms and these organisations have not been spared. They play an important role in our culture and the arts ecosystem and incur major expense in running large, public operations and acquiring the work of the country’s and the world’s best artists. The comparison is made to highlight the output, efficiency and constraints placed on the sector responsible for nurturing our best artists, the S2M sector.

10. CONCLUSION
Australia’s recent record period of economic growth continues, yet our funding of art has not kept up with inflation and population growth. This means that an Australian child had a greater chance of a career in the arts last century than they do at present. This situation is likely to worsen considerably as funding cuts to the Australia Council are implemented. Overall levels of funding to the arts must at the very least be maintained in real per capita terms if we are to go towards achieving our cultural potential.
Furthermore, funding to the arts must be commensurate with the increased demands placed on arts organisations. Most respondents to our survey reported increased pressures requiring them to increase numbers of events, community outreach activities, exhibitions, etc. The nature of art is different from economic activities such as manufacturing homogenous products; productivity gains are unlikely to be as simply achieved or measured in the arts. While arts organisations should work to be efficient, funding needs to recognise the increased demands placed on different parts of the arts ecosystem.
A key conclusion of this research is that different parts of the arts ecosystem are financed in different ways. Simply allocating money to a new government program, such as Catalyst, is not an effective means of funding the arts, even if this money was not reallocated from another body such as the Australia Council. Governments need to understand which parts of the arts ecosystem they are funding and why, what challenges those organisations are facing and what the implications of those challenges are for other parts of the ecosystem.
93 || 94
Some key points for different levels of government:
• Federal government levels of funding should be increased to reverse the decline of recent years. This funding needs to be arm’s length from governments, directed through independent bodies, ideally the Australia Council, which has shown itself to be an efficient means of distribution over many years. If other bodies are to be involved in distributing federal funds, they need to play a complimentary role. Federal government funding is particularly important for CAO, C&DCs and service organisations, all of which are vital for assisting artists to transition from being supported by community organisations to reach national and international prominence. They also need to develop and implement policies which ensure that artists and other arts professionals can have sustainable careers within an industrially fair environment.
• State government agencies need to recognise that S2M arts organisations are primarily about supporting contemporary art by living artists. While artists and the S2M community welcome any opportunity to engage with diverse audiences and to play a role in better connecting communities, many requirements attached to state government funding call for skills in different areas such as community development, education and working with people with disabilities. The S2M sector can play a role in addressing policy challenges in these areas, but this needs to be properly recognised and additionally resourced.
• Local governments should be proud that they are in many ways the driving force behind the development of Australia’s visual artists and the S2M visual arts sector. The contribution of local governments should be better recognised along with the increasing share of funding that local governments are providing. Local governments need to be cautious that the S2M organisations they support are given a degree of autonomy, independence and continuity that enables the organisation to develop over a longer term than one or two council election periods. Establishing governance structures that provide some autonomy from local politics is an important principle.
In conclusion, while economics has difficulty dealing with art, art has a good deal more difficulty dealing with economics. We hope that the quantitative and qualitative data provided in this report will assist both areas in developing policy to maximise the potential of Australia’s visual arts and artists.

11. REFERENCES
ABS. 2014. 4183.0 - Cultural Funding by Government, Australia, 2012-13. Accessed at http://www.abs.gov.au/AUSSTATS/[email protected]/DetailsPage/4183.02012-13?OpenDocument
ACMI. 2016. Annual Reports 2011-12 to 2015-16. Australian Centre for the Moving Image. Accessed at https://www.acmi.net.au/about-us/corporate-information/
Arts Centre Melbourne. 2016. Annual Reports, 2011-12 to 2015-16. Accessed at https://www.artscentremelbourne.com.au/about-us/what-drives-us/our-key-documents
Arts NSW. 2014. Year in Review, 2012-23. Accessed at http://www.arts.nsw.gov.au/wp-content/uploads/2013/12/Arts-NSW-2012-13-Year-in-Review-formatted.pdf
Arts Queensland. 2016. Arts Queensland Funding. Accessed at http://artsengage.initiatives.qld.gov.au/aq-funding?lnk=QS02LTQ4MTAtMTI
Australia Council for the Arts. 2016. Australian Business Arts Foundation (ABAF) Survey of Private Sector Support. Accessed at http://artfacts.australiacouncil.gov.au/overview/support-15/ov-fact86/
Australia Council. 2015. Arts Nation: And overview of Australian Arts, 2015 Edition. Accessed at http://www.australiacouncil.gov.au/workspace/uploads/files/arts-nation-final-27-feb-54f5f492882da.pdf and Technical Appendix at http://www.australiacouncil.gov.au/workspace/uploads/files/research/arts-nation-technical-appendix-56382834062ea.pdf
Australia Council. 2016. Annual Reports from 2010 to 2016. Accessed at http://www.australiacouncil.gov.au/about/annual-report-2014-15/
Australian Sports Commission. 2015. Annual Report 2014-15. Accessed at http://www.ausport.gov.au/__data/assets/pdf_file/0006/611358/CORP_33957_Annual_Report_2014-15_final.pdf
Australian Business Arts Foundation. 2011. Private sector arts support. Accessed at http://artfacts.australiacouncil.gov.au/overview/support-15/ov-fact86/
Barone, A. 2016. A New Economic Theory of Public Support for the Arts: Evolution, Veblen and the predatory arts. Routledge. New York.
Baumol, W.J. and Bowen, W.G., 1965. On the performing arts: the anatomy of their economic problems. The American Economic Review, 55(1/2), pp.495-502.
Blaug, M., 2001. Where are we now on cultural economics. Journal of economic surveys, 15(2), pp.123-143.
Boyle, S. and Throsby, D., 2012. Corporatisation, economic efficiency and the Australian symphony orchestras. Economic Papers: A journal of applied economics and policy, 31(1), pp.36-49.
Canada Council, 2016. New Investments: The future of Canada’s arts sector. Accessed 9 December 2016 at http://canadacouncil.ca/spotlight/2016/11/new-investments-the-future-of-canada-s-arts-sector
Creative Australia. 2016. Review of private sector support for the arts in Australia: Australian government response. Accessed on 30 September 2016 at http://creativeaustralia.arts.gov.au/archived/module/appendix-c-2/
Cultural Ministers Council Standing Committee. 2002. Report to Ministers on an examination of the small to medium performing arts sector. Accessed on 30 September 2016 at https://www.arts.gov.au/sites/g/files/net1761/f/report-to-ministers-on-an-examination-of-the-small-to-medium-performing-arts-sector.pdf
DCA. 2016. Annual Reports 2010-11 to 2015-16. Department of Culture and the Arts. Government of Western Australia. Accessed at http://www.dca.wa.gov.au/About-US/annual-reports/
Department of Communications, Information Technology and the Arts. 2002. Report of the Contemporary Visual Arts and Craft Inquiry. Commonwealth Government. Accessed at http://citeseerx.ist.psu.edu/viewdoc/download?doi=10.1.1.184.5855&rep=rep1&type=pdf
Department of Premier and Cabinet. 2016. Annual Reports 2014-15 and 2015-16. Queensland Government. Accessed at http://www.premiers.qld.gov.au/publications/categories/reports/annual-reports/2014-2015/assets/dpc-annual-report-2014-2015.pdf and http://www.premiers.qld.gov.au/publications/categories/reports/annual-reports/2015-2016/assets/dpc-annual-report-2015-2016.pdf
Department of State Growth. 2016. Annual Report 2014-15. Tasmanian Government. Accessed at http://www.stategrowth.tas.gov.au/home/guides_and_publications/annual_reports
DPC. 2016. Annual Report 2012-13. South Australian Government. Accessed at http://www.dpc.sa.gov.au/about/annual-reports
DSD. 2016. Annual Reports 2014-15. Department of State Development. South Australian Government. Accessed at http://www.statedevelopment.sa.gov.au/about-us/publications-and-reports
Department of Arts and Museums. 2015. Annual Report 2014-15. Northern Territory Government. Accessed at https://artsandmuseums.nt.gov.au/publications-policy-consultation/annual-reports
95 || 96
Department of Treasury and Finance. 2015a. Victorian Budget 2015-16. Statement of Finances. Accessed at http://www.dtf.vic.gov.au/State-Budget/2015-16-State-Budget/Statement-of-Finances
Department of Treasury and Finance, 2015b. Budget Paper 3: Budget Statement. South Australian Government. Accessed at http://www.treasury.sa.gov.au/budget/previous-budgets/2014-15
Department of Treasury and Finance. 2015c. The Budget - Budget Paper Number 1. Accessed at https://www.treasury.tas.gov.au/domino/dtf/dtf.nsf/dd9a81107f3e40bbca2579e6001961ee/3425a94f1d3894baca257e49000ff529?OpenDocument
DSITIA. 2014. Annual Reports 2011-12, and 2013-14. Accessed at http://www.parliament.qld.gov.au/documents/tableOffice/TabledPapers/2014/5414T6024.pdf and http://www.parliament.qld.gov.au/documents/tableOffice/TabledPapers/2012/5412T1440.pdf
Gill, R. 2016. Fifield set to restore raided arts funds to Australia Council. Accessed at https://dailyreview.com.au/fifield-set-restore-raided-arts-funds-australia-council/50036/
Government of Western Australia. 2015. Budget Paper No. 3. Economic and Fiscal Outlook. Accessed at http://static.ourstatebudget.wa.gov.au/16-17/2016-17-wa-state-budget-bp3.pdf
GPAC. 2016. Annual Reports 2011-12 to 2015-16. Geelong Performing Arts Centre. Accessed at http://gpac.org.au/about-us/annual-reports/
Keynes, John Maynard (1936 (26 August)), ‘Art and the State’, in Moggridge (Ed.) (1982): 341–349.
McNair, B. and Goldsmith, B., 2015. Local content and the ABC. The Conversation. Accessed at https://theconversation.com/local-content-and-the-abc-36128
Melbourne Recital Centre. 2016. Annual Reports 2011-12 to 2015-16. Accessed at http://www.melbournerecital.com.au/about/annualreports/
Murray, Phip. 2014. Talking Points: A Snapshot of Contemporary Visual Arts 2013-14, Australia Council for the Arts. Accessed at http://www.australiacouncil.gov.au/workspace/uploads/files/research/au2000_talkingpoints_final_13_-543256d38f5f6.pdf
NAVA. 2016. Annual reports 2010 to 2015. Accessed at https://visualarts.net.au/about/annual-reports/
NGV. 2016. Annual Reports 2011-12, and 2013-14. National Gallery of Victoria. Accessed at http://www.ngv.vic.gov.au/about/reports-and-documents/
NSW. 2016. 2015-16 Budget. A1. Statement of Finances. NSW Government. Accessed at http://www.budget.nsw.gov.au
NT Department of Treasury and Finance. 2016. Budget Paper number 2 – Budget Strategy and Outlook. Accessed at https://budget.nt.gov.au/__data/assets/pdf_file/0007/277603/BP2-2016-17-book.pdf
Queensland Government. 2015. State Budget delivers $173 million in funding for the arts. Media Statement. Premier and Minister for the Arts The Honourable Annastacia Palaszczuk. 14 July 2015. Accessed at http://statements.qld.gov.au/Statement/2015/7/14/state-budget-delivers-173-million-in-funding-for-the-arts
Queensland Treasury. 2015. Budget Papers 2014-15. Budget Paper 2 – Budget Strategy and Outlook. Accessed at https://www.treasury.qld.gov.au/publications-resources/state-budget/2014-15/budget-papers/bp2.php
Senate Legal and Constitutional Affairs Committee. 2015. Impact of the 2014 and 2015 Commonwealth Budget decisions on the Arts. 2 December 2015. Accessed at http://www.aph.gov.au/Parliamentary_Business/Committees/Senate/Legal_and_Constitutional_Affairs/Arts_Funding/Report
Throsby, D. 2003. Determining the value of cultural goods: how much (or how little) does contingent valuation tell us?’, Journal of Cultural Economics, 27, 3-4: 275-285.
Throsby, D. and Zednick, A. 2008. The Value of Arts and Cultural Activities in Australia: Survey Results, Macquarie Economics Research Papers, Macquarie University, Sydney
Trade and Investment. 2013. Annual Report 2012-13. Accessed at http://www.arts.nsw.gov.au/wp-content/uploads/2013/12/NSW_Trade__Investment_Annual_Report_2012-13_web_version.pdf
Treasury ACT. 2016. Budget Papers – Budget Outlook, Chapter 6 Revenue. Accessed at http://apps.treasury.act.gov.au/__data/assets/pdf_file/0005/870890/Chapter-6-Revenue.pdf

12. APPENDIX — SURVEY 97 || 98
121
12. APPENDIX–SURVEYSURVEYOFAUSTRALIA’SSMALL-TO-MEDIUM(S2M)VISUALARTSCOMMUNITY
TheNationalAssociationfortheVisualArts(NAVA)andEconomistsatLargeareconductingthissurveytounderstandthefundingandoutputofAustralia’svisualartsS2Ms.ThisstudywillhelpNAVArepresentthecommunitytopolicymakers,fundingbodiesandthewiderAustralianpublic.Wehopetobetterunderstand:
• Howlevelsandsourcesoffundinghavechangedoverthelastfouryears,givenchangestofundingarrangementsandgovernmentpoliciesonthearts.
• Howthishasaffectedartisticoutput• HowtheS2Msectorinteractswiththewiderartsecosystem
Theinformationyouprovidewillremainstrictlyconfidential.
PleasecompletethesurveybynolaterthanFriday26August.
Thankyouforyourtime.
1. YOUANDYOURORGANISATION
Organisationname:
State:
Yourname:
Yourrole:
Whattypeoforganisationareyou?Metro/regional
Selectone–mostrelevanttoyouo Artsspace/galleryo Artistruninitiativeo Multipurposestudio
o Festivalo Residency
o Serviceorganisation
Howlonghasyourorganisationbeenrunning? ….years
122
2. ACTIVITIESANDARTISTICOUTPUTPleasefillinwhereapplicable
2016(projected)
2015 2014 2013 2012
Numberofnewworkscreated
Numberofartistspaid/commissioned
Numberofexhibitions/events/tours
Numberofexhibitingdays
Numberofvisitors/attendees
Numberofresidencies
Numberofworkshops/classes/conferences/forums
Numberofpublications/researchpapers
Uniquevisitstowebsite/numberofsocialmediausers(followers,friends,etc)
Other
3. STAFFANDVOLUNTEERSOVERTIME
2016(projected)
2015 2014 2013 2012
Fulltimestaff
Parttimestaff
Casual/contractedstaff
Volunteers
Volunteerhours

123
4. FUNDINGSOURCESWhatareyourkeysourcesoffunding?
Pleasetick/yesorno
Federalgovernment–AustraliaCouncil
Federalgovernment–other
State/Territorygovernmentartsfunding
State/Territorygovernment–other
Localgovernment
Salesandcommissions
Workshops
Sponsorship
Philanthropy
Other
Whatleveloffundingdidyourorganisationreceivefromthesesourcesinthefollowingyears?
2016(projected)
2015 2014 2013 2012
Federalgovernment–AustraliaCouncil
Federalgovernment–other
State/Territorygovernmentartsfunding
Localgovernment
Salesandcommissions
99 || 100
124
Workshops
Sponsorship
Philanthropy
Other
5. SPENDINGWhatareyourmajorareasofspending?Whatpercentageofexpenditureisonmajoritems?
Percentageoftotalspending
Rent
Commissions
Wages
Equipment/IT
Other
6. ROLEINTHEWIDERARTSECOSYSTEMWhatotherartsorganisationsdoyoucollaboratewith,orotherwiseinteract
with?Artsmajors,ARIs,CAOS,ACDC,Regional
Galleries,etc
1.2.3.4.
Others
Whichcurrentandformerexhibitedartists/staffhaveachieved/goneontofeatureinprominentAustralianarts
organisations?
Examples:
WhatotherroledoesyourorganisationplayinthewiderAustralianorinternationalartsecosystem?
Examples:

125
7. FINALQUESTIONSWhatarethekeyfunding
challengesfacingyourorganisation?
WhatarethekeyfundingchallengesfacingtheS2Marts
community?
Wouldyoubewillingtoprovidegreaterdetailaspartofacase-
studyforourfinalreport?
Thankyouforyourtimeandforcompletingoursurvey!
101 || 102