Embed Size (px)
Citation preview


GOLDCORP | 1
Exhibit 99.1
Third Quarter Report – 2017 (in United States dollars, tabular amounts in millions, except where noted)
MANAGEMENT’S DISCUSSION AND ANALYSISOF FINANCIAL CONDITION AND RESULTS OF OPERATIONSFOR THE THREE AND NINE MONTHS ENDED SEPTEMBER 30, 2017This Management’s Discussion and Analysis (“MD&A”) should be read in conjunction with the condensed interim consolidated financial statements of Goldcorp Inc. (“Goldcorp” or “the Company”) for the three and nine months ended September 30, 2017 and related notes thereto which have been prepared in accordance with International Accounting Standard 34 – Interim Financial Reporting of International Financial Reporting Standards (“GAAP” or “IFRS”) as issued by the International Accounting Standards Board (“IASB”). All figures are in United States (“US”) dollars unless otherwise noted. References to C$ are to Canadian dollars. This MD&A has been prepared as of October 25, 2017.
TABLE OF CONTENTS
PageNumber
Cautionary StatementsQuarter HighlightsBusiness Overview and StrategyCorporate DevelopmentsMarket OverviewQuarterly ResultsLiquidity and Capital ResourcesGuidanceOperational and Projects Review2017 Reserves and Resources UpdateNon-GAAP Performance MeasuresRisks and UncertaintiesAccounting MattersControls and ProceduresMineral Reserves and Resources
245568
151617313341454849

Third Quarter Report – 2017 (in United States dollars, tabular amounts in millions, except where noted)
GOLDCORP | 2
CAUTIONARY STATEMENT REGARDING FORWARD-LOOKING STATEMENTS
This MD&A contains “forward-looking statements” within the meaning of Section 27A of the United States Securities Act of 1933, as amended, Section 21E of the United States Exchange Act of 1934, as amended, the United States Private Securities Litigation Reform Act of 1995, or in releases made by the United States Securities and Exchange Commission, all as may be amended from time to time, and "forward-looking information" under the provisions of applicable Canadian securities legislation, concerning the business, operations and financial performance and condition of Goldcorp. Forward-looking statements include, but are not limited to, statements with respect to the future price of gold, silver, copper, lead and zinc, the estimation of Mineral Reserves (as defined below) and Mineral Resources (as defined below), the realization of Mineral Reserve estimates, the timing and amount of estimated future production, costs of production, targeted cost reductions, capital expenditures, free cash flow, costs and timing of the development of new deposits, success of exploration activities, permitting time lines, hedging practices, currency exchange rate fluctuations, requirements for additional capital, government regulation of mining operations, environmental risks, unanticipated reclamation expenses, timing and possible outcome of pending litigation, title disputes or claims and limitations on insurance coverage. Generally, these forward-looking statements can be identified by the use of forward-looking terminology such as “plans”, “expects” , “is expected”, “budget”, “scheduled”, “estimates”, “forecasts”, “intends”, “anticipates”, “believes”, or variations or comparable language of such words and phrases or statements that certain actions, events or results “may”, “could”, “would”, "should", “might” or “will be taken”, “occur” or “be achieved” or the negative connotation thereof.
Forward-looking statements are necessarily based upon a number of factors and assumptions that, if untrue, could cause the actual results, performances or achievements of Goldcorp to be materially different from future results, performances or achievements expressed or implied by such statements. Such statements and information are based on numerous assumptions regarding present and future business strategies and the environment in which Goldcorp will operate in the future, including the price of gold, anticipated costs and ability to achieve goals. Certain important factors that could cause actual results, performances or achievements to differ materially from those in the forward-looking statements include, among others, gold price volatility, discrepancies between actual and estimated production, Mineral Reserves and Mineral Resources and metallurgical recoveries, mining operational and development risks, litigation risks, regulatory restrictions (including environmental regulatory restrictions and liability), changes in national and local government legislation, taxation, controls or regulations and/or change in the administration of laws, policies and practices, expropriation or nationalization of property and political or economic developments in Canada, the United States and other jurisdictions in which the Company does or may carry on business in the future, delays, suspension and technical challenges associated with capital projects, higher prices for fuel, steel, power, labour and other consumables, currency fluctuations, the speculative nature of gold exploration, the global economic climate, dilution, share price volatility, competition, loss of key employees, additional funding requirements and defective title to mineral claims or property. Although Goldcorp believes its expectations are based upon reasonable assumptions and has attempted to identify important factors that could cause actual actions, events or results to differ materially from those described in forward-looking statements, there may be other factors that cause actions, events or results not to be as anticipated, estimated or intended.
Forward-looking statements are subject to known and unknown risks, uncertainties and other important factors that may cause the actual results, level of activity, performance or achievements of Goldcorp to be materially different from those expressed or implied by such forward-looking statements, including but not limited to: risks related to the integration of acquisitions; risks related to international operations, including economic and political instability in foreign jurisdictions in which Goldcorp operates; risks related to current global financial conditions; risks related to joint venture operations; actual results of current exploration activities; actual results of current reclamation activities; environmental risks; conclusions of economic evaluations; changes in project parameters as plans continue to be refined; future prices of gold, silver, copper, lead and zinc; possible variations in ore reserves, grade or recovery rates; failure of plant, equipment or processes to operate as anticipated; mine development and operating risks; accidents, labour disputes and other risks of the mining industry; risks associated with restructuring and cost-efficiency initiatives; delays in obtaining governmental approvals or financing or in the completion of development or construction activities; risks related to indebtedness and the service of such indebtedness, as well as those factors discussed in the section entitled "Description of the Business – Risk Factors” in Goldcorp’s most recent annual information form available on SEDAR at www.sedar.com and on EDGAR at www.sec.gov. Although Goldcorp has attempted to identify important factors that could cause actual results to differ materially from those contained in forward-looking statements, there may be other factors that cause results not to be as anticipated, estimated or intended. There can be no assurance that such statements will prove to be accurate, as actual results and future events could differ materially from those anticipated in such statements. Accordingly, readers should not place undue reliance on forward-looking statements. Forward-looking statements are made as of the date hereof and, accordingly, are subject to change after such date. Except as otherwise indicated by Goldcorp, these statements do not reflect the potential impact of any non-recurring or other special items or of any disposition, monetization, merger, acquisition, other business combination or other transaction that may be announced or that may occur after the date hereof. Forward-looking statements are provided for the purpose of providing information about management’s current expectations and plans and allowing investors and others to get a better understanding of Goldcorp's operating environment. Goldcorp does not intend or undertake to publicly update any forward-looking statements that are included in this document, whether as a result of new information, future events or otherwise, except in accordance with applicable securities laws.
CAUTIONARY STATEMENT REGARDING CERTAIN MEASURES OF PERFORMANCE
This MD&A presents certain measures, including "total cash costs: by-product", "total cash costs: co-product", ‘‘all-in sustaining costs", ‘‘adjusted operating cash flow’’, "EBITDA", "adjusted EBITDA" and "adjusted net debt", that are not recognized measures under IFRS. This data may not be comparable to data presented by other gold producers. For a reconciliation of these measures to the most directly comparable financial information presented in the consolidated financial statements prepared in accordance with IFRS, see Non-GAAP Financial Performance Measures in this MD&A. The Company believes that these generally accepted industry measures are realistic indicators of operating performance and are useful in performing year over year comparisons. However, these non-GAAP measures should be considered together with other data prepared in accordance with IFRS, and these measures, taken by themselves, are not necessarily indicative of operating costs or cash flow measures prepared in accordance with IFRS. This MD&A also contains
Third Quarter Report – 2017 (in United States dollars, tabular amounts in millions, except where noted)
GOLDCORP | 3
information as to estimated future all-in sustaining costs. The estimates of future all-in sustaining costs are not based on total production cash costs calculated in accordance with IFRS, which forms the basis of the Company’s cash costs: by-product. The estimates of future all-in sustaining costs are anticipated to be adjusted to include sustaining capital expenditures, corporate administrative expense, exploration and evaluation costs and reclamation cost accretion and amortization, and exclude the effects of expansionary capital, tax payments, dividends and financing costs. Projected IFRS total production cash costs for the full year would require inclusion of the projected impact of future included and excluded items, including items that are not currently determinable, but may be significant, such as sustaining capital expenditures, reclamation cost accretion and amortization and tax payments. Due to the uncertainty of the likelihood, amount and timing of any such items, the Company does not have information available to provide a quantitative reconciliation of projected all-in sustaining costs to a total production cash costs projection.
CAUTIONARY NOTE REGARDING RESERVES AND RESOURCES
Scientific and technical information contained in this MD&A relating to Mineral Reserves and Mineral Resources was reviewed and approved by Dan Redmond, P.Geo., Director, Reserves & Mine Planning for Goldcorp, and a “qualified person” as defined by Canadian Securities Administrators' National Instrument 43-101 – Standards of Disclosure for Mineral Projects (“NI 43-101”). Scientific and technical information in this MD&A relating to exploration results was reviewed and approved by Sally Goodman, PhD, P.Geo., Director, Generative Geology for Goldcorp, and a "qualified person" as defined by NI 43-101. All Mineral Reserves and Mineral Resources have been estimated in accordance with the standards of the Canadian Institute of Mining, Metallurgy and Petroleum ("CIM") and NI 43-101, or the Australasian Code for Reporting of Exploration Results, Mineral Resources and Ore Reserves equivalent. All Mineral Resources are reported exclusive of Mineral Reserves. Mineral Resources that are not Mineral Reserves do not have demonstrated economic viability. Information on data verification performed on the mineral properties mentioned in this MD&A that are considered to be material mineral properties to the Company are contained in Goldcorp’s most recent annual information form and the current technical report for each of those properties, all available on SEDAR at www.sedar.com.
Cautionary Note to United States investors concerning estimates of measured, indicated and inferred resources: The Mineral Resource and Mineral Reserve estimates contained in this MD&A have been prepared in accordance with the requirements of the securities laws in effect in Canada, which differ from the requirements of United States securities laws and use terms that are not recognized by the United States Securities and Exchange Commission (“SEC”). Canadian reporting requirements for disclosure of mineral properties are governed by NI 43-101. The definitions used in NI 43-101 are incorporated by reference from the CIM Definition Standards adopted by CIM Council on May 10, 2014 (the “CIM Definition Standards”). U.S. reporting requirements are governed by the SEC Industry Guide 7 (“Industry Guide 7”) under the United States Securities Act of 1933, as amended. These reporting standards have similar goals in terms of conveying an appropriate level of confidence in the disclosures being reported, but embody difference approaches and definitions. For example, the terms “Mineral Reserve”, “Proven Mineral Reserve” and “Probable Mineral Reserve” are Canadian mining terms as defined in in NI 43-101, and these definitions differ from the definitions in Industry Guide 7. Under Industry Guide 7 standards, a “final” or “bankable” feasibility study is required to report reserves and the primary environmental analysis or report must be filed with the appropriate governmental authority. Further, under Industry Guide 7, mineralization may not be classified as "reserve" unless the determination has been made that the mineralization could be economically and legally produced or extracted at the time the reserve determination is made.
While the terms “Mineral Resource”, “Measured Mineral Resource”, “Indicated Mineral Resource” and “Inferred Mineral Resource” are defined in and required to be disclosed by NI 43-101, these terms are not defined terms under Industry Guide 7 and are normally not permitted to be used in reports and registration statements filed with the SEC. United States readers are cautioned not to assume that any part or all of mineral deposits in these categories will ever be converted into reserves. In addition, “Inferred Mineral Resources” have a great amount of uncertainty as to their existence and their economic and legal feasibility. A significant amount of exploration must be completed in order to determine whether an Inferred Mineral Resource may be upgraded to a higher category. Under Canadian regulations, estimates of Inferred Mineral Resources may not form the basis of feasibility or pre-feasibility studies, except in rare cases. United States readers are cautioned not to assume that all or any part of an Inferred Mineral Resource exists or is economically or legally mineable. Disclosure of “contained ounces” in a resource is permitted disclosure under Canadian regulations if such disclosure includes the grade or quality and the quantity for each category of Mineral Resource and Mineral Reserve; however, the SEC normally only permits issuers to report mineralization that does not constitute “reserves” by SEC standards as in place tonnage and grade without reference to unit measures.
Accordingly, information contained in this MD&A containing descriptions of the Goldcorp’s mineral deposits may not be comparable to similar information made public by United States companies subject to the reporting and disclosure requirements under the United States federal securities laws and the rules and regulations thereunder.

Third Quarter Report – 2017 (in United States dollars, tabular amounts in millions, except where noted)
GOLDCORP | 4
FINANCIAL AND OPERATIONAL HIGHLIGHTS FOR THE THREE MONTHS ENDED SEPTEMBER 30, 2017
Net earnings were $111 million, or $0.13 per share, compared to net earnings of $59 million, or $0.07 per share, for the third quarter of 2016. Operating cash flows for the third quarter of 2017 were $315 million compared to $267 million for the same period in the prior year. Adjusted operating cash flows were $308 million (1) for the third quarter of 2017 compared to $401 millionfor the same period in the prior year.
Gold production of 633,000 ounces at all-in sustaining costs ("AISC") of $827 per ounce, compared to 715,000 ounces at AISC of $812 per ounce for the third quarter of 2016 (1). 2017 guidance reconfirmed for gold production of 2.5 million ounces (+/- 5%) and AISC of $825(2) per ounce (+/- 5%), previously improved from $850 per ounce, reflecting the progress the Company has made on its efficiency program.
Program to implement $250 million of sustainable annual efficiencies by the middle of 2018 is on track with $200 million expected to be achieved in 2017 across the Company's portfolio. More than 100% of the $250 million of efficiencies have been identified, with the program likely to be extended and the efficiency target increased, after the Company achieves its current target.
Solid reserve growth and project execution enhances confidence in the Company's 20/20/20 growth plan. An increase in proven and probable gold reserves to 53.5 million ounces, strong project delivery of expansions at Peñasquito, Musselwhite and Porcupine (Borden) underpin our plan for a 20% increase in gold production, a 20% increase in gold reserves and a 20% reduction in AISC by 2021, while delivering increasing cash flows over the next five years.
(1) The Company has included non-GAAP performance measures on an attributable (or Goldcorp's share) basis throughout this document. Adjusted operating cash flows and AISC per ounce and adjusted operating cash flows are non-GAAP financial performance measures with no standardized definition under IFRS. For further information and detailed reconciliations, please see pages 33-40 of this MD&A.
(2) Refer to footnote (4) on page 17 of this MD&A regarding the Company's projection of AISC.

Third Quarter Report – 2017 (in United States dollars, tabular amounts in millions, except where noted)
GOLDCORP | 5
BUSINESS OVERVIEW
Goldcorp is a leading gold producer focused on responsible mining practices, with production from a portfolio of long-life, high quality assets throughout the Americas that it believes position the Company to deliver long-term value.
The Company’s principal producing mining properties are comprised of the Éléonore, Musselwhite, Porcupine and Red Lake mines in Canada; the Peñasquito mine in Mexico; the Cerro Negro mine in Argentina; and the Pueblo Viejo mine (40.0% interest) in the Dominican Republic.
The Company’s current sources of operating cash flows are primarily from the sale of gold, silver, lead, zinc and copper. Goldcorp's principal product is refined gold bullion sold primarily in the London spot market. As a result, Goldcorp is not dependent on a particular purchaser with regard to the sale of the gold bullion. In addition to gold, the Company also produces silver, copper, lead and zinc primarily from concentrate produced at the Peñasquito mine, which is sold to third party smelters and refineries.
Goldcorp has an investment-grade credit rating, supported by a strong balance sheet, and remains 100% unhedged to gold sales, providing full exposure to gold prices.
STRATEGY
Goldcorp's vision is to create sustainable value for all of its stakeholders by growing net asset value ("NAV") per share to generate long-term shareholder value. With a portfolio of large, long-life assets that provide economies of scale, coupled with low AISC and underpinned by a strong balance sheet, Goldcorp continues to optimize its portfolio of assets and reinvest in a strong pipeline of organic opportunities to drive increasing margins and returns on investment.
The Company has outlined its 20/20/20 growth plan that is expected to deliver a 20% increase in gold production, a 20% increase in gold reserves and a 20% reduction in AISC by 2021. In pursuit of this, Goldcorp is committed to being responsible stewards of the environment and building collaborative partnerships with communities, governments and all other stakeholders for mutual success.
With a strong balance sheet, Goldcorp believes it is well-positioned to weather gold price volatility. The Company's capital allocation strategy focuses on investing in its pipeline of organic growth opportunities, further debt reduction and returning capital to its shareholders by paying a sustainable dividend. Furthermore, Goldcorp leverages its exploration spending in the most efficient way possible through small toehold investments in junior mining companies.
CORPORATE DEVELOPMENTS
Acquisition of the Caspiche Project
During the second quarter of 2017, the Company acquired 83% of the issued and outstanding shares of Exeter Resource Corporation ("Exeter") and its Caspiche project (the "Caspiche Transaction"), located in the Maricunga Gold Belt, for share consideration of approximately $131 million. On August 2, 2017, the Company completed the acquisition of the remaining 17% interest in Exeter through the issuance of 1,890,144 common shares with a fair value of $25 million. After completing the acquisition of the 100% interest in Exeter, Goldcorp contributed the Caspiche project into the joint operation with Barrick Gold Corporation ("Barrick"), which resulted in Barrick and Goldcorp each holding an indirect 50% interest in the combined Cerro Casale and Caspiche projects. The transactions are consistent with the Company's strategy of populating its pipeline with high-quality, long-dated optionality to drive increasing NAV per share.
Sale of the San Nicolas Project
On October 18, 2017, the Company sold its 21% interest in the San Nicolas copper-zinc project, a stand-alone project in Mexico, to Teck Resources Limited for cash consideration of $50 million. The carrying value of San Nicolas was nominal at September 30, 2017; the resulting gain will be recognized in the fourth quarter of 2017.
PROGRESS TOWARDS DELIVERING $250 MILLION OF SUSTAINABLE ANNUAL EFFICIENCIES
During the third quarter of 2017, the Company continued to execute its productivity and cost optimization program, with all operations participating in the delivery phase of the program. At Cerro Negro and Goldcorp’s corporate offices, voluntary and involuntary staff reductions and other cost savings initiatives have been implemented which contribute to $115 million per year in cost reductions. In the third quarter of 2017, Peñasquito and Eleonore continued the process of rationalizing maintenance and supply contracts. Both Porcupine and Red Lake continue to achieve productivity goals related to underground mine development and site-wide cost reductions. Given the Company's progress to date, the program is likely to be extended and the efficiency target increased, after the Company attains its current target, which it expects to achieve by the middle of 2018.

Third Quarter Report – 2017 (in United States dollars, tabular amounts in millions, except where noted)
GOLDCORP | 6
BOARD APPOINTMENT
Mr. Matthew Coon Come was appointed to the Company's Board of Directors in July 2017. Mr. Coon Come is a national and international leader and advocate of indigenous rights, having previously served as both the Grand Chief of the Grand Council of the Crees and the Chairperson of the Cree Regional Authority for over 20 years. He also served as National Chief of the Assembly of First Nations from 2000 to 2003. Mr. Coon Come studied political science, economics, native studies and courses in law at both Trent and McGill Universities. In addition, he was granted the degree of Doctor of Laws Honoris Causta from Trent University in 1998 and the Honorary Doctor of Laws from the University of Toronto in 2000 in recognition of his leadership and the significance of his work.
MARKET OVERVIEW
Gold
The market price of gold is the primary driver of Goldcorp's profitability. The price of gold can fluctuate widely and is affected by a number of macroeconomic factors, including the sale or purchase of gold by central banks and financial institutions, interest rates, exchange rates, inflation or deflation, global and regional supply and demand and the political and economic conditions of major gold-producing and gold-consuming countries throughout the world.
Source: London Bullion Market Association (LBMA) Gold PM Fix
In contrast to second quarter of 2017, the price of gold showed greater resolve throughout most of the third quarter of 2017, underpinned by geo-political risks in Europe and Asia as well as steady physical and Central Bank demand. Gold began the quarter at $1,240 per ounce and traded to a 12-month high of $1,357.50 in early September 2017, before profit-taking and a refocus on market expectations for further interest rate increases by the Federal Reserve saw prices slip to $1,280 for a net gain of $40 per ounce during a period typically characterized by quiet summer holiday trading conditions. During the third quarter of 2017, the Company realized an average gold price of $1,287 per ounce, a 3% decrease compared to $1,333 per ounce in the third quarter of 2016. For the nine months ended September 30, 2017, the Company realized an average gold price of $1,259 per ounce, a 1% decrease compared to $1,267 per ounce in the nine months ended September 30, 2016.
Currency Markets (1)
The results of Goldcorp's mining operations are affected by the US dollar exchange rates. The Company has exposure to the Canadian dollar at Éléonore, Musselwhite, Porcupine and Red Lake, exposure to the Mexican peso at Peñasquito, exposure to the Argentine peso at Cerro Negro and exposure to the Dominican Republic peso relating to its investment in Pueblo Viejo. The Company's exposure to the Mexican peso and Guatemalan quetzal decreased in the second quarter of 2017 after the closing of the sale of the Los Filos mine in April and the closure of the Marlin mine at the end of May.
Fluctuations in the US dollar can cause volatility of costs reported in US dollars. In addition, monetary assets and liabilities that are denominated in non-US dollar currencies, such as cash and cash equivalents and value-added taxes, are subject to currency risk. Goldcorp is further exposed to currency risk through non-monetary assets and liabilities of entities whose taxable profit or tax loss are denominated in non-US dollar currencies. Changes in exchange rates give rise to temporary differences resulting in deferred tax assets and liabilities with the resulting deferred tax charged or credited to income tax expense.
Goldcorp's financial risk management policy allows the hedging of foreign exchange exposure to reduce the risk associated with currency fluctuations. The Company enters into Mexican peso currency hedge contracts to purchase Mexican pesos at pre-determined US dollar amounts. These contracts are entered into to normalize operating expenses and capital expenditures at Peñasquito expressed in US dollar terms.

Third Quarter Report – 2017 (in United States dollars, tabular amounts in millions, except where noted)
GOLDCORP | 7
Currency markets continued to fluctuate in the third quarter of 2017. The Canadian dollar exhibited increased volatility during the third quarter of 2017, strengthening to a 2-year high against the US dollar in mid-September, as a result of two interest rate hikes from the Bank of Canada, and then falling back to $1.25 at the end of the quarter. The Mexican peso remained relatively stable during the quarter.
The Argentine peso continued its weakening trend, despite significant rallies throughout the quarter. This trend is due largely to concerns of inflation continuing to exceed the central bank target, and political uncertainty surrounding the legislative elections in October 2017.
(1) Foreign Exchange Rate Sources:(a) Canadian Dollar/US$: Bank of Canada Noon rate (July 1, 2016 - April 28, 2017), Bank of Canada Daily Average (April 29, 2017 - September 30, 2017)(b) Mexican Peso/US$: Central Bank of Mexico Current Day Fixing(c) Argentine Peso/US$: Central Bank of Argentina Current Day Fixing

Third Quarter Report – 2017 (in United States dollars, tabular amounts in millions, except where noted)
GOLDCORP | 8
OVERVIEW OF QUARTERLY FINANCIAL AND OPERATING RESULTS
September 30 June 30 March 31 December 312017 2016 2017 2016 2017 2016 2016 2015
Financial ResultsRevenues $ 866 $ 915 $ 822 $ 753 $ 882 $ 944 $ 898 $ 1,072Net earnings (loss) $ 111 $ 59 $ 135 $ (78) $ 170 $ 80 $ 101 $ (4,271)Net earnings (loss) per share – Basic and diluted $ 0.13 $ 0.07 $ 0.16 $ (0.09) $ 0.20 $ 0.10 $ 0.12 $ (5.14)Operating cash flow $ 315 $ 267 $ 158 $ 234 $ 227 $ 59 $ 239 $ 401Adjusted operating cash flow (1) $ 308 $ 401 $ 320 $ 204 $ 315 $ 330 $ 306 $ 339Adjusted EBITDA (1), (2) $ 396 $ 477 $ 417 $ 266 $ 421 $ 396 $ 519 $ (4,595)Expenditures on mining interests (cash basis) $ 291 $ 168 $ 233 $ 177 $ 186 $ 182 $ 217 $ 251– Sustaining $ 143 $ 112 $ 133 $ 140 $ 113 $ 140 $ 145 $ 188– Expansionary $ 148 $ 56 $ 100 $ 37 $ 73 $ 42 $ 72 $ 63Dividends paid $ 15 $ 14 $ 16 $ 16 $ 15 $ 51 $ 16 $ 49
Operating Results (1)
Gold produced (thousands of ounces) 633 715 635 613 655 784 761 909Gold sold (thousands of ounces) 606 686 649 616 646 799 768 918Silver produced (thousands of ounces) 7,000 7,700 7,400 5,300 7,100 7,700 7,400 10,200Copper produced (thousands of pounds) 6,300 16,900 7,900 14,400 9,700 17,200 20,400 21,400Lead produced (thousands of pounds) 38,300 33,700 26,100 17,100 32,400 29,000 29,600 40,500Zinc produced (thousands of pounds) 98,400 75,200 84,100 38,300 80,700 71,100 78,300 89,300Average realized gold price (per ounce) $ 1,287 $ 1,333 $ 1,256 $ 1,277 $ 1,236 $ 1,203 $ 1,181 $ 1,098Cash costs: by-product (per ounce) (3) $ 483 $ 554 $ 510 $ 728 $ 540 $ 557 $ 481 $ 687Cash costs: co-product (per ounce) (4) $ 663 $ 657 $ 644 $ 716 $ 701 $ 604 $ 619 $ 739All-in sustaining costs (per ounce) $ 827 $ 812 $ 800 $ 1,067 $ 800 $ 836 $ 747 $ 977
(1) The Company has presented the non-GAAP performance measures on an attributable (or Goldcorp's share) basis in the table above. Adjusted operating cash flows, Adjusted EBITDA and AISC are non-GAAP financial performance measures with no standardized definition under IFRS. For further information and detailed reconciliations, please see pages 33-40 of this report.
(2) Adjusted EBITDA for the three months ended December 31, 2016 includes an impairment reversal of $49 million and for the three months ended December 31, 2015 includes an impairment charge of $4.9 billion. Please refer to the respective quarterly reports for other non-cash or other items that management believes are not reflective of the performance of the underlying operations.
(3) Total cash costs: by-product, per ounce, is calculated net of Goldcorp’s share of by-product sales revenues (by-product silver sales revenues for Cerro Negro, Marlin and Pueblo Viejo; by-product lead, zinc and copper sales revenues and 75% of silver sales revenues for Peñasquito at market silver prices, and 25% of silver sales revenues for Peñasquito at $4.13 per silver ounce (2016 – $4.09 per silver ounce) sold to Wheaton Precious Metals Corp. ("Wheaton") and by-product copper sales revenues for Alumbrera).
(4) Total cash costs: co-product, per ounce, is calculated by allocating Goldcorp’s share of production costs to each co-product (Alumbrera (copper); Marlin (silver); Pueblo Viejo (silver and copper); Peñasquito (silver, lead and zinc)) based on the ratio of actual sales volumes multiplied by budget metal prices (see page 33).
Third Quarter Report – 2017 (in United States dollars, tabular amounts in millions, except where noted)
GOLDCORP | 9
REVIEW OF THIRD QUARTER FINANCIAL RESULTS
Three months ended September 30, 2017 compared to the three months ended September 30, 2016
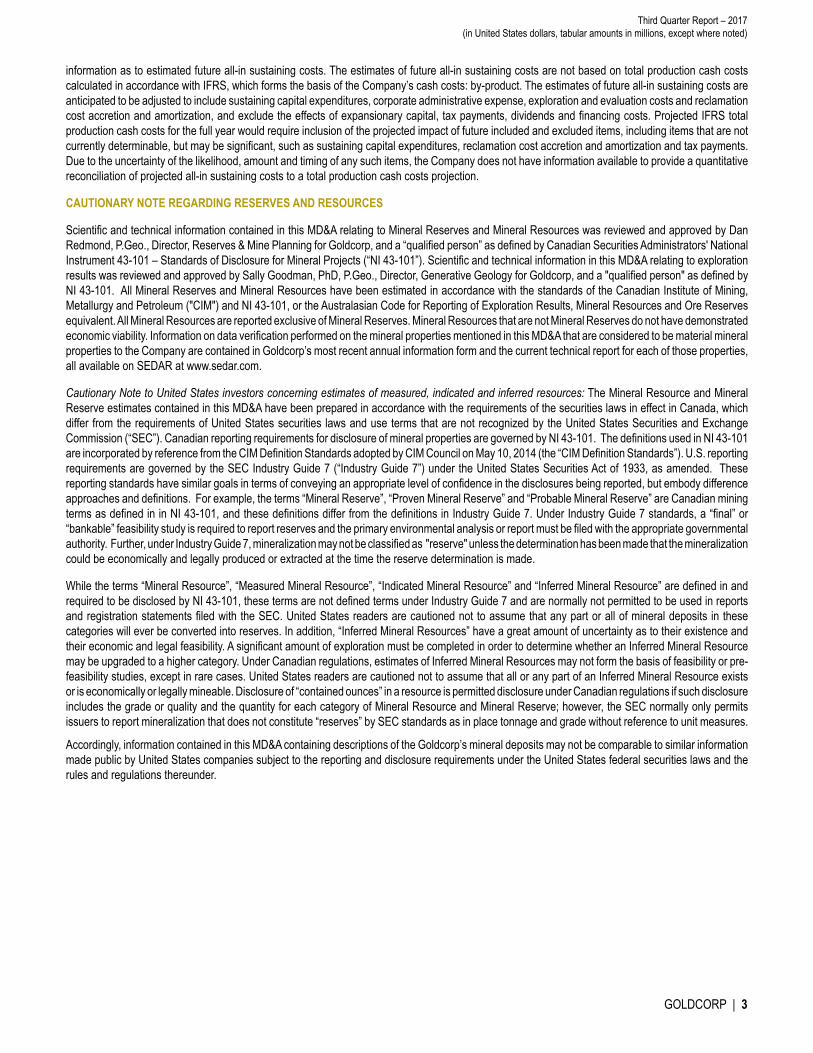
Net earnings for the three months ended September 30, 2017 were $111 million, or $0.13 per share, compared to net earnings of $59 million, or $0.07 per share, for the three months ended September 30, 2016. The increase in net earnings in the third quarter of 2017 compared to the same period in 2016 was primarily due to higher earnings from Peñasquito from higher gold and zinc production from metal recoveries and increases in zinc market prices, the impact of the Company's initiative to realize $250 million of sustainable annual efficiencies and an increase in the Company's income tax recovery compared to the same period in the prior year. These increases were partially offset by lower earnings from Red Lake as the mine focused on increased mine development and initiatives to enhance mining methods and rationalize the cost structure as it transitions to a lower grade mining environment, and a decrease in earnings from Pueblo Viejo due to lower ore grades attributable to the mining sequence.
Net earnings and earnings per share for the third quarter of 2017 were affected by a negative impact from the buildup of unsold gold at the end of the quarter and, for both the third quarter of 2017 and 2016, among other things, the following non-cash or other items that management believes are not reflective of the performance of the underlying operations (items are denoted as (increases)/decreases to net earnings and net earnings per share):
Three months endedSeptember 30, 2017
Three months endedSeptember 30, 2016
(in millions, except per share) Pre-tax After-taxPer share($/share) Pre-tax After-tax
Per share($/share)
(Positive)/negative deferred tax effects of foreign exchange on tax assets and liabilities and losses (1) $ — $ (40) $ (0.04) $ — $ 22 $ 0.03Unrealized foreign exchange loss on Argentine peso denominatedconstruction value-added tax receivable $ 2 $ 2 $ — $ 2 $ 2 $ —Restructuring costs $ 1 $ 1 $ — $ 6 $ 4 $ 0.01
(1) Positive deferred tax effects of foreign exchange on tax assets and liabilities and losses of $40 million in the three months ended September 30, 2017 (three months ended September 30, 2016 – negative deferred tax effects of $22 million) was primarily comprised of a foreign exchange gain on the translation of current and deferred income tax assets and liabilities, arising primarily from acquisitions and dispositions, of $19 million (three months ended September 30, 2016 – foreign exchange loss of $30 million) and Argentine tax deductible foreign exchange losses on US dollar denominated debt in local currency of $21 million (three months ended September 30, 2016 – $8 million).
Revenues
Three months ended September 30 2017 (1) 2016 (1) Change %Gold
Revenue (millions) $ 628 $ 716 (12)%Ounces sold (thousands) 490 537 (9)%Average realized price ($/ounce) $ 1,287 $ 1,336 (4)%
SilverRevenue (millions) $ 90 $ 119 (24)%Ounces sold (thousands) 6,780 7,355 (8)%Average realized price ($/ounce) $ 14.01 $ 16.93 (17)%
Other metalsRevenue (millions) $ 148 $ 80 85 %
Total revenue (millions) $ 866 $ 915 (5)%
(1) Excludes attributable share of revenues from the Company's associates.
Revenues decreased by $49 million, or 5%, primarily due to decreases in gold and silver sales volumes of 9% and 8%, respectively, and decreases in the average realized gold and silver realized prices, partially offset by a 33% increase in the average realized zinc price and higher zinc sales volumes. The decrease in the gold sales volumes was primarily due to lower sales at Red Lake, due to lower tonnes and grade from the High Grade Zone, and the impact of the sale of Los Filos in April 2017 and closure of Marlin in the second quarter of 2017, offset partially by higher sales volumes at Peñasquito and Cerro Negro. The decrease in silver sales volumes was due to the closure of Marlin in the second quarter of 2017. The increase in zinc sales volumes was due to higher grade ore processed at Peñasquito.

Third Quarter Report – 2017 (in United States dollars, tabular amounts in millions, except where noted)
GOLDCORP | 10
Production Costs
Production costs in the third quarter of 2017 decreased by $64 million, or 12%, when compared to the same period in the prior year primarily due to the closure of Marlin in the second quarter of 2017 ($49 million) and the divestiture of Los Filos in April 2017 ($32 million) and the impact of the Company's initiative to realize $250 million of sustainable annual efficiencies. These decreases were partially offset by higher costs at Cerro Negro due to the elimination of an export tax credit at the end of 2016 and the impact of inflation in Argentina out-pacing the devaluation of the Argentine peso.
Depreciation and Depletion
Three months ended September 30 2017 (1) 2016 (1) Change %Depreciation and depletion (millions) $ 250 $ 267 (6)%Sales ounces (thousands) 490 537 (9)%Depreciation and Depletion per ounce $ 510 $ 497 3 %
(1) Excludes attributable share of depreciation and depletion from the Company's associates.
Depreciation and depletion decreased by $17 million, or 6%, mainly due to a decrease in sales volumes. The lower sales volumes were primarily due to lower sales at Red Lake and the impact of the sale of Los Filos in April 2017 and closure of Marlin in the second quarter of 2017, offset partially by higher sales volumes at Peñasquito and Cerro Negro.
Share of Net Earnings Related to Associates and Joint Venture
Three months ended September 30 2017 2016 Change %Pueblo Viejo $ 26 $ 47 (45)%Alumbrera — — — %NuevaUnión 1 — — %Share of net earnings related to associates and joint venture $ 27 $ 47 (43)%
The Company’s share of earnings related to associates and joint venture decreased by $20 million in the third quarter of 2017 compared to the same period in the prior year primarily due to a decrease in net earnings from Pueblo Viejo due to lower grades attributable to the mining sequence. Higher grade ore is expected in the fourth quarter of 2017. With respect to Alumbrera, the Company has discontinued recognizing its share of earnings or losses of Alumbrera since impairing the investment to nil in 2015, and did not recognize its share of earnings of Alumbrera for the three months ended September 30, 2017 as future earnings will be recognized only after the Company's provision to fund its share of Alumbrera's reclamation costs is fully reversed. At September 30, 2017, the balance of the Company's provision to fund its share of Alumbrera's reclamation costs was $42 million.
Corporate AdministrationCorporate administration expenses decreased by $2 million in the third quarter of 2017 compared to the third quarter of 2016, primarily due to lower employee compensation expense as a result of the impact of cost savings initiatives undertaken in 2016 and the first quarter of 2017 to restructure and decentralize the Company's operating model.
Restructuring CostsRestructuring costs were $1 million in the three months ended September 30, 2017 compared to $6 million in the third quarter of 2016. Restructuring costs in 2017 have been lower than 2016 as the majority of the workforce reductions from the decentralization initiative at several mine site and corporate offices were executed in 2016.
Other Income/ExpenseOther expense of $1 million for the three months ended September 30, 2017 was comprised primarily of foreign exchange losses arising from value added tax receivables denominated in Argentine pesos, net of foreign exchange gains on Canadian dollar cash balances, partially offset by gains on dispositions of securities and interest income on loans held with Pueblo Viejo. Other income of $5 million for the three months ended September 30, 2016 related primarily to interest income on loans held with Pueblo Viejo and short-term money market investments and gains on dispositions of investments in securities, offset partially by foreign exchange losses arising primarily on value added tax receivables denominated in Mexican and Argentine pesos.

Third Quarter Report – 2017 (in United States dollars, tabular amounts in millions, except where noted)
GOLDCORP | 11
Income Tax RecoveryIncome tax recovery for the three months ended September 30, 2017 of $19 million represented a negative 21% rate (three months ended September 30, 2016 – income tax expense of $30 million representing a 34% rate) and was impacted by:
• $19 million foreign exchange gains on the translation of deferred income tax assets and liabilities arising primarily from acquisitions, compared to $30 million foreign exchange losses for the three months ended September 30, 2016; and
• A higher effective tax rate in the third quarter of 2017 compared to the third quarter of 2016, after adjusting for the above noted item and non-deductible share-based compensation expense. The increase in the effective tax rate in the third quarter of 2017 was primarily due to lower after-tax income from associates that is not subject to further income tax, compared to the three months ended September 30, 2016, which was partially offset by higher tax deductible Argentine Peso foreign exchange losses on US dollar denominated debt, compared to the three months ended September 30, 2016.
AISCAISC were $827 per ounce (1) for the three months ended September 30, 2017, compared to $812 per ounce for the three months ended September 30, 2016. The increase in AISC was primarily due to lower gold sales ($109 per ounce) and higher sustaining capital ($50 per ounce), mainly offset by lower production costs ($122 per ounce) and the impact of by-product production and market prices ($20 per ounce). The increase in sustaining capital was primarily due to costs associated with the tailings dam raise at Peñasquito and higher sustaining capital expenditures at Éléonore as a result of a planned increase in development rates and expenditures on the tailings cell and expansion of the waste pad.
(1) AISC per ounce is a non-GAAP financial performance measure with no standardized definition under IFRS. For further information and detailed reconciliations, please see pages 33-40 of this report.

Third Quarter Report – 2017 (in United States dollars, tabular amounts in millions, except where noted)
GOLDCORP | 12
REVIEW OF THIRD QUARTER FINANCIAL RESULTS
Nine months ended September 30, 2017 compared to the nine months ended September 30, 2016
Net earnings for the nine months ended September 30, 2017 were $416 million, or $0.48 per share, compared to net earnings of $61 million, or $0.07 per share, for the nine months ended September 30, 2016. The increase in net earnings for the nine months ended September 30, 2017 compared to the same period in 2016 was primarily due to higher earnings from Peñasquito from increases in zinc market prices and higher gold and zinc production from higher metal recoveries and higher ore grades, the impact of the Company's initiative to realize $250 million of sustainable annual efficiencies, and an increase in the Company's income tax recovery compared to the same period in the prior year. These increases were partially offset by lower earnings from Red Lake as the mine focused on increased mine development and initiatives to enhance mining methods and rationalize the cost structure as it transitions to a lower grade mining environment, and lower earnings at Porcupine due to increases in mine development expenses and depreciation and depletion expense related to the Hoyle Deep winze. The sale of Los Filos and closure of Marlin, on a combined basis, did not have a significant impact on results for the nine month period September 30, 2017 compared to the same period in the prior year.
Net earnings and earnings per share for the nine months ended September 30, 2017 were affected by a negative impact from the buildup of unsold gold at the end of the September 2017 and, for both the nine months ended September 30, 2017 and 2016, among other things, the following non-cash or other items that management believes are not reflective of the performance of the underlying operations (items are denoted as (increases)/decreases to net earnings and net earnings per share):
Nine months endedSeptember 30, 2017
Nine months endedSeptember 30, 2016
(in millions, except per share) Pre-tax After-taxPer share($/share) Pre-tax After-tax
Per share($/share)
Reduction in the Company's obligation to fund its share of Alumbrera's reclamation costs (1) $ (26) $ (26) $ (0.03) $ — $ — $ —(Positive)/negative deferred tax effects of foreign exchange on tax assets and liabilities and losses (2) $ — $ (146) $ (0.17) $ — $ 42 $ 0.05Restructuring costs $ 4 $ 3 $ — $ 45 $ 32 $ 0.04Unrealized foreign exchange loss on Argentine peso denominatedconstruction value-added tax receivable $ 5 $ 5 $ — $ 22 $ 22 $ 0.03
(1) $7 million of the $33 million reduction in the Company's provision to fund its share of Alumbrera’s reclamation costs relates to Alumbrera's financial performance for the nine months ended September 30, 2017 and is therefore considered reflective of the performance of the Company's underlying operations.
(2) Positive deferred tax effects of foreign exchange on tax assets and liabilities and losses of $146 million in the nine months ended September 30, 2017 (nine months ended September 30, 2016 – negative deferred tax effects of $42 million) was primarily comprised of a foreign exchange gain on the translation of current and deferred income tax assets and liabilities, arising primarily from acquisitions and dispositions, of $100 million (nine months ended September 30, 2016 – foreign exchange loss of $121 million) and Argentine tax deductible foreign exchange losses on US dollar denominated debt in local currency of $46 million (nine months ended September 30, 2016 – $79 million).
Revenues
Nine months ended September 30 2017 (1) 2016 (1) Change %Gold
Revenue (millions) $ 1,916 $ 2,148 (11)%Ounces sold (thousands) 1,526 1,699 (10)%Average realized price $ 1,259 $ 1,266 (1)%
SilverRevenue (millions) $ 282 $ 289 (2)%Ounces sold (thousands) 20,730 19,525 6 %Average realized price $ 14.27 $ 15.45 (8)%
Other metalsRevenue (millions) $ 372 $ 175 113 %
Total revenue (millions) $ 2,570 $ 2,612 (2)%
(1) Excludes attributable share of revenues from the Company's associates.

Third Quarter Report – 2017 (in United States dollars, tabular amounts in millions, except where noted)
GOLDCORP | 13
Revenues for the nine months ended September 30, 2017 were generally consistent with the same period in the prior year as the $232 million decrease in gold revenues was mostly offset by an increase of approximately $195 million in zinc and lead revenue. The decrease in gold revenues was primarily due to lower sales volumes at Red Lake, due to lower tonnes and grade from the High Grade Zone, and the impact of the sale of Los Filos in April 2017 and closure of Marlin in the second quarter of 2017, offset partially by higher sales volumes at Peñasquito. The increase in zinc and lead revenue were due to increases in the average realized prices of 39% and 28%, respectively, and increases in sales volumes of 41% and 24%, respectively. The increase in zinc and lead sales volumes was due to higher grade ore, tonnes milled and metal recoveries at Peñasquito.
Production CostsProduction costs for the nine months ended September 30, 2017 decreased by $115 million, or 7%, when compared to the same period in the prior year, primarily due to the divestiture of Los Filos in April 2017, including the impact of lower production prior to its sale ($102 million), and the closure of Marlin in the second quarter of 2017 ($88 million). These decreases were partially offset by higher costs at Peñasquito ($49 million) due to higher fuel prices as a result of the deregulation of the fuel markets and a one-time $12 million charge to the oxide heap leach operation which was recognized in the first quarter of 2017, higher costs at Porcupine ($12 million) due to an increase in expensed mine development costs and higher costs at Cerro Negro ($9 million) due to the elimination of an export tax credit at the end of 2016 and the impact of inflation in Argentina out-pacing the devaluation of the Argentine peso, which more than offset the cost reductions from employee and contractor reductions. Production costs in 2016 were also lower comparatively due to a prolonged period of planned and unplanned maintenance at Peñasquito during the second quarter of 2016.
Depreciation and Depletion
Nine months ended September 30 2017 (1) 2016 (1) Change %Depreciation and depletion (millions) $ 735 $ 770 (5)%Sales ounces (thousands) 1,526 1,699 (10)%Depreciation and Depletion per ounce $ 482 $ 453 6 %
(1) Excludes attributable share of depreciation and depletion from the Company's associates.
Depreciation and depletion decreased by $35 million, or 5%, mainly due to lower sales volumes, offset partially by the impact of incremental depletion from the Hoyle Deep winze at Porcupine which finished construction in 2016. The lower sales volumes were primarily due to lower sales at Red Lake and the impact of the sale of Los Filos in April 2017 and closure of Marlin in the second quarter of 2017, offset partially by higher sales volumes at Peñasquito.
Share of Net Earnings Related to Associates and Joint Venture
Nine months ended September 30 2017 2016 Change %Pueblo Viejo $ 94 $ 109 (14)%Alumbrera 33 — –NuevaUnión 1 2 (50)%Share of net earnings related to associates and joint venture $ 128 $ 111 15 %
The Company’s share of earnings related to associates and joint venture increased by $17 million in the third quarter of 2017 compared to the same period in the prior year primarily due to a $33 million reduction in the Company's provision to fund its share of Alumbrera’s reclamation costs in the first quarter of 2017, which was classified as Share of Net Earnings Related to Associates and Joint Venture, offset partially by a $15 million decrease in net earnings from Pueblo Viejo. The reduction in the provision for Alumbrera reflected the expectation that Alumbrera will be able to fund a greater portion of its reclamation costs than previously estimated due to improved financial results, primarily as a result of higher realized copper prices. At December 31, 2015, the Company recognized an impairment of its investment in Alumbrera, resulting in the carrying amount of its interest being reduced to zero, and recognized a $75 million provision to fund its share of Alumbrera's reclamation costs. Since then, the Company discontinued recognizing its share of losses of Alumbrera and did not recognize its share of earnings of Alumbrera for the nine months ended September 30, 2017 as future earnings will be recognized only after the Company's provision to fund its share of Alumbrera's reclamation costs is fully reversed. The decrease in net earnings from Pueblo Viejo was primarily due to lower grades in the third quarter of 2017, attributable to the mining sequence. Higher grade ore is expected in the fourth quarter of 2017.

Third Quarter Report – 2017 (in United States dollars, tabular amounts in millions, except where noted)
GOLDCORP | 14
Impairment reversal/expenseThe Company recorded a net impairment reversal of $3 million in the nine months ended September 30, 2017. The net impairment reversal was comprised of a reversal of impairment at Cerro Blanco of $19 million, which was based on the expected proceeds from the sale to Bluestone Resources Inc. being greater than the carrying value of the asset, partially offset by an impairment expense at Los Filos of $16 million, based on changes to the carrying value of the Los Filos assets sold to Leagold Mining Corporation ("Leagold").
Corporate AdministrationCorporate administration expenses decreased by $37 million in the nine months ended September 30, 2017 compared to the same period in the prior year, primarily due to lower employee compensation expense as a result of the impact of cost savings initiatives undertaken in 2016 and the first quarter of 2017 to restructure and decentralize the Company's operating model.
Restructuring CostsRestructuring costs were $4 million for the nine months ended September 30, 2017 compared to $45 million for the nine months ended September 30, 2016. Restructuring costs in 2017 have been lower than 2016 as the majority of the workforce reductions from the decentralization initiative at several mine site and corporate offices were executed in 2016.
Other Income/ExpenseOther income of $22 million for the nine months ended September 30, 2017 was comprised primarily of interest income on loans held with Pueblo Viejo, gains on dispositions of investments in securities and foreign exchange gains arising primarily on cash balances denominated in Canadian dollars and Mexican pesos and value added tax receivables denominated in Mexican pesos, offset partially by foreign exchange losses on accounts payable denominated in Mexican pesos and value added tax receivables denominated in Argentine pesos. Other expense of $1 million for the nine months ended September 30, 2016 was comprised of a $59 million foreign exchange loss arising primarily on value added tax receivables denominated in Argentine and Mexican pesos which was offset partially by $38 million of interest income on loans held with Pueblo Viejo and short term money market investments and gains of $22 million on dispositions of investments in securities.
Income Tax Expense/RecoveryIncome tax recovery for the nine months ended September 30, 2017 of $124 million represented a negative 42% rate (nine months ended September 30, 2016 – income tax recovery of $22 million representing a 27% rate) and was impacted by:
• $100 million foreign exchange gains on the translation of deferred income tax assets and liabilities arising primarily from acquisitions, compared to $121 million foreign exchange losses for the nine months ended September 30, 2016; and
• A lower effective tax rate in the first nine months of 2017 compared to the first nine months of 2016, after adjusting for the above noted item and non-deductible share-based compensation expense. The decrease in the effective tax rate for the first nine months of 2017 was primarily due to higher after-tax income from associates that is not subject to further income tax compared to the nine months ended September 30, 2016, which was partially offset by lower tax deductible Argentine Peso foreign exchange losses on US dollar denominated debt, compared to the nine months ended September 30, 2016.
AISCAISC were $808 per ounce(1) for the nine months ended September 30, 2017, compared to $896 per ounce for the nine months ended September 30, 2016. The decrease in AISC was primarily due to the higher by-product production at Peñasquito and by-product prices ($93 per ounce), lower production costs ($61 per ounce), lower Corporate Administration costs ($18 per ounce), and lower sustaining capital ($4 per ounce) partially offset by lower gold sales ($95 per ounce).
(1) AISC per ounce is a non-GAAP financial performance measure with no standardized definition under IFRS. For further information and detailed reconciliations, please see pages 33-40 of this report.

Third Quarter Report – 2017 (in United States dollars, tabular amounts in millions, except where noted)
GOLDCORP | 15
FINANCIAL POSITION AND LIQUIDITY
The following table summarizes Goldcorp's cash flow activity:
Three Months EndedSeptember 30
Nine Months EndedSeptember 30
2017 2016 2017 2016Cash flow
From continuing operations provided by operating activities $ 315 $ 267 $ 700 $ 560From continuing operations used in investing activities (239) (111) (742) (436)From continuing operations (used) provided by financing activities (1) (144) 20 (110)
(Decrease) Increase in cash and cash equivalents 75 12 (22) 14Cash and cash equivalents, beginning of period 80 328 157 326Decrease in cash and cash equivalents reclassified as held for sale — — 20 —Cash and cash equivalents, end of period $ 155 $ 340 $ 155 $ 340
Cash flow provided by operating activities for the three and nine months ended September 30, 2017 increased by $48 million and $140 million, respectively, compared to the same periods in the prior year, primarily due to positive changes in non-cash working capital of $89 million and $106 million, respectively. The positive changes in non-cash working capital for both periods were primarily due to timing of payments. Changes in the Company's non-cash working capital can be significantly impacted by the timing of value added tax (“VAT”) refunds received from taxing authorities in the various jurisdictions in which the Company operates, including Mexico and Argentina, as the timing of refunds are dependent upon many factors. In June 2017, the Mexican government’s tax authority indicated that it had experienced an increase in VAT refund requests and as a result had commenced more in-depth assessments of the requests which resulted in the Company not receiving any VAT refunds from the Mexican government in the second quarter and receiving only $6 million in the third quarter of 2017 (second quarter of 2016 - $30 million; third quarter of 2016 - $28 million). Subsequent to September 30, 2017, the Company received VAT refund proceeds of $85 million and $27 million from the Mexican and Argentinian tax authorities, respectively.
The increase in cash flow used in investing activities for the three months ended September 30, 2017 compared to the three months ended September 30, 2016 was primarily due to increases in expenditures on mining interest as noted below, offset partially by the payment by Leagold to the Company of the $29 million promissory note which formed part of the proceeds on the sale of Los Filos.
The increase in cash flow used in investing activities for the nine months ended September 30, 2017 compared to the nine months ended September 30, 2016 was mainly due to $266 million, including transaction costs, paid to acquire Kinross' 25% interest in the Cerro Casale project, increases in expenditures on mining interests as noted below and the purchase of a 4% gold stream on the El Morro deposit, part of the Company's NuevaUnión joint venture, from New Gold Inc. for $65 million. These increases were offset partially by $271 million, net of transaction costs and cash disposed, received on the sale of Los Filos and Cerro Blanco. Further, the Company received a principal repayment from Pueblo Viejo of $43 million, which partially offset purchases of securities and interest paid in the period of $58 million.
Expenditures on mining interests (including deposits on mining interest expenditures) were as follows:
Three Months EndedSeptember 30
Nine Months EndedSeptember 30
2017 2016 2017 2016Peñasquito $ 151 $ 47 $ 304 $ 167Cerro Negro 20 24 58 75Red Lake 18 21 55 76Éléonore 25 23 83 62Porcupine 24 11 74 41Musselwhite 11 7 36 19Other 16 21 56 53Total $ 265 $ 154 $ 666 $ 493
The increase in expenditures on mining interests during the three and nine months ended September 30, 2017 compared to the same periods in the prior year was due primarily to increases in expansionary capital of $92 million and $186 million, respectively, related to the construction of the Pyrite Leach Project at Peñasquito, the development ramp at Borden and the Material Handling Project at Musselwhite.

Third Quarter Report – 2017 (in United States dollars, tabular amounts in millions, except where noted)
GOLDCORP | 16
The decrease of $143 million in cash used in financing activities during the three months ended September 30, 2017 as compared to the three months ended September 30, 2016 was primarily due to a $16 million draw on the credit facility in the three months ended September 30, 2017, compared to a repayment of $125 million in the three months ended September 30, 2016. The increase of $130 million in cash provided by financing activities during the nine months ended September 30, 2017 as compared to the same period in the prior year was primarily due to a $70 million draw on the credit facility in the nine months ended September 30, 2017 compared to a draw of nil in the same period in the prior year, combined with a $35 million decrease in dividends paid in the nine months ended September 30, 2017 compared to the same period in 2016. Effective April 1, 2016, the Company’s Board of Directors reduced the annual dividend to $0.08 per share and amended the dividend payment schedule such that dividends were paid quarterly commencing in June 2016.
On June 22, 2017, the Company completed the extension of its $3.0 billion credit facility term by one year to June 22, 2022. The unsecured, floating-rate facility bears interest at LIBOR plus 150 points when drawn, based on Goldcorp's current bond ratings, and is intended to be used for liquidity and general corporate purposes.
At September 30, 2017, the Company's adjusted net debt was $2.2 billion(1), consistent with the adjusted net debt balance at December 31, 2016. During the third quarter of 2017, the Pueblo Viejo joint venture repaid the remainder of the project finance facility. At September 30, 2017, excluding cash and cash equivalents held at associates of $156 million, the Company had $3.1 billion of available liquidity, comprised of $195 million of cash and cash equivalents and short term investments, and $2.9 billion available on its $3.0 billion credit facility.
The Company may from time to time seek to retire or repurchase its outstanding debt in open market purchases, privately negotiated transactions or otherwise. Such repurchases, if any, will depend upon prevailing market conditions, the Company's liquidity requirements, contractual restrictions and other factors. The amount of debt retired or repurchased may be material.
(1) The Company has presented the non-GAAP performance measures on an attributable (or Goldcorp's share) basis. Adjusted net debt is non-GAAP financial performance measure with no standardized definition under IFRS. For further information, please see pages 33-40 of this report.
Outstanding Share Data
As at October 25, 2017, there were 867 million common shares of the Company issued and outstanding and 7 million stock options outstanding, which are exercisable into common shares at exercise prices ranging between C$20.27 per share to C$33.48 per share, and 3 million restricted share units outstanding.
GUIDANCE (1)
2017 Guidance
Consistent with Goldcorp’s focus on profitable ounces and growing NAV per share, 2017 gold production is expected to be 2.5 million ounces (+/- 5%), in line with previous 2017 guidance.
Due to the focus on capital management discipline as part of the Company's $250 million sustainable annual efficiency program, the Company expects sustaining capital expenditures of $600 million for 2017 (+/- 5%), a reduction of $100 million compared to the Company's original guidance. Expansionary capital is also forecasted to be lower at $550 million (+/- 5%), a $50 million decrease compared to the Company's original guidance. In the second quarter of 2017, the Company's AISC guidance was reduced from $850 per ounce to $825 per ounce (+/- 5%). Total cash costs on a by-product basis are still expected to be $500 per ounce (+/- 5%) (2).
Company-wide exploration expenditures in 2017 are still expected to total $100 million, of which approximately 40% is expected to be expensed. Corporate administration expense is expected to be approximately $160 million, which includes share-based compensation of approximately $50 million. Depreciation and depletion expense is expected to be $425 per ounce. The effective tax rate on net income before share-based compensation is expected to be approximately 40%.
Five-Year Forecast
The Company’s five year outlook is focused on growing production by 20% to 3 million ounces, reducing AISC by 20% to $700 per ounce and growing gold reserves by 20% to 60 million ounces. Year-by-year gold production and AISC are forecast as follows:
Year Gold Production (oz) (3)
(+/-5%)AISC ($/oz) (2), (4)
(+/-5%)2017 2,500,000 $8252018 2,500,000 $8002019 2,700,000 $7502020 3,000,000 $7002021 3,000,000 $700

Third Quarter Report – 2017 (in United States dollars, tabular amounts in millions, except where noted)
GOLDCORP | 17
(1) Guidance projections (“Guidance”) are considered “forward-looking statements” and represent management’s good faith estimates or expectations of future production results as of the date hereof. Guidance is based upon certain assumptions, including, but not limited to, metal prices, oil prices, certain exchange rates and other assumptions. Such assumptions may prove to be incorrect and actual results may differ materially from those anticipated. Consequently, Guidance cannot be guaranteed. As such, investors are cautioned not to place undue reliance upon Guidance and forward-looking statements as there can be no assurance that the plans, assumptions or expectations upon which they are placed will occur. See the "Cautionary Statement Regarding Forward-Looking Statements".
(2) The Company has presented the non-GAAP performance measures on an attributable (or Goldcorp's share) basis. AISC per ounce and cash costs: by-product are non-GAAP financial performance measures with no standardized definition under IFRS. For further information, please see pages 33-40 of this report.
(3) The assumptions below were used to forecast total cash costs and gold equivalent ounces:
2017 - 2018 2019 - 2021Gold (oz) $1,250 $1,250Silver (oz) $19.00 $19.00Copper (lb) $2.25 $2.25Zinc (lb) $1.00 $0.90Lead (lb) $0.89 $0.80Foreign exchange (respectively to the US$) Canadian dollar $1.30 $1.30 Mexican peso 19.00 16.25
(4) The Company’s projected AISC are not based on GAAP total production cash costs, which forms the basis of the Company’s cash costs: by-product. The projected range of AISC is anticipated to be adjusted to include sustaining capital expenditures, corporate administrative expense, mine-site exploration and evaluation costs and reclamation cost accretion and amortization, and exclude the effects of expansionary capital, non-sustaining expenditures, tax payments, dividends and financing costs. Projected GAAP total production cash costs for the full year would require inclusion of the projected impact of future included and excluded items, including items that are not currently determinable, but may be significant, such as sustaining capital expenditures, reclamation cost accretion and amortization and tax payments. Due to the uncertainty of the likelihood, amount and timing of any such items, the Company does not have information available to provide a quantitative reconciliation of projected AISC to a total production cash costs projection.
OPERATIONAL REVIEW
The Company’s principal producing mining properties are comprised of the Peñasquito mine in Mexico; the Cerro Negro mine in Argentina; the Pueblo Viejo mine (40.0% interest) in the Dominican Republic and the Red Lake, Éléonore, Porcupine, and Musselwhite mines in Canada.
Operating results of operating segments are reviewed by the Company's chief operating decision maker ("CODM") to make decisions about resources to be allocated to the segments and to assess their performance. The Company considers each individual mine site as an operating segment for financial reporting purposes except as noted below.
Following the Company's acquisition and divestitures and the closure of the Marlin mine during the three months ended June 30, 2017, the Company reassessed its segments for financial reporting purposes. The Company concluded that Marlin and Los Filos were no longer operating segments and are included in Other; they were previously included in the Other mines operating segment. The Company's 37.5% interest in Alumbrera, which was previously reported as Other associate, and the Company's interest in Leagold, are also presented in Other, because their financial results do not meet the quantitative threshold required for segment disclosure purposes. Prior periods have been re-presented to reflect the current presentation.
The Company’s 100% interests in the Cochenour and Borden projects in Canada are included in the Red Lake and Porcupine reportable operating segments, respectively. The Company's 50% interests in the NuevaUnión and the Cerro Casale/Caspiche projects in Chile, and 100% interest in the Coffee project in the Yukon, are included in Other.
The Company’s principal product is gold bullion which is sold primarily in the London spot market. Concentrate produced at Peñasquito and Alumbrera, containing both gold and by-product metals, is sold to third party smelters and traders.
Third Quarter Report – 2017 (in United States dollars, tabular amounts in millions, except where noted)
GOLDCORP | 18
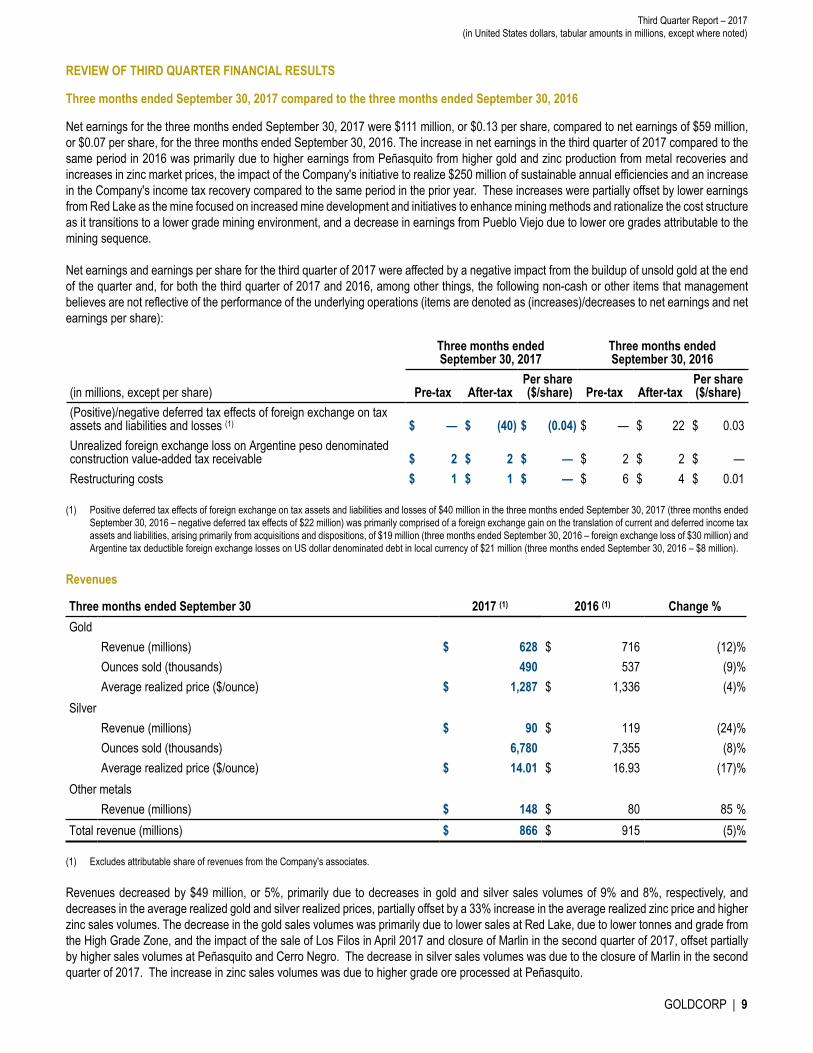
Segmented Financial and Operating Highlights
Three months endedSeptember 30 Revenue
($ millions)
Goldproduced
(000's of ounces)
Goldsold
(000's of ounces)
Total cashcosts: by-
product($/oz) (1), (4)
AISC($/oz) (3), (4)
Earnings (loss) from operations
($ millions) Peñasquito 2017 395 133 133 (168) 288 118
2016 289 121 100 423 777 22Cerro Negro 2017 166 115 118 510 712 15
2016 147 96 99 450 651 26Red Lake 2017 49 43 38 981 1,417 (6)
2016 111 84 82 516 775 34Éléonore 2017 95 77 74 802 1,067 —
2016 87 68 66 876 970 (4)Porcupine 2017 89 75 70 758 978 (4)
2016 85 64 64 758 947 17Musselwhite 2017 72 58 57 587 674 25
2016 79 59 58 626 753 26Other mines (2) 2017 — — — — — —
2016 117 73 68 816 983 2Other (3) 2017 — — — — 78 (24)
2016 — — — — 75 (6)Total before associates andjoint venture 2017 866 501 490 451 835 124
2016 915 565 537 609 917 117Pueblo Viejo (4) 2017 128 101 95 452 612 44
2016 175 126 127 376 454 61Other mines (2) 2017 42 31 21 1,361 1,611 (20)
2016 61 24 22 237 330 21Attributable segment total (4) 2017 1,036 633 606 483 827 148
2016 1,151 715 686 554 812 199
Third Quarter Report – 2017 (in United States dollars, tabular amounts in millions, except where noted)
GOLDCORP | 19
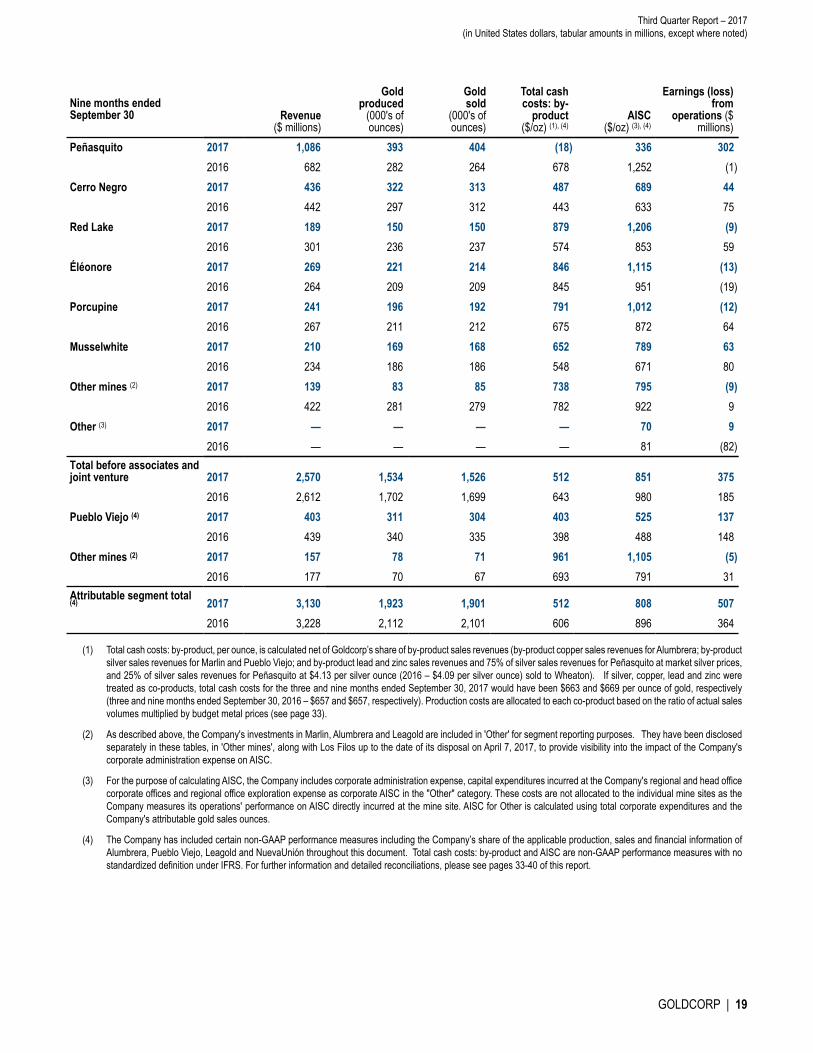
Nine months endedSeptember 30 Revenue
($ millions)
Goldproduced
(000's of ounces)
Goldsold
(000's of ounces)
Total cashcosts: by-
product($/oz) (1), (4)
AISC($/oz) (3), (4)
Earnings (loss) from
operations ($ millions)
Peñasquito 2017 1,086 393 404 (18) 336 3022016 682 282 264 678 1,252 (1)
Cerro Negro 2017 436 322 313 487 689 442016 442 297 312 443 633 75
Red Lake 2017 189 150 150 879 1,206 (9)2016 301 236 237 574 853 59
Éléonore 2017 269 221 214 846 1,115 (13)2016 264 209 209 845 951 (19)
Porcupine 2017 241 196 192 791 1,012 (12)2016 267 211 212 675 872 64
Musselwhite 2017 210 169 168 652 789 632016 234 186 186 548 671 80
Other mines (2) 2017 139 83 85 738 795 (9)2016 422 281 279 782 922 9
Other (3) 2017 — — — — 70 92016 — — — — 81 (82)
Total before associates andjoint venture 2017 2,570 1,534 1,526 512 851 375
2016 2,612 1,702 1,699 643 980 185Pueblo Viejo (4) 2017 403 311 304 403 525 137
2016 439 340 335 398 488 148Other mines (2) 2017 157 78 71 961 1,105 (5)
2016 177 70 67 693 791 31Attributable segment total (4) 2017 3,130 1,923 1,901 512 808 507
2016 3,228 2,112 2,101 606 896 364
(1) Total cash costs: by-product, per ounce, is calculated net of Goldcorp’s share of by-product sales revenues (by-product copper sales revenues for Alumbrera; by-product silver sales revenues for Marlin and Pueblo Viejo; and by-product lead and zinc sales revenues and 75% of silver sales revenues for Peñasquito at market silver prices, and 25% of silver sales revenues for Peñasquito at $4.13 per silver ounce (2016 – $4.09 per silver ounce) sold to Wheaton). If silver, copper, lead and zinc were treated as co-products, total cash costs for the three and nine months ended September 30, 2017 would have been $663 and $669 per ounce of gold, respectively (three and nine months ended September 30, 2016 – $657 and $657, respectively). Production costs are allocated to each co-product based on the ratio of actual sales volumes multiplied by budget metal prices (see page 33).
(2) As described above, the Company's investments in Marlin, Alumbrera and Leagold are included in 'Other' for segment reporting purposes. They have been disclosed separately in these tables, in 'Other mines', along with Los Filos up to the date of its disposal on April 7, 2017, to provide visibility into the impact of the Company's corporate administration expense on AISC.
(3) For the purpose of calculating AISC, the Company includes corporate administration expense, capital expenditures incurred at the Company's regional and head office corporate offices and regional office exploration expense as corporate AISC in the "Other" category. These costs are not allocated to the individual mine sites as the Company measures its operations' performance on AISC directly incurred at the mine site. AISC for Other is calculated using total corporate expenditures and the Company's attributable gold sales ounces.
(4) The Company has included certain non-GAAP performance measures including the Company’s share of the applicable production, sales and financial information of Alumbrera, Pueblo Viejo, Leagold and NuevaUnión throughout this document. Total cash costs: by-product and AISC are non-GAAP performance measures with no standardized definition under IFRS. For further information and detailed reconciliations, please see pages 33-40 of this report.

Third Quarter Report – 2017 (in United States dollars, tabular amounts in millions, except where noted)
GOLDCORP | 20
OPERATIONAL REVIEW
Peñasquito, Mexico (100%-owned)
Three months ended September 30 Nine months ended September 30Operating Data 2017 2016 Change 2017 2016 ChangeTonnes of ore milled (thousands) 9,251 9,029 2 % 27,501 24,869 11 %Mill head grade
Gold grade (grams/tonne) 0.71 0.69 3 % 0.73 0.61 20 %Silver grade (grams/tonne) 26.31 25.36 4 % 23.18 23.35 (1)%Lead grade 0.26% 0.24% 8 % 0.23% 0.22% 5 %Zinc grade 0.69% 0.56% 23 % 0.63% 0.53% 19 %
Mill Recovery RateGold recovery 70% 63% 11 % 67% 61% 10 %Silver recovery 84% 80% 5 % 82% 78% 5 %Lead recovery 77% 76% 1 % 75% 69% 9 %Zinc recovery 82% 79% 4 % 81% 76% 7 %
Payable Metal ProducedGold (thousands of ounces) 133 121 10 % 393 282 39 %Silver (thousands of ounces) 5,837 5,242 11 % 16,004 13,073 22 %Lead (thousands of pounds) 38,300 33,700 14 % 96,800 79,800 21 %Zinc (thousands of pounds) 98,400 75,200 31 % 263,200 184,600 43 %Gold equivalent (thousands of ounces) (1) 317 292 9 % 888 703 26 %
Payable Metal SoldGold (thousands of ounces) 133 100 33 % 404 264 53 %Silver (thousands of ounces) 5,910 5,242 13 % 16,411 12,554 31 %Lead (thousands of pounds) 36,200 32,900 10 % 94,800 76,400 24 %Zinc (thousands of pounds) 92,400 73,000 27 % 266,600 189,300 41 %
Total Cash Costs: By-product (per ounce) $ (168) $ 423 (140)% $ (18) $ 678 (103)%Total Cash Costs: Co-product (per ounce) $ 664 $ 849 (22)% $ 645 $ 876 (26)%AISC (per ounce) $ 288 $ 777 (63)% $ 336 $ 1,252 (73)%Financial Data (in millions)Revenues (2) $ 395 $ 289 37 % $ 1,086 $ 682 59 %Production costs $ 198 $ 197 1 % $ 564 $ 516 9 %Depreciation and depletion $ 77 $ 70 10 % $ 216 $ 165 31 %Other $ 2 $ — n/a $ 4 $ 2 100 %Earnings from operations $ 118 $ 22 436 % $ 302 $ (1) n/aExpenditures on mining interests (cash basis) $ 152 $ 49 210 % $ 308 $ 171 80 %– Sustaining $ 58 $ 34 71 % $ 135 $ 146 (8 )%– Expansionary $ 94 $ 15 527 % $ 173 $ 25 592 %
(1) Gold equivalent ounces are calculated using the following assumptions: $1,250 per ounce of gold; by-product metal prices of $19.00 per ounce of silver; $0.90 per pound of zinc; and $0.80 per pound of lead (2016 – $1,100; $16.50; $0.95; and $0.90 respectively). By-product metals are converted to gold equivalent ounces by multiplying by-product metal production with the associated by-product metal price and dividing it by the gold price.
(2) Includes 25% of silver ounces sold to Wheaton at $4.13 per ounce (2016 – $4.09 ounce). The remaining 75% of silver ounces are sold at market rates.

Third Quarter Report – 2017 (in United States dollars, tabular amounts in millions, except where noted)
GOLDCORP | 21
Operating and Financial HighlightsGold production for the three and nine months ended September 30, 2017 was higher primarily due to higher metal recoveries and for the nine month period, higher tonnes milled and higher grade. The improved results have been driven by improvements at Peñasquito's mill as a result of opportunities identified to achieve sustainable efficiencies including improved equipment reliability and higher float cell recoveries which resulted in higher recoveries for all metals processed. The grade was higher than expected in the year to date partially as a result of positive grade reconciliation of approximately 10% to 20% in the higher grade areas of Phase 5D, as experienced in the past for higher grade areas of the mine. The nine month period ended September 30, 2016 also included a prolonged period of planned and unplanned maintenance. The mined grade is expected to decline in the fourth quarter of 2017 until 2019 when the Phase 6 stripping program exposes higher grade ore in the Peñasco pit. Offsetting the lower grade in the fourth quarter of 2017 is the expected increase in throughput as a result of the improved mill efficiencies. Pre-stripping of the Chile Colorado pit is ahead of schedule and will contribute to mill feed starting in 2018.
Earnings from operations increased substantially in the three and nine months ended September 30, 2017 compared to the same periods in the prior year due to 37% and 50% higher revenues, respectively, associated with selling the higher gold and by-product production and higher zinc prices of 33% and 39% for the three and nine month periods, partially offset for the nine month period by higher production costs as the nine months ending September 30, 2016 included an extended maintenance period.
AISC was substantially lower for the three and nine months ended September 30, 2017 due to higher gold and by-product production and higher realized zinc prices. This was partially offset by higher planned sustaining capital in the three month period relating to the tailings dam raise and the timing of other capital projects.
Expansionary capital relates to the Pyrite Leach Project and Chile Colorado pre-stripping (see the Project Pipeline section below).

Third Quarter Report – 2017 (in United States dollars, tabular amounts in millions, except where noted)
GOLDCORP | 22
Cerro Negro, Argentina (100%-owned)
Three months ended September 30 Nine months ended September 30Operating Data 2017 2016 Change 2017 2016 ChangeTonnes of ore milled (thousands) 260 178 46 % 767 661 16 %Mill Gold grade (grams/tonne) 14.32 17.01 (16)% 13.47 14.33 (6)%Mill Silver grade (grams/tonne) 123.3 163.5 (25)% 116.8 137.0 (15)%Gold recovery rate 96% 95% 1 % 96% 95% 1 %Silver recovery rate 83% 83% — % 86% 87% (1)%Gold Produced (thousands of ounces) 115 96 20 % 322 297 8 %Silver Produced (thousands of ounces) 836 805 4 % 2,425 2,609 (7)%Gold equivalent ounces produced (thousands of ounces)(1) 128 107 20 % 359 336 7 %Gold Sold (thousands of ounces) 118 99 19 % 313 312 — %Silver Sold (thousands of ounces) 870 800 9 % 2,360 2,768 (15)%Total Cash Costs: By-product (per ounce) $ 510 $ 450 13 % $ 487 $ 443 10 %Total Cash Costs: Co-product (per ounce) $ 568 $ 533 7 % $ 550 $ 522 5 %AISC (per ounce) $ 712 $ 651 9 % $ 689 $ 633 9 %Financial Data (in millions) Revenues $ 166 $ 147 13 % $ 436 $ 442 (1)%Production costs $ 75 $ 60 25 % $ 194 $ 185 5 %Depreciation and depletion $ 72 $ 59 22 % $ 190 $ 172 10 %Other $ 4 $ 2 100 % $ 8 $ 10 (20)%Earnings from operations $ 15 $ 26 (42)% $ 44 $ 75 (41)%Expenditures on mining interests (cash basis) $ 20 $ 24 (17)% $ 58 $ 75 (23)%– Sustaining $ 16 $ 18 (11 )% $ 50 $ 53 (6 )%– Expansionary $ 4 $ 6 (33 )% $ 8 $ 22 (64 )%
(1) Gold equivalent ounces are calculated using the following assumptions: $1,250 per ounce of gold and a by-product metal price of $19.00 per ounce of silver (2016 – $1,100 and $16.50, respectively). By-product metals are converted to gold equivalent ounces by multiplying by-product metal production with the associated by-product metal price and dividing it by the gold price.
Operating and Financial HighlightsGold production for the three and nine months ended September 30, 2017 was higher due to higher mined tonnes, partially offset by lower grade due to mine sequencing. Tonnes mined increased at Cerro Negro as operations continue to improve and the mine finished the quarter at a steady production rate of 3,000 tonnes per day. The mine has achieved steadily increasing productivity from the workforce and improvements in planning and execution. Ongoing development at Mariana Norte is expected to provide first ore from stopes in the second half of 2018 while development of the Emilia vein commenced in the third quarter of 2017, on plan, in order to supplement declining production from Eureka in 2019. The production ramp-up to 4,000 tonnes per day is expected to be achieved during the second half of 2018.
Earnings from operations for the three and nine months ended September 30, 2017 were lower as a result of higher depreciation and depletion due to higher tonnes milled and higher production costs. Production costs for the three and nine months ended September 30, 2017, net of an export subsidy of $11 million the third quarter of 2016 which has since been eliminated, were essentially unchanged as reductions in the cost structure and higher productivity offset the approximate 25% annualized inflation in Argentina.
AISC for the three and nine months ended September 30, 2017 were higher due to higher production costs and for the nine months ended September 30, 2017, due to lower silver sales.

Third Quarter Report – 2017 (in United States dollars, tabular amounts in millions, except where noted)
GOLDCORP | 23
Pueblo Viejo, Dominican Republic (40%-owned)
(tabular amounts below represent Goldcorp's proportionate 40% share)
Three months ended September30
Nine months ended September 30Operating Data 2017 2016 Change 2017 2016 ChangeTonnes of ore milled (thousands) 712 729 (2)% 2,279 2,192 4 %Mill head grade (grams/tonne) 4.77 5.79 (18)% 4.60 5.36 (14)%Recovery rate 93% 93% — % 93% 90% 3 %Gold Produced (thousands of ounces) 101 126 (20)% 311 340 (9)%Gold Sold (thousands of ounces) 95 127 (25)% 304 335 (9)%Total Cash Costs: By-product (per ounce) $ 452 $ 376 20 % $ 403 $ 398 1 %Total Cash Costs: Co-product (per ounce) $ 492 $ 418 18 % $ 445 $ 431 3 %AISC (per ounce) $ 612 $ 454 35 % $ 525 $ 488 8 %Financial Data (in millions) (1)
Revenues $ 128 $ 175 (27)% $ 403 $ 439 (8)%Production costs $ 49 $ 56 (13)% $ 144 $ 150 (4)%Depreciation and depletion $ 9 $ 12 (25)% $ 29 $ 32 (9)%Other $ — $ (1) (100)% $ — $ (1) (100)%Earnings from operations $ 70 $ 108 (35)% $ 230 $ 258 (11)%Expenditures on mining interests (cash basis) $ 15 $ 9 67 % $ 34 $ 28 21 %– Sustaining $ 15 $ 9 67 % $ 34 $ 28 21 %– Expansionary $ — $ — n/a $ — $ — n/a
(1) The Company’s 40% interest in Pueblo Viejo is classified as an investment in associate and is accounted for using the equity method with the Company’s share of net earnings and net assets separately disclosed in the Consolidated Statements of Earnings and Consolidated Balance Sheets, respectively. The financial data disclosed in the table represents the financial data of Pueblo Viejo on a proportionate rather than equity basis. For the three and nine months ended September 30, 2017, the Company's equity earnings from Pueblo Viejo were $ 27 million and $94 million, respectively (three and nine months ended September 30, 2016 – equity earnings of $47 million and $109 million, respectively).
Operating and Financial Highlights
Gold production for the three and nine months ended September 30, 2017 was lower primarily due to lower grades and partially offset for the nine month period by higher gold recovery. Ore mined increased in comparison with the three and nine months ended September 30, 2016 primarily due to the commencement of a new phase in the Moore pit which allowed for higher fleet efficiency. The higher gold recovery in the nine months period ended September 30, 2017 was a result of processing ore with lower organic carbon content compared to the three and nine months ended September 30, 2016. The decrease in head grade was attributable to the mining sequence with higher grade ore expected in the fourth quarter of 2017.
Earnings from operations in the three and nine months ended September 30, 2017 were lower and AISC were higher primarily due to lower gold sales, partially offset by lower production costs due to fewer planned maintenance shutdowns in the current year combined with higher equipment rental costs in the prior year periods as a result of the oxygen plant motor failure. These lower costs were partially offset by higher fuel costs. AISC were also higher due to higher sustaining capital as a result of spending related to the tailings facilities and maintenance projects.

Third Quarter Report – 2017 (in United States dollars, tabular amounts in millions, except where noted)
GOLDCORP | 24
Red Lake, Canada (100%-owned)
Three months ended September 30 Nine months ended September 30Operating Data 2017 2016 Change 2017 2016 ChangeTonnes of ore milled (thousands) 143 172 (17)% 403 476 (15)%Mill head grade (grams/tonne) 11.25 17.12 (34)% 12.64 16.79 (25)%Recovery rate 93% 97% (4)% 94% 96% (2)%Gold Produced (thousands of ounces) 43 84 (49)% 150 236 (36)%Gold Sold (thousands of ounces) 38 82 (54)% 150 237 (37)%Total Cash Costs: By-product (per ounce) $ 981 $ 516 90 % $ 879 $ 574 53 %AISC (per ounce) $ 1,417 $ 775 83 % $ 1,206 $ 853 41 %Financial Data (in millions)Revenues $ 49 $ 111 (56)% $ 189 $ 301 (37)%Production costs $ 37 $ 42 (12)% $ 132 $ 136 (3)%Depreciation and depletion $ 18 $ 31 (42)% $ 62 $ 90 (31)%Other $ — $ 4 (100)% $ 4 $ 16 (75)%Earnings (loss) from operations $ (6) $ 34 (118)% $ (9) $ 59 (115)%Expenditures on mining interests (cash basis) $ 18 $ 21 (14)% $ 55 $ 76 (28)%– Sustaining $ 16 $ 18 (11 )% $ 46 $ 56 (18 )%– Expansionary $ 2 $ 3 (33 )% $ 9 $ 20 (55 )%
Operating and Financial Highlights
Gold production for the three and nine months ended September 30, 2017 was lower due to lower tonnes and lower grade. Red Lake's short-term decline in performance reflected a focus on initiatives expected to deliver long-term benefits including a significant cost and infrastructure rationalization program, the acceleration of underground development and the transition to predominately bulk method mining. During the third quarter of 2017, underground development of 40 meters per day was achieved, a 20% increase over the prior year. This is expected to liberate more ore in future periods. With the transition away from the depleting high grade zone and higher mined ore tonnages, the Red Lake mill has been temporarily re-commissioned to supplement the Campbell mill during the fourth quarter of 2017. The Red Lake mill provides operational flexibility to accommodate higher ore tonnages from time to time.
Red Lake had a loss from from operations for the three and nine months ended September 30, 2017 due to the lower revenues on lower gold sales, partially offset by lower depreciation and depletion associated with the lower gold production.
AISC for the three and nine months ended September 30, 2017 were higher due to lower gold sales while production costs remained relatively unchanged. Higher AISC production costs per ounce were partially offset by lower sustaining capital.
Expansionary capital relates to planning and study work required for mining in the upper portion of Cochenour, which published an initial reserve estimate this quarter and has been integrated into the Red Lake mine plan (see the Project Pipeline section below).

Third Quarter Report – 2017 (in United States dollars, tabular amounts in millions, except where noted)
GOLDCORP | 25
Éléonore, Canada (100%-owned)
Three months ended September30
Nine months ended September 30Operating Data 2017 2016 Change 2017 2016 ChangeTonnes of ore milled (thousands) 442 458 (3)% 1,353 1,289 5 %Mill head grade (grams/tonne) 5.85 5.22 12 % 5.45 5.48 (1)%Recovery rate 92% 91% 1 % 91% 90% 1 %Gold Produced (thousands of ounces) 77 68 13 % 221 209 6 %Gold Sold (thousands of ounces) 74 66 12 % 214 209 2 %Total Cash Costs: By-product (per ounce) $ 802 $ 876 (8)% $ 846 $ 845 — %AISC (per ounce) $ 1,067 $ 970 10 % $ 1,115 $ 951 17 %Financial Data (in millions)Revenues $ 95 $ 87 9 % $ 269 $ 264 2 %Production costs $ 59 $ 58 2 % $ 181 $ 177 2 %Depreciation and depletion $ 33 $ 34 (3)% $ 97 $ 107 (9)%Other $ 3 $ (1) n/a $ 4 $ (1) n/aEarnings (loss) from operations $ — $ (4) n/a $ (13) $ (19) 32 %Expenditures on mining interests (cash basis) $ 26 $ 23 13 % $ 84 $ 62 35 %– Sustaining $ 18 $ 5 260 % $ 54 $ 20 170 %– Expansionary $ 8 $ 18 (56 )% $ 30 $ 42 (29 )%
Operating and Financial HighlightsGold production for the three months ended September 30, 2017 was higher due to an increase in gold grade as a result of planned mine sequencing. Gold production for the nine months ended September 30, 2017 was higher due to higher tonnes milled. At Éléonore, as planned, tonnes mined for the three and nine months ended September 30, 2017 are consistent with the prior year. In order to maximize sustainable production, the critical focus continues to be on accelerating development in order to open up new mining fronts, increase capacity for mining tonnes on Horizon Five and increasing flexibility in the mine. The mine finished the third quarter of 2017 at a steady production rate of 5,600 tonnes per day. The mine continues on pace to achieve optimum production rates by the second half of 2018.
Earnings from operations in the three and nine months ended September 30, 2017 were higher than the same periods in the prior year as higher revenue from higher gold production was partially offset by higher production costs as a result of the impacts of a strengthening Canadian dollar against the US dollar.
AISC for the three and nine months ended September 30, 2017 were higher due to an increase in sustaining capital expenditures as a result of an increase in development work and expenditures on the tailings cell and expansion of the waste pad, all of which were planned for the third quarter of 2017.
Expansionary capital expenditures continue to decrease with the completion of the majority of the infrastructure required to support the designed throughput.

Third Quarter Report – 2017 (in United States dollars, tabular amounts in millions, except where noted)
GOLDCORP | 26
Porcupine, Canada (100%-owned)
Three months ended September 30 Nine months ended September 30Operating Data 2017 2016 Change 2017 2016 ChangeTonnes of ore milled (thousands) 881 876 1 % 2,335 2,683 (13)%Mill head grade (grams/tonne) 2.83 2.41 17 % 2.81 2.60 8 %Recovery rate 92% 92% — % 92% 92% — %Gold Produced (thousands of ounces) 75 64 17 % 196 211 (7)%Gold Sold (thousands of ounces) 70 64 9 % 192 212 (9)%Total Cash Costs: By-product (per ounce) $ 758 $ 758 — % $ 791 $ 675 17 %AISC (per ounce) $ 978 $ 947 3 % $ 1,012 $ 872 16 %Financial Data (in millions)Revenues $ 89 $ 85 5 % $ 241 $ 267 (10)%Production costs $ 54 $ 48 13 % $ 155 $ 143 8 %Depreciation and depletion $ 32 $ 21 52 % $ 86 $ 56 54 %Other $ 7 $ (1) n/a $ 12 $ 4 200 %Earnings (loss) from operations $ (4) $ 17 (124)% $ (12) $ 64 (119)%Expenditures on mining interests (cash basis) $ 24 $ 11 118 % $ 74 $ 41 80 %– Sustaining $ 12 $ 9 33 % $ 33 $ 31 6 %– Expansionary $ 12 $ 3 300 % $ 41 $ 10 310 %
Operating and Financial HighlightsGold production for the three months ended September 30, 2017 was higher due to the investment in additional development at Hoyle Pond which increased the mined tonnes from Hoyle by over 50% year over year, and positively impacted the average milled grade. The investment in higher development rates is enabling higher long-term sustainable mining rates at Hoyle Pond underground, as was experienced in September 2017. Gold production was comparatively lower for the nine months ended September 30, 2017 due only to the completion of processing of surface stockpiles in the first quarter of 2016.
Earnings from operations in the three and nine months ended September 30, 2017 were lower due to higher production costs as a result of higher expensed development costs, the impact of a strengthening Canadian dollar against the US dollar and higher depreciation and depletion, partially offset for the three month period by higher production. Depreciation and depletion increased as a result of incremental depletion from the Hoyle Deep winze which completed construction in 2016.
AISC for the three and nine months ended September 30, 2017 were higher due to higher production costs and higher sustaining capital, partially offset for the three month period by higher production.
Expansionary capital relates to the development and construction activities at the Borden project (see the Project Pipeline section below).

Third Quarter Report – 2017 (in United States dollars, tabular amounts in millions, except where noted)
GOLDCORP | 27
Musselwhite, Canada (100%-owned)
Three months ended September 30 Nine months ended September 30Operating Data 2017 2016 Change 2017 2016 ChangeTonnes of ore milled (thousands) 331 267 24 % 912 840 9 %Average mill head grade (grams/tonne) 5.68 7.12 (20)% 5.95 7.19 (17)%Average recovery rate 97% 96% 1 % 96% 96% — %Gold Produced (thousands of ounces) 58 59 (2)% 169 186 (9)%Gold Sold (thousands of ounces) 57 58 (2)% 168 186 (10)%Total Cash Costs: By-product (per ounce) $ 587 $ 626 (6)% $ 652 $ 548 19 %AISC (per ounce) $ 674 $ 753 (10)% $ 789 $ 671 18 %Financial Data (in millions)Revenues $ 72 $ 79 (9)% $ 210 $ 234 (10)%Production costs $ 33 $ 36 (8)% $ 109 $ 102 7 %Depreciation and depletion $ 11 $ 15 (27)% $ 31 $ 47 (34)%Other $ 3 $ 2 50 % $ 7 $ 5 40 %Earnings from operations $ 25 $ 26 (4)% $ 63 $ 80 (21)%Expenditures on mining interests (cash basis) $ 11 $ 7 57 % $ 36 $ 19 89 %– Sustaining $ 1 $ 5 (80 )% $ 15 $ 17 (12 )%– Expansionary $ 10 $ 2 400 % $ 21 $ 2 950 %
Operating and Financial HighlightsGold production for the three month period ended September 30, 2017 was essentially unchanged due to planned lower grade offset by higher tonnes mined. Gold production for the nine month period ended September 30, 2017 was lower due to lower grade, partially offset by higher tonnes mined. Lower grades in the first three quarters of 2017 were the result of planned sequencing in the mine and higher than expected dilution in the first quarter of 2017 from larger stopes. In the second quarter of 2017, Musselwhite implemented revised stope designs and a review process to reduce dilution which successfully decreased dilution by 12% by the third quarter of 2017, in line with long term expectations. Planned sequencing is expected to provide higher grade from the mine in the fourth quarter of 2017 compared to the first three quarters of 2017.
Earnings from operations were essentially unchanged for three month period ended September 31, 2017 and, for the nine month period ended September 30, 2017 were lower as a result of lower ounces sold and higher production costs due to the impact of a strengthening Canadian dollar against the US dollar, partially offset by lower depletion and depreciation charges.
AISC were lower for the three month period ended September 30, 2017 primarily due to lower production costs and lower sustaining capital. AISC were higher for nine months period ended September 30, 2017 primarily due to lower gold production and higher production costs.
Expansionary capital expenditures relate to the Materials Handling Project (see the Project Pipeline section below).

Third Quarter Report – 2017 (in United States dollars, tabular amounts in millions, except where noted)
GOLDCORP | 28
PROJECT PIPELINEThe Company has numerous projects underway and the current anticipated milestones for 2017 through 2021 are outlined below:
Expenditures relating to projects for the three and nine months ended September 30, 2017 and 2016 were as follows (in millions):
Three Months EndedSeptember 30
Nine Months EndedSeptember 30
2017 2016 2017 2016Peñasquito – Pyrite Leach $ 78 $ 15 $ 155 $ 21Peñasquito – Chile Colorado 14 — 14 —Musselwhite – Materials Handling 10 1 21 2Porcupine – Borden 12 3 41 10Coffee 9 7 18 7Red Lake – Cochenour 2 3 9 20Red Lake – HG Young — 1 1 7Porcupine – Century 4 — 8 —NuevaUnión (50%) 8 — 22 7Eleonore (1) 8 18 30 42Cerro Negro 4 6 8 22Other 3 3 5 4TOTAL $ 152 $ 57 $ 332 $ 142
(1) Eleonore's 2017 expansionary capital relates primarily to the water treatment plant, which was commissioned in the third quarter of 2017.
Of the $152 million and $332 million of project expenditures for the three and nine months ended September 30, 2017 (2016 - $57 million and $142 million for the three and nine months ended September 30, 2016), $148 million and $321 million ($47 million and $126 million for the three and nine months ended September 30, 2016) are included in expenditures on mining interests as expansionary capital. HG Young and certain Coffee expenditures have been expensed as exploration, and Century costs have been expensed as non-sustaining project costs.

Third Quarter Report – 2017 (in United States dollars, tabular amounts in millions, except where noted)
GOLDCORP | 29
Peñasquito: Pyrite Leach Project
At Peñasquito, the Pyrite Leach Project ("PLP") is 40% complete and expected to commence commissioning in the fourth quarter of 2018, three months ahead of schedule. PLP is expected to recover approximately 40% of the gold and 48% of the silver currently reporting to the tailings, and is expected to add production of approximately 1 million ounces of gold and 44 million ounces of silver over the current life of the mine.
Musselwhite: Materials Handling Project
At Musselwhite, the Materials Handling Project is advancing as planned and has now achieved 48% completion with detailed engineering mostly completed. The $90 million investment, which is expected to provide an after-tax IRR of 25% (based on current reserves only) through the construction of an underground winze and associated infrastructure, is expected to result in a significant reduction in truck haulage and is expected to increase production by 20% while reducing operating costs by approximately 10%. The project is expect to reduce reliance on high-cost truck haulage by significantly reducing uphill truck haulage between the winze and underground crushers leading to improved energy efficiency, reduced ventilation requirements, reduced mining costs, enhanced production schedule and the potential to extend mine life through exploration success.
During the third quarter of 2017, the Materials Handling Project achieved a key milestone transitioning from lateral development to the construction and build phase with the commencement of the raisebore in the upper level. All equipment has been engineered with full automation capabilities. Hoisting, crushing, rock breaking and chutes have the ability to operate from multiple locations including underground, surface and long distance tele-operation from Thunder Bay, Ontario. The current schedule will allow for increased efficiency, reduced ramp traffic and balanced power consumption. This will all be complimented by a threefold increase of ore storage capacity at different locations providing the operations flexibility while delivering continuous product to the mill.
Completion of the project remains on budget and on schedule and is expected in the first quarter of 2019.
Porcupine: Century Project
At Century, the base case pre-feasibility study was based on the following:
Century Project - Base Case Pre-feasibility StudyMine Life 14 yearsContained Gold Ounces 5,710,000Plant Size 50,000 t/dGold Grade (diluted) 0.87 g/tGold Recovery 88%Strip Ratio (waste to ore) 4.5:1Operating Costs (Mining, Process, G&A) US$17 to US$18/tonne processedInitial Capex(1) US$950 to US1,050 millionSustaining Capital and Tailings Expansion US$350 to US$400 million
(1) Includes 10% contingency
The base case pre-feasibility study is based on a total mineral reserve estimate of 5.7 million ounces of gold, including 1.0 million ounces of previously reported mineral reserves from the Pamour pit, which have been integrated into the proposed Century project. However, the study excludes approximately 1.0 million ounces of inferred mineral resources within the existing Dome reserve pit design, which the Company expects a portion to be converted following additional exploration drilling. Over the course of the next year, Goldcorp will conduct a series of trade-off studies to further optimize the project with a focus on evaluating the latest technologies to reduce project footprint and improve mining and processing efficiencies. Ore sorting technologies, co-mingling of tailings with waste rock (Eco-Tails) to reduce water use, conveying of rock from the pit, electrical and/or autonomous equipment, and optimized process plant design will all be studied as part of this process. The optimized pre-feasibility is expected to be completed in the second half of 2018. Goldcorp considers Century to be a project with low execution risk in a proven mining district.
Porcupine: Borden Project
At Borden, construction of surface infrastructure to support the development of the exploration ramp is now complete. The current infrastructure can support the mine once in production. Ramp development has now reached 385 meters and is on schedule. The bulk sample is expected

Third Quarter Report – 2017 (in United States dollars, tabular amounts in millions, except where noted)
GOLDCORP | 30
to commence in October 2018. Bulk sample extraction and critical mine production development will be conducted concurrently. The mine is expected to begin commercial production, as planned, in the second half of 2019.
Borden is made up of a 1,000 km2 land package that provides significant exploration opportunity in a new mining district. With an exploration budget of $6 million for 2017, the first half of 2017 was focused on core re-logging and drilling to increase the structural understanding of the deposit. Regionally, till surveying and prospecting covered significant areas of the surrounding land package in order to generate additional exploration targets.
Borden will also benefit from a low-cost mill at the Porcupine complex, located in Timmins. To reduce site footprint and simplify permitting, ore is planned to be transported from Borden to the Porcupine process facility.
The project has demonstrated a strong focus on inclusion and consultation with local communities to underpin the viability, sustainability and profitability of the mine. First Nations negotiations are in progress and Goldcorp expects to be in a position to sign a collaboration agreement prior to the start of construction.
Coffee Project
Since the acquisition of the Coffee Project (100% owned, Canada) in July 2016, the Company has accelerated and expanded the scope of exploration in this developing new gold camp. Goldcorp acquired the project not only for the high-grade Coffee gold deposit, but also to participate in the development of the growing mineral wealth within the highly prospective Tintina Gold Province which is endowed with approximately 150 million ounces of gold across Yukon and Alaska.
Goldcorp has entered into an agreement with JDS Energy & Mining Inc. ("JDS") for the development and early operations of the Coffee Project. Under this agreement, JDS is responsible for the engineering, procurement, construction, commissioning, and, at Goldcorp's option, may operate the mine for two years of operations. The JDS team is familiar with the Coffee Project through their previous involvement in the development of the Kaminak Feasibility Study published in early 2016.
The Company continues to experience progress with its First Nation partners in the Yukon. Tr'ondek Hwech'in, whose Traditional Territory covers 100% of the project footprint, and Goldcorp have completed negotiations on the financial terms of an agreement. The Goldcorp team is continuing to work with the Tr'ondek Hwech'in to finalize a broader benefits agreement that will result in the creation of sustainable value for both parties as the Coffee Project is developed.
Red Lake: Cochenour Project
The Company completed the pre-feasibility study which resulted in an initial reserve of 0.15 million ounces. As the understanding of the Cochenour deposit continues to advance, it is expected that further resources will be converted into reserves to ensure a constant production level in future years. Cochenour has 0.3 million ounces of measured and indicated mineral resources and 2.0 million ounces of inferred mineral resources. The new mine plan at Cochenour is expected to contribute 5,000-10,000 ounces in 2018 and approximately 30,000 to 50,000 ounces annually to the overall production at the Red Lake camp once in production which is expected in 2019. The production profile remains based on a starter mine approach, and Cochenour continues to have potential through expansion at depth and laterally to further increase annual production.
The study also concluded the preferred backfill system was pastefill and the preferred material handling system is the high speed tram which will move the ore across to the existing shaft at Campbell. The material handling system is expected to be completed by the end of 2018.
Red Lake: HG Young Project
During the third quarter of 2017, the Company completed a study evaluating the trade-off for the preferred method for accessing the deposit, updated the geological interpretation with additional drilling data, and evaluated the project economics to determine whether further investment was warranted. The study concluded that the preferred access has shifted from a surface decline to underground access from the Campbell mine on either the 14 level and/or 21 level based primarily on the favorable drilling results obtained between 11 and 21 levels and the potential for continuity at lower levels as the deposit is open at depth. The updated mineral resource estimate provided 0.2 million ounces of measured and indicated mineral resources and 0.3 million ounces of inferred mineral resources.
Based on the positive overall results of the study, the Company will invest in a further study with the goal to double the current resource by 2019 primarily through infill drilling and extending the deposit at depth. Expenditures will primarily be related to development on the 14 and 21 levels to provide drilling platforms and additional drilling. In the event of a positive outcome of the further study, the Company would commence the development of the preferred material handling system in order to facilitate production.

Third Quarter Report – 2017 (in United States dollars, tabular amounts in millions, except where noted)
GOLDCORP | 31
Cerro Casale / Caspiche Project
Cerro Casale/Caspiche (50% owned, Chile) has appointed a project director, Kim Hackney, to start building a dedicated project team based in Santiago, Chile. Kim is an engineer with more than 35 years of project development experience, most recently with Goldcorp and Newmont Mining Corporation, where he was an integral part of the project/construction teams at Peñasquito, Akyem, Boddington, Yanacocha and Batu Hijau.
The initial stage of the joint operation has been focused on planning a scope of work and budget to progress the project through 24 months of planned studies with key focus areas including:
• Geological review and resource models update for both Cerro Casale and Caspiche;• Drilling campaign including infill, definition, geotechnical and metallurgical drilling for Cerro Casale and Caspiche;• District exploration program underway to review prospects and identify targets including the satellite oxide pits at Cerro Casale for
the upcoming drilling season;• Trade-off engineering studies;• Understanding the application of Goldcorp's patented Concentrate Enrichment Process to optimize concentrate quality; and• Engaging various stakeholders and initiating a permitting strategy for the combined operation.
The lessons learned as part of the prefeasibility study at NuevaUnión will be beneficial as the joint operation advances through the pre-feasibility stage. The joint operation will control more than 20,000 hectares of mineral properties, which contain a combined gold mineral reserve and resource estimate of 23.2 million ounces of proven and probable reserves, 26.7 million ounces of measured and indicated resources, and 7.8 million ounces of inferred resources and a combined copper mineral reserve and resource estimate of 5.8 billion pounds of proven and probable reserves, 13 billion pounds of measured and indicated resources, and 2.7 billion pounds of inferred resources (100% basis).
NuevaUnión Project
In collaboration with our joint venture partner, Teck Resources Limited, the pre-feasibility study is being finalized on NuevaUnión (50% owned, Chile) and is expected to be completed early in the first quarter of 2018. There has been considerable progress made to date to combine the Relincho and El Morro projects and consolidate infrastructure, which is expected to result in a more robust combined project with a reduced environmental footprint, substantially reduced capital expenditures and an optimized plan including innovative technologies such as an autonomous mining fleet, low energy consumption process plant design, and hybrid conveyance system. While the pre-feasibility study remains to be finalized, the many trade-off studies completed as part of the process have resulted in incorporating several value enhancing opportunities increasing confidence in the overall business case.
Goldcorp envisions a staged and internally financed capital program that would allow a large portion of the capital required to develop and construct future phases to be funded largely from internal cash flows.
2017 RESERVES AND RESOURCES UPDATE
Goldcorp’s proven and probable gold mineral reserves as of June 30, 2017 totaled 53.5 million ounces compared to 42.3 million ounces as of June 30, 2016, an increase of 26%. The addition of 11.2 million ounces of gold mineral reserves during the period includes 5.6 million ounces converted from successful exploration and mine design optimization, primarily driven by the inaugural gold mineral reserve estimate of 4.7 million ounces at Porcupine’s Century Project. The balance of the increase in mineral reserves comes as result of the acquisition of 50% of Cerro Casale which resulted in the addition of 8.4 million ounces, net of non-core divestments including Los Filos and Camino Rojo(1). Goldcorp reported 2.8 million ounces of attributable gold production during the twelve month period ended June 30, 2017, which after excluding the effects of Los Filos and Marlin, resulted in 2.8 million ounces of depletion.
Third Quarter Report – 2017 (in United States dollars, tabular amounts in millions, except where noted)
GOLDCORP | 32
Measured and Indicated gold mineral resources remained relatively unchanged after giving effect to the impact of the successful conversion of indicated mineral resources into proven and probable mineral reserves at Century, the addition of 50% of Caspiche and Cerro Casale, which added 13.3 million ounces, mainly offset by the sales of Los Filos and Camino Rojo(1), which together removed 17.5 million ounces. The sale of Cerro Blanco and San Nicolas also contributed to a reduction in measured and indicated mineral resources of 1.1 million ounces. Inferred mineral resources decreased to 20.0 million ounces from 22.5 million ounces, primarily as a result of the sale of Los Filos.
Mineral reserve estimates were based on a gold price of $1,200 per ounce while mineral resource estimates were based on a gold price of $1,400 per ounce. Gold price assumptions were unchanged from last year’s estimates. Complete mineral reserve and mineral resource information, including tonnes and grades for all metals and details of the assumptions used in the calculations, can be found in the table and associated notes below and have been posted at www.goldcorp.com.
(1) The sale of Camino Rojo remains pending and subject to the satisfaction of customary conditions precedent. Goldcorp has removed Camino Rojo from its Mineral Reserve and Mineral Resource Estimates as of June 30, 2017. The sale is expected to close in the fourth quarter of 2017.

Third Quarter Report – 2017 (in United States dollars, tabular amounts in millions, except where noted)
GOLDCORP | 33
NON-GAAP FINANCIAL PERFORMANCE MEASURES
The Company has included certain non-GAAP performance measures throughout this document. These performance measures are employed by the Company to measure its operating and economic performance internally and to assist in business decision-making as well as providing key performance information to senior management. The Company believes that, in addition to conventional measures prepared in accordance with GAAP, certain investors and other stakeholders also use this information to evaluate the Company’s operating and financial performance; however, these non-GAAP performance measures do not have any standardized meaning. Accordingly, these performance measures are intended to provide additional information and should not be considered in isolation or as a substitute for measures of performance prepared in accordance with GAAP. The Company’s primary business is gold production and its future development and current operations focus are on maximizing returns from gold production, with other metal production being incidental to the gold production process. As a result, where applicable, the Company's non-GAAP performance measures are disclosed on a per gold ounce basis.
The Company calculates its non-GAAP performance measures on an attributable basis. Attributable performance measures include the Company’s mining operations and projects, and the Company’s share of Pueblo Viejo, Alumbrera, Leagold and NuevaUnión. The inclusion of NuevaUnión in the Company's non-GAAP performance measures only impacts the Company's adjusted operating cash flow metric at this time as it is a development stage project. The Company believes that disclosing certain performance measures on an attributable basis provides useful information about the Company’s operating and financial performance, and reflects the Company’s view of its core mining operations.
Non-GAAP Measure - Total Cash Costs: by-product
Total cash costs: by-product incorporate Goldcorp’s share of all production costs, including adjustments to inventory carrying values, adjusted for changes in estimates in reclamation and closure costs at the Company’s closed mines which are non-cash in nature, and include Goldcorp’s share of by-product silver, lead, zinc and copper credits, and treatment and refining charges included within revenue. Additionally, cash costs are adjusted for realized gains and losses arising on the Company’s commodity and foreign currency contracts which the Company enters into to mitigate its exposure to fluctuations in by-product metal prices, heating oil prices and foreign exchange rates, which may impact the Company’s operating costs.
In addition to conventional measures, the Company assesses this per ounce measure in a manner that isolates the impacts of gold production volumes, the by-product credits, and operating costs fluctuations such that the non-controllable and controllable variability is independently addressed. The Company uses total cash costs: by-product per gold ounce to monitor its operating performance internally, including operating cash costs, as well as in its assessment of potential development projects and acquisition targets. The Company believes this measure provides investors and analysts with useful information about the Company’s underlying cash costs of operations and the impact of by-product credits on the Company’s cost structure and is a relevant metric used to understand the Company’s operating profitability and ability to generate cash flow. When deriving the production costs associated with an ounce of gold, the Company includes by-product credits as the Company considers that the cost to produce the gold is reduced as a result of the by-product sales incidental to the gold production process, thereby allowing the Company’s management and other stakeholders to assess the net costs of gold production.
The Company reports total cash costs: by-product on a gold ounces sold basis. In the gold mining industry, this is a common performance measure but does not have any standardized meaning. The Company follows the recommendations of the Gold Institute Production Cost Standard. The Gold Institute, which ceased operations in 2002, was a non-regulatory body and represented a global group of producers of gold and gold products. The production cost standard developed by the Gold Institute remains the generally accepted standard of reporting cash costs of production by gold mining companies.
The Company also reports total cash costs: co-product as a secondary metric to provide further information to the Company's stakeholders. Total cash costs: co-product, per gold ounce, are calculated by allocating Goldcorp‘s share of production costs to each co-product based on the ratio of actual sales volumes multiplied by budget metal prices, as compared to realized sales prices. The Company uses budget prices to eliminate price volatility and improve co-product cash cost reporting comparability between periods. The budget metal prices used in the calculation of total cash costs: co-product were as follows:
2017 2016 2015Gold (per ounce) $ 1,250 $ 1,100 $ 1,200Silver (per ounce) $ 19 $ 15 $ 18Copper (per pound) $ 2.25 $ 2.53 $ 3.00Lead (per pound) $ 0.89 $ 0.80 $ 0.95Zinc (per pound) $ 1.00 $ 0.80 $ 1.00
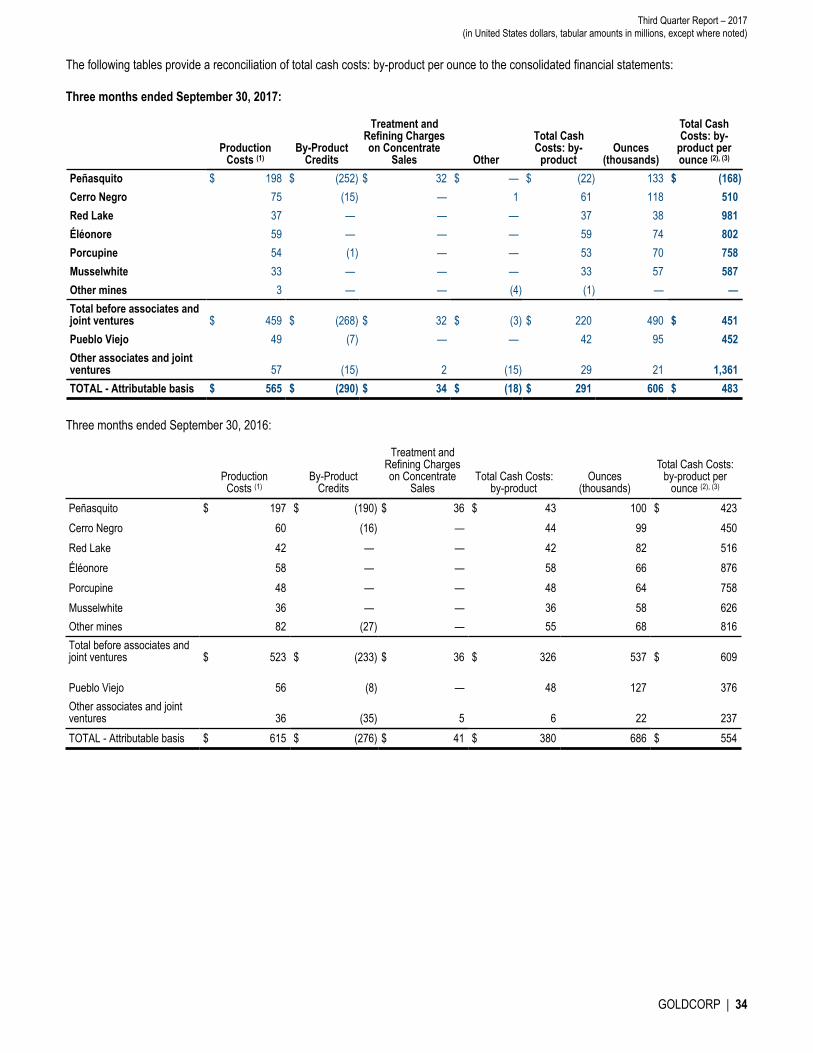
Third Quarter Report – 2017 (in United States dollars, tabular amounts in millions, except where noted)
GOLDCORP | 34
The following tables provide a reconciliation of total cash costs: by-product per ounce to the consolidated financial statements:
Three months ended September 30, 2017:
ProductionCosts (1)
By-ProductCredits
Treatment andRefining Chargeson Concentrate
Sales Other
Total CashCosts: by-
productOunces
(thousands)
Total Cash Costs: by-
product per ounce (2), (3)
Peñasquito $ 198 $ (252) $ 32 $ — $ (22) 133 $ (168)Cerro Negro 75 (15) — 1 61 118 510Red Lake 37 — — — 37 38 981Éléonore 59 — — — 59 74 802Porcupine 54 (1) — — 53 70 758Musselwhite 33 — — — 33 57 587Other mines 3 — — (4) (1) — —Total before associates andjoint ventures $ 459 $ (268) $ 32 $ (3) $ 220 490 $ 451Pueblo Viejo 49 (7) — — 42 95 452Other associates and jointventures 57 (15) 2 (15) 29 21 1,361TOTAL - Attributable basis $ 565 $ (290) $ 34 $ (18) $ 291 606 $ 483
Three months ended September 30, 2016:
ProductionCosts (1)
By-ProductCredits
Treatment andRefining Chargeson Concentrate
SalesTotal Cash Costs:
by-productOunces
(thousands)
Total Cash Costs: by-product per
ounce (2), (3)
Peñasquito $ 197 $ (190) $ 36 $ 43 100 $ 423Cerro Negro 60 (16) — 44 99 450Red Lake 42 — — 42 82 516Éléonore 58 — — 58 66 876Porcupine 48 — — 48 64 758Musselwhite 36 — — 36 58 626Other mines 82 (27) — 55 68 816Total before associates andjoint ventures $ 523 $ (233) $ 36 $ 326 537 $ 609
Pueblo Viejo 56 (8) — 48 127 376Other associates and jointventures 36 (35) 5 6 22 237TOTAL - Attributable basis $ 615 $ (276) $ 41 $ 380 686 $ 554

Third Quarter Report – 2017 (in United States dollars, tabular amounts in millions, except where noted)
GOLDCORP | 35
Nine months ended September 30, 2017:
ProductionCosts (1)
By-ProductCredits
Treatment andRefining Chargeson Concentrate
Sales Other
Total CashCosts: by-
productOunces
(thousands)
Total Cash Costs: by-
product per ounce (2), (3)
Peñasquito $ 564 $ (678) $ 107 $ — $ (7) 404 $ (18)Cerro Negro 194 (41) — — 153 313 487Red Lake 132 — — — 132 150 879Éléonore 181 — — — 181 214 846Porcupine 155 (1) — (2) 152 192 791Musselwhite 109 — — — 109 168 652Other mines 100 (35) — (3) 62 85 839Total before associates andjoint ventures $ 1,435 $ (755) $ 107 $ (5) $ 782 1,526 $ 512Pueblo Viejo 144 (22) — — 122 304 403Other associates and jointventures 149 (74) 8 (15) 68 71 961TOTAL - Attributable basis $ 1,728 $ (851) $ 115 $ (20) $ 972 1,901 $ 512
Nine months ended September 30, 2016:
ProductionCosts (1)
By-ProductCredits
Treatment andRefining Chargeson Concentrate
SalesTotal Cash Costs:
by-productOunces
(thousands)
Total Cash Costs: by-product per
ounce (2), (3)
Peñasquito $ 516 $ (424) $ 87 $ 179 264 $ 678Cerro Negro 185 (47) — 138 312 443Red Lake 136 — — 136 237 574Éléonore 177 — — 177 209 845Porcupine 143 — — 143 212 675Musselwhite 102 — — 102 186 548Other mines 291 (73) — 218 279 782Total before associates andjoint ventures $ 1,550 $ (544) $ 87 $ 1,093 1,699 $ 643Pueblo Viejo 150 (17) — 133 335 398Other associates and jointventures 134 (101) 14 47 67 693TOTAL - Attributable basis $ 1,834 $ (662) $ 101 $ 1,273 2,101 $ 606
(1) $19 million and $60 million in royalties are included in production costs for the three and nine months ended September 30, 2017, respectively (three and nine months ended September 30, 2016– $23 million and $49 million, respectively).
(2) Total cash costs: by-product per ounce may not calculate based on amounts presented in these tables due to rounding.
(3) If silver, lead, zinc and copper for Peñasquito, silver for Marlin, silver and copper for Pueblo Viejo, and copper for Alumbrera were treated as co-products, Goldcorp's share of total cash costs: co-product for the three and nine months ended September 30, 2017, would be $663 and $669 per ounce of gold, $8.97 and $9.01 per ounce of silver, $3.02 and $2.19 per pound of copper, $0.69 and $0.70 per pound of zinc, and $0.71 and $0.81 per pound of lead, respectively (three and nine months ended September 30, 2016 – $657 and $657 per ounce of gold, $10.93 and $10.83 per ounce of silver, $1.68 and $2.03 per pound of copper, $0.86 and $0.86 per pound of zinc, and $0.92 and $0.96 per pound of lead, respectively).
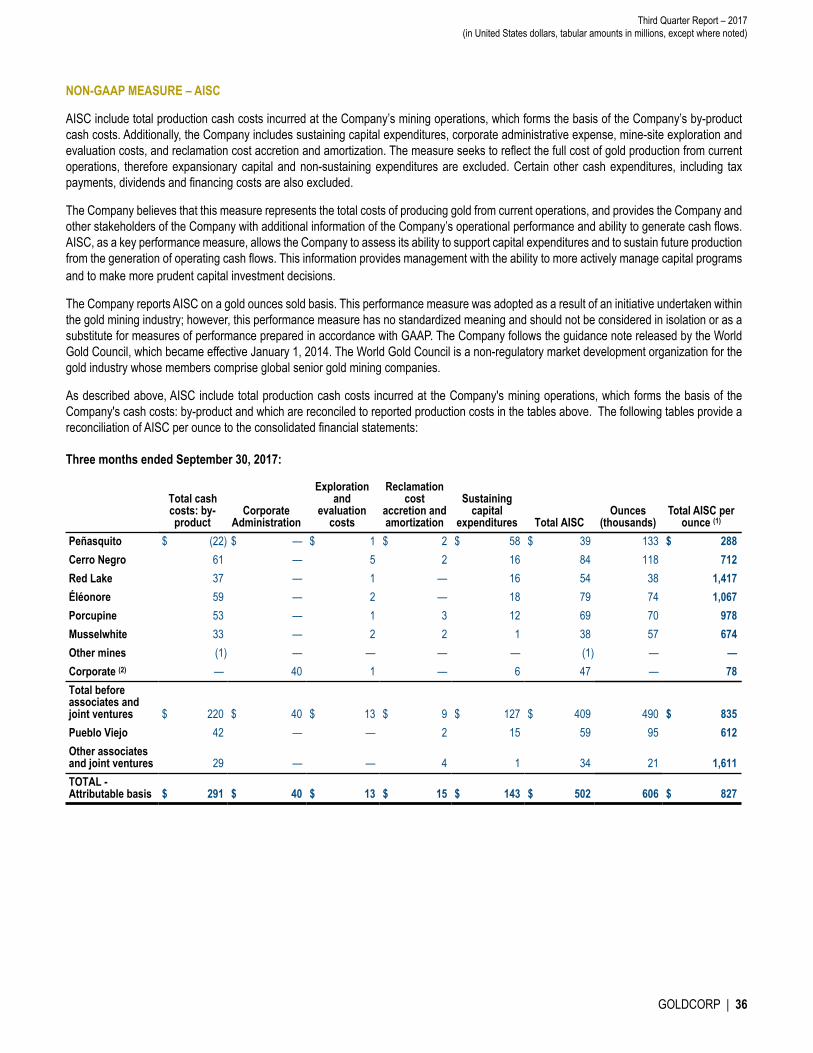
Third Quarter Report – 2017 (in United States dollars, tabular amounts in millions, except where noted)
GOLDCORP | 36
NON-GAAP MEASURE – AISC
AISC include total production cash costs incurred at the Company’s mining operations, which forms the basis of the Company’s by-product cash costs. Additionally, the Company includes sustaining capital expenditures, corporate administrative expense, mine-site exploration and evaluation costs, and reclamation cost accretion and amortization. The measure seeks to reflect the full cost of gold production from current operations, therefore expansionary capital and non-sustaining expenditures are excluded. Certain other cash expenditures, including tax payments, dividends and financing costs are also excluded.
The Company believes that this measure represents the total costs of producing gold from current operations, and provides the Company and other stakeholders of the Company with additional information of the Company’s operational performance and ability to generate cash flows. AISC, as a key performance measure, allows the Company to assess its ability to support capital expenditures and to sustain future production from the generation of operating cash flows. This information provides management with the ability to more actively manage capital programs and to make more prudent capital investment decisions.
The Company reports AISC on a gold ounces sold basis. This performance measure was adopted as a result of an initiative undertaken within the gold mining industry; however, this performance measure has no standardized meaning and should not be considered in isolation or as a substitute for measures of performance prepared in accordance with GAAP. The Company follows the guidance note released by the World Gold Council, which became effective January 1, 2014. The World Gold Council is a non-regulatory market development organization for the gold industry whose members comprise global senior gold mining companies.
As described above, AISC include total production cash costs incurred at the Company's mining operations, which forms the basis of the Company's cash costs: by-product and which are reconciled to reported production costs in the tables above. The following tables provide a reconciliation of AISC per ounce to the consolidated financial statements:
Three months ended September 30, 2017:
Total cashcosts: by-product
CorporateAdministration
Explorationand
evaluationcosts
Reclamationcost
accretion andamortization
Sustainingcapital
expenditures Total AISCOunces
(thousands)Total AISC per
ounce (1)
Peñasquito $ (22) $ — $ 1 $ 2 $ 58 $ 39 133 $ 288Cerro Negro 61 — 5 2 16 84 118 712Red Lake 37 — 1 — 16 54 38 1,417Éléonore 59 — 2 — 18 79 74 1,067Porcupine 53 — 1 3 12 69 70 978Musselwhite 33 — 2 2 1 38 57 674Other mines (1) — — — — (1) — —Corporate (2) — 40 1 — 6 47 — 78Total beforeassociates andjoint ventures $ 220 $ 40 $ 13 $ 9 $ 127 $ 409 490 $ 835Pueblo Viejo 42 — — 2 15 59 95 612Other associatesand joint ventures 29 — — 4 1 34 21 1,611TOTAL -Attributable basis $ 291 $ 40 $ 13 $ 15 $ 143 $ 502 606 $ 827

Third Quarter Report – 2017 (in United States dollars, tabular amounts in millions, except where noted)
GOLDCORP | 37
Three months ended September 30, 2016:
Total cashcosts: by-product
CorporateAdministration
Explorationand evaluation
costs
Reclamationcost accretion
andamortization
Sustainingcapital
expenditures Total AISCOunces
(thousands)Total AISC per
ounce (1)
Peñasquito $ 43 $ — $ 1 $ 1 $ 34 $ 79 100 $ 777Cerro Negro 44 — — 2 18 64 99 651Red Lake 42 — 3 1 18 64 82 775Éléonore 58 — — 1 5 64 66 970Porcupine 48 — 1 3 9 61 64 947Musselwhite 36 — 1 2 5 44 58 753Other mines 55 — 1 5 6 67 68 983Corporate (2) — 42 — — 8 50 — 75Total beforeassociates and jointventures $ 326 $ 42 $ 7 $ 15 $ 103 $ 493 537 $ 917Pueblo Viejo 48 — — 1 9 58 127 454Other associatesand joint ventures 6 — — 1 — 7 22 330TOTAL -Attributable basis $ 380 $ 42 $ 7 $ 17 $ 112 $ 558 686 $ 812
Nine months ended September 30, 2017:
Total cashcosts: by-product
CorporateAdministration
Explorationand
evaluationcosts
Reclamationcost
accretion andamortization
Sustainingcapital
expenditures Total AISCOunces
(thousands)Total AISC per
ounce (1)
Peñasquito $ (7) $ — $ 2 $ 6 $ 135 $ 136 404 $ 336Cerro Negro 153 — 7 6 50 216 313 689Red Lake 132 — 2 1 46 181 150 1,206Éléonore 181 — 3 1 54 239 214 1,115Porcupine 152 — 2 8 33 195 192 1,012Musselwhite 109 — 6 2 15 132 168 789Other mines 62 — 1 2 2 67 85 795Corporate (2) — 112 2 — 19 133 — 70Total beforeassociates andjoint ventures $ 782 $ 112 $ 25 $ 26 $ 354 $ 1,299 1,526 $ 851Pueblo Viejo 122 — — 4 34 160 304 525Other associatesand joint ventures 68 — — 9 1 78 71 1,105TOTAL -Attributable basis $ 972 $ 112 $ 25 $ 39 $ 389 $ 1,537 1,901 $ 808
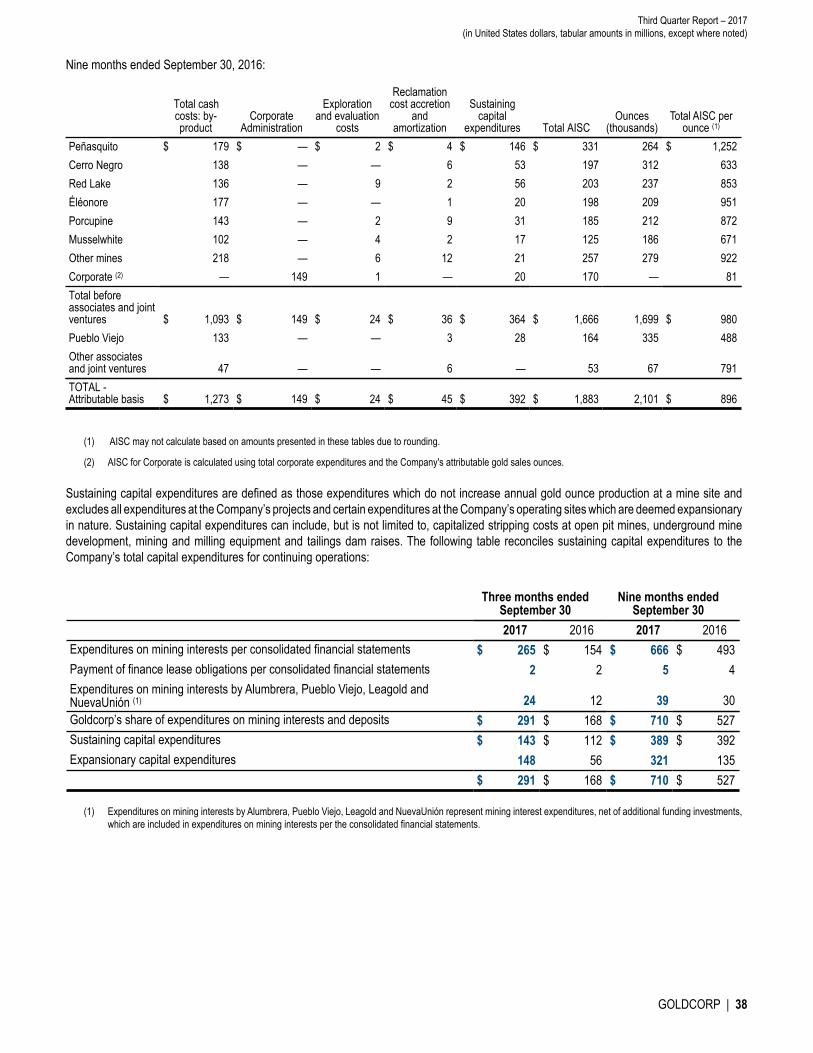
Third Quarter Report – 2017 (in United States dollars, tabular amounts in millions, except where noted)
GOLDCORP | 38
Nine months ended September 30, 2016:
Total cashcosts: by-product
CorporateAdministration
Explorationand evaluation
costs
Reclamationcost accretion
andamortization
Sustainingcapital
expenditures Total AISCOunces
(thousands)Total AISC per
ounce (1)
Peñasquito $ 179 $ — $ 2 $ 4 $ 146 $ 331 264 $ 1,252Cerro Negro 138 — — 6 53 197 312 633Red Lake 136 — 9 2 56 203 237 853Éléonore 177 — — 1 20 198 209 951Porcupine 143 — 2 9 31 185 212 872Musselwhite 102 — 4 2 17 125 186 671Other mines 218 — 6 12 21 257 279 922Corporate (2) — 149 1 — 20 170 — 81Total beforeassociates and jointventures $ 1,093 $ 149 $ 24 $ 36 $ 364 $ 1,666 1,699 $ 980Pueblo Viejo 133 — — 3 28 164 335 488Other associatesand joint ventures 47 — — 6 — 53 67 791TOTAL -Attributable basis $ 1,273 $ 149 $ 24 $ 45 $ 392 $ 1,883 2,101 $ 896
(1) AISC may not calculate based on amounts presented in these tables due to rounding.
(2) AISC for Corporate is calculated using total corporate expenditures and the Company's attributable gold sales ounces.
Sustaining capital expenditures are defined as those expenditures which do not increase annual gold ounce production at a mine site and excludes all expenditures at the Company’s projects and certain expenditures at the Company’s operating sites which are deemed expansionary in nature. Sustaining capital expenditures can include, but is not limited to, capitalized stripping costs at open pit mines, underground mine development, mining and milling equipment and tailings dam raises. The following table reconciles sustaining capital expenditures to the Company’s total capital expenditures for continuing operations:
Three months endedSeptember 30
Nine months endedSeptember 30
2017 2016 2017 2016Expenditures on mining interests per consolidated financial statements $ 265 $ 154 $ 666 $ 493Payment of finance lease obligations per consolidated financial statements 2 2 5 4Expenditures on mining interests by Alumbrera, Pueblo Viejo, Leagold and NuevaUnión (1) 24 12 39 30Goldcorp’s share of expenditures on mining interests and deposits $ 291 $ 168 $ 710 $ 527Sustaining capital expenditures $ 143 $ 112 $ 389 $ 392Expansionary capital expenditures 148 56 321 135 $ 291 $ 168 $ 710 $ 527
(1) Expenditures on mining interests by Alumbrera, Pueblo Viejo, Leagold and NuevaUnión represent mining interest expenditures, net of additional funding investments, which are included in expenditures on mining interests per the consolidated financial statements.

Third Quarter Report – 2017 (in United States dollars, tabular amounts in millions, except where noted)
GOLDCORP | 39
The following table provides a reconciliation of exploration, evaluation and project costs in the consolidated financial statements to exploration and evaluation costs included in the calculation of Goldcorp’s AISC:
Three months endedSeptember 30
Nine months endedSeptember 30
2017 2016 2017 2016Exploration, evaluation and project costs per the consolidated financial statements
$ 19 $ 7 $ 40 $ 24Project exploration costs — — (3) —Non-sustaining project costs (6) — (12) —Exploration, evaluation and project costs per AISC $ 13 $ 7 $ 25 $ 24
Non-GAAP Measure - Adjusted Operating Cash Flows
Adjusted operating cash flows comprises Goldcorp’s share of operating cash flows before working capital changes, calculated on an attributable basis to include the Company's share of Pueblo Viejo, Alumbrera, Leagold and NuevaUnión's operating cash flows before working capital changes. The Company believes that, in addition to conventional measures prepared in accordance with GAAP, the Company and certain investors use this information to evaluate the Company’s performance and ability to operate without reliance on additional external funding or use of available cash.
Prior to April 1, 2017, adjusted operating cash flows was presented on an attributable basis using operating cash flows as shown on the Company's statement of cash flows. In the second quarter of 2017, the Company revised its presentation of adjusted operating cash flows to present it on an attributable basis before working capital changes. The Company believes that this measure provides a better measure of the Company's performance of its core business operations as the Company can experience changes in working capital from one period to another which, at times, are not indicative of the performance of the Company’s business operations.
The following table provides a reconciliation of net cash provided by operating activities in the consolidated financial statements to Goldcorp’s share of adjusted operating cash flows:
Three months endedSeptember 30
Nine months endedSeptember 30
2017 2016 2017 2016Net cash provided by operating activities of continuing operations $ 315 $ 267 $ 700 $ 560Change in working capital (57) 32 43 149Adjusted operating cash flows provided by Pueblo Viejo, Alumbrera, Leagold andNuevaUnión 50 102 200 226Goldcorp’s share of adjusted operating cash flows $ 308 $ 401 $ 943 $ 935
Non-GAAP Measure - EBITDA and Adjusted EBITDA
Earnings before interest, taxes and depreciation and amortization ("EBITDA") is a non-GAAP financial measure which excludes the following items from net earnings:
• income tax expense;• finance costs;• finance income; and• depreciation and depletion.
The Company calculates EBITDA on an attributable basis ("Adjusted EBITDA") to include the Company's share of Pueblo Viejo, Alumbrera, Leagold and NuevaUnión's earnings before interest, taxes and depreciation and depletion. The Company believes that, in addition to conventional measures prepared in accordance with GAAP, the Company and certain investors use this information as an indicator of the Company's ability to generate liquidity by producing operating cash flow to fund working capital needs, service debt obligations and fund capital expenditures. EBITDA is also frequently used by investors and analysts for valuation purposes whereby EBITDA is multiplied by a factor or "EBITDA multiple" that is based on an observed or inferred relationship between EBITDA and market values to determine the approximate total enterprise value of a company.

Third Quarter Report – 2017 (in United States dollars, tabular amounts in millions, except where noted)
GOLDCORP | 40
EBITDA and Adjusted EBITDA are intended to provide additional information to investors and analysts and do not have any standardized definition under IFRS, and should not be considered in isolation or as a substitute for measures of performance prepared in accordance with IFRS. EBITDA and Adjusted EBITDA exclude the impact of cash costs of financing activities and taxes, and the effects of changes in operating working capital balances, and therefore are not necessarily indicative of operating profit or cash flow from operations as determined under IFRS. Other companies may calculate EBITDA and Adjusted EBITDA differently.
The following table provides a reconciliation of net earnings in the condensed consolidated financial statements to EBITDA and Adjusted EBITDA:
Three monthsended
September 30
Nine monthsended
September 30Three monthsended June 30
Three monthsended March 31
Three monthsended
December 312017 2016 2017 2016 2017 2016 2017 2016 2016 2015
Net earnings $ 111 $ 59 $ 416 $ 61 $ 135 $ (78) $ 170 $ 80 $ 101 $ (4,271)Income tax expense (recovery) (19) 30 (124) 22 (57) 32 (48) (40) 38 (840)Depreciation and depletion 250 267 735 770 239 232 246 271 254 421Finance income (9) (12) (29) (38) (10) (14) (10) (12) (11) (10)Finance costs 31 34 104 103 37 35 36 34 34 31EBITDA $ 364 $ 378 $ 1,102 $ 918 $ 344 $ 207 $ 394 $ 333 $ 416 $ (4,669)Share of net earnings related toassociates and joint venture (27) (47) (128) (111) (41) (28) (60) (36) (60) 24Associates and joint ventureEBITDA 59 146 260 332 114 87 87 99 163 50Adjusted EBITDA $ 396 $ 477 $ 1,234 $ 1,139 $ 417 $ 266 $ 421 $ 396 $ 519 $ (4,595)
Non-GAAP Measure - Adjusted Net Debt
Adjusted net debt is comprised of Goldcorp’s short-term and long-term debt less cash and cash equivalents and short term investments, calculated on an attributable basis to include the Company's share of Pueblo Viejo, Alumbrera, Leagold and NuevaUnión's net debt. The Company believes that, in addition to conventional measures prepared in accordance with GAAP, the Company and certain investors use this information to evaluate the Company’s financial position and its ability to take on new debt in the future to expand operations, purchase new assets or withstand adverse economic conditions.
The following table provides a reconciliation of short and long-term debt to adjusted net debt:
September 302017
December 312016
Current portion of long-term debt $ 499 $ —Long-term debt 2,083 2,510Cash and cash equivalents (155) (157)Short term investments (40) (43)Net Debt 2,387 2,310Debt of associates and joint venture — 160Cash and short term investments of associates and joint venture (156) (254)Adjusted Net Debt $ 2,231 $ 2,216
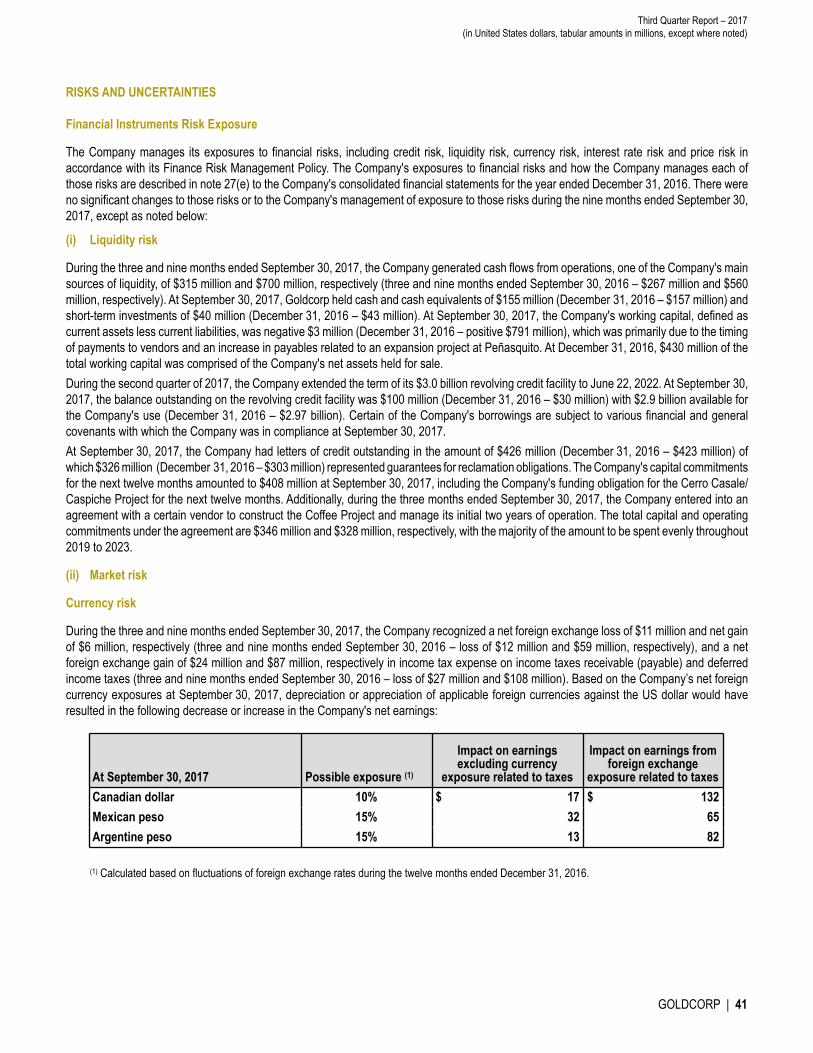
Third Quarter Report – 2017 (in United States dollars, tabular amounts in millions, except where noted)
GOLDCORP | 41
RISKS AND UNCERTAINTIES
Financial Instruments Risk Exposure
The Company manages its exposures to financial risks, including credit risk, liquidity risk, currency risk, interest rate risk and price risk in accordance with its Finance Risk Management Policy. The Company's exposures to financial risks and how the Company manages each of those risks are described in note 27(e) to the Company's consolidated financial statements for the year ended December 31, 2016. There were no significant changes to those risks or to the Company's management of exposure to those risks during the nine months ended September 30, 2017, except as noted below:
(i) Liquidity risk
During the three and nine months ended September 30, 2017, the Company generated cash flows from operations, one of the Company's main sources of liquidity, of $315 million and $700 million, respectively (three and nine months ended September 30, 2016 – $267 million and $560 million, respectively). At September 30, 2017, Goldcorp held cash and cash equivalents of $155 million (December 31, 2016 – $157 million) and short-term investments of $40 million (December 31, 2016 – $43 million). At September 30, 2017, the Company's working capital, defined as current assets less current liabilities, was negative $3 million (December 31, 2016 – positive $791 million), which was primarily due to the timing of payments to vendors and an increase in payables related to an expansion project at Peñasquito. At December 31, 2016, $430 million of the total working capital was comprised of the Company's net assets held for sale. During the second quarter of 2017, the Company extended the term of its $3.0 billion revolving credit facility to June 22, 2022. At September 30, 2017, the balance outstanding on the revolving credit facility was $100 million (December 31, 2016 – $30 million) with $2.9 billion available for the Company's use (December 31, 2016 – $2.97 billion). Certain of the Company's borrowings are subject to various financial and general covenants with which the Company was in compliance at September 30, 2017.At September 30, 2017, the Company had letters of credit outstanding in the amount of $426 million (December 31, 2016 – $423 million) of which $326 million (December 31, 2016 – $303 million) represented guarantees for reclamation obligations. The Company's capital commitments for the next twelve months amounted to $408 million at September 30, 2017, including the Company's funding obligation for the Cerro Casale/Caspiche Project for the next twelve months. Additionally, during the three months ended September 30, 2017, the Company entered into an agreement with a certain vendor to construct the Coffee Project and manage its initial two years of operation. The total capital and operating commitments under the agreement are $346 million and $328 million, respectively, with the majority of the amount to be spent evenly throughout 2019 to 2023.
(ii) Market risk
Currency risk
During the three and nine months ended September 30, 2017, the Company recognized a net foreign exchange loss of $11 million and net gain of $6 million, respectively (three and nine months ended September 30, 2016 – loss of $12 million and $59 million, respectively), and a net foreign exchange gain of $24 million and $87 million, respectively in income tax expense on income taxes receivable (payable) and deferred income taxes (three and nine months ended September 30, 2016 – loss of $27 million and $108 million). Based on the Company’s net foreign currency exposures at September 30, 2017, depreciation or appreciation of applicable foreign currencies against the US dollar would have resulted in the following decrease or increase in the Company's net earnings:
At September 30, 2017 Possible exposure (1)
Impact on earningsexcluding currency
exposure related to taxes
Impact on earnings fromforeign exchange
exposure related to taxesCanadian dollar 10% $ 17 $ 132Mexican peso 15% 32 65Argentine peso 15% 13 82
(1) Calculated based on fluctuations of foreign exchange rates during the twelve months ended December 31, 2016.

Third Quarter Report – 2017 (in United States dollars, tabular amounts in millions, except where noted)
GOLDCORP | 42
Other Risks and Uncertainties
This section describes the principal risk and uncertainties that could have an adverse effect on the Company's business and financial results.
Acquisitions and Integration
As part of the Company’s business strategy, it has sought and will continue to seek new mining and development opportunities in the mining industry. In pursuit of such opportunities, the Company may fail to select appropriate acquisition targets or negotiate acceptable arrangements, including arrangements to finance acquisitions or integrate the acquired businesses and their workforce into Goldcorp. Ultimately, any acquisition is accompanied by risks, which could include:
• a significant change in commodity prices after the Company has committed to complete the transaction and established the purchase price or exchange ratio;
• a material ore body could prove to be below expectations;
• difficulty in integrating and assimilating the operations and workforce of any acquired companies;
• realizing anticipated synergies and maximizing the financial and strategic position of the combined enterprise;
• maintaining uniform standards, policies and controls across the organization;
• disruption of the Company’s ongoing business and its relationships with employees, suppliers, contractors and other stakeholders as Goldcorp integrates the acquired business or assets;
• the acquired business or assets may have unknown liabilities that may be significant;
• delays because of regulatory approvals; and
• exposure to litigation (including actions commenced by shareholders) in connection with a transaction.
Any material issues that the Company encounters in connection with an acquisition could have a material adverse effect on its business, results of operations and financial position.
Commodity Prices
The majority of the Company's revenues are derived from the sale of gold and silver, and to a lesser extent, copper, lead and zinc. The price of the Company’s Common Shares, its financial results and exploration, and its development and mining activities in the future may be materially adversely affected by declines in the price of gold, silver, copper, lead and zinc. Gold, silver, copper, lead and zinc prices fluctuate widely and are affected by numerous factors beyond the Company’s control, such as the sale or purchase of metals by various central banks and financial institutions, interest rates, exchange rates, inflation or deflation, fluctuation in the value of the United States dollar and foreign currencies, global and regional supply and demand, and the political and economic conditions of major metals-producing and metals-consuming countries throughout the world. The prices of gold, silver, copper, lead and zinc fluctuate widely, and future price declines could cause continued development of, and commercial production from, our properties to be uneconomic. Depending on the price of gold, silver, copper, lead and zinc, cash flow from mining operations may not be sufficient and the Company could be forced to discontinue production at, may lose its interest in, or may be forced to sell, some of its properties. Future production from the Company’s mining properties is dependent on the price of gold, silver, copper, lead and zinc that are adequate to make these properties economically viable.
Estimates of Future Production
The Company prepares estimates and projections of its future production. Any such information is forward-looking and no assurance can be given that such estimates will be achieved. These estimates are based on existing mine plans and other assumptions that change from time to time, including the availability, accessibility, sufficiency and quality of ore, the Company’s costs of production, its ability to sustain and increase production levels, the sufficiency of its infrastructure, the performance of its workforce and equipment, the ability to maintain and obtain mining interests and permits and the Company’s compliance with existing and future laws and regulations. The Company’s actual production may vary from estimates for a variety of reasons, including: actual ore mined varying from estimates of grade, tonnage, dilution and metallurgical and other characteristics; short-term operating factors relating to the ore reserves, such as the need for sequential development of orebodies and the processing of new or different ore grades; revisions to mine plans; unusual or unexpected orebody formations; risks and hazards associated with mining; natural phenomena, such as inclement weather conditions, water availability, floods, and earthquakes; and unexpected labor shortages, strikes, local community opposition or blockades. Failure to achieve the estimated forecasts could have an adverse impact on the Company’s future cash flows, business, results of operations and financial condition.

Third Quarter Report – 2017 (in United States dollars, tabular amounts in millions, except where noted)
GOLDCORP | 43
Foreign Operations
The majority of the Company’s foreign operations are conducted in Mexico, Argentina, the Dominican Republic and Chile, and as such the Company’s operations are exposed to various levels of political, economic and other risks and uncertainties. These risks and uncertainties vary from country to country and include, but are not limited to, terrorism; hostage taking; military repression; expropriation; extreme fluctuations in currency exchange rates; high rates of inflation; labour unrest; the risks of war, civil unrest or protests; renegotiation or nullification of existing concessions, licenses, permits and contracts; ability of governments to unilaterally alter agreements; government imposed supply laws, including laws establishing, among other things, profit margins, production quotas, maximum and minimum price levels and the ability to confiscate merchandise in certain circumstances; surface land access issues; illegal mining; changes in taxation policies; restrictions on foreign exchange and repatriation; and changing political conditions, currency controls and governmental regulations that favour or require the awarding of contracts to local contractors or require foreign contractors to employ citizens of, or purchase supplies from, a particular jurisdiction.
In addition, adverse changes in mining or investment policies or shifts in political attitude in Mexico, Argentina, the Dominican Republic and Chile may adversely affect the Company’s operations or profitability. Operations may be affected in varying degrees by government regulations with respect to, but not limited to, restrictions on production, price controls, export controls, import restrictions, such as restrictions applicable to, among other things, equipment, services and supplies, currency remittance, income taxes, expropriation of property, foreign investment, maintenance of claims, environmental legislation, land use, surface land access, land claims of local people, water use and mine safety.
Failure to comply strictly with applicable laws, regulations and local practices relating to mineral right applications and tenure, environmental requirements, land and water use, could result in loss, reduction or expropriation of entitlements, or the imposition of additional local or foreign parties as joint venture partners with carried or other interests. The occurrence of these various factors and uncertainties related to the economic and political risks of operating in foreign jurisdictions cannot be accurately predicted and could have a material adverse effect on the Company’s operations or profitability.
Government Regulation
The Company’s mining, processing, development and mineral exploration activities are subject to various laws governing prospecting, development, production, taxes, labour standards and occupational health, mine safety, toxic substances, land use, water use, land claims of local people and other matters. No assurance can be given that new rules and regulations will not be enacted or that existing rules and regulations will not be applied in a manner which could limit or curtail production or development. Amendments to current laws and regulations governing operations and activities of mining and milling or more stringent implementation thereof could have a material adverse impact on the operations and financial position of the Company. Changes to laws regarding mining royalties or taxes, or other elements of a country’s fiscal regime, may also adversely affect the Company’s costs of operations and financial results.
In addition, governments continue to struggle with deficits and concerns over the effects of depressed economies, which has resulted in the mining and metals sector being targeted to raise revenue. Governments are continually assessing the fiscal terms of the economic rent for a mining company to exploit resources in their countries. Numerous countries, including, but not limited to, Argentina, Australia, Brazil, Chile, the Dominican Republic, Guatemala, Honduras, Mexico and Venezuela, have implemented changes to their respective mining regimes that reflect increased government control or participation in the mining sector, including changes of law affecting foreign ownership and take-overs, mandatory government participation, taxation and royalties, working conditions, rates of exchange, exchange control, exploration licensing, export duties, repatriation of income or return of capital, environmental protection, as well as requirements for local goods, supplies and employment or other benefits to be provided to local residents.
The occurrence of mining regime changes in both developed and developing countries adds uncertainties that cannot be accurately predicted and any future adverse changes in government policies or legislation in the jurisdictions in which the Company operates that affect foreign ownership, mineral exploration, development or mining activities, may affect our viability and profitability.
In December 2016, the State of Zacatecas in Mexico approved new purported environmental taxes that became effective January 1, 2017. Certain operations at the Company’s Peñasquito mine may be subject to these taxes. The Company is not able to estimate the amount of the taxes with sufficient reliability. The Company disputes the legality and constitutionality of the taxes and has filed legal claims against the taxes before the Mexican courts but cannot provide assurance on whether its claims will be successfully resolved.
Environmental Regulation
The Company’s operations are subject to environmental regulation in the various jurisdictions in which it operates. These regulations mandate, among other things, the maintenance of air and water quality standards and land reclamation. They also set out limitations on the generation, transportation, storage and disposal of solid and hazardous waste. Environmental legislation is evolving in a manner that will likely, in the future, require stricter standards and enforcement, increased fines and penalties for non-compliance, more stringent environmental assessments of proposed projects and a heightened degree of responsibility for companies and their officers, directors and employees. Continuing issues with tailings dam failures at other companies operations may increase the likelihood that these stricter standards and enforcement mechanisms will be implemented in the future. We can provide no assurance that future changes in environmental regulation will not adversely affect our results of operations. Failure to comply with these laws, regulations and permitting requirements may result in enforcement actions, including

Third Quarter Report – 2017 (in United States dollars, tabular amounts in millions, except where noted)
GOLDCORP | 44
orders issued by regulatory or judicial authorities causing operations to cease or be curtailed, and may include corrective measures requiring capital expenditures, installation of additional equipment, or remedial actions. Parties engaged in mining operations or in the exploration or development of mineral properties may also be required to compensate those suffering loss or damage due to the mining activities and may have civil or criminal fines or penalties imposed for violations of applicable laws or regulations. The occurrence of any environmental violation or enforcement action may have an adverse impact on the Company’s reputation and could adversely affect its results of operations. In addition, production at certain of the Company’s mines involves the use of sodium cyanide or other reagents and exposes rock material that could cause toxicity to the environment if released or not properly managed. Should sodium cyanide, other reagents, or contact water be improperly managed, leak or otherwise be discharged from the containment system, the Company may become subject to liability for clean-up work that may not be insured. In the event of any discharges of pollutants into the ground water and the environment, we may become subject to liability for hazards that we may not be insured against.
Mineral Reserve and Mineral Resources Estimates
There are numerous uncertainties inherent in estimating Ore/Mineral Reserves and Mineral Resources, including many factors beyond the Company’s control. Such estimation is a subjective process, and the accuracy of any Ore/Mineral Reserve or Mineral Resource estimate is a function of the quantity and quality of available data and of the assumptions made and judgments used in engineering and geological interpretation. Short-term operating factors relating to the Ore/Mineral Reserves, such as the need for orderly development of the ore bodies or the processing of new or different ore grades, may cause the mining operation to be unprofitable in any particular accounting period.
From time to time the Company may undertake a review of its operations with the goal of optimizing operational performance, right sizing its business model and improving the return on the Company’s investment, including: drilling programs to better define the geological complexity of an ore body and the overall geological model of the deposit; optimization of the life of mine geotechnical stoping sequence to minimize geotechnical stresses, improve mining dilution, productivity and employee safety; enhancing the reliability of the mineral resource model and classification parameters to more accurately reflect the geological complexity observed to date in some zones of the deposit; optimization of a variety of mining methods and stope geometries to provide greater versatility to productive mining; and rationalizing the direct operating, administration and capital costs to right size all components of the operation to an optimized life of mine strategy.
Fluctuation in gold, silver, copper, zinc or lead prices, results of drilling, metallurgical testing and production and the evaluation of mine plans subsequent to the date of any estimate may require revision of such estimate. The volume and grade of reserves mined and processed and recovery rates may not be the same as currently anticipated.
Any material reductions in estimates of Ore/Mineral Reserves and Mineral Resources, including as a result of the processes outlined above, or of our ability to extract these Ore/Mineral Reserves, could have a material adverse effect on the Company’s results of operations and financial condition.
New Mining Operations
The Company’s recently opened mines that commenced commercial production in 2015, the Cerro Negro Mine and the Éléonore Mine are subject to risks associated with new mine development, including delays in existing operations, a change in the Mineral Reserve or Mineral Resource estimates arising from enhanced understanding of the geological complexity of an ore body and the overall geological model of the deposit and unanticipated costs. The Company is continually reviewing such operations with the goal of optimizing operational performance, right sizing its business model and improving the return on the Company’s investment, including: drilling programs to better define the geological complexity of an ore body and the overall geological model of the deposit; optimization of the life of mine geotechnical stoping sequence to minimize geotechnical stresses, improve mining dilution, productivity and employee safety; enhancing the reliability of the mineral resource model and classification parameters to more accurately reflect the geological complexity observed to date in some zones of the deposit; optimization of a variety of mining methods and stope geometries to provide greater versatility to productive mining; and rationalizing the direct operating, administration and capital costs to right size all components of the operation to an optimized life of mine strategy.
The Company’s production forecasts are based on full production being achieved at all of our mines based on the current mine plan, including the mines that commenced commercial production in 2015, and the Company’s ability to achieve and maintain full production rates at these mines is subject to a number of risks and uncertainties. As a result of continuous reviews, there may be reclassification of Mineral Reserves and Mineral Resources, which could adversely affect the Company’s results of operations. Production from these mines may be lower than anticipated if the anticipated full production rate cannot be achieved which could adversely affect the Company’s cash flows and results of operations.
Other Risks
For further information regarding the Company’s operational risks, please refer to the section entitled “Description of the Business - Risk Factors” in the Company's most recent Annual Information Form available on SEDAR at www.sedar.com and on EDGAR at www.sec.gov.

Third Quarter Report – 2017 (in United States dollars, tabular amounts in millions, except where noted)
GOLDCORP | 45
ACCOUNTING MATTERS
Basis of Preparation
The Company’s unaudited condensed interim consolidated financial statements for the three and nine months ended September 30, 2017 have been prepared in accordance with International Accounting Standard 34 – Interim Financial Reporting ("IAS 34") as issued by the IASB. Accordingly, certain disclosures included in annual financial statements prepared in accordance with IFRS as issued by the IASB have been condensed or omitted. The Company's unaudited condensed interim consolidated financial statements should be read in conjunction with the Company’s audited consolidated financial statements for the year ended December 31, 2016.
The accounting policies applied in the preparation of the Company's unaudited condensed interim consolidated financial statements are consistent with those applied and disclosed in the Company’s audited consolidated financial statements for the year ended December 31, 2016, except for the following: the Company has adopted the narrow scope amendments to IFRS 12 - Disclosure of Interests in Other Entities, IAS 7 - Statement of Cash Flows and IAS 12 - Income Taxes which are effective for annual periods beginning on or after January 1, 2017. The amendments did not have an impact on the Company's unaudited condensed interim consolidated financial statements.
Critical Judgements and Estimates
The Company’s management makes judgements in its process of applying the Company’s accounting policies in the preparation of its unaudited condensed interim consolidated financial statements. In addition, the preparation of the financial data requires that the Company’s management make assumptions and estimates of the impacts of uncertain future events on the carrying amounts of the Company’s assets and liabilities at the end of the reporting period, and the reported amounts of revenues and expenses during the reporting period. Actual results may differ from those estimates as the estimation process is inherently uncertain. Estimates are reviewed on an ongoing basis based on historical experience and other factors that are considered to be relevant under the circumstances. Revisions to estimates and the resulting impacts on the carrying amounts of the Company’s assets and liabilities are accounted for prospectively.
Certain accounting judgements and estimates have been identified as being "critical' to the presentation of our financial condition and results of operations. Critical judgements and estimates are those that could have a material impact on the consolidated financial statements, are highly uncertain and are where changes are reasonably likely to occur from period to period. The Company's critical accounting judgements and estimates are generally discussed with the Audit Committee each quarter. The critical judgements and estimates applied in the preparation of the Company's unaudited condensed interim consolidated financial statements for the three and nine months ended September 30, 2017are consistent with those applied and disclosed in notes 5 and 6 of its audited consolidated financial statements for the year ended December 31, 2016 and the following critical judgments in applying accounting policies:
Business combinations
Determination of whether a set of assets acquired and liabilities assumed constitute the acquisition of a business or asset may require the Company to make certain judgements as to whether or not the assets acquired and liabilities assumed include the inputs, processes and outputs necessary to constitute a business as defined in IFRS 3 – Business Combinations. If an acquired set of assets and liabilities includes goodwill, the set is presumed to be a business. Based on an assessment of the relevant facts and circumstances, the Company concluded that the acquisition of its interests in Cerro Casale and Exeter in June 2017 did not meet the criteria of a business combination and the transactions have been accounted for as acquisitions of assets.
Determination of control of subsidiaries and joint arrangements
Judgement is required to determine when the Company has control of subsidiaries or joint control of joint arrangements. This requires an assessment of the relevant activities of the investee, being those activities that significantly affect the investee's returns, including operating and capital expenditure decision-making, financing of the investee, and the appointment, remuneration and termination of key management personnel; and when the decisions in relation to those activities are under the control of the Company or require unanimous consent from the investors. During the second quarter of 2017, the Company entered into the following transactions which required judgement to determine when the Company has control of subsidiaries or joint control of joint arrangements:
a. Acquisition of ExeterOn June 7, 2017, based on the fact that Goldcorp has a majority ownership interest in Exeter, the majority of the Exeter board of directors were Goldcorp nominees and Exeter's key management personnel was comprised of officers appointed by Goldcorp, the Company concluded that it had control over Exeter. Accordingly, Exeter met the criteria to be classified as a subsidiary. Commencing at the acquisition date of June 7, 2017, the financial results of Exeter were included in the results of the consolidated group and the portion of Exeter's net assets that was not attributable to Goldcorp was accounted for as non-controlling interest as a separate component of equity up to August 2, 2017, when the Company acquired the remaining 17% of Exeter.

Third Quarter Report – 2017 (in United States dollars, tabular amounts in millions, except where noted)
GOLDCORP | 46
b. Accounting for the 50% interest in Cerro Casale and CaspicheBased on assessment of the relevant facts and circumstances, primarily the requirement for unanimous agreement on management decisions relating to the development and operation of the arrangement, the Company concluded that the Cerro Casale/Caspiche Project is a jointly controlled entity. Judgement is also required when determining the classification of a joint arrangement as a joint venture or a joint operation through an evaluation of the rights and obligations arising from the arrangement. Despite the fact that the joint venture is a limited liability company and the parties do not have rights and obligations to individual assets and liabilities, the Company concluded that the Cerro Casale/ Caspiche Project is a joint operation as the arrangement requires the owners to purchase the output on a pro rata basis, indicating that the entity has rights and obligations to the separate assets and liabilities of the joint entity. As such, the project has been proportionately consolidated with the results of the consolidated group.
c. Acquisition of equity interest in Leagold As Goldcorp owns greater than 20% of Leagold, Goldcorp is considered to have significant influence over Leagold, and therefore, is required to account for its interest in Leagold using the equity method.
Income and value added taxesThe Company’s operations involve dealing with uncertainties and judgements in the application of complex tax regulations in multiple jurisdictions. The final income taxes paid and value added tax (“VAT”) refunds received are dependent upon many factors, including negotiations with taxing authorities in various jurisdictions and resolution of disputes arising from tax audits. The Company recognizes potential liabilities and records tax liabilities for anticipated tax audit issues based on its judgement of whether, and the extent to which, additional taxes will be due. The Company adjusts these reserves in light of changing facts and circumstances; however, due to the complexity of some of these uncertainties, the ultimate resolution may result in a payment that is materially different from the Company’s current estimate of the tax liabilities. If the Company’s estimate of tax liabilities proves to be less than the ultimate assessment, an additional charge to expense would result. If the estimate of tax liabilities proves to be greater than the ultimate assessment, a tax benefit would result. VAT receivables are generated on the purchase of supplies and services in several of the jurisdictions that the Company operates in. Timing and collection of VAT receivables is uncertain as VAT refund procedures in certain jurisdictions require a significant amount of information and follow-up. The Company is exposed to liquidity risk, credit risk and currency risk with respect to its VAT receivables if tax authorities are unwilling to make payments in a timely manner in accordance with the Company’s refund requests. The Company regularly monitors actual and projected collections of its VAT receivables to inform its assessment as to the collectability of the VAT receivables and classification as current and non-current assets.In June 2017, the Mexican government’s tax authority indicated that it had experienced an increase in VAT refund requests and as a result had commenced more in-depth assessments of the requests. In light of this and the fact that the Company did not receive any VAT refunds from the Mexican government in the second quarter and received only $6 million in the third quarter of 2017 (second and third quarter of 2016 – $30 million and $28 million, respectively), the Company reassessed the collectability and classification of its Mexican VAT receivables and determined that no allowance was necessary. At September 30, 2017, the total VAT receivable due to the Company from Mexican tax authorities was $366 million (December 31, 2016 – $237 million), including the tax receivables retained on the sale of Los Filos. Subsequent to September 30, 2017, the Company received $85 million in VAT refund proceeds relating to Los Filos. If on review of the Company’s VAT refund requests, the Mexican tax authority disallows any portion of the Company’s VAT refund requests, an additional charge to expense would result.
Changes in Accounting Standards Not Yet Effective
Revenue recognition
In May 2014, the IASB issued IFRS 15 – Revenue from Contracts with Customers ("IFRS 15") which supersedes IAS 11 – Construction Contracts;IAS 18 – Revenue; IFRIC 13 – Customer Loyalty Programmes; IFRIC 15 – Agreements for the Construction of Real Estate; IFRIC 18 – Transfers of Assets from Customers; and SIC 31 – Revenue – Barter Transactions involving Advertising Services. IFRS 15 establishes a single five-step model framework for determining the nature, amount, timing and uncertainty of revenue and cash flows arising from a contract with a customer. The standard is effective for annual periods beginning on or after January 1, 2018, with early adoption permitted. Either a modified retrospective application or full retrospective application is required for IFRS 15. The Company plans to apply IFRS 15 at the date it becomes effective but has not yet selected a transition approach.
The core principle of IFRS 15 is that revenue related to the transfer of promised goods or services should be recognized when the control of the goods or services passes to customers. The Company is currently evaluating the potential impact of applying IFRS 15, primarily analyzing its doré and concentrate sale agreements. The Company does not anticipate any material changes in the timing of revenue recognized under the new standard as the point of transfer of risk and reward for goods and services and transfer of control occur at the same time.

Third Quarter Report – 2017 (in United States dollars, tabular amounts in millions, except where noted)
GOLDCORP | 47
In addition, IFRS 15 requires entities to apportion revenue earned from contracts to individual promises or performance obligations, on a relative standalone selling price basis. In accordance with the terms of the Company's concentrate agreements, the seller must contract for and pay the shipping and insurance costs necessary to bring the goods to the named destination. Therefore, where material, a portion of the revenue earned under these contracts, representing the obligation to fulfill the shipping and insurance services, will be deferred and recognized over time as the obligations are fulfilled, along with the associated costs. The impact of this change on the amount of revenue recognized in a year is not expected to be material. The Company will finalize its assessment and implementation of IFRS 15 in the fourth quarter of 2017.
IFRS 15 contains presentation and disclosure requirements which are more detailed than the current standards, many of which are completely new. Upon the adoption of IFRS 15, the Company will provide disclosures for each of the Company's revenue streams, which consist of the Company's bullion, dore and concentrate sales, to supplement the revenue data that are currently presented in the segmented information disclosure. New disclosures will be presented relating to the timing of completion of the Company's performance obligations, for example, upon delivery, and/or other points in time and the portion of revenue related to provisional pricing adjustments on concentrate sales will also be separately disclosed.
Financial instruments
In July 2014, the IASB issued the final version of IFRS 9 – Financial Instruments ("IFRS 9") to replace IAS 39 – Financial Instruments: Recognition and Measurement. IFRS 9 provides a revised model for recognition and measurement of financial instruments and a single, forward-looking 'expected loss' impairment model. IFRS 9 also includes significant changes to hedge accounting. The standard is effective for annual periods beginning on or after January 1, 2018, with early adoption permitted. The Company plans to apply IFRS 9 at the date it becomes effective. Except for hedge accounting, retrospective application is required, but the provision of comparative information is not required. For hedge accounting, the requirements are generally applied prospectively.
The following summarizes the significant changes in IFRS 9 compared to the current standard:
• The classification of financial assets and liabilities is expected to remain consistent under IFRS 9 with the possible exception of equity securities. Under IFRS 9, the Company will have the option to designate equity securities as financial assets at fair value through other comprehensive income, where they will be recorded initially at fair value. Subsequent changes in fair value will be recognized in other comprehensive income only and will not be transferred into earnings (loss) upon disposition. If the Company does not make this election, changes in fair value of the equity securities will be recognized in earnings (loss).
• The introduction of the new "expected credit loss" impairment model is not expected to have an impact on the Company, given that the Company sells its products exclusively to large international financial institutions and other organizations with strong credit ratings, the negligible historical level of customer default, and the short term nature of the Company's receivables.
• The changes to hedge accounting are not expected to have a significant impact on the Company. Under the current standard, the Company can elect to record basis adjustments against the carrying amount of the non-financial asset or in earnings at the same time the non-financial item affects earnings. Under IFRS 9, it is mandatory to record the basis adjustments against the carrying amount of the non-financial asset. As the Company's current policy aligns with the new requirement, this change has no impact on the Company. Additionally, supplementary documentation and on-going assessment of hedge effectiveness may be required under the new standard. However, these requirements are not expected to have a material impact on the hedging arrangements of the Company.
Leases
In January 2016, the IASB issued IFRS 16 – Leases ("IFRS 16") which replaces IAS 17 – Leases and its associated interpretative guidance. IFRS 16 applies a control model to the identification of leases, distinguishing between a lease and a service contract on the basis of whether the customer controls the asset. For those assets determined to meet the definition of a lease, IFRS 16 introduces significant changes to the accounting by lessees, introducing a single, on-balance sheet accounting model that is similar to the current finance lease accounting, with limited exceptions for short-term leases or leases of low value assets. Lessor accounting remains similar to current accounting practice. The standard is effective for annual periods beginning on or after January 1, 2019, with early application permitted for entities that apply IFRS 15. A leasee can choose to apply IFRS 16 using either a full retrospective or a modified retrospective approach. The Company plans to apply IFRS 16 at the date it becomes effective but has not yet selected a transition approach.
Upon the adoption of IFRS 16, the Company anticipates it will record a material balance of lease assets and associated lease liabilities related to leases with a term of 12 months or more on the Consolidated Balance Sheet at January 1, 2019. Due to the recognition of additional lease assets and liabilities, a higher amount of depreciation expense and interest on lease liabilities will be recognized under IFRS 16 as compared to the current standard. Additionally, a reduction in production and/or corporate administration costs is expected. Lastly, the Company expects a reduction in operating cash outflows with a corresponding increase in financing cash outflows under IFRS 16. The Company is in the process of identifying and collecting data relating to existing agreements that may contain right-of-use assets. These include land surface right agreements and service contracts that may contain embedded leases for property, plant and equipment. At this time, it is not possible for the Company to make reasonable quantitative estimates of the effects of the new standard. The Company estimates the time frame to develop and implement the accounting policies, estimates and processes (including the information technology systems) will extend into the latter part of 2018.

Third Quarter Report – 2017 (in United States dollars, tabular amounts in millions, except where noted)
GOLDCORP | 48
CONTROLS AND PROCEDURES
Disclosure Controls and Procedures
The Company’s management, with the participation of its President and Chief Executive Officer and Executive Vice President, Chief Financial Officer and Corporate Development, has evaluated the effectiveness of the Company’s disclosure controls and procedures. Based upon the results of that evaluation, the Company’s President and Chief Executive Officer and Executive Vice President, Chief Financial Officer and Corporate Development have concluded that, as of the end of the period covered by this report, the Company’s disclosure controls and procedures were effective to provide reasonable assurance that the information required to be disclosed by the Company in reports it files is recorded, processed, summarized and reported, within the appropriate time periods and is accumulated and communicated to management, including the President and Chief Executive Officer and Executive Vice President, Chief Financial Officer and Corporate Development, as appropriate to allow timely decisions regarding required disclosure.
Internal Control Over Financial Reporting
The Company’s management, with the participation of its President and Chief Executive Officer and Executive Vice President, Chief Financial Officer and Corporate Development, is responsible for establishing and maintaining adequate internal control over financial reporting. Under the supervision of the President and Chief Executive Officer and Executive Vice President, Chief Financial Officer and Corporate Development, the Company’s internal control over financial reporting is a process designed to provide reasonable assurance regarding the reliability of financial reporting and the preparation of financial statements for external purposes in accordance with IFRS. The Company’s internal control over financial reporting includes policies and procedures that:
• pertain to the maintenance of records that accurately and fairly reflect, in reasonable detail, the transactions and dispositions of assets of the Company;
• provide reasonable assurance that transactions are recorded as necessary to permit preparation of financial statements in accordance with IFRS and that the Company’s receipts and expenditures are made only in accordance with authorizations of management and the Company’s Directors; and
• provide reasonable assurance regarding prevention or timely detection of unauthorized acquisition, use, or disposition of the Company’s assets that could have a material effect on the Company’s consolidated financial statements.
There has been no change in the Company’s internal control over financial reporting during the nine months ended September 30, 2017 that has materially affected, or is reasonably likely to materially affect, the Company’s internal control over financial reporting.
Limitations of Controls and Procedures
The Company’s management, including the President and Chief Executive Officer and Executive Vice President, Chief Financial Officer and Corporate Development, believes that any disclosure controls and procedures or internal control over financial reporting, no matter how well conceived and operated, can provide only reasonable, not absolute, assurance that the objectives of the control system are met. Further, the design of a control system must reflect the fact that there are resource constraints, and the benefits of controls must be considered relative to their costs. Because of the inherent limitations in all control systems, they cannot provide absolute assurance that all control issues and instances of fraud, if any, within the Company have been prevented or detected. These inherent limitations include the realities that judgments in decision-making can be faulty, and that breakdowns can occur because of simple error or mistake. Additionally, controls can be circumvented by the individual acts of some persons, by collusion of two or more people, or by unauthorized override of the control. The design of any control system also is based in part upon certain assumptions about the likelihood of future events, and there can be no assurance that any design will succeed in achieving its stated goals under all potential future conditions. Accordingly, because of the inherent limitations in a cost effective control system, misstatements due to error or fraud may occur and not be detected.

Third Quarter Report – 2017 (in United States dollars, tabular amounts in millions, except where noted)
GOLDCORP | 49
Goldcorp Mineral ReservesAs of June 30, 2017
PROVEN PROBABLE PROVEN & PROBABLEOwnership Tonnage Grade Contained Tonnage Grade Contained Tonnage Grade Contained
Gold mt g/t m oz mt g/t m oz mt g/t m ozAlumbrera 37.5% 15.11 0.39 0.19 1.43 0.37 0.02 16.54 0.39 0.21Cerro Casale 50.0% 114.85 0.65 2.39 483.95 0.59 9.23 598.80 0.60 11.62Cerro Negro 100.0% 4.46 8.79 1.26 12.67 8.85 3.60 17.13 8.83 4.86Coffee 100.0% — — — 46.36 1.45 2.16 46.36 1.45 2.16El Morro 50.0% 160.91 0.56 2.91 138.62 0.35 1.55 299.53 0.46 4.46Éléonore 100.0% 2.73 6.94 0.61 16.88 5.87 3.19 19.61 6.02 3.80Musselwhite 100.0% 3.94 7.22 0.91 4.91 5.92 0.93 8.84 6.50 1.85Peñasquito 100.0% 361.18 0.59 6.80 163.57 0.41 2.14 524.75 0.53 8.95Porcupine 100.0% 13.55 1.91 0.83 214.86 1.04 7.21 228.41 1.10 8.05Pueblo Viejo 40.0% 40.45 2.82 3.67 16.77 3.19 1.72 57.21 2.93 5.39Red Lake 100.0% 1.50 11.01 0.53 7.34 6.97 1.64 8.84 7.65 2.17Totals 718.67 0.87 20.11 1,107.35 0.94 33.40 1,826.02 0.91 53.51
Silver mt g/t m oz mt g/t m oz mt g/t m ozCerro Casale 50.0% 114.85 1.91 7.04 483.95 1.43 22.30 598.80 1.52 29.34Cerro Negro 100.0% 4.46 75.52 10.83 12.67 61.02 24.86 17.13 64.80 35.69Peñasquito 100.0% 361.18 35.06 407.16 163.57 26.32 138.40 524.75 32.34 545.56Pueblo Viejo 40.0% 40.45 18.68 24.29 16.77 14.07 7.58 57.21 17.33 31.87Totals 520.94 26.83 449.32 676.96 8.87 193.14 1,197.90 16.68 642.47
Copper mt % m lbs mt % m lbs mt % m lbsAlumbrera 37.5% 15.11 0.24 79.13 1.43 0.17 5.29 16.54 0.23 84.42Cerro Casale 50.0% 114.85 0.19 480.87 483.95 0.23 2,408.87 598.80 0.22 2,889.73El Morro 50.0% 160.91 0.55 1,938.29 138.62 0.43 1,313.18 299.53 0.49 3,251.48Pueblo Viejo 40.0% 40.45 0.09 83.25 16.77 0.10 36.83 57.21 0.10 120.08Relincho 50.0% 217.65 0.38 1,807.95 401.91 0.37 3,279.24 619.57 0.37 5,087.19Totals 548.97 0.36 4,389.49 1,042.68 0.31 7,043.41 1,591.65 0.33 11,432.90
Lead mt % m lbs mt % m lbs mt % m lbsPeñasquito 100.0% 352.66 0.35 2,697.06 162.36 0.24 862.95 515.03 0.31 3,560.00Totals 352.66 0.35 2,697.06 162.36 0.24 862.95 515.03 0.31 3,560.00
Zinc mt % m lbs mt % m lbs mt % m lbsPeñasquito 100.0% 352.66 0.75 5,868.13 162.36 0.51 1,842.24 515.03 0.68 7,710.38Totals 352.66 0.75 5,868.13 162.36 0.51 1,842.24 515.03 0.68 7,710.38
Molybdenum mt % m lbs mt % m lbs mt % m lbsRelincho 50.0% 217.65 0.016 77.01 401.91 0.018 161.88 619.57 0.017 238.90Totals 217.65 0.016 77.01 401.91 0.018 161.88 619.57 0.017 238.90
* Numbers may not add up due to rounding.

Third Quarter Report – 2017 (in United States dollars, tabular amounts in millions, except where noted)
GOLDCORP | 50
Goldcorp Mineral ResourcesAs of June 30, 2017
MEASURED INDICATED MEASURED & INDICATED INFERREDOwnership Tonnage Grade Contained Tonnage Grade Contained Tonnage Grade Contained Tonnage Grade Contained
Gold mt g/t m oz mt g/t m oz mt g/t m oz mt g/t m ozAlumbrera 37.5% 14.89 0.28 0.14 1.05 0.21 0.01 15.94 0.28 0.14 1.50 0.26 0.01Caspiche 50.0% 310.05 0.57 5.65 391.75 0.47 5.97 701.80 0.51 11.62 99.05 0.29 0.92Cerro Casale 50.0% 11.48 0.30 0.11 136.85 0.36 1.57 148.32 0.35 1.69 247.72 0.38 3.00Cerro Negro 100.0% 0.99 5.82 0.18 5.27 5.86 0.99 6.26 5.85 1.18 0.88 5.03 0.14Coffee 100.0% 3.78 1.30 0.16 16.20 1.18 0.62 19.98 1.21 0.78 25.93 1.37 1.15El Morro 50.0% 9.90 0.53 0.17 36.28 0.38 0.44 46.18 0.41 0.61 339.03 0.30 3.23Éléonore 100.0% 3.67 7.65 0.90 3.48 3.87 0.43 7.16 5.81 1.34 8.45 7.31 1.99Musselwhite 100.0% 0.29 5.55 0.05 1.73 4.68 0.26 2.02 4.81 0.31 6.46 5.65 1.17Noche Buena 100.0% — — — 55.00 0.37 0.65 55.00 0.37 0.65 4.94 0.22 0.03Peñasquito 100.0% 126.07 0.29 1.16 149.25 0.25 1.20 275.32 0.27 2.35 23.67 0.29 0.22Porcupine 100.0% 28.70 1.30 1.20 226.11 0.99 7.19 254.81 1.02 8.39 111.95 1.02 3.69Pueblo Viejo 40.0% 6.79 2.33 0.51 63.64 2.33 4.76 70.43 2.33 5.27 1.90 2.05 0.12Red Lake 100.0% 1.52 19.28 0.94 3.80 14.63 1.79 5.31 15.96 2.73 8.53 15.86 4.35Totals 518.11 0.67 11.17 1,090.42 0.74 25.88 1,608.53 0.72 37.05 880.01 0.71 20.02
Silver mt g/t m oz mt g/t m oz mt g/t m oz mt g/t m ozCaspiche 50.0% 310.05 1.20 11.98 391.75 1.20 15.15 701.80 1.20 27.12 99.05 0.91 2.91Cerro Casale 50.0% 11.48 1.19 0.44 136.85 1.06 4.66 148.32 1.07 5.10 247.72 1.04 8.25Cerro Negro 100.0% 0.99 59.15 1.88 5.27 43.01 7.29 6.26 45.55 9.17 0.88 29.98 0.85Noche Buena 100.0% — — — 55.00 12.35 21.84 55.00 12.35 21.84 4.94 8.08 1.28Peñasquito 100.0% 126.07 29.12 118.02 149.25 24.90 119.51 275.32 26.83 237.53 23.67 18.73 14.25Pueblo Viejo 40.0% 6.79 14.53 3.17 63.64 11.22 22.97 70.43 11.54 26.14 1.90 9.76 0.60Totals 455.37 9.25 135.49 801.76 7.43 191.41 1,257.13 8.09 326.90 378.15 2.31 28.14
Copper mt % m lbs mt % m lbs mt % m lbs mt % m lbsAlumbrera 37.5% 14.89 0.28 92.42 1.05 0.23 5.42 15.94 0.28 97.84 1.50 0.15 5.04Caspiche 50.0% 277.10 0.23 1,405.07 363.95 0.18 1,444.27 641.05 0.20 2,849.34 97.80 0.12 258.73Cerro Casale 50.0% 11.48 0.13 33.40 136.85 0.16 495.87 148.32 0.16 529.27 247.72 0.19 1,046.80El Morro 50.0% 9.90 0.51 111.67 36.28 0.39 315.00 46.18 0.42 426.67 339.03 0.35 2,595.00Pueblo Viejo 40.0% 6.79 0.09 13.43 63.64 0.09 119.77 70.43 0.09 133.20 1.90 0.02 0.91Relincho 50.0% 39.95 0.27 240.43 158.54 0.34 1,180.79 198.50 0.32 1,421.22 305.41 0.38 2,549.68Totals 360.10 0.24 1,896.42 760.31 0.21 3,561.12 1,120.41 0.22 5,457.54 993.36 0.29 6,456.16
Lead mt % m lbs mt % m lbs mt % m lbs mt % m lbsPeñasquito 100.0% 117.47 0.26 677.80 132.93 0.20 592.71 250.40 0.23 1,270.51 23.53 0.16 85.21Totals 117.47 0.26 677.80 132.93 0.20 592.71 250.40 0.23 1,270.51 23.53 0.16 85.21
Zinc mt % m lbs mt % m lbs mt % m lbs mt % m lbsPeñasquito 100.0% 117.47 0.57 1,469.52 132.93 0.47 1,388.60 250.40 0.52 2,858.13 23.53 0.59 306.74Totals 117.47 0.57 1,469.52 132.93 0.47 1,388.60 250.40 0.52 2,858.13 23.53 0.59 306.74
Molybdenum mt % m lbs mt % m lbs mt % m lbs mt % m lbsRelincho 50.0% 39.95 0.009 7.79 158.54 0.012 40.46 198.50 0.011 48.25 305.41 0.013 88.20Totals 39.95 0.009 7.79 158.54 0.012 40.46 198.50 0.011 48.25 305.41 0.013 88.20
* Numbers may not add up due to rounding.

Third Quarter Report – 2017 (in United States dollars, tabular amounts in millions, except where noted)
GOLDCORP | 51
Goldcorp June 30, 2017 Reserve and Resource Reporting Notes:1 All Mineral Reserves and Mineral Resources have been estimated in accordance with the CIM Definition Standards, and in the case of the
Alumbrera mine, the Ore Reserves have been estimated in accordance with the JORC Code. The JORC Code has been accepted for current disclosure rules in Canada under NI 43-101 (see below for definition). Except for properties or projects listed in note 4 below, all Mineral Reserves, Ore Reserves and Mineral Resources set out in the tables above or elsewhere in this MD&A have been reviewed and approved by Dan Redmond, Director, Reserves and Mine Planning, Goldcorp, who is a qualified person as defined under NI 43-101.
2 All Mineral Resources are reported exclusive of those Mineral Resources that were converted to Mineral Reserves.
3 Mineral Resources which are not Mineral Reserves do not have demonstrated economic viability.
4 Mineral Reserves and Mineral Resources are reported effective June 30, 2017, with the following conditions or exceptions:
(i) Mineral Reserves and Mineral Resources for Pueblo Viejo are as per public information provided by Barrick Gold Corporation in its 2016-year end report and fourth quarter results report dated February 15th, 2017 with an effective date of December 31, 2016 and were estimated under the supervision of Rick Sims, Senior Director, Resources and Reserves, of Barrick, Steven Haggarty, Senior Director, Metallurgy, of Barrick and Patrick Garretson, Senior Director, Life of Mine Planning, of Barrick. For additional information, see the technical report entitled “Technical Report on the Pueblo Viejo Project, Sanchez Ramirez province, Dominican Republic” dated March 27, 2014, which is available under the Company’s profile on SEDAR at www.sedar.com.
(ii) Mineral Reserves and Mineral Resources for the Cerro Casale Project are as per public information provided by Barrick Gold Corporation in its 2016-year end report and fourth quarter results report dated Febuary15th, 2017 but have been adjusted to reflect Goldcorp’s 50% ownership in a new joint venture announced in a Goldcorp press release dated June 9th, 2017, have an effective date of December 31, 2016 and were estimated under the supervision of Rick Sims, Senior Director, Resources and Reserves, of Barrick, Steven Haggarty, Senior Director, Metallurgy, of Barrick and Patrick Garretson, Senior Director, Life of Mine Planning, of Barrick.
(iii) Mineral Resources for the Caspiche Project are as per public information provided by Exeter Resource Corporation in its 2016 Annual Information Form dated March 24th, 2017 but have been adjusted to reflect Goldcorp’s 50% ownership in a new joint venture announced in a Goldcorp press release dated June 9th, 2017. The Mineral Resource Estimate for the Caspiche Project with an effective date of April 11, 2012 was prepared by Mr. Ted Coupland, MAusIMM(CP), at the time, Director and Principal Geostatistician of Cube Consulting Pty Ltd.
(iv) Mineral Reserves and Mineral Resources for Relincho are as per public information provided by Teck Resources Limited in its 2016 Annual Information Form dated February 23, 2017 with an effective date of December 31, 2016 and have been prepared under the general supervision of Rodrigo Marinho, P.Geo., who is an employee of Teck Resources Limited.
(v) Mineral Reserves and Mineral Resources for Alumbrera are as per public information provided by Glencore plc in its 2016 year end Resources and Reserves Report with an effective date of December 31, 2016 and have been prepared under the supervision of Flavio Montini who is an employee of Glencore plc.
(vi) Mineral Reserves for Coffee are as per information provided by Kaminak Gold Corporation effective the transaction date of July 19, 2016.
5 Mineral Reserves are estimated using appropriate recovery rates and US$ commodity prices of $1,200 per ounce of gold, $18.00 per ounceof silver, $2.75 per pound of copper, $0.90 per pound of lead, and $1.05 per pound of zinc, unless otherwise noted below:
(i) Pueblo Viejo and Cerro Casale Gold - US$1,000/oz. to 2020, and a long-term price of US$1,200/oz. from 2021 onwardsSilver - US$13.75/oz. to 2020 and a long-term price of US$16.50/oz. from 2021 onwardsCopper - US$2.25/lb. to 2020 and a long-term price of US$2.75/lb. from 2021 onwards
(ii) Alumbrera Gold - US$1,300/oz; Copper - US$2.31/lb(iii) Relincho Copper - US$2.80/lb; Molybdenum - US$13.70/lb
6 Mineral Resources are estimated using US$ commodity prices of $1,400 per ounce of gold, $20 per ounce of silver, $3.00 per pound ofcopper, $1.00 per pound of lead, and $1.10 per pound of zinc, unless otherwise noted below;
(i) Pueblo Viejo and Cerro Casale Gold - US$1,500/oz; Silver - US$16.50/oz; Copper - US$2.75/lb(ii) Caspiche Gold - US$1,250/oz; Silver - US$15.00/oz; Copper - US$2.75/lb(iii) El Morro Gold - US$1,200/oz; Copper - US$2.75/lb(iv) Alumbrera Gold - US$1,300/oz; Copper - US$3.06/lb(v) Relincho Copper - US$2.80/lb; Molybdenum - US$13.70/lb

GOLDCORP | 1
Exhibit 99.2Third Quarter Report – 2017
CONDENSED INTERIM CONSOLIDATED STATEMENTS OF EARNINGS(In millions of United States dollars, except for per share amounts – Unaudited)
Three Months Ended September 30
Nine Months Ended September 30
Note 2017 2016 2017 2016Revenues 4 $ 866 $ 915 $ 2,570 $ 2,612Mine operating costs
Production costs 4, 5 (459) (523) (1,435) (1,550)Depreciation and depletion 4, 11(d) (250) (267) (735) (770)
(709) (790) (2,170) (2,320)Earnings from mine operations 157 125 400 292Exploration, evaluation and project costs 11(a) (19) (7) (40) (24)Share of net earnings related to associates and joint venture 12 27 47 128 111Impairment reversal of mining interests, net 3(b), (c) — — 3 —Corporate administration 5(a) (40) (42) (112) (149)Restructuring costs 6 (1) (6) (4) (45)Earnings from operations, associates and joint venture 4 124 117 375 185Gain on derivatives, net — 1 5 2Loss on disposition of mining interest, net of transaction costs 3(c) — — (6) —Finance costs (31) (34) (104) (103)Other (expense) income, net 8 (1) 5 22 (1)Earnings before taxes 92 89 292 83Income tax recovery (expense) 7 19 (30) 124 (22)Net earnings $ 111 $ 59 $ 416 $ 61
Net earnings per shareBasic 9(a) $ 0.13 $ 0.07 $ 0.48 $ 0.07Diluted 9(a) 0.13 0.07 0.48 0.07
The accompanying notes form an integral part of these unaudited condensed interim consolidated financial statements.

Third Quarter Report – 2017
GOLDCORP | 2
CONDENSED INTERIM CONSOLIDATED STATEMENTS OF COMPREHENSIVE INCOME(In millions of United States dollars – Unaudited)
Three Months Ended September 30
Nine Months Ended September 30
2017 2016 2017 2016Net earnings $ 111 $ 59 $ 416 $ 61Other comprehensive (loss) income, net of taxItems that may be reclassified subsequently to net earnings:
Unrealized gains (losses) on available-for-sale securities 6 28 (14) 83Reclassification adjustment for realized gains on disposition of available-for-sale securities recognized in net earnings (7) (3) (15) (12)Unrealized (loss) gain on derivatives designated as cash flow hedges (4) — 20 —
(5) 25 (9) 71Items that will not be reclassified subsequently to net earnings:
Remeasurement of defined benefit pension plans 3 1 — —Total other comprehensive (loss) income, net of tax (2) 26 (9) 71Total comprehensive income $ 109 $ 85 $ 407 $ 132
The accompanying notes form an integral part of these unaudited condensed interim consolidated financial statements.

Third Quarter Report – 2017
GOLDCORP | 3
CONDENSED INTERIM CONSOLIDATED STATEMENTS OF CASH FLOWS(In millions of United States dollars – Unaudited)
Three Months Ended September 30
Nine Months Ended September 30
Note 2017 2016 2017 2016Operating activitiesNet earnings $ 111 $ 59 $ 416 $ 61Adjustments for: Reclamation expenditures (9) (6) (17) (22)Items not affecting cash:
Depreciation and depletion 4, 11(d) 250 267 735 770Share of net earnings related to associates and joint venture 12 (27) (47) (128) (111)Impairment reversal of mining interests, net 3(b), (c) — — (3) —Share-based compensation 5 13 22 43Unrealized gain on derivatives, net — (3) (5) (6)Loss on disposition of mining interest, net of transaction costs 3(c) — — 6 —Revision of estimates and accretion of closure cost obligations 7 4 16 17Deferred income tax (recovery) expense 7 (89) 26 (311) (55)Other 10 (14) 12 12
Decrease (increase) in working capital 10 57 (32) (43) (149)Net cash provided by operating activities 315 267 700 560Investing activitiesAcquisition of mining interest 3(a) — 6 (266) 6Expenditures on mining interests 4, 11(b) (265) (154) (666) (493)Return of capital investment in associate 12 — 24 43 24Proceeds from dispositions of mining interests, net of transactioncosts 3(b), (c) 29 — 271 —Interest paid 11(b) (12) (6) (27) (21)Proceeds (purchases) of short-term investments and available-for-sale securities, net 10 9 22 (31) 49Other 4(e) — (3) (66) (1)Net cash used in investing activities (239) (111) (742) (436)Financing activitiesDebt repayments — (2) — (5)Draw down (repayment) draw down of credit facility, net 13(c)(i) 16 (125) 70 —Finance lease payments (2) (2) (5) (4)Dividends paid to shareholders 9(b) (15) (14) (46) (81)Common shares issued — — 1 3Other — (1) — (23)Net cash (used in) provided by financing activities (1) (144) 20 (110)Increase (decrease) in cash and cash equivalents 75 12 (22) 14Cash and cash equivalents, beginning of the period 80 328 157 326Cash and cash equivalents, classified as held for sale at thebeginning of the period — — 20 —Cash and cash equivalents, end of the period 10 $ 155 $ 340 $ 155 $ 340
Supplemental cash flow information (note 10)
The accompanying notes form an integral part of these unaudited condensed interim consolidated financial statements.

Third Quarter Report – 2017
GOLDCORP | 4
CONDENSED INTERIM CONSOLIDATED BALANCE SHEETS(In millions of United States dollars – Unaudited)
NoteAt September 30
2017At December 31
2016AssetsCurrent assets
Cash and cash equivalents 10 $ 155 $ 157Short-term investments 40 43Accounts receivable 136 95Inventories 398 370Sales and indirect taxes recoverable 380 271Income taxes receivable 28 25Assets held for sale 3(b) — 548Other 3(b) 166 59
1,303 1,568Mining interests
Owned by subsidiaries and joint operation 11 18,060 17,565Investments in associates and joint venture 12 2,155 2,007
20,215 19,572Intangible asset 3(a) 59 —Investments in securities 134 114Deferred income taxes 50 49Inventories 21 28Other 156 166Total assets $ 21,938 $ 21,497LiabilitiesCurrent liabilities
Accounts payable and accrued liabilities $ 643 $ 512Debt 499 —Income taxes payable 107 52Liabilities relating to assets held for sale 3(b) — 118Other 57 95
1,306 777Deferred income taxes 3,351 3,658Debt 2,083 2,510Deferred payment obligation 3(a) 185 —Provisions 632 661Finance lease obligations 244 247Income taxes payable 134 127Other 44 102Total liabilities 7,979 8,082Shareholders' equity
Common shares, stock options and restricted share units 18,251 18,064Accumulated other comprehensive income 32 41Deficit (4,324) (4,690)
13,959 13,415Total liabilities and shareholders' equity $ 21,938 $ 21,497
Commitments and contingencies (notes 3(a), 13(c)(i) and 14); subsequent events (notes 3(b) and (e)).
The accompanying notes form an integral part of these unaudited condensed interim consolidated financial statements.

Third
Qua
rter R
epor
t – 20
17
GOLD
CORP
| 5
COND
ENSE
D IN
TERI
M CO
NSOL
IDAT
ED S
TATE
MENT
S OF C
HANG
ES IN
EQU
ITY
(In m
illion
s of U
nited
Stat
es do
llars,
shar
es in
thou
sand
s – U
naud
ited)
Co
mm
on S
hare
s
Shar
es is
sued
,fu
lly p
aid w
ithno
par
valu
eAm
ount
Stoc
k opt
ions
and
rest
ricte
dsh
are u
nits
Accu
mul
ated
oth
erco
mpr
ehen
sive
inco
me
Defic
it To
tal
At Ja
nuar
y 1, 2
017
853,8
12$
17,73
3$
331
$41
$(4
,690)
$13
,415
Total
comp
rehe
nsive
inco
me N
et ea
rning
s—
——
—41
641
6 O
ther c
ompr
ehen
sive l
oss
——
—(9
)—
(9)
—
——
(9)
416
407
Acqu
isitio
n of E
xeter
Res
ource
Cor
pora
tion (
note
3(a
))11
,255
156
2—
216
0St
ock o
ption
s exe
rcise
d and
restr
icted
shar
e unit
s iss
ued a
nd ve
sted
1,605
31(3
0)—
—1
Shar
e-ba
sed c
ompe
nsati
on—
—22
——
22Di
viden
ds (n
ote
9(b)
)44
46
——
(52)
(46)
At S
epte
mbe
r 30,
2017
867,1
16$
17,92
6$
325
$32
$(4
,324)
$13
,959
Co
mmon
Sha
res
Shar
es is
sued
,fu
lly p
aid w
ithno
par
value
Amou
nt
Stoc
k opti
ons
and r
estric
tedsh
are u
nits
Accu
mulat
ed ot
her
comp
rehe
nsive
(loss
) inco
meDe
ficit
Total
At Ja
nuar
y 1, 2
016
830,
337
$17
,276
$32
8$
(6)$
(4,75
0)$
12,84
8To
tal co
mpre
hens
ive in
come
Net
earn
ings
——
——
6161
Othe
r com
preh
ensiv
e inc
ome
——
—71
—71
—
——
7161
132
Shar
es is
sued
pursu
ant to
the a
cquis
ition o
f Kam
inak G
old C
orpo
ratio
n20
,997
400
——
—40
0St
ock o
ption
s exe
rcise
d and
restr
icted
shar
e unit
s iss
ued a
nd ve
sted
2,12
951
(48)
——
3Sh
are-
base
d com
pens
ation
——
42—
—42
Divid
ends
(not
e 9(
b))
197
3—
—(8
4)(8
1)At
Sep
tembe
r 30,
2016
853,
660
$17
,730
$32
2$
65$
(4,77
3)$
13,34
4
The a
ccom
pany
ing no
tes fo
rm an
integ
ral p
art o
f thes
e una
udite
d con
dens
ed in
terim
cons
olida
ted fin
ancia
l stat
emen
ts.

Third Quarter Report – 2017(In millions of United States dollars, except where noted)
GOLDCORP | 6
NOTES TO THE CONDENSED INTERIM CONSOLIDATED FINANCIAL STATEMENTSFOR THE THREE AND NINE MONTHS ENDED SEPTEMBER 30, 2017 1. DESCRIPTION OF BUSINESS AND NATURE OF OPERATIONS
Goldcorp Inc. ("Goldcorp" or "the Company") is a gold producer engaged in the operation, exploration, development and acquisition of precious metal properties in Canada, the United States, Mexico, and Central and South America. The Company’s current sources of operating cash flows are primarily from the sale of gold, silver, lead, zinc and copper.
The Company’s principal producing mining properties are comprised of the Éléonore, Musselwhite, Porcupine and Red Lake mines in Canada; the Peñasquito mine in Mexico; the Cerro Negro mine in Argentina; and the Pueblo Viejo mine (40% interest) in the Dominican Republic. At September 30, 2017, the Company's significant projects include the Borden, Cochenour and Coffee projects in Canada, and the NuevaUnión (50% interest) and Cerro Casale/Caspiche projects (50% interest) in Chile.
On June 9, 2017, the Company acquired 50% of the Cerro Casale project which was contributed to a newly formed 50/50 joint operation with Barrick Gold Corporation ("Barrick"). In June 2017, the Company also acquired 83.2% of Exeter Resource Corporation ("Exeter") and its Caspiche project ("Caspiche"), with the remaining ownership interest acquired in the third quarter of 2017. On September 27, 2017, the Company contributed 100% of Caspiche to the joint operation with Barrick (note 3(a)). With the contribution of Caspiche to the joint operation, Goldcorp and Barrick jointly control more than 20,000 hectares of mineral properties in the Maricunga District in Chile.
On April 7, 2017, the Company completed the sale of the Los Filos mine in Mexico to Leagold Mining Corporation ("Leagold") (note 3(b)). As part of the consideration, the Company received 25.3% of Leagold's issued and outstanding shares which is accounted for as an investment in associate using the equity method.
2. BASIS OF PREPARATION
These unaudited condensed interim consolidated financial statements include the accounts of Goldcorp Inc., the ultimate parent company of its consolidated group, and its subsidiaries and are prepared in accordance with International Accounting Standard 34 – Interim Financial Reporting ("IAS 34") as issued by the International Accounting Standards Board ("IASB"). Certain disclosures included in the annual financial statements prepared in accordance with International Financial Reporting Standards ("IFRSs") as issued by the IASB have been condensed or omitted. Accordingly, these unaudited condensed interim consolidated financial statements should be read in conjunction with the Company’s audited consolidated financial statements for the year ended December 31, 2016.
The accounting policies applied in the preparation of these unaudited condensed interim consolidated financial statements are consistent with those applied and disclosed in the Company’s audited consolidated financial statements for the year ended December 31, 2016, except for the following: the Company has adopted the narrow scope amendments to IFRS 12 - Disclosure of Interests in Other Entities, IAS 7 - Statement of Cash Flows and IAS 12 - Income Taxes which are effective for annual periods beginning on or after January 1, 2017. The amendments did not have an impact on the Company's unaudited condensed interim consolidated financial statements.
The Company’s interim results are not necessarily indicative of its results for a full year. All amounts are expressed in US dollars, unless otherwise noted. References C$ are to Canadian dollars.
Changes in accounting standards not yet effective:
Revenue recognition
In May 2014, the IASB issued IFRS 15 – Revenue from Contracts with Customers ("IFRS 15") which supersedes IAS 11 – Construction Contracts; IAS 18 – Revenue; IFRIC 13 – Customer Loyalty Programmes; IFRIC 15 – Agreements for the Construction of Real Estate;IFRIC 18 – Transfers of Assets from Customers; and SIC 31 – Revenue – Barter Transactions involving Advertising Services. IFRS 15 establishes a single five-step model framework for determining the nature, amount, timing and uncertainty of revenue and cash flows arising from a contract with a customer. The standard is effective for annual periods beginning on or after January 1, 2018, with early adoption permitted. Either a modified retrospective application or full retrospective application is required for IFRS 15. The Company plans to apply IFRS 15 at the date it becomes effective but has not yet selected a transition approach.
The core principle of IFRS 15 is that revenue related to the transfer of promised goods or services should be recognized when the control of the goods or services passes to customers. The Company is currently evaluating the potential impact of applying IFRS 15, primarily analyzing its doré and concentrate sale agreements. The Company does not anticipate any material changes in the timing of revenue recognized under the new standard as the point of transfer of risk and reward for goods and services and transfer of control occur at the same time.
In addition, IFRS 15 requires entities to apportion revenue earned from contracts to individual promises or performance obligations on a relative standalone selling price basis. In accordance with the terms of the Company's concentrate agreements, the seller must contract

Third Quarter Report – 2017(In millions of United States dollars, except where noted)
GOLDCORP | 7
for and pay the shipping and insurance costs necessary to bring the goods to the named destination. Therefore, where material, a portion of the revenue earned under these contracts, representing the obligation to fulfill the shipping and insurance services, will be deferred and recognized over time as the obligations are fulfilled. The impact of this change on the amount of revenue recognized in a year is not expected to be material. The Company will finalize its assessment and implementation of IFRS 15 in the fourth quarter of 2017.
IFRS 15 contains presentation and disclosure requirements which are more detailed than the current standards, many of which are completely new. Upon the adoption of IFRS 15, the Company will provide disclosures for each of the Company's revenue streams, which consist of the Company's bullion, doré and concentrate sales, to supplement the revenue data that are currently presented in the segmented information disclosure (note 4). New disclosures will be presented relating to the timing of completion of the Company's performance obligations, for example, upon delivery, and/or other points in time and the portion of revenue related to provisional pricing adjustments on concentrate sales will also be separately disclosed.
Financial instruments
In July 2014, the IASB issued the final version of IFRS 9 – Financial Instruments ("IFRS 9") to replace IAS 39 – Financial Instruments: Recognition and Measurement. IFRS 9 provides a revised model for recognition and measurement of financial instruments and a single, forward-looking 'expected loss' impairment model. IFRS 9 also includes significant changes to hedge accounting. The standard is effective for annual periods beginning on or after January 1, 2018, with early adoption permitted. The Company plans to apply IFRS 9 at the date it becomes effective. Except for hedge accounting, retrospective application is required, but the provision of comparative information is not required. For hedge accounting, the requirements are generally applied prospectively.
The following summarizes the significant changes in IFRS 9 compared to the current standards:
• The classification of financial assets and liabilities is expected to remain consistent under IFRS 9 with the possible exception of equity securities. Under IFRS 9, the Company will have the option to designate equity securities as financial assets at fair value through other comprehensive income, where they will be recorded initially at fair value. Subsequent changes in fair value will be recognized in other comprehensive income only and will not be transferred into earnings (loss) upon disposition. If the Company does not make this election, changes in fair value of the equity securities will be recognized in earnings (loss).
• The introduction of the new "expected credit loss" impairment model is not expected to have an impact on the Company, given the Company sells its products exclusively to large international financial institutions and other organizations with strong credit ratings, the negligible historical level of customer default, and the short term nature of the Company's receivables.
• The changes to hedge accounting are not expected to have a significant impact on the Company. Under the current standard, the Company can elect to record basis adjustments against the carrying amount of the non-financial asset or in earnings at the same time the non-financial item affects earnings. Under IFRS 9, it is mandatory to record the basis adjustments against the carrying amount of the non-financial asset. As the Company's current policy aligns with the new requirement, this change has no impact on the Company. Additionally, supplementary documentation and on-going assessment of hedge effectiveness may be required under the new standard. However, these requirements are not expected to have a material impact on the hedging arrangements of the Company.
Leases
In January 2016, the IASB issued IFRS 16 – Leases ("IFRS 16") which replaces IAS 17 – Leases and its associated interpretative guidance. IFRS 16 applies a control model to the identification of leases, distinguishing between a lease and a service contract on the basis of whether the customer controls the asset. For those assets determined to meet the definition of a lease, IFRS 16 introduces significant changes to the accounting by lessees, introducing a single, on-balance sheet accounting model that is similar to the current finance lease accounting, with limited exceptions for short-term leases or leases of low value assets. Lessor accounting remains similar to current accounting practice. The standard is effective for annual periods beginning on or after January 1, 2019, with early application permitted for entities that apply IFRS 15. A leasee can choose to apply IFRS 16 using either a full retrospective or a modified retrospective approach. The Company plans to apply IFRS 16 at the date it becomes effective but has not yet selected a transition approach.
Upon the adoption of IFRS 16, the Company anticipates it will record a material balance of lease assets and associated lease liabilities related to leases with a term of 12 months or more on the Consolidated Balance Sheet at January 1, 2019. Due to the recognition of additional lease assets and liabilities, a higher amount of depreciation expense and interest on lease liabilities will be recognized under IFRS 16 as compared to the current standard. Additionally, a reduction in production and/or corporate administration costs is expected. Lastly, the Company expects a reduction in operating cash outflows with a corresponding increase in financing cash outflows under IFRS 16. The Company is in the process of identifying and collecting data relating to existing agreements that may contain right-of-use assets. These include land surface right agreements and service contracts that may contain embedded leases for property, plant and equipment. At this time, it is not possible for the Company to make reasonable quantitative estimates of the effects of the new standard. The Company estimates the time frame to develop and implement the accounting policies, estimates and processes (including the information technology systems) will extend into the latter part of 2018.

Third Quarter Report – 2017(In millions of United States dollars, except where noted)
GOLDCORP | 8
Significant judgements and estimates
The Company’s management makes judgements in its process of applying the Company’s accounting policies in the preparation of its unaudited condensed interim consolidated financial statements. In addition, the preparation of the financial data requires that the Company’s management makes assumptions and estimates of the impacts of uncertain future events on the carrying amounts of the Company’s assets and liabilities at the end of the reporting period, and the reported amounts of revenues and expenses during the reporting period. Actual results may differ from those estimates as the estimation process is inherently uncertain. Estimates are reviewed on an ongoing basis based on historical experience and other factors that are considered to be relevant under the circumstances. Revisions to estimates and the resulting impacts on the carrying amounts of the Company’s assets and liabilities are accounted for prospectively.
In preparing the Company’s unaudited condensed interim consolidated financial statements for the three and nine months ended September 30, 2017, the Company applied the critical judgements and estimates disclosed in notes 5 and 6 of its audited consolidated financial statements for the year ended December 31, 2016, and the following critical judgments in applying accounting policies:
Business combinations
Determination of whether a set of assets acquired and liabilities assumed constitute the acquisition of a business or asset may require the Company to make certain judgements as to whether or not the assets acquired and liabilities assumed include the inputs, processes and outputs necessary to constitute a business as defined in IFRS 3 – Business Combinations. If an acquired set of assets and liabilities includes goodwill, the set is presumed to be a business. Based on an assessment of the relevant facts and circumstances, the Company concluded that the acquisition of its interests in Cerro Casale and Exeter in June 2017 did not meet the criteria of a business combination and the transactions have been accounted for as acquisitions of assets (note 3(a)).
Determination of control of subsidiaries and joint arrangements
Judgement is required to determine when the Company has control of subsidiaries or joint control of joint arrangements. This requires an assessment of the relevant activities of the investee, being those activities that significantly affect the investee's returns, including operating and capital expenditure decision-making, financing of the investee, and the appointment, remuneration and termination of key management personnel; and when the decisions in relation to those activities are under the control of the Company or require unanimous consent from the investors. During the second quarter of 2017, the Company entered into the following transactions which required judgement to determine when the Company has control of subsidiaries or joint control of joint arrangements:
a. Acquisition of Exeter
On June 7, 2017, based on the fact that Goldcorp has a majority ownership interest in Exeter, the majority of the Exeter board of directors were Goldcorp nominees and Exeter's key management personnel was comprised of officers appointed by Goldcorp, the Company concluded that it has control over Exeter. Accordingly, Exeter met the criteria to be classified as a subsidiary. Commencing at the acquisition date of June 7, 2017, the financial results of Exeter were included in the results of the consolidated group and the portion of Exeter's net assets that was not attributable to Goldcorp was accounted for as non-controlling interest as a separate component of equity (note 3(a)) up to August 2, 2017, when the Company acquired the remaining 16.8% of Exeter.
b. Accounting for the 50% interest in Cerro Casale and Caspiche
Based on assessment of the relevant facts and circumstances, primarily the requirement for unanimous agreement on management decisions relating to the development and operation of the arrangement, the Company concluded that the Cerro Casale/Caspiche Project is a jointly controlled entity. Judgement is also required when determining the classification of a joint arrangement as a joint venture or a joint operation through an evaluation of the rights and obligations arising from the arrangement. Despite the fact that the joint venture is a limited liability company and the parties do not have rights and obligations to individual assets and liabilities, the Company concluded that the Cerro Casale/Caspiche Project is a joint operation as the arrangement requires the owners to purchase the output on a pro rata basis, indicating that the entity has rights and obligations to the separate assets and liabilities of the joint entity. As such, the project has been proportionately consolidated with the results of the consolidated group (note 3(a)).
c. Acquisition of equity interest in Leagold
As Goldcorp owns greater than 20% of Leagold, Goldcorp is considered to have significant influence over Leagold, and therefore, is required to account for its interest in Leagold using the equity method (note 3(b)).

Third Quarter Report – 2017(In millions of United States dollars, except where noted)
GOLDCORP | 9
Income and value added taxes
The Company’s operations involve dealing with uncertainties and judgements in the application of complex tax regulations in multiple jurisdictions. The final income taxes paid and value added tax (“VAT”) refunds received are dependent upon many factors, including negotiations with taxing authorities in various jurisdictions and resolution of disputes arising from tax audits.
The Company recognizes potential liabilities and records tax liabilities for anticipated tax audit issues based on its judgement of whether, and the extent to which, additional taxes will be due. The Company adjusts these reserves in light of changing facts and circumstances; however, due to the complexity of some of these uncertainties, the ultimate resolution may result in a payment that is materially different from the Company’s current estimate of the tax liabilities. If the Company’s estimate of tax liabilities proves to be less than the ultimate assessment, an additional charge to expense would result. If the estimate of tax liabilities proves to be greater than the ultimate assessment, a tax benefit would result.
VAT receivables are generated on the purchase of supplies and services in several of the jurisdictions that the Company operates in. Timing and collection of VAT receivables is uncertain as VAT refund procedures in certain jurisdictions require a significant amount of information and follow-up. The Company is exposed to liquidity risk, credit risk and currency risk with respect to its VAT receivables if tax authorities are unwilling to make payments in a timely manner in accordance with the Company’s refund requests. The Company regularly monitors actual and projected collections of its VAT receivables to inform its assessment as to the collectability of the VAT receivables and classification as current and non-current assets.
In June 2017, the Mexican government’s tax authority indicated that it had experienced an increase in VAT refund requests and as a result had commenced more in-depth assessments of the requests. In light of this and the fact that the Company did not receive any VAT refunds from the Mexican government in the second quarter and received only $6 million in the third quarter of 2017 (second and third quarter of 2016 – $30 million and $28 million, respectively), the Company reassessed the collectability and classification of its Mexican VAT receivables and determined that no allowance was necessary. At September 30, 2017, the total VAT receivable due to the Company from Mexican tax authorities was $366 million (December 31, 2016 – $237 million), including the tax receivables retained on the sale of Los Filos. Subsequent to the third quarter, the Company received $85 million in VAT refund proceeds relating to Los Filos. If on review of the Company’s VAT refund requests, the Mexican tax authority disallows any portion of the Company’s VAT refund requests, an additional charge to expense would result.
3. ACQUISITIONS AND DIVESTITURES
(a) Agreements to acquire Cerro Casale and Caspiche Projects
On June 9, 2017, the Company completed the acquisition of a 50% interest in the Cerro Casale Project. The transaction was executed in multiple steps, including the acquisition of a 25% interest by Goldcorp in the project from each of Kinross Gold Corporation ("Kinross") and Barrick, which resulted in Barrick and Goldcorp each owning 50% of the project and subsequently forming a 50/50 joint operation with Barrick. The Cerro Casale Project is located in the Maricunga Gold Belt in the Atacama Region in northern Chile.
The Company also acquired 100% of the issued and outstanding shares of Exeter and its Caspiche Project, also located in the Maricunga Gold Belt. In the third quarter of 2017, after completing the acquisition of the 100% interest in Exeter, Goldcorp contributed the Caspiche Project into the joint operation with Barrick, which resulted in a 50% interest held by each of Barrick and Goldcorp in the Cerro Casale/Caspiche Project.
The key steps in the transactions were as follows:
• Acquisition of Kinross' 25% interest in Cerro Casale and 100% interest in the Quebrada Seca exploration project for: (i) an initial cash payment of $260 million; (ii) the granting of a 1.25% royalty interest to Kinross on 25% of gross revenues derived from metal production from Cerro Casale and Quebrada Seca, with Kinross foregoing the first $10 million payable; (iii) a contingent payment of $40 million payable after a decision to commence construction at Cerro Casale; and (iv) the assumption of a $20 million obligation to Barrick payable on commercial production at Cerro Casale.
• Acquisition of an additional 25% interest in Cerro Casale from Barrick for: (i) a deferred payment obligation of $260 million to be satisfied through the funding of 100% of the joint operation’s expenditures (as described below); (ii) the granting of a 1.25% royalty interest to Barrick on 25% of gross revenues derived from metal production from Cerro Casale and Quebrada Seca; (iii) a contingent payment of $40 million payable after a decision to commence construction at Cerro Casale; and (iv) the transfer to Barrick of a 50% interest in Quebrada Seca, followed by the joint contribution by Goldcorp and Barrick of 100% of Quebrada Seca to the joint operation.

Third Quarter Report – 2017(In millions of United States dollars, except where noted)
GOLDCORP | 10
• Acquisition of Exeter and its 100% owned Caspiche Project: under the terms of the supported takeover bid, Exeter shareholders received 0.12 of a common share of Goldcorp for each Exeter common share held. On June 7, 2017, the Company acquired 83.2% of the issued and outstanding common shares of Exeter for share consideration of $131 million in Goldcorp common shares and on August 7, 2017, the Company acquired the remaining 16.8% interest for share consideration of $25 million.
• Formation of a new 50/50 joint operation with Barrick: The joint operation includes a 100% interest in each of the Cerro Casale and Quebrada Seca projects. Additionally, the Caspiche Project was contributed to the joint operation after the Company acquired 100% of Exeter in the third quarter of 2017. 50% of Caspiche’s acquisition cost, or approximately $80 million, has been credited against Goldcorp’s deferred payment obligation to Barrick. Additionally, Goldcorp will be required to spend a minimum of $60 million in the two-year period following closing of the Cerro Casale transaction, and a minimum of $80 million in each successive two-year period until the deferred payment obligation is satisfied. If Goldcorp does not spend the minimum in any two-year period, Goldcorp will instead be required to make a payment to Barrick equal to 50% of the shortfall, with a corresponding reduction in the deferred payment obligation. As of September 30, 2017, the deferred payment obligation amounted to $185 million (December 31, 2016 – $nil).
The total amount of consideration paid for the acquisition of the 50% interest in the Cerro Casale and Quebrada Seca projects was $526 million, comprised of a $260 million initial cash payment to Kinross, the $260 million deferred payment obligation to Barrick and $6 million of transaction costs. The deferred obligation payment includes an annual price adjustment of 4.75% per annum. The royalty interests for future production and contingent payments to Barrick and Kinross stipulated in the agreements will be recognized as production costs and mining interests, respectively, if and when the obliging events occur.
The Company concluded the acquired assets and assumed liabilities of Cerro Casale did not constitute a business and accordingly the transaction was accounted for as an asset acquisition. The purchase price was allocated to the assets acquired and liabilities assumed on a relative fair value basis as follows: $449 million to mining interest, $59 million representing water rights classified as intangible asset, $21 million to tax receivables and $3 million to reclamation and other current liabilities. Additionally, the Company concluded that the Cerro Casale Project is a joint operation, as such, it has been proportionately consolidated with the results of the Company.
The Company issued common shares totaling $131 million in consideration for the Company's initial 83.2% interest in Exeter, which were valued using the closing price of Exeter's shares at the acquisition date, and transaction and other costs of $5 million. The Company concluded the acquired assets and assumed liabilities of Exeter did not constitute a business and accordingly the transaction was accounted for as an asset acquisition. The consideration paid was allocated to the assets acquired and liabilities assumed on a relative fair value basis with $160 million allocated to mining interests, and $3 million to working capital. At June 30, 2017, the portion of Exeter's net assets that was not attributable to Goldcorp was accounted for as a non-controlling interest, with a fair value of $27 million. Upon the acquisition of the remaining 16.8% ownership interest on August 2, 2017, the non-controlling interest was derecognized and the difference between the acquisition consideration of $25 million and the carrying amount of the non-controlling interest of $27 million was recognized as an increase to the Company's equity.
(b) Divestiture of Los Filos
On April 7, 2017, the Company completed the sale of Los Filos to Leagold and received total consideration of $350 million, before working capital adjustments. The consideration was comprised of $71 million of Leagold common shares, $250 million in cash and a $29 million short-term promissory note which was paid in July 2017. The Company also retained rights to certain VAT receivables of approximately $100 million. At September 30, 2017, the balance of the VAT receivables was $97 million (December 31, 2016 – $nil) and was included in other current assets on the Consolidated Balance Sheet. During the three and nine months ended September 31, 2017, $6 million of the VAT receivables was received, with an additional $85 million received in October 2017.
At December 31, 2016, the sale was considered highly probable; therefore, the assets and liabilities of Los Filos were classified as assets and liabilities held for sale and presented separately under current assets and current liabilities, respectively. In connection with the transaction, the Company recognized a net reversal for the 2015 impairment of mining interests of $43 million; an impairment reversal of $59 million was recognized during the year ended December 31, 2016 based on estimated proceeds from the sale. A subsequent impairment of $16 million was recognized during the three months ended March 31, 2017 based on changes to the carrying value of the Los Filos assets as a result of normal operations. There was no gain or loss on the disposition.

Third Quarter Report – 2017(In millions of United States dollars, except where noted)
GOLDCORP | 11
Total consideration, including working capital adjustments (net of transaction costs of $3 million) $ 348Net assets sold and derecognized:
Cash and cash equivalents 23Inventories and heap leach ore - current 143Other current assets 14 Inventories and heap leach ore - non-current 128 Mining interests 151Accounts payable and accrued liabilities (38)
Deferred tax liabilities (12) Provisions (56) Other (5)
348Gain (loss) on disposition $ —
Los Filos and Leagold are presented in Other in the segment information disclosure (note 4).
(c) Divestiture of Cerro Blanco
On May 31, 2017, the Company completed the sale of the Cerro Blanco Project in Guatemala to Bluestone Resources Inc. ("Bluestone") for total consideration of $22 million, comprised of $18 million in cash, and 3 million Bluestone common shares with a fair value of $4 million. Goldcorp will receive an additional $15 million cash payment from Bluestone upon declaration of commercial production at Cerro Blanco and a 1% net smelter return royalty on production.
During the first quarter of 2017, immediately prior to the classification to assets and liabilities as held for sale, the carrying amount of Cerro Blanco was remeasured to its recoverable amount, being its fair value less costs of disposal ("FVLCD"), based on the expected proceeds from the sale. As a result, the Company recorded an impairment reversal in the first quarter of $19 million. On completion of the sale, the Company recognized a loss on the disposal of $6 million, net of transaction costs of $1 million.
Cerro Blanco's assets and liabilities were presented in Other in the segment information disclosure up to the date of disposition (note 4).
(d) Divestiture of Camino Rojo
On June 21, 2017, the Company announced that it has entered into an agreement to sell its 100% interest in the Camino Rojo Project, part of the Peñasquito mine located in Mexico, to Orla Mining Ltd. ("Orla"). Under the terms of the agreement, the Company will receive 19.9% of the issued and outstanding shares of Orla and a 2% net smelter return royalty on revenues from all metal production from the Camino Rojo oxide project. The Company also has the option to acquire up to 70% interest in future sulphide projects, subject to certain criteria. The transaction is expected to close in the fourth quarter of 2017. The value of consideration received is expected to be credited to mining interests associated with Peñasquito, resulting in $nil gain or loss on disposition.
(e) Divestiture of San NicolasOn October 18, 2017, the Company sold its 21% interest in the San Nicolas copper-zinc project, a stand-alone project in Mexico, to Teck Resources Limited for cash consideration of $50 million. The carrying value of San Nicolas was nominal at September 30, 2017.

Third Quarter Report – 2017(In millions of United States dollars, except where noted)
GOLDCORP | 12
4. SEGMENT INFORMATION
Operating results of operating segments are reviewed by the Company's chief operating decision maker ("CODM") to make decisions about resources to be allocated to the segments and to assess their performance. The Company considers each individual mine site as operating segments for financial reporting purposes except as noted below.
Following the Company's acquisition and divestitures, and the closure of Marlin during the second quarter of 2017, the Company reassessed its segments for financial reporting purposes. The Company concluded that Marlin and Los Filos are no longer operating segments and are included in Other; they were previously included in the Other mines operating segment. The Company's 37.5% interest in Alumbrera, which was previously reported as Other associate, and Leagold are also presented in Other, because their financial results do not meet the quantitative threshold required for segment disclosure purposes. Prior periods' results have been re-presented to reflect the current presentation.
Assets in Other also include the Company's 100% interest in the Coffee Project, the Company's 50% interests in the NuevaUnión and the Cerro Casale/Caspiche projects, corporate assets and the Company's closed and inactive mines. Liabilities in Other include the Company's $1.0 billion notes, $1.5 billion notes, $185 million of deferred payment obligation (note 3(a)), net draws on the revolving credit facility, asset retirement obligations for closed and inactive mines and certain income taxes payable.
Significant information relating to the Company’s reportable operating segments is summarized in the tables below:
Revenues (a)(b) Production costsDepreciationand depletion
Earnings (loss) from operations, associates and
joint venture (b)(c)(d)Expenditures on mining interests
Three Months EndedSeptember 30 2017 2016 2017 2016 2017 2016 2017 2016 2017 2016Éléonore $ 95 $ 87 $ 59 $ 58 $ 33 $ 34 $ — $ (4) $ 25 $ 23Musselwhite 72 79 33 36 11 15 25 26 11 7Porcupine 89 85 54 48 32 21 (4) 17 24 11Red Lake 49 111 37 42 18 31 (6) 34 18 21Peñasquito 395 289 198 197 77 70 118 22 151 47Cerro Negro 166 147 75 60 72 59 15 26 20 24Pueblo Viejo 128 175 49 56 9 12 70 108 15 9Other 42 178 60 118 9 40 (70) (30) 25 24Attributable segment total 1,036 1,151 565 615 261 282 148 199 289 166Excluding attributable amounts from associates and joint venture (170) (236) (106) (92) (11) (15) (24) (82) (24) (12)Consolidated total $ 866 $ 915 $ 459 $ 523 $ 250 $ 267 $ 124 $ 117 $ 265 $ 154

Third Quarter Report – 2017(In millions of United States dollars, except where noted)
GOLDCORP | 13
Revenues (a)(b) Production costsDepreciationand depletion
Earnings (loss) from operations, associates and
joint venture (b)(c)(d)Expenditures onmining interests
Nine Months EndedSeptember 30 2017 2016 2017 2016 2017 2016 2017 2016 2017 2016Éléonore $ 269 $ 264 $ 181 $ 177 $ 97 $ 107 $ (13) $ (19) $ 83 $ 62Musselwhite 210 234 109 102 31 47 63 80 36 19Porcupine 241 267 155 143 86 56 (12) 64 74 41Red Lake 189 301 132 136 62 90 (9) 59 55 76Peñasquito 1,086 682 564 516 216 165 302 (1) 304 167Cerro Negro 436 442 194 185 190 172 44 75 58 75Pueblo Viejo 403 439 144 150 29 32 230 258 34 28Other 296 599 249 425 62 143 (98) (152) 61 55Attributable segment total 3,130 3,228 1,728 1,834 773 812 507 364 705 523Excluding attributableamounts from associates andjoint venture (560) (616) (293) (284) (38) (42) (132) (179) (39) (30)Consolidated total $ 2,570 $ 2,612 $ 1,435 $ 1,550 $ 735 $ 770 $ 375 $ 185 $ 666 $ 493
At September 30, 2017 Assets Liabilities Net AssetsÉléonore $ 2,730 $ 277 $ 2,453Musselwhite 834 159 675Porcupine 1,018 256 762Red Lake 2,538 288 2,250Peñasquito 8,312 3,066 5,246Cerro Negro 3,390 743 2,647Pueblo Viejo 1,181 — 1,181Other (notes 3(a) and (c)) (e) 1,935 3,190 (1,255)Total $ 21,938 $ 7,979 $ 13,959
At December 31, 2016 Assets Liabilities Net AssetsÉléonore $ 2,759 $ 356 $ 2,403Musselwhite 774 153 621Porcupine 1,028 260 768Red Lake 2,526 342 2,184Peñasquito 8,011 3,033 4,978Cerro Negro 3,536 738 2,798Pueblo Viejo 1,123 — 1,123Other (e) 1,740 3,200 (1,460)Total $ 21,497 $ 8,082 $ 13,415
(a) The Company’s principal product is gold bullion which is sold primarily in the London spot market. Concentrate produced at Peñasquito and Alumbrera, containing both gold and by-product metals, is sold to third party smelters and traders. The Company’s consolidated revenues (excluding attributable share of revenues from Pueblo Viejo and Alumbrera) for the three and nine months ended September 30 were derived from the following:

Third Quarter Report – 2017(In millions of United States dollars, except where noted)
GOLDCORP | 14
Three Months Ended September 30
Nine Months Ended September 30
2017 2016 2017 2016Gold $ 628 73% $ 716 78% $ 1,916 75% $ 2,148 82%Silver 90 10% 119 13% 282 11% 289 11%Zinc 117 14% 60 7% 296 12% 134 5%Lead 30 3% 19 2% 66 2% 38 2%Copper 1 —% 1 —% 10 —% 3 —% $ 866 100% $ 915 100% $ 2,570 100% $ 2,612 100%
Certain of the Company's mines (including the Company's associates and joint operations) supplemented their gold revenues with the sale of other metals as shown in the table below:
Three Months Ended September 30 Peñasquito Cerro Negro Pueblo Viejo OtherGold 2017 $ 172 $ 151 $ 121 $ 14
2016 $ 133 $ 131 $ 168 $ 66Silver 2017 75 15 7 1
2016 76 16 7 27Zinc 2017 117 — — —
2016 60 — — —Lead 2017 30 — — —
2016 19 — — —Copper 2017 1 — — 12
2016 1 — — 28Molybdenum 2017 — — — —
2016 — — — 2Total 2017 $ 395 $ 166 $ 128 $ 27 2016 $ 289 $ 147 $ 175 $ 123
Nine Months Ended September 30 Peñasquito Cerro Negro Pueblo Viejo OtherGold 2017 $ 509 $ 395 $ 381 $ 115
2016 $ 340 $ 395 $ 423 $ 201Silver 2017 205 41 22 38
2016 167 47 15 74Zinc 2017 296 — — —
2016 134 — — —Lead 2017 66 — — —
2016 38 — — —Copper 2017 10 — — 60
2016 3 — 1 83Molybdenum 2017 — — — 3
2016 — — — 3Total 2017 $ 1,086 $ 436 $ 403 $ 216 2016 $ 682 $ 442 $ 439 $ 361

Third Quarter Report – 2017(In millions of United States dollars, except where noted)
GOLDCORP | 15
(b) Intersegment sales and transfers are eliminated in the above information reported to the Company’s CODM. For the three and nine months ended September 30, 2017, intersegment purchases included $128 million and $403 million, respectively, of gold and silver ounces purchased from Pueblo Viejo (three and nine months ended September 30, 2016 – $175 million and $438 million, respectively) and revenues related to the sale of these ounces to external third parties were $128 million and $403 million, respectively (three and nine months ended September 30, 2016 – $175 million and $438 million, respectively).
(c) A reconciliation of attributable segment total earnings from operations, associates and joint venture to the Company's earnings before taxes per the Condensed Interim Consolidated Statements of Earnings is as follows:
Three Months EndedSeptember 30
Nine Months Ended September 30
2017 2016 2017 2016Attributable segment total earnings from operations, associatesand joint venture $ 148 $ 199 $ 507 $ 364Adjustment to account for Pueblo Viejo, NuevaUnión, Leagold andAlumbrera on an equity method basis (24) (82) (132) (179)Gain on derivatives, net — 1 5 2Loss on disposition of mining interest, net of transaction costs — — (6) —Finance costs (31) (34) (104) (103)Other (expense) income, net (1) 5 22 (1)Earnings before taxes $ 92 $ 89 $ 292 $ 83
(d) During the three and nine months ended September 30, 2016, $6 million and $24 million, respectively, of corporate restructuring costs (note 6) were included in Other. There were no restructuring costs included in Other in the three and nine months ended September 30, 2017.
(e) On February 15, 2017, the Company paid cash consideration of $65 million and recognized a $2 million loss on the acquisition of the 4% gold stream on the El Morro deposit, part of the Company's NuevaUnión joint venture, from New Gold Inc. eliminating the Company's liability to New Gold Inc.
5. PRODUCTION COSTS
Three Months Ended September 30
Nine Months Ended September 30
2017 2016 2017 2016Raw materials and consumables $ 193 $ 256 $ 631 $ 707Salaries and employee benefits (a) 118 121 364 383Contractors 99 103 308 302Royalties 19 23 60 49Transportation costs 12 8 35 24Write down of inventories to net realizable value — — 12 2Change in inventories (5) (6) (41) 1Other 23 18 66 82 $ 459 $ 523 $ 1,435 $ 1,550
(a) Salaries and employee benefits exclude $16 million and $44 million of salaries and employee benefits included in corporate administration in the Condensed Interim Consolidated Statements of Earnings for the three and nine months ended September 30, 2017, respectively (three and nine months ended September 30, 2016 – $20 million and $56 million, respectively). Salaries and employee benefits also exclude amounts related to restructuring activities incurred at mine sites of $1 million and $4 million for the three and nine months ended September 30, 2017, respectively (three and nine months ended September 30, 2016 – $nil and $23 million, respectively). These costs are presented separately as restructuring costs in the Condensed Interim Consolidated Statements of Earnings (note 6).

Third Quarter Report – 2017(In millions of United States dollars, except where noted)
GOLDCORP | 16
6. RESTRUCTURING COSTS
The Company incurred $1 million and $4 million in restructuring costs during the three and nine months ended September 30, 2017, respectively (three and nine months ended September 30, 2016 – $6 million and $45 million, respectively), of which $nil related to the accelerated vesting of share-based compensation (three and nine months ended September 30, 2016 – $nil and $2 million, respectively). The restructuring costs relate primarily to severance costs associated with involuntary and voluntary workforce reduction initiatives to improve efficiencies at mine sites and corporate offices. At September 30, 2017, $2 million (December 31, 2016 – $16 million) of the restructuring costs was included in accrued liabilities. During the three and nine months ended September 30, 2017, $nil and $18 million, respectively (three and nine months ended September 30, 2016 – $11 million and $29 million, respectively) of the accrued liabilities was paid.
7. INCOME TAXES
Three Months Ended September 30
Nine Months Ended September 30
2017 2016 2017 2016Current income tax expense $ 70 $ 4 $ 187 $ 77Deferred income tax (recovery) expense (89) 26 (311) (55)Income tax (recovery) expense $ (19) $ 30 $ (124) $ 22
The income tax rate for the three months ended September 30, 2017 was negative 21% (three months ended September 30, 2016 – 34%). After adjusting income tax expense for the impacts of foreign exchange gains on the translation of deferred income tax assets and liabilities of $19 million (foreign exchange losses for the three months ended September 30, 2016 – $30 million), tax deductible Argentine Peso denominated foreign exchange losses on US dollar debt of $21 million (three months ended September 30, 2016 – $8 million), and other tax recovery items of $11 million (three months ended September 30, 2016 – $10 million), and adjusting the earnings before taxes for net non-taxable items of $21 million including non-deductible share based compensation expense (three months ended September 30, 2016– $35 million), the effective tax rate for the three months ended September 30, 2017 was 45% (three months ended September 30, 2016– 33%).
The income tax rate for the nine months ended September 30, 2017 was negative 42% (nine months ended September 30, 2016 – 27%). After adjusting income tax expense for the impacts of foreign exchange gains on the translation of deferred income tax assets and liabilities of $100 million (foreign exchange losses for the nine months ended September 30, 2016 – $121 million), tax deductible Argentine Peso denominated foreign exchange losses on US dollar debt of $46 million (nine months ended September 30, 2016 – $79 million), and other tax recovery items of $31 million (nine months ended September 30, 2016 – $30 million), and adjusting the earnings before taxes for net non-taxable items of $102 million including non-deductible share based compensation expense (nine months ended September 30, 2016– $68 million), the effective tax rate for the nine months ended September 30, 2017 was 28% (nine months ended September 30, 2016 – 67%).
8. OTHER (EXPENSES) INCOME , NET
Three Months Ended September 30
Nine Months Ended September 30
2017 2016 2017 2016Foreign exchange (loss) gain $ (11) $ (12) $ 6 $ (59)Finance income 10 12 29 38Gains on sale of investments 8 12 16 23Other (8) (7) (29) (3) $ (1) $ 5 $ 22 $ (1)

Third Quarter Report – 2017(In millions of United States dollars, except where noted)
GOLDCORP | 17
9. PER SHARE INFORMATION
(a) Net earnings per share
Net earnings per share for the three and nine months ended September 30, 2017 was calculated based on basic and diluted net earnings of $111 million and $416 million, respectively (three and nine months ended September 30, 2016 – net earnings of $59 millionand $61 million, respectively) and the weighted average number of shares outstanding used in the calculation were based on the following:
Three Months Ended September 30
Nine Months Ended September 30
(in millions) 2017 2016 2017 2016Basic weighted average number of shares outstanding 866 849 859 837Effect of dilutive stock options and restricted share units 3 4 3 4Diluted weighted average number of shares outstanding 869 853 862 841
The outstanding equity instruments that could potentially dilute basic earnings per share in the future, but were not included in the calculation of diluted net earnings per share for the three and nine months ended September 30, 2017 because they were anti-dilutive, were 7 million stock options (three and nine months ended September 30, 2016 – 8 million) and nil restricted share units (three and nine months ended September 30, 2016 – nil).
(b) Dividends declared
On February 25, 2016, the Company announced a quarterly dividend of $0.02 per share, effective April 1, 2016, with the first payment in June 2016. During the three and nine months ended September 30, 2017, the Company declared dividends of $0.02 per share and $0.06 per share for total dividends of $17 million and $52 million, respectively (three and nine months ended September 30, 2016 – $0.02 per share and $0.10 per share for dividends of $16 million and $84 million, respectively).
During the three and nine months ended September 30, 2017, the Company issued $2 million and $6 million, respectively (three and nine months ended September 30, 2016 – $2 million and $3 million, respectively) in common shares under the Company's Dividend Reinvestment Plan.
10. SUPPLEMENTAL CASH FLOW INFORMATION
At September 30
2017At December 31
2016Cash and cash equivalents are comprised of:
Cash $ 154 $ 146Short-term money market investments 1 11
$ 155 $ 157
Three Months Ended September 30
Nine Months Ended September 30
2017 2016 2017 2016Decrease (increase) in working capital
Accounts receivable decrease (increase) $ 3 $ (41) $ (34) $ (42)Inventories (increase) decrease (5) 5 (34) 20Sales and indirect taxes recoverable increase (35) (1) (60) (53)Accounts payable and accrued liabilities increase (decrease) 81 (7) 73 (116)Income taxes payable increase (decrease), net of income taxes receivable 25 (16) 22 (4)Other (12) 28 (10) 46
$ 57 $ (32) $ (43) $ (149)

Third Quarter Report – 2017(In millions of United States dollars, except where noted)
GOLDCORP | 18
Three Months EndedSeptember 30
Nine Months Ended September 30
2017 2016 2017 2016Operating activities include the following cash received (paid):
Interest received $ 1 $ 42 $ 26 $ 76Interest paid (21) (25) (67) (66)Income taxes refunded — — 9 14Income taxes paid (52) (23) (161) (109)
Investing activities include the following cash received (paid):Net proceeds (purchases) of short-term investments and available-for-sale securities Purchases of short-term investments $ — $ (5) $ (43) $ (48) Proceeds from maturity of short-term investments 3 — 46 63 Purchases of available-for-sale securities (5) — (58) (19) Proceeds from sale of available-for-sale securities 11 27 24 53
$ 9 $ 22 $ (31) $ 49
11. MINING INTERESTS – OWNED BY SUBSIDIARIES AND JOINT OPERATIONS
Mining properties
Depletable Non-depletable
Reservesand
resources
Reservesand
resourcesExploration
potentialPlant and
equipment (e) TotalCostAt January 1, 2017 $ 12,668 $ 4,670 $ 7,225 $ 6,757 $ 31,320Acquisition of mining interest (note 3(a)) — 529 — 2 531Expenditures on mining interests (a)(b)(c) 290 115 — 332 737Transfers and other movements (30) (36) (5) (44) (115)At September 30, 2017 12,928 5,278 7,220 7,047 32,473Accumulated depreciation and depletion andimpairmentAt January 1, 2017 (5,780) (2,510) (2,263) (3,202) (13,755)Depreciation and depletion (d) (450) — — (288) (738)Impairment reversal (note 3(c)) — 18 — 1 19Transfers and other movements (2) — — 63 61At September 30, 2017 (6,232) (2,492) (2,263) (3,426) (14,413)Carrying amount – At September 30, 2017 $ 6,696 $ 2,786 $ 4,957 $ 3,621 $ 18,060

Third Quarter Report – 2017(In millions of United States dollars, except where noted)
GOLDCORP | 19
Mining properties
Depletable Non-depletable
Reservesand
resources
Reservesand
resourcesExploration
potentialPlant and
equipment (e) TotalCostAt January 1, 2016 $ 11,964 $ 4,346 $ 7,991 $ 6,733 $ 31,034Acquisition of mining interest — 386 — — 386Expenditures on mining interests 335 96 — 243 674Reclassifications to asset held for sale (note 3(b)) (509) — (13) (191) (713)Transfers and other movements 878 (158) (753) (28) (61)At December 31, 2016 12,668 4,670 7,225 6,757 31,320Accumulated depreciation and depletion andimpairmentAt January 1, 2016 (5,608) (2,510) (2,263) (3,023) (13,404)Depreciation and depletion (599) — — (397) (996)Reclassifications to asset held for sale (note 3(b)) 368 — — 178 546Impairment reversal (loss), net 58 — — (6) 52Transfers and other movements 1 — — 46 47At December 31, 2016 (5,780) (2,510) (2,263) (3,202) (13,755)Carrying amount – At December 31, 2016 $ 6,888 $ 2,160 $ 4,962 $ 3,555 $ 17,565
A summary by property of the carrying amount of mining interests owned by subsidiaries and joint operations is as follows:
Mining properties
Depletable Non-depletable
Reservesand
resources
Reservesand
resourcesExploration
potentialPlant and equipment
(e)At September 30
2017At December 31
2016Éléonore $ 1,597 $ 85 $ — $ 935 $ 2,617 $ 2,643Musselwhite 244 16 56 173 489 477Porcupine 331 187 222 123 863 872Red Lake 790 693 411 375 2,269 2,260Coffee — 422 — 1 423 399Peñasquito 2,440 783 3,372 1,138 7,733 7,603Cerro Negro 1,294 61 896 777 3,028 3,166Cerro Casale and Caspiche — 537 — 2 539 —Corporate and other (note 3(c)) — 2 — 97 99 145 $ 6,696 $ 2,786 $ 4,957 $ 3,621 $ 18,060 $ 17,565

Third Quarter Report – 2017(In millions of United States dollars, except where noted)
GOLDCORP | 20
(a) Exploration, evaluation and project costs incurred by the Company during the three and nine months ended September 30 were as follows:
Three Months Ended September 30
Nine Months Ended September 30
2017 2016 2017 2016Total exploration, evaluation and project expenditures $ 32 $ 27 $ 81 $ 75Less: amounts capitalized to mining interests (13) (20) (41) (51)Total exploration, evaluation and project costs recognized in theCondensed Interim Consolidated Statements of Earnings $ 19 $ 7 $ 40 $ 24
(b) Expenditures on mining interests include finance lease additions, capitalized borrowing costs and deposits on mining interests, and are net of investment tax credits and exclude capitalized reclamation and closure costs. The following is a reconciliation of capitalized expenditures on mining interests to expenditures on mining interests in the Condensed Interim Consolidated Statements of Cash Flows:
Three Months EndedSeptember 30
Nine Months Ended September 30
2017 2016 2017 2016Capitalized expenditures on mining interests including associates andjoint venture $ 302 $ 153 $ 755 $ 472Interest paid (12) (6) (27) (21)(Increase) decrease in accrued expenditures (25) 7 (62) 42Expenditures on mining interests per Condensed InterimConsolidated Statements of Cash Flows $ 265 $ 154 $ 666 $ 493
(c) Includes capitalized borrowing costs incurred during the three and nine months ended September 30 as follows:
Three Months EndedSeptember 30
Nine Months Ended September 30
2017 2016 2017 2016Red Lake - Cochenour $ 6 $ 6 $ 17 $ 17Cerro Casale/Caspiche Project 6 — 6 —Porcupine - Borden Project 3 1 3 2Peñasquito - Pyrite Leach Project 1 — 3 —Other 2 — 2 —
$ 18 $ 7 $ 31 $ 19
(d) A reconciliation of depreciation and depletion during the three and nine months ended September 30 to depreciation and depletion recognized in the Condensed Interim Consolidated Statements of Earnings is as follows:
Three Months Ended September 30
Nine Months Ended September 30
2017 2016 2017 2016Total depreciation and depletion $ 256 $ 265 $ 738 $ 747Less: amounts capitalized to mining interests (1) (1) (4) (11)Changes in amounts allocated to ending inventories (5) 3 1 34Total depreciation and depletion recognized in the Condensed InterimConsolidated Statements of Earnings $ 250 $ 267 $ 735 $ 770
(e) At September 30, 2017, assets not yet ready for intended use, and therefore not yet being depreciated, included in the carrying amount of plant and equipment amounted to $459 million (December 31, 2016 – $309 million).

Third Quarter Report – 2017(In millions of United States dollars, except where noted)
GOLDCORP | 21
12. MINING INTERESTS – INVESTMENTS IN ASSOCIATES AND JOINT VENTURE
At September 30, 2017, the Company had a 40% interest in Pueblo Viejo, a 50% interest in NuevaUnión, a 22.9% interest in Leagold (included in "Other") and a 37.5% interest in Alumbrera (included in "Other"). These investments are accounted for using the equity method and included in mining interests. The Company adjusts each associate and joint venture’s financial results, where appropriate, to give effect to uniform accounting policies.
The following table summarizes the change in the carrying amount of the Company's investments in associates and joint venture:
Pueblo Viejo (a) NuevaUnión Other (b) TotalAt January 1, 2017 $ 1,123 $ 884 $ — $ 2,007Company’s share of net earnings of associates and joint venture 94 1 — 95Acquisition of interest in Leagold (note 3(b)) — — 71 71Capital investment — 18 — 18Return of capital investment (43) — — (43)Other 7 — — 7At September 30, 2017 $ 1,181 $ 903 $ 71 $ 2,155
At January 1, 2016 $ 967 $ 872 $ — $ 1,839Company’s share of net earnings of associates and joint venture 169 2 — 171Capital investment — 10 — 10Return of capital investment (24) — — (24)Other 11 — — 11At December 31, 2016 $ 1,123 $ 884 $ — $ 2,007
(a) At September 30, 2017, the carrying amount of the Company's share of shareholder loans to Pueblo Viejo was $503 million (December 31, 2016 – $537 million), which is included in the Company's investments in associates and is being accreted to the face value over the term of the loans. Included in other current assets of the Company was a total of $26 million (December 31, 2016 – $31 million) in interest receivable relating to the shareholder loan.
(b) During the three and nine months ended September 30, 2017, the Company recognized a reduction of $nil and $33 million (three and nine months ended September 30, 2016 – $nil) in the Company's provision to fund its share of Alumbrera's reclamation and closure cost obligations which has been classified as Share of Net Earnings Related to Associate and Joint Venture in the Condensed Interim Consolidated Statements of Earnings. The reduction in the provision reflects the expectation that Alumbrera will be able to fund a greater portion of its reclamation costs than previously estimated due to improved financial results, primarily as a result of higher realized copper prices.

Third Quarter Report – 2017(In millions of United States dollars, except where noted)
GOLDCORP | 22
13. FINANCIAL INSTRUMENTS AND RELATED RISKS
(a) Financial assets and liabilities by categories
At September 30, 2017Loans and
receivablesAvailable-
for-sale
Fair valuethrough
profit or loss
Held tomaturity/other
financialliabilities
Effectivehedging
instruments TotalFinancial assetsCash and cash equivalents $ — $ — $ 155 $ — $ — $ 155Short-term investments 40 — — — — 40Accounts receivable arising fromsales of metal concentrates — — 110 — — 110Investments in securities — 134 — — — 134Derivative assets designated ashedging instruments — — — — 9 9Derivative assets not designatedas hedging instruments — — 11 — — 11Other current and non-currentfinancial assets 42 — — — — 42Total financial assets $ 82 $ 134 $ 276 $ — $ 9 $ 501Financial liabilitiesDebt $ — $ — $ — $ (2,582) $ — $ (2,582)Deferred payment obligation — — — (185) — (185)Accounts payable and accruedliabilities — — — (618) — (618)Other current and non-currentfinancial liabilities — — — (257) — (257)Total financial liabilities $ — $ — $ — $ (3,642) $ — $ (3,642)
At December 31, 2016Loans and
receivablesAvailable-
for-sale
Fair valuethrough profit
or loss
Held to maturity/other financial
liabilities
Effectivehedging
instruments TotalFinancial assetsCash and cash equivalents $ — $ — $ 157 $ — $ — $ 157Short-term investments 43 — — — — 43Accounts receivable arising fromsales of metal concentrates — — 77 — — 77Investments in securities — 114 — — — 114Derivative assets not designated ashedging instruments — — 7 — — 7Other current and non-currentfinancial assets 39 — — — — 39Total financial assets $ 82 $ 114 $ 241 $ — $ — $ 437Financial liabilitiesDebt $ — $ — $ — $ (2,510) $ — $ (2,510)Accounts payable and accruedliabilities — — — (478) — (478)Derivative liabilities not designatedas hedging instruments — — (22) — — (22)Other current and non-currentfinancial liabilities — — — (259) — (259)Total financial liabilities $ — $ — $ (22) $ (3,247) $ — $ (3,269)
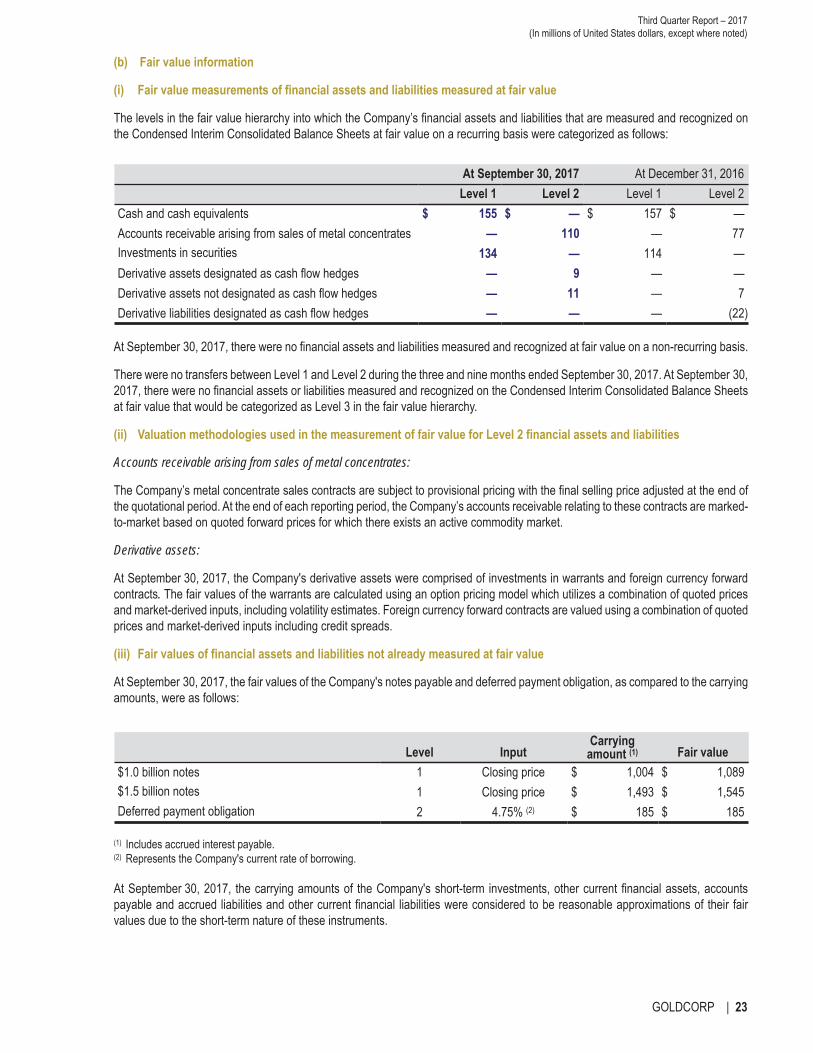
Third Quarter Report – 2017(In millions of United States dollars, except where noted)
GOLDCORP | 23
(b) Fair value information
(i) Fair value measurements of financial assets and liabilities measured at fair value
The levels in the fair value hierarchy into which the Company’s financial assets and liabilities that are measured and recognized on the Condensed Interim Consolidated Balance Sheets at fair value on a recurring basis were categorized as follows:
At September 30, 2017 At December 31, 2016 Level 1 Level 2 Level 1 Level 2
Cash and cash equivalents $ 155 $ — $ 157 $ —Accounts receivable arising from sales of metal concentrates — 110 — 77Investments in securities 134 — 114 —Derivative assets designated as cash flow hedges — 9 — —Derivative assets not designated as cash flow hedges — 11 — 7Derivative liabilities designated as cash flow hedges — — — (22)
At September 30, 2017, there were no financial assets and liabilities measured and recognized at fair value on a non-recurring basis.
There were no transfers between Level 1 and Level 2 during the three and nine months ended September 30, 2017. At September 30, 2017, there were no financial assets or liabilities measured and recognized on the Condensed Interim Consolidated Balance Sheets at fair value that would be categorized as Level 3 in the fair value hierarchy.
(ii) Valuation methodologies used in the measurement of fair value for Level 2 financial assets and liabilities
Accounts receivable arising from sales of metal concentrates:
The Company’s metal concentrate sales contracts are subject to provisional pricing with the final selling price adjusted at the end of the quotational period. At the end of each reporting period, the Company’s accounts receivable relating to these contracts are marked-to-market based on quoted forward prices for which there exists an active commodity market.
Derivative assets:
At September 30, 2017, the Company's derivative assets were comprised of investments in warrants and foreign currency forward contracts. The fair values of the warrants are calculated using an option pricing model which utilizes a combination of quoted prices and market-derived inputs, including volatility estimates. Foreign currency forward contracts are valued using a combination of quoted prices and market-derived inputs including credit spreads.
(iii) Fair values of financial assets and liabilities not already measured at fair value
At September 30, 2017, the fair values of the Company's notes payable and deferred payment obligation, as compared to the carrying amounts, were as follows:
Level InputCarrying
amount (1) Fair value$1.0 billion notes 1 Closing price $ 1,004 $ 1,089$1.5 billion notes 1 Closing price $ 1,493 $ 1,545Deferred payment obligation 2 4.75% (2) $ 185 $ 185
(1) Includes accrued interest payable.(2) Represents the Company's current rate of borrowing.
At September 30, 2017, the carrying amounts of the Company's short-term investments, other current financial assets, accounts payable and accrued liabilities and other current financial liabilities were considered to be reasonable approximations of their fair values due to the short-term nature of these instruments.

Third Quarter Report – 2017(In millions of United States dollars, except where noted)
GOLDCORP | 24
(c) Financial instruments and related risks
The Company manages its exposure to financial risks, including credit risk, liquidity risk, currency risk, interest rate risk and price risk, in accordance with its Financial Risk Management Policy. The Company's exposures to financial risks and how the Company manages each of those risks are described in note 27(e) to the Company's consolidated financial statements for the year ended December 31, 2016. There were no significant changes to the Company's exposures to those risks or to the Company's management of its exposures during the three and nine months ended September 30, 2017 except as noted below.
(i) Liquidity risk
During the three and nine months ended September 30, 2017, the Company generated cash flows from operations, one of the Company's main sources of liquidity, of $315 million and $700 million, respectively (three and nine months ended September 30, 2016 – $267 million and $560 million, respectively). At September 30, 2017, Goldcorp held cash and cash equivalents of $155 million(December 31, 2016 – $157 million) and short-term investments of $40 million (December 31, 2016 – $43 million). At September 30, 2017, the Company's working capital, defined as current assets less current liabilities, was negative $3 million (December 31, 2016– positive $791 million), which was primarily due to the timing of payments to vendors and an increase in payables related to an expansion project at Peñasquito. At December 31, 2016, $430 million of the total working capital was comprised of the Company's net assets held for sale (notes 3(b)).
During the second quarter of 2017, the Company extended the term of its $3.0 billion revolving credit facility to June 22, 2022. At September 30, 2017, the balance outstanding on the revolving credit facility was $100 million (December 31, 2016 – $30 million) with $2.9 billion available for the Company's use (December 31, 2016 – $2.97 billion). Certain of the Company's borrowings are subject to various financial and general covenants with which the Company was in compliance at September 30, 2017.
At September 30, 2017, the Company had letters of credit outstanding in the amount of $426 million (December 31, 2016 – $423 million) of which $326 million (December 31, 2016 – $303 million) represented guarantees for reclamation obligations. The Company's capital commitments for the next twelve months amounted to $408 million at September 30, 2017, including the Company's funding obligation for the Cerro Casale/Caspiche Project for the next twelve months. Additionally, during the three months ended September 30, 2017, the Company entered into an agreement with a certain vendor to construct the Coffee Project and manage its initial two years of operation. The total capital and operating commitments under the agreement are $346 million and $328 million, respectively, with the majority of the amount to be spent evenly throughout 2019 to 2023.
(ii) Market risk
Currency risk
During the three and nine months ended September 30, 2017, the Company recognized a net foreign exchange loss of $11 million and net gain of $6 million, respectively (three and nine months ended September 30, 2016 – loss of $12 million and $59 million, respectively), and a net foreign exchange gain of $24 million and $87 million, respectively in income tax expense on income taxes receivable (payable) and deferred income taxes (three and nine months ended September 30, 2016 – loss of $27 million and $108 million). Based on the Company’s net foreign currency exposures at September 30, 2017, depreciation or appreciation of applicable foreign currencies against the US dollar would have resulted in the following decrease or increase in the Company's net earnings:
At September 30, 2017 Possible exposure (1)(2)
Impact on earningsexcluding currency
exposure related to taxes
Impact on earnings fromforeign exchange
exposure related to taxesCanadian dollar 10% $ 17 $ 132Mexican peso 15% 32 65Argentine peso 15% 13 82
(1) Calculated based on fluctuations of foreign exchange rates during the twelve months ended December 31, 2016.

Third Quarter Report – 2017(In millions of United States dollars, except where noted)
GOLDCORP | 25
14. CONTINGENCIES
Due to the size, complexity and nature of the Company’s operations, various legal, tax, environmental and regulatory matters are outstanding from time to time. By their nature, contingencies will only be resolved when one or more future events occur or fail to occur. The assessment of contingencies inherently involves the exercise of significant judgment and estimates of the outcome of future events. While the outcomes of these matters are uncertain, based upon the information currently available and except as noted in note 31(b) of the audited consolidated financial statements for the year ended December 31, 2016, the Company does not believe that these matters in aggregate will have a material adverse effect on its consolidated financial position, cash flows or results of operations. In the event that management’s estimate of the future resolution of these matters changes, the Company will recognize the effects of these changes in its consolidated financial statements in the appropriate period relative to when such changes occur. There were no significant changes to the Company's contingencies as disclosed in note 31 of its audited consolidated financial statements for the year ended December 31, 2016 except as noted below:
(a) Securities Class Action Lawsuits
United States shareholder class action lawsuit
Following the publication on August 24, 2016 of a news article relating to operations at the Company’s Peñasquito mine, several putative class action lawsuits were filed against the Company and certain of its current and former officers in the U.S. District Court for the Central District of California and one class action lawsuit was filed in the U.S. District Court for the Southern District of New York. On November 21, 2016, a lead plaintiff (“Plaintiff”) was appointed and all claims were consolidated into one action in the U.S. District Court for the Central District of California. On December 8, 2016, the Plaintiff filed an Amended Class Action Complaint and on December 22, 2016, the Plaintiff filed a Corrected Amended Class Action Complaint (the “Amended Complaint”). The Amended Complaint alleges that the Company and certain of its current and former officers made materially false or misleading statements or materially false omissions in violation of Sections 10(b) and 20(a) of the Securities Exchange Act of 1934, as amended (the “Exchange Act”) concerning the Peñasquito mine. The Amended Complaint purports to be brought on behalf of persons who purchased or otherwise acquired the Company’s securities during an alleged class period from March 31, 2014 to October 3, 2016. On January 20, 2017, the Company filed a motion to dismiss the Amended Complaint. On September 6, 2017, the U.S. District Court for the Central District of California issued an order dismissing the action but permitted the Plaintiff to file a second amended complaint by September 28, 2017. On September 28, 2017, the Plaintiff filed a notice of intent not to file a second amended complaint. The matter is now closed.
Canadian shareholder class action lawsuit
On October 28, 2016 and February 14, 2017, separate proposed class actions were commenced in the Ontario Superior Court of Justice pursuant to the Class Proceedings Act (Ontario) against the Company and certain of its current and former officers. Both statement of claims alleged common law negligent misrepresentation in the Company’s public disclosure concerning the Peñasquito mine and also pleaded an intention to seek leave from the Court to proceed with an allegation of statutory misrepresentation pursuant to the secondary market civil liability provisions under the Securities Act (Ontario). By a consent order, the latter lawsuit will proceed, and the former action has been stayed. The active lawsuit purports to be brought on behalf of persons who acquired the Company's securities in the secondary market during an alleged class period from October 30, 2014 to August 23, 2016. The Company believes the allegations made in the claim are without merit and intends to vigorously defend against this matter.
(b) State of Zacatecas’ ecological tax
In December 2016, the State of Zacatecas in Mexico approved new environmental taxes that became effective January 1, 2017. Certain operations at the Company’s Peñasquito mine may be subject to these taxes. Payments are due monthly in arrears with the first payment due on February 17, 2017. The legislation provides little direction for how the taxes are to be calculated and therefore, the Company is not able to estimate the amount of the taxes with sufficient reliability.
Further, the Company believes that there is no legal basis for the taxes and filed legal claims challenging their constitutionality and legality on March 9, 2017. Other companies similarly situated also filed legal claims against the taxes and the Mexican federal government has filed a claim before the National Supreme Court against the State of Zacatecas challenging whether the State of Zacatecas had the constitutional authority to implement the taxes.
As the Company is not able to estimate the amount of the taxes with sufficient reliability, no amounts have been recorded for any potential liability.

Third Quarter Report – 2017
GOLDCORP | 26
CORPORATE OFFICE STOCK EXCHANGE LISTING
Park Place Toronto Stock Exchange: GSuite 3400 – 666 Burrard Street New York Stock Exchange: GGVancouver, BC V6C 2X8 CanadaTel: (604) 696-3000 TRANSFER AGENTFax: (604) 696-3001www.goldcorp.com AST Trust Company (Canada)
1066 West Hastings Street, Suite 1600TORONTO OFFICE Vancouver, BC V6E 3X1 Canada
Toll free in Canada and the US: (800) 387-0825Suite 3201 – 130 Adelaide Street West Outside of Canada and the US: (416) 682-3860Toronto, ON M5H 3P5 Canada [email protected]: (416) 865-0326 www.canstockta.comFax: (416) 359-9787
AUDITORSMEXICO OFFICE
Deloitte LLPPaseo de las Palmas 425-15 Vancouver, BCLomas de Chapultepec11000 Mexico, D.F. INVESTOR RELATIONSTel: 52 (55) 5201-9600
Etienne MorinGUATEMALA OFFICE Toll free: (800) 567-6223
Email: [email protected] avenida 5-55 zona 14 EuroplazaTorre 1 Nivel 6 oficina 601 REGULATORY FILINGSGuatemala CityGuatemala, 01014 The Company’s filings with the Ontario Securities CommissionTel: (502) 2329-2600 can be accessed on SEDAR at www.sedar.com.
ARGENTINA OFFICE The Company’s filings with the US Securities andExchange Commission can be accessed on EDGAR
Avda. Leandro N. Alem 855, Piso 27 at www.sec.gov.C1001AAD Capital FederalBuenos Aires, ArgentinaTel: 54 114 323 7000


![WELCOME [s22.q4cdn.com]s22.q4cdn.com/364334381/files/doc_presentations/NVIDIA_Investor... · drivable L3/L4 self-driving car, connected to all HD maps, continuously driving/testing/refining,](https://img.dokumen.tips/doc/110x75/5afb225b7f8b9ae92b8ea0e5/welcome-s22q4cdncoms22q4cdncom364334381filesdocpresentationsnvidiainvestordrivable.jpg)