Embed Size (px)
Citation preview

www.askhelios.com
1
S18 forecast:
coordinated to proposed S18 limits
vs
coordinated to existing S17 limits

2
The purpose of this comparison is to assess the likely effect of
declaring increased runway capacity, as per Wishlist 3, or
maintaining the Summer 2017 limits, presuming that the Summer
2018 schedule of increased demand materialises as expected.
The same number of movements are modelled in both cases, the
difference being the limits to which they are coordinated.
Case description

3
S18 coordinated to proposed S18 limits

4
S18 coordinated to proposed S17 limits
Changes to S18 forecast schedule: Count Direction Moved from Moved to
1 DEP 0500 UTC 0400 UTC
2 ARR 0800 UTC 0700 UTC
1 DEP 1100 UTC 1200 UTC
1 DEP 1700 UTC 1600 UTC
1 ARR 1700 UTC 1800 UTC
1 ARR 2200 UTC 2100 UTC

5
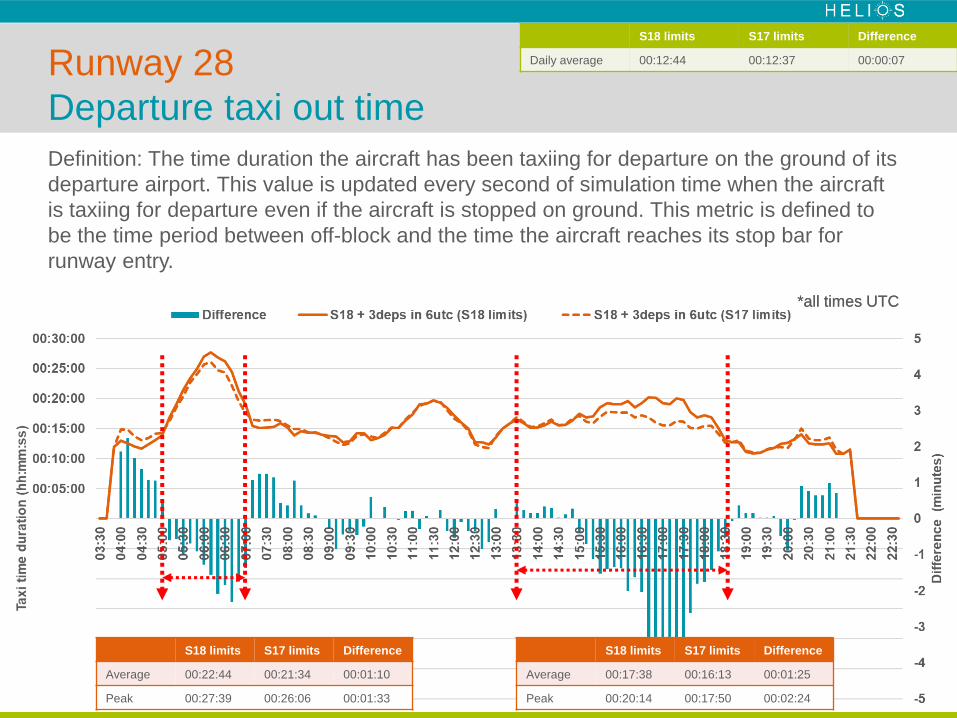
Definition: The time duration the aircraft has been taxiing for departure on the ground of its
departure airport. This value is updated every second of simulation time when the aircraft
is taxiing for departure even if the aircraft is stopped on ground. This metric is defined to
be the time period between off-block and the time the aircraft reaches its stop bar for
runway entry.
Runway 28
Departure taxi out time
*all times UTC
S18 limits S17 limits Difference
Average 00:17:38 00:16:13 00:01:25
Peak 00:20:14 00:17:50 00:02:24
S18 limits S17 limits Difference
Average 00:21:08 00:19:58 00:01:10
Peak 00:25:47 00:24:11 00:01:36
S18 limits S17 limits Difference
Daily average 00:12:32 00:12:17 00:00:15

6
Definition: Total delay of departing aircraft accumulated between off-block and entering the
runway. It is effectively the sum of runway holding delay and other delays.
Runway 28
Departure ground delay
*all times UTC*all times UTC
S18 limits S17 limits Difference
Average 00:08:51 00:07:32 00:01:19
Peak 00:11:29 00:09:08 00:02:21
S18 limits S17 limits Difference
Average 00:12:21 00:11:04 00:01:17
Peak 00:16:55 00:15:07 00:01:48
S18 limits S17 limits Difference
Daily average 00:05:09 00:04:57 00:00:12

7
Definition: The delay experienced while the aircraft is queueing for runway entry. The delay can be caused by other aircraft (being slowed down or stopped) or when waiting at runway stop-bar (because the runway is not free for lining up). This metric is defined to be the time period between joining the back end of the queue and the time the aircraft reaches its stop bar for runway entry.
Runway 28
Runway holding delay
*all times UTC*all times UTC
S18 limits S17 limits Difference
Average 00:07:43 00:06:34 00:01:09
Peak 00:10:30 00:08:25 00:02:05
S18 limits S17 limits Difference
Average 00:10:44 00:09:48 00:00:56
Peak 00:15:11 00:13:51 00:01:20
S18 limits S17 limits Difference
Daily average 00:04:19 00:04:07 00:00:12

8
Definition: The time duration the aircraft has been taxiing for departure on the ground of its
departure airport. This value is updated every second of simulation time when the aircraft
is taxiing for departure even if the aircraft is stopped on ground. This metric is defined to
be the time period between off-block and the time the aircraft reaches its stop bar for
runway entry.
Runway 10
Departure taxi out time
*all times UTC*all times UTC
S18 limits S17 limits Difference
Average 00:19:46 00:19:41 00:00:05
Peak 00:24:06 00:22:38 00:01:28
S18 limits S17 limits Difference
Average 00:23:10 00:22:33 00:00:37
Peak 00:29:07 00:27:42 00:01:25
S18 limits S17 limits Difference
Daily average 00:15:13 00:14:55 00:00:18

9
Definition: Total delay of departing aircraft accumulated between off-block and entering the
runway. It is effectively the sum of runway holding delay and other delays.
Runway 10
Departure ground delay
*all times UTC
S18 limits S17 limits Difference
Average 00:07:17 00:07:07 00:00:10
Peak 00:12:06 00:10:05 00:02:01
S18 limits S17 limits Difference
Average 00:10:15 00:09:37 00:00:38
Peak 00:15:28 00:14:15 00:01:13
S18 limits S17 limits Difference
Daily average 00:04:46 00:04:26 00:00:20

10
Definition: The delay experienced while the aircraft is queueing for runway entry. The delay can be caused by other aircraft (being slowed down or stopped) or when waiting at runway stop-bar (because the runway is not free for lining up). This metric is defined to be the time period between joining the back end of the queue and the time the aircraft reaches its stop bar for runway entry.
Runway 10
Runway holding delay
*all times UTC
S18 limits S17 limits Difference
Average 00:06:04 00:05:49 00:00:15
Peak 00:10:15 00:08:29 00:01:46
S18 limits S17 limits Difference
Average 00:08:43 00:08:12 00:00:31
Peak 00:14:28 00:13:04 00:01:24
S18 limits S17 limits Difference
Daily average 00:03:52 00:03:32 00:00:20

www.askhelios.com
11
S18 forecast:
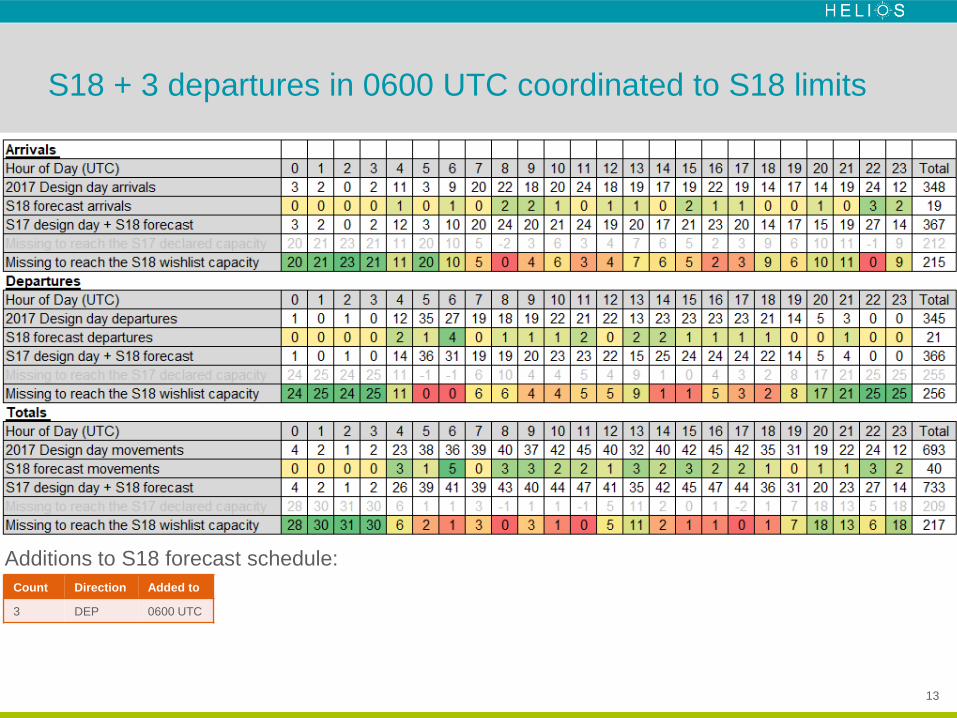
Impact of adding 3 extra departures in 6 UTC

12
The purpose of this comparison is to assess the likely effect of
declaring increased runway capacity, as per Wishlist 3, or
maintaining the Summer 2017 limits under the following
assumptions:
• The Summer 2018 schedule of increased demand materialises
as expected.
• There are three additional departures in the 0600 hour, such
that this hour is now full of departures.
The same number of movements are modelled in both cases, the
difference being the limits to which they are coordinated.
Case description
13
S18 + 3 departures in 0600 UTC coordinated to S18 limits
Additions to S18 forecast schedule:
Count Direction Added to
3 DEP 0600 UTC
14
S18 + 3 departures in 0600 UTC coordinated to S17 limits
Additions to S18 forecast schedule:
Count Direction Added to
2 DEP 0600 UTC
1 DEP 0700 UTC
Changes to S18 forecast schedule:
Count Direction Moved from Moved to
1 DEP 0500 UTC 0400 UTC
2 ARR 0800 UTC 0700 UTC
1 DEP 1100 UTC 1200 UTC
1 DEP 1700 UTC 1600 UTC
1 ARR 1700 UTC 1800 UTC
1 ARR 2200 UTC 2100 UTC
15
Definition: The time duration the aircraft has been taxiing for departure on the ground of its
departure airport. This value is updated every second of simulation time when the aircraft
is taxiing for departure even if the aircraft is stopped on ground. This metric is defined to
be the time period between off-block and the time the aircraft reaches its stop bar for
runway entry.
Runway 28
Departure taxi out time
*all times UTC*all times UTC
S18 limits S17 limits Difference
Average 00:17:38 00:16:13 00:01:25
Peak 00:20:14 00:17:50 00:02:24
S18 limits S17 limits Difference
Average 00:22:44 00:21:34 00:01:10
Peak 00:27:39 00:26:06 00:01:33
S18 limits S17 limits Difference
Daily average 00:12:44 00:12:37 00:00:07

16
Definition: Total delay of departing aircraft accumulated between off-block and entering the
runway. It is effectively the sum of runway holding delay and other delays.
Runway 28
Departure ground delay
*all times UTC*all times UTC
S18 limits S17 limits Difference
Average 00:08:51 00:07:32 00:01:19
Peak 00:11:29 00:09 :08 00:02:21
S18 limits S17 limits Difference
Average 00:13:52 00:12:34 00:01:18
Peak 00:18:40 00:16:54 00:01:46
S18 limits S17 limits Difference
Daily average 00:05:23 00:05:09 00:00:14

17
Definition: The delay experienced while the aircraft is queueing for runway entry. The delay can be caused by other aircraft (being slowed down or stopped) or when waiting at runway stop-bar (because the runway is not free for lining up). This metric is defined to be the time period between joining the back end of the queue and the time the aircraft reaches its stop bar for runway entry.
Runway 28
Runway holding delay
*all times UTC*all times UTC
S18 limits S17 limits Difference
Average 00:07:43 00:06:34 00:01:09
Peak 00:10:30 00:08:25 00:02:05
S18 limits S17 limits Difference
Average 00:12:03 00:10:58 00:01:05
Peak 00:17:04 00:15:25 00:01:39
S18 limits S17 limits Difference
Daily average 00:04:28 00:04:24 00:00:04

www.askhelios.com
18
Summary
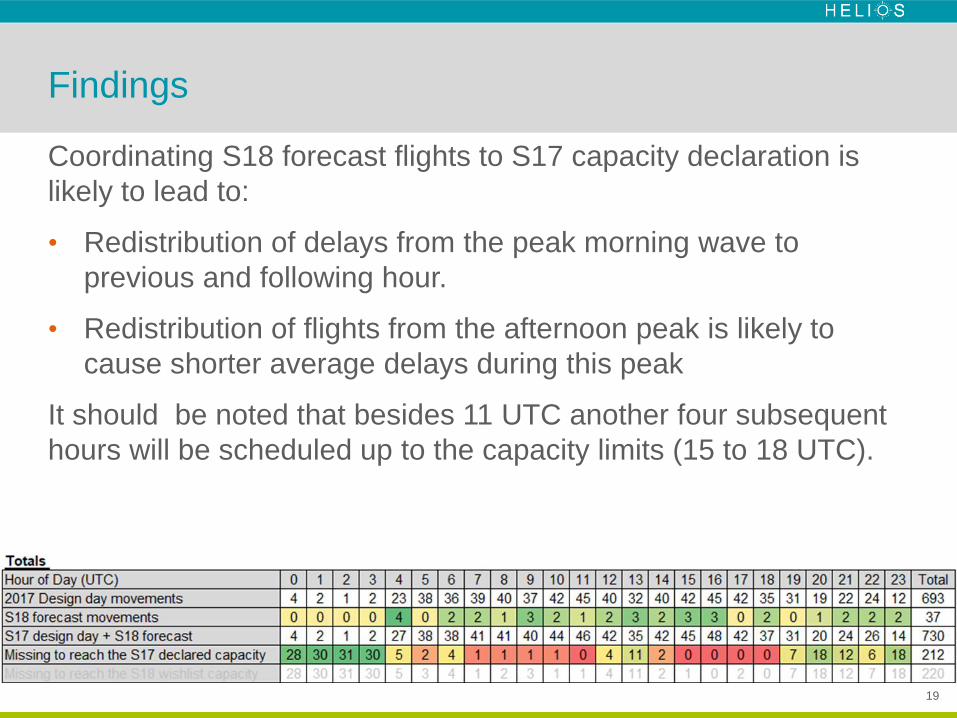
19
Coordinating S18 forecast flights to S17 capacity declaration is
likely to lead to:
• Redistribution of delays from the peak morning wave to
previous and following hour.
• Redistribution of flights from the afternoon peak is likely to
cause shorter average delays during this peak
It should be noted that besides 11 UTC another four subsequent
hours will be scheduled up to the capacity limits (15 to 18 UTC).
Findings

20
Using up all departure capacity in 5 and 6 UTC as per S17
capacity declaration:
• Is likely to increases delays during the first morning wave
• Bears additional risk of increased delays if any irregularity
occurs during the peak period
Findings