Embed Size (px)
Citation preview

St
ein
ho
ff
int
er
na
tio
na
l a
nn
ua
l r
ep
or
t 2
00
9
A n n u A l R e p o R t 2 0 0 9

Manufacturing and sourcingThe group’s geographical diversity, scale within manufacturing and sourcing operations, and mass-market positioning of its products and brands supported solid results and are continuing to provide growth opportunities.
LogisticsThe group’s integrated supply chain is founded on an efficient logistic solution and embodies a world-class distribution and warehousing infrastructure. This is a key competitive advantage for our business in all regions. A well established logistics platform enhances our ability to control costs and deliver on our promise of customer satisfaction.
page 38 page 46Annual report for the year ended 30 June 2009.
Significant influence over the supply chain, consolidating all points of contact from raw material to retail outlets across an extensive product offering, has resulted in consistent margins, raised barriers to entry, and competitive advantages. The strategic product offering focuses on furniture, beds and related homewares, and in Africa includes integrated raw material and logistics operations, and the retail of automotive and building supplies.
Investment case 2
Group at a glance 4
International management 8
10-year review 12
JSE trading history and exchange rates 15
Chairman’s statement 16
Chief executive’s review 20
Finance report 24
Operational report 36
Corporate governance 62
Board of directors 78
Value-added statement 84
Annual financial statements 85
Independent auditors’ report 85
Directors’ report 86
Audit committee report 90
Income statement 92
Statement of recognised income and expense 93
Balance sheet 94
Cash flow statement 96
Segmental reporting 98
Summary of accounting policies 102
Notes to the annual financial statements 119
Special resolutions passed 211
Analysis of shareholding 214
Shareholders’ diary 215
Corporate information 216
CONTENTS

retaiL – househoLd goods and buiLding suppLiesIn Europe, retail operations span the entire range of furniture and household goods across most price segments. Through the combination of selling leading designs through our innovative retail concepts and accommodating the more traditional consumer within our large scale value retail formats – our furniture is found in almost every room in millions of homes. In southern Africa value is added through the retail of building supplies and related homewares.
retaiL – autoMotiveThe Unitrans automotive division offers a complete range of vehicles, products and services including new and used vehicles, parts and accessories, servicing, insurance and is complemented by the car rental division, Hertz. Operations and dealerships are located in and serves the South African and Namibian markets.
corporate responsibiLityAs a responsible corporate citizen, Steinhoff is committed to seek out opportunities to promote and support financial, social and environmental sustainability and continues to add sustainable value while building a legacy that all Steinhoff stakeholders can share for decades to come.
corporateOur various corporate offices add value by providing strategic direction and shared services to decentralised operations globally. Group services employs specialists to provide direction and structure to functions such as brand management, treasury, participating investments, taxation management, human resource management, legal services, information technology, financial management, internal control and audit and technical services.
page 50 page 56 page 58 Separate report

Founded in 1964, and listed on the JSE in 1998, Steinhoff’s strategy is to produce and source furniture and related household goods in low-cost, developing environments, and to sell these in developed markets. Owning key parts of the supply chain in order to protect margin and deliver exceptional customer service, has resulted in sustained growth with compound annual growth in revenues and operating profit in excess of 25% since listing.
diy
and
Investment caseA tru ly integrated g lobal l i festy le suppl ier
2 • Steinhoff AnnuAl RepoRt 2009 • inveStment cASe

diverse geographicaL footprintGeographically, Steinhoff’s manufacturing and sourcing operations are located in emerging markets while consumer facing businesses mainly focus on the volume segment of developed markets. Each region employs the most appropriate supply chain given the strengths and opportunities inherent in the individual market. The geographical diversity and the group’s shared knowledge base have provided us with a competitive edge that has endured varying economic conditions.
integrated suppLy chainSignificant influence over the supply chain, consolidating all points of contact from raw material to retail outlets across an extensive product offering, has resulted in consistent margins and key competitive advantages. In Europe products include furniture and related homewares and in Africa, integrated timber, raw material and logistics operations.
fLexibiLity and baLanceThe vertically integrated model is one of flexibility and balance in production, sourcing and supply to the internal and external customer base. This versatility manages concentration risk and protects and enhances margins. Our owned manufacturing operations operate a flexible manufacturing/assembling structure that is focused on traditional product ranges such as upholstered furniture and mattresses while our sourcing business allows flexibility and diversity in sourcing destinations.
Logistics servicesProvision of logistics services through supply chain solutions and effective management of warehouses and distribution networks remain essential to each of our businesses, ranging from hauling saw logs from a forest to the ultimate delivery of household goods to the end consumer. Control over the supply chain, gives rise to better service levels and guarantees product delivery within a competitive cost structure.
Mass-Market appeaLThe majority of our operations are positioned towards the mass-market segment of the market. Ownership of aspirational brands and designs exposes us directly and indirectly to additional market segments.
growthSteinhoff Africa and Steinhoff Europe are managed as two separate divisions. Within the European business, the fragmented furniture industry is consolidating and Steinhoff is well positioned to grow its market share both organically and through selective investments in this environment. Our investments within our diverse industrial African group over the past three years has provided the platform for above average growth in our operations.
The Steinhoff investment case is built on:
inveStment cASe • Steinhoff AnnuAl RepoRt 2009 • 3

Steinhoff Europe and Steinhoff Africa are managed as two separate divisions. Steinhoff Europe is one of the largest integrated furniture and household goods suppliers in Europe, and is well positioned to further increase market share. Steinhoff Africa constitutes a diversified industrial group. The material capital investments made within both our integrated logistics and raw material businesses have built scale and efficiencies within these operations.
verticaLLy integrated furniture and househoLd goods suppLier
steinhoffeurope
steinhoffafrica
united kingdoM europe pacific riM
100% 100%
integrated raw MateriaL
operations
autoMotive diy integrated Logistics
operations
steinhoffinternationaL
hoLdings LiMited
steinhoff investMent
hoLdings LiMited
100%
Group at a GlanceGeographica l and operat ional d ivers i ty
4 • Steinhoff AnnuAl RepoRt 2009 • GRoup At A GlAnce

Continental Europe
Pacific Rim
United Kingdom
Africa and India
africa india and asia pacific riM
united kingdoM europe
geographicaL non-current assets spLit geographicaL eMpLoyees spLitgeographicaL revenue spLit
13%
29%
52%
6%
20%
30%
47%
3%
19%
37%
38%6%
GRoup At A GlAnce • Steinhoff AnnuAl RepoRt 2009 • 5

United Kingdom Geograph ica l revenue Geograph ica l non-cur rent assets
Relyon, Pritex, SUKU, Norma*, Hukla Beds*, Sprung Slumber
Unitrans UK
Harveys, Bensons for Beds, Sleepmasters, The Bed Shed, Reid, Cargo
Continental eUrope Geograph ica l revenue Geograph ica l non-cur rent assets
Andante, Designwerk, Dieter Knoll, Dining@home, Ego, H2L, Habufa, Hukla Upholstery, Kaniza trend, Klose Kollektion, Living Tex, Longlife, Novalife, Option, Poco Polstermöbel, Polster Galerie, Puris Bad, Steinhoff Home, 1913
Global Warehouse Logistics (GWL)
European Retail Management (ERM), Esprit, Habufa, Henders & Hazel, Klose, Quattro Mobili
2006 2007 2008 2009
Rm
20 000
15 000
10 000
5 000
02006 2007 2008 2009
Rm
20 000
15 000
10 000
5 000
0
2006 2007 2008 2009
Rm
20 000
15 000
10 000
5 000
02006 2007 2008 2009
Rm
20 000
15 000
10 000
5 000
0
* European mattress brands managed as part of the UK business.
Group at a Glance
6 • Steinhoff AnnuAl RepoRt 2009 • GRoup At A GlAnce

afriCa and india Geograph ica l revenue Geograph ica l non-cur rent assets
PG Bison: BisonBord, Formica, Moja, Supawood, Woodline, Surinno, Melawood, Woodchem, BCM, Mattex, Vitafoam, Alam Tannery, Namib Foam
Unitrans
Pennypinchers, Timbercity, The Tile ShopUnitrans automotive: Alfa, Audi, BMW, Cadillac, Chevrolet, Isuzu, Fiat, Freightliner, Fuso, Lexus, Mercedes-Benz, Mini, Mitsubishi, Nissan, Opel, Saab, Toyota, VW, Hertz
paCifiC rim and asia Geograph ica l revenue Geograph ica l non-cur rent assets
Steinhoff Manufacturing, Steinhoff International Sourcing
Kings Park
BayLeatherRepublic, Freedom, Freedom Home, Snooze
2006 2007 2008 2009
Rm
20 000
15 000
10 000
5 000
0
2006 2007 2008 2009
Rm
20 000
15 000
10 000
5 000
02006 2007 2008 2009
Rm
20 000
15 000
10 000
5 000
0
2006 2007 2008 2009
Rm
20 000
15 000
10 000
5 000
0
GRoup At A GlAnce • Steinhoff AnnuAl RepoRt 2009 • 7

ceoMarkus Jooste
Age: 48CA(SA)
ceoIan Topping
Age: 49MA, MBA
cfoPhilip Dieperink
Age: 53CA(SA)
europe uphoLstery
United Kingdomnorthern hemisphere
Continental eUrope
cfoSiegmar Schmidt
Age: 50CA
ceoAndreas Bogdanski
Age: 47Econ
cfoGerrit Venter
Age: 36CA(SA)
LegaLHans-Ulrich Bossas
Age: 54BComm, BProc
Mark ashcroft (52) Group Company Secretary | bill carrahar (46) MD: Bensons for Beds | Jim drummond (50) MD: The Bed Shed | gordon forsyth (51) Group Property Director | ulrich gaupp (42) MD: Hukla Matratzen | clive gilbert (37) MD: Cargo | alan Marnie (38) MD: Harveys/Reid | Johan Martin (42) MD: Unitrans UK Limited | howard Mills (51) MD: Steinhoff UK Upholstery | andy Murdoch (57) MD: Pritex | iain stewart (59) MD: Reid Furniture | chris tattersall (40) MD: Relyon | ad van der horst (56) MD: Norma | alan williams (48) MD: Sleepmasters
Mirko Mikalef (40) Sales | Jürgen Mussmann (47) Upholstery Production | heino oelkers (61) Administration | bernd tepe (48) Marketing
InternatIonal manaGement
8 • Steinhoff AnnuAl RepoRt 2009 • inteRnAtionAl mAnAGement

habufa
other european operations
Continental eUrope: ContinUed
MdPaul van den Bosch
Age: 47VEcon, MBA
george billert (44) MD: Sales and Finance Puris Bad | Johannes bühner (47) MD: Bruno Steinhoff GmBH | James Moore (50) European Retail Management | uwe smidt (48) MD: Logistics | gavin van der Merwe (49) European Retail Development | gabor wilheim (55) European Leather Sales | | rainer willeke (48) MD: Production Puris Bad
Our balance sheet strength and liquidity profile enabled our decentralised management teams to
focus on the many opportunities brought about by the prevailing economic environment.
inteRnAtionAl mAnAGement • Steinhoff AnnuAl RepoRt 2009 • 9

ceoDanie van der Merwe
Age: 51BComm, LLB
group MdGeoff McIntosh
Age: 55
Md: group servicesMichael Gordon
Age: 43CA(SA), ACA(Aust)
coMpany secretary and Md: bayLeather repubLicTim Schaafsma
Age: 36LLB, ACIS, Solicitor
paCifiC rim
steinhoff asia pacific
cfoBen la Grange
Age: 35CA(SA)
simon beaty (53) MD: Snooze | Michael cleghorn (45) Brand Director: Freedom | debbie ridling (40) Freedom New Zealand | italo tius (59) Retail Director: Freedom Australia and BayLeatherRepublic
Md: gLobaL trading and sourcingGavin van der Merwe
Age: 49HDipCS, MBL
soUthern hemisphere
Md: steinhoff internationaL sourcingTom Huang
Age: 35CA(SA)
Md: indiaMahmud Alam
Age: 45BComm (Hons)
InternatIonal manaGement
10 • Steinhoff AnnuAl RepoRt 2009 • inteRnAtionAl mAnAGement

unitrans
ceoJo Grové
Age: 60AMP (Oxford)
raw MateriaL
Md: vitafoaMFrans Human
Age: 54BA
Md: bcM and MattexNico Siebrits
Age: 49CA(SA)
pg bison steinbuiLd
afriCa
chairManChris van Niekerk
Age: 62BA (HED)
MdTheodore de Klerk
Age: 40BComm (Hons), CTA, HDip Tax
ceoJan van der Merwe
Age: 50CA(SA)
Md: unitrans passengerNico Boshoff
Age: 52CA(SA)
Md: unitrans suppLy chain soLutionsFrank Wagner
Age: 48CA(SA)
gary chaplin (38) Director: Forestry/Timber beneficiation | andré norval (50) CFO | philip roux (39) Director: Logistics | themba siyolo (45) HR Director
andré de Jager (45) Manager: Operations | Johann fourie (49) Manager: Business Development | wayne opperman (44) CFO
Md: autoMotive and financiaL servicesSteve Keys
Age: 48CA(SA)
inteRnAtionAl mAnAGement • Steinhoff AnnuAl RepoRt 2009 • 11

10-year revIewifRS compliAnt
2009 2008 2007 2006 2005 2004 2003 2002 2001 2000Rm Rm Rm Rm Rm Rm Rm Rm Rm Rm
inCome statementRevenue 50 869 45 046 34 229 30 159 18 958 10 572 9 949 8 208 5 774 4 594Operating profit before capital items 5 153 4 662 3 059 2 715 1 944 1 190 1 050 740 479 454Capital items 49 (193) (57) (88) (10) (53) (47) (5) 163 35Operating profit 5 202 4 469 3 002 2 627 1 934 1 137 1 003 735 642 489Net finance costs (1 000) (704) (454) (292) (193) (80) (126) (81) (47) (54)Share of profit of associate companies 7 37 67 61 58 115 91 56 38 13Profit before taxation 4 209 3 802 2 615 2 396 1 799 1 172 968 710 633 448Taxation (581) (366) (325) (383) (213) (145) (98) (53) (27) (16)Profit from discontinued operations – – 684 – – – – – – –Profit for the year 3 628 3 436 2 974 2 013 1 586 1 027 870 657 606 432Attributable to:Equity holders of the parent 3 379 3 310 2 970 1 949 1 545 1 023 873 659 608 433Minorities 249 126 4 64 41 4 (3) (2) (2) (1)Profit for the year 3 628 3 436 2 974 2 013 1 586 1 027 870 657 606 432
Cash flow statementOperating profit before working capital changes 5 871 5 387 3 929 3 352 2 401 1 442 1 253 895 825 533Net changes in working capital (1 937) 98 (475) 134 (977) 97 (355) 60 (91) (408)Cash generated from operations 3 934 5 485 3 454 3 486 1 424 1 539 898 955 734 125
performanCe indiCatorsprofitabilityReturn on shareholders' equity1 (%) 16,2% 17,9% 21,8% 20,3% 21,1% 18,0% 18,7% 18,1% 23,8% 22,4%Return on total assets2 (%) 9,2% 9,9% 8,8% 9,6% 10,2% 10,3% 11,6% 10,3% 8,9% 11,2%Gross margin (%) 34,8% 32,9% 31,2% 31,5% 31,6% 41,4% 38,8% 37,3% 36,3% 32,0%Operating margin (%) 10,1% 10,3% 8,9% 9,0% 10,3% 11,3% 10,6% 9,0% 8,3% 9,9%employee statisticsNumber of employees 41 400 43 300 43 400 50 000 41 500 26 600 20 400 22 600 21 200 20 000Paid to employees (Rm) 8 532 7 224 6 148 5 558 2 708 859 799 829 640 579
1 Earnings attributable to equity holders of the parent ÷ average shareholders’ equity2 Operating profit before capital items ÷ average total assets
12 • Steinhoff AnnuAl RepoRt 2009 • 10-yeAR Review

0
200
400
600
800
1 000
1 200
1 400
1 600
1 800
Cents
NET ASSET VALUE PER SHARE
2008200520022000 20062003 20092001 20072004
cAGR = 20%
0
50
100
150
200
250
300
Cents
HEADLINE EARNINGS PER SHARE
2008200520022000 20062003 20092001 20072004
cAGR = 18%
0
10 000
20 000
30 000
40 000
50 000
60 000
Rm
REVENUE GROWTH
2008200520022000 20062003 20092001 20072004
cAGR = 27%
0
10
20
30
40
50
60
70
Cents
DISTRIBUTION TO SHAREHOLDERS
2008200520022000 20062003 20092001 20072004
cAGR = 21%
CAGR = Compound annual growth rate.
10-yeAR Review • Steinhoff AnnuAl RepoRt 2009 • 13

10-year revIewifRS compliAnt
2009 2008 2007 2006 2005 2004 2003 2002 2001 2000Rm Rm Rm Rm Rm Rm Rm Rm Rm Rm
BalanCe sheetGoodwill and intangible assets 18 875 21 227 10 247 7 893 4 000 504 327 415 26 30Property, plant and equipment, investment properties and biological assets 11 277 11 288 7 999 5 652 4 909 2 787 2 202 2 316 1 555 1 493Other non-current assets 6 474 5 127 3 923 3 872 1 883 1 491 1 206 1 252 555 309Current assets 18 661 19 274 15 365 14 535 13 780 8 778 5 749 4 654 3 650 3 179Total assets 55 287 56 916 37 534 31 952 24 572 13 560 9 484 8 637 5 786 5 011Total equity 24 924 24 784 17 358 12 767 9 714 6 490 4 944 4 412 2 906 2 220Interest-bearing debt 17 882 16 686 11 053 10 716 6 353 3 697 2 063 1 639 1 058 932Interest-free liabilities 12 481 15 446 9 123 8 469 8 505 3 373 2 477 2 586 1 822 1 859Total equity and liabilities 55 287 56 916 37 534 31 952 24 572 13 560 9 484 8 637 5 786 5 011
performanCe indiCatorsefficiencyNet asset revenue ratio (times)3 2,4 2,1 2,3 2,7 2,3 1,8 2,1 2,2 2,3 2,4Depreciation to cost of property, plant and equipment (%) 9% 7% 9% 11% 9% 8% 9% 7% 8% 5%debt leverageGearing ratio4 (%) 35% 38% 24% 30% 21% 0% 15% 24% 20% 30%Debt coverage (times)5 0,2 0,3 0,3 0,3 0,2 0,4 0,3 0,4 0,5 0,1Borrowing cost cover (times)6 5,2 6,6 6,7 9,3 10,1 14,9 8,3 9,1 10,2 8,4shareholders’ returnsEarnings per share (cents) 256,1 249,8 241,9 165,6 137,0 95,8 90,8 76,2 74,0 51,0Headline earnings per share (cents) 252,9 263,5 200,1 172,5 138,0 110,3 102,5 90,8 62,1 48,0Distribution per share (cents) 60,0 60,0 50,0 37,5 30,0 22,0 18,0 15,0 12,0 9,0Distribution cover (times) 4,3 4,2 4,8 4,4 4,6 4,4 5,0 5,1 6,2 5,7Net asset value per share (cents) 1 642,2 1 637,0 1 292,4 965,5 723,9 574,8 523,2 483,4 349,3 273,8Annual increase in revenue (%) 13% 32% 13% 59% 79% 6% 21% 42% 26% 67%EBITDA to revenue (%) 12% 12% 11% 11% 12% 14% 13% 11% 11% 12%Employee cost to revenue (%) 17% 16% 18% 18% 14% 8% 8% 10% 11% 13%Depreciation and amortisation to revenue (%) 2% 2% 2% 2% 2% 2% 2% 2% 3% 2%Effective taxation rate (%) 14% 10% 12% 16% 12% 12% 10% 7% 4% 4%share statisticsShares in issue (net of treasury shares) (million) 1 280 1 269 1 256 1 141 1 131 1 123 942 907 829 805Weighted average shares in issue (million) 1 276 1 281 1 188 1 133 1 128 1 067 961 865 822 785
3 Revenue ÷ (average total assets - average total liabilities)4 Net interest-bearing debt ÷ closing equity5 Cash generated from operations ÷ total borrowings6 Operating profit before capital items ÷ net finance cost
14 • Steinhoff AnnuAl RepoRt 2009 • 10-yeAR Review

Jse traDInG HIstory anD eXcHanGe rates
JSE TRADING HISTORy FOR THE yEAR ENDED 30 JUNE 2009 2008 2007 2006 2005 2004 2003 2002 2001 2000
Closing price (cents) 1 340 1 592 2 421 2 135 1 540 835 660 825 650 600Highest price (cents) 1 890 2 455 2 745 2 474 1 570 925 830 975 700 690Lowest price (cents) 885 1 490 2 011 1 500 755 651 455 590 460 390Number of shares traded (million) 1 450 1 342 1 168 914 800 727 402 348 192 192Value of share traded (R million) 18 215 25 921 27 757 18 223 9 486 5 612 2 643 2 717 1 206 996Average weighted traded price (cents) 1 256 1 931 2 377 1 994 1 186 772 657 780 648 517Closing spot: Industrial 25 index (Indi 25) 17 230 19 127 19 521 13 644 10 383 6 544 5 205 7 178 7 240 8 087Dividend yield (%) 4,22¹ 3,77¹ 2,07¹ 1,76¹ 1,95¹ 2,64 2,72 1,80 1,90 1,50Earnings yield (%) 18,88 16,55 8,88 7,92 7,53 13,05 14,99 11,03 9,85 8,67Price earnings ratio 5,30 6,37 11,26 12,63 13,28 7,66 6,67 9,07 10,16 11,53Market capitalisation (R million) 18 350 21 488 31 708 24 351 17 474 9 462 6 284 7 480 5 391 4 827
exChange ratesThe following table sets forth, for the periods indicated, the average and period-end exchange rates in South African rand expressed in R per €1,00, used to convert the results and balance sheets of European subsidiaries into rands.
yEAR ENDED 30 JUNE AVERAGE2 CLOSING3
2000 6,3564 6,51292001 6,7500 6,85002002 9,0000 10,25002003 9,4150 8,61002004 8,2150 7,56002005 7,9091 8,09652006 7,8196 9,16002007 9,4103 9,57352008 10,7631 12,33412009 12,3503 10,8265
1 Calculation includes the declared cash distribution.2 The average exchange rate was used to translate income and expenditure.3 The closing rate was used to translate assets and liabilities.
Prior to 2002, the euro rate is based on the Deutschemark exchange rate which is DM1,95583 per €1,00.
shares tradedNumber of shares traded (in millions)
192 192
348402
727800
914
1 168
1 342
1 450
2008200520022000 20062003 20092001 20072004
10-yeAR Review • Steinhoff AnnuAl RepoRt 2009 • 15
We are pleased to report a solid performance with further improvement in revenues and operating profit.
cHaIrman’s statementlen KonAR chairman

Dear Shareholder
Review of ResultsSteinhoff’s robust performance in a challenging and volatile global market demonstrates the value of our geographic diversity and significance of the flexibility within our integrated business operations. Our performance was further strengthened by the positioning of our retail operations and the scale of our manufacturing, sourcing, and logistics operations.
Of the group’s R50,9 billion revenue, 37% was generated from the European Union, 6% from Asia Pacific, 19% from the United Kingdom and 38% from southern Africa.
CoRpoRate aCtivityThe group’s deliberate working capital investment strategy within the current year, resulted in growth within previously unexplored territories, and bodes well for continued penetration in these territories off the existing supply chain.
The group continued to invest and further strengthen existing partnership arrangements with strong European retailers in order to expand our retail distribution base.
The group successfully implemented, the broad-based black economic empowerment (B-BBEE) transaction approved by our shareholders on 1 December 2008. The B-BBEE transaction, funded by the group, resulted in 19 000 Steinhoff Africa employees participating in the allocation of 40 million shares. In excess of 70% of the participants benefitting from this transaction come from a previously disadvantaged background.
DeClaRation of Capital DistRibution anD shaRe awaRDWe are pleased to report that the board decided to maintain its capital distribution for 2009 on the back of stable results compared to that of last year. All shareholders will receive capitalisation shares, unless they electe to receive instead, a cash distribution of 60 cents per share in respect of all or part of their shareholding. Our policy has been to pay an annual dividend/capital distribution covered at least four times by attributable earnings.
chAiRmAn’S StAtement • Steinhoff AnnuAl RepoRt 2009 • 17

DiReCtoRateSteinhoff’s board comprises an appropriate balance of expertise and spread of local and international experience. The board enhances the group’s ability to recognise, consider, analyse and consequently manage the risks and challenges introduced by the financial crisis, whilst remaining committed to achieving our long-term goals and objectives.
We take this opportunity to wish Mr Dirk Ackerman, our colleague since 1998, a restful and rewarding retirement. Mr Ackerman contributed to the success of the group in his capacity as a non-executive director of the board for the past 11 years.
We welcome Dr Steve Booysen who was appointed as an independent non-executive director on 8 September 2009. Dr Booysen’s skills and experience will add tremendous value to the group.
RemuneRationAt Steinhoff, we are committed to the principle of sensible market-related remuneration, structured to align our business objectives with long-term shareholder interests. Steinhoff’s strategic objectives focuses on delivering sustainable value over time.
The board of directors and executive management measure Steinhoff’s progress against these strategic objectives. Progress is then benchmarked using both financial and non-financial measures and performance appropriately rewarded as described in more detail within the remuneration report included on pages 196 to 204.
ReseaRCh anD DevelopmentWe continue to invest in research and development in existing and new lines of business that will contribute to our long-term growth. Our future growth is dependent on delivering innovative, appropriate and valued products and service solutions through our integrated platform.
Long-term sustainable growth will be further enhanced through technological innovation, operational excellence, and a commitment to delivering respected and valued products and services to customers and partners.
sustainable DevelopmentOur commitment to be good corporate citizens remains in tact. This includes our commitment to all the stakeholders that we serve, including the communities and environments in which we operate. A separate corporate responsibility (sustainability) report is available highlighting our commitment, activities and achievements in this regard.
RiskOver the years we have embedded robust risk, capital management and internal controls group-wide.
Events during the year have powerfully reinforced the need for boards to have a clear understanding of the risks their businesses face. We believe the Steinhoff board and its committees have set a high standard in this regard and we continue to improve the manner in which we evaluate, formulate, communicate and manage the broad spectrum of risks our businesses are exposed to. The more pertinent risks are highlighted within the corporate governance, finance and sustainability reports.
Our existing risk practices, frameworks and procedures proved relatively robust during the year under review and no major changes to the risk management process proved necessary.
tRansfoRmationIn its broadest sense, transformation is a central and strategic priority at Steinhoff Africa. We are committed to empowerment and transformation across all divisions and all levels.
Our skills development and training programmes continue to make good progress and achieve success; these will ensure continuity and high quality future leaders and will greatly assist in meeting our future skills requirements.
18 • Steinhoff AnnuAl RepoRt 2009 • chAiRmAn’S StAtement

employeesWe thank our employees for the part they have played in sustaining Steinhoff’s performance. Steinhoff is committed to provide support for employees which include, learning and development, diversity and inclusion, and providing an environment in which achievement and performance are respected and rewarded.
Less complexity means we can now clearly identify top performers – both businesses and individuals – and reward them appropriately. We believe in developing and retaining market-tested leaders with the skills and experience needed to perform in a broad range of economic conditions. We invest substantial time and resources in training at all levels of the group. We see the greatest return on this investment in tough economic times like these. We have a core team of leaders that is prepared to handle the difficult conditions we face – and to protect and grow value over the long term.
CoRpoRate GoveRnanCeSteinhoff and its directors, are fully committed to sound corporate governance and to the principles of fairness, transparency, accountability, responsibility and integrity in dealing with shareholders and all other stakeholders. We endorse the Code of Corporate Practices and conduct recommended in the King Report on Corporate Governance in South Africa 2002 (“King II Report”). We are positioned to adopt the King III Report on Corporate Governance that was released on 1 September 2009.
Good governance is the foundation of our ongoing ethical approach to business. The board continued its focus on promoting the high standards of conduct we expect of our employees, customers and suppliers around the world, recognising that our leadership and actions speak louder than words.
A comprehensive governance report is published on pages 62 to 83 of this report.
The tone at the top and within the board has fostered an environment in which we are committed to high ethical standards, full compliance with legal requirements and resistance to market pressures for short-term results.
Our vision, our values and our commitment to accountability will keep us focused on our pursuit of excellence, regardless of how challenging the road ahead is.
During the year under review, we completed a review of the board charter and board committees, including an examination of the respective committee charters, and a performance review of each director, including the chairman, to ensure that our board criteria are maintained.
We believe in the importance of culture and ethics in business. Steinhoff’s longstanding traditions of financial strength, long-term customer relationships and entrepreneurial yet responsible management are as important today as ever.
appReCiationWe pay tribute to our board of directors, whose forethought and steadfastness in pursuing our strategic goals have been critical to our success.
We also express our gratitude to our executives, managers and staff who have shown tremendous dedication and skill in challenging circumstances. We are grateful, too, to our stakeholders, to our business partners and to you, our shareholders, for your support during the year.
len Konar8 September 2009
chAiRmAn’S StAtement • Steinhoff AnnuAl RepoRt 2009 • 19

Our vertically integrated strategy has always proven its resilience in tough times, and this year was no exception.
cHIef eXecutIve’s revIewmARkuS JooSte ceo

steinhoff euRopeWithin Europe, we have differentiated ourselves to concentrate our efforts on the mass-market volume segment of the furniture and household goods markets. Approximately 95% of our retail exposure within Europe is focused on this market segment. The flexibility within our European manufacturing and sourcing capacity, coupled with the mass-market biased product range, further enhanced our competitiveness within this market segment. This focus allowed us to grow our market share in a contracting market.
In the UK, our industry was exceptionally hard hit and many worthy competitors were unable to survive the many challenges that confronted the industry. Whilst this prompted some irrational competition, particularly within the first half of the year, our retail business maintained revenues (compared to that of last year) and improved margins for the year under review. Priorities change during a recession. While we continue to support an integration strategy with 50% internal supply and 50% external supply, the credit risk inherent within the UK market meant that our manufacturing and sourcing operations increased their supply to group-owned UK retail operations and focused external supply on customers backed by credit insurance. The entrepreneurial spirit and sound financial management principles inherent in the manufacturing team, coupled with the focus on the business model and business fundamentals by our retail team, proved to be a winning combination.
Our investment and strategic initiatives embarked upon in previous years, meant that Steinhoff was able to face the economic downturn with an already restructured, flexible and competitive business.
Our balance sheet strength and liquidity profile enabled our decentralised management teams to focus on the many opportunities brought about by the prevailing economic environment.
chief executive’S Review • Steinhoff AnnuAl RepoRt 2009 • 21
Continental Europe remains the backbone of the group’s European business, with R19 billion revenue earned in that region during the year under review. Whilst the mass-market retail business in this region benefitted from the more conservative consumer profile and buying down trends, the eastern European manufacturing operations experienced challenging trading conditions. The management team within the eastern European manufacturing and sourcing division has to be commended for protecting margins, while being faced with a volatile Polish zloty, decreased raw material prices, and resultant deflation. In addition, the team’s strategy to invest working capital to protect future supply and enhance margins from smaller suppliers; and to extend credit terms to creditworthy customers, especially in regions where the group previously had only limited exposure, translated into substantial growth and stable margins for this group.
austRalia anD new ZealanDThe Australian and New Zealand economies experienced a sharp decline in growth in 2008, resulting in a reduction in discretionary retail spending and a particularly low level of consumer confidence. In direct contrast to the European retail operations, the group’s retail operations in Australia and New Zealand are positioned to appeal to the more affluent market segment and therefore are more exposed to discretionary spend. Despite this, the division was able to retain market share. Each of the retail trading formats reduced their overheads and focused on regular tactical promotional activities to drive sales. Despite an overall decline in sales, trading densities improved in the second half of the financial year. The management team within this region forms the hub of the group’s innovation, sales and marketing skills, and acts as pioneers for the group in respect of new trends and products.
asiaThe changed business environment within the Asian sourcing business provided the group with some interesting opportunities and challenges. The slowdown in the global economy led to manufacturers in China struggling to fill their capacity. The strong growth, particularly within our group-owned retail divisions and the diversified nature of our external retail customers, gave our sourcing division a strong bargaining position with regards to suppliers. We were able to negotiate reduced prices and improve manufacturing lead times, benefitting the retailers within our European operations. Supplier evaluation became critical as many suppliers faced an uncertain financial future. The evaluation process focused on continuity and quality of suppliers with which we are able to ensure preferred status and significant influence.
steinhoff afRiCaSteinhoff Africa comprises a diversified industrial group. The material capital investments of prior years in both our integrated logistics and raw material businesses have built scale and efficiencies within these operations. This enabled them to protect and enhance their competitive position within the markets that they serve. These investments were made in an environment when liquidity at competitive spreads were readily available, further benefitting the group’s current competitive position.
The integrated timber and logistics businesses are positioned to participate in the emerging attributes of the African continent, and its infrastructure development, while Unitrans automotive and Steinbuild is consumer facing. The South African economy was affected by the global environment in different ways. Government spending on infrastructure continued during the year under review while construction and building industries slowed down considerably.
Our raw material and Steinbuild divisions were adversely affected by trade customers buying lower specification product.
22 • Steinhoff AnnuAl RepoRt 2009 • chief executive’S Review

Consumer debt levels and confidence were adversely affected, aggravated by relatively high interest rates during the year under review. However, our balanced industry exposure within our logistics businesses, and our mass-market positioning within our automotive businesses, shielded us, to a degree, from the severe slowdown that was experienced in many industries.
The operations and results of the group are discussed in detail in the operational and finance reports.
ContinueD investment foCusIn many ways, this has been a year of consolidation in which we investigated, but did not pursue any material acquisitions, allowing us to focus on selective retail participation alliances across Europe. Our working capital investment strategy continues to secure global market share and growth. The demise of many of our competitors in Europe and the UK has enabled us to grow our business and market shares organically. We will continue to evaluate meaningful opportunities which could advance our strategic goals, increase our European retail footprint, enhance our existing supply chain, accelerate the consolidation in the fragmented markets of Europe and ultimately improve the group’s returns. Within Steinhoff Africa our investment focus will remain on opportunities that could unlock further value within our existing businesses.
outlookThe global economic conditions and financial markets appear to show signs of recovery. The resultant impact on consumer confidence and spending patterns, especially in respect of the market segments where Steinhoff operates, bode well for sustained performance in the current financial year.
Flexibility in the way we approach business, and focus on our basic business model will remain key in managing our business through turbulent times. Our decentralised management teams remain focused on the fundamentals of running good businesses – operating excellence, customer focus, competent people, financial discipline and strong values.
This, coupled with our capital structure, gives us the ability to better plan and manage our future through challenging times. At the same time, we recognise that the economy will impact consumers everywhere, creating a degree of uncertainty surrounding the coming year. Steinhoff remains sensitive to this volatile environment, and will take decisive action to reflect on, and adapt to, the pressures affecting our consumer base.
Despite challenging global economic conditions, we continue to see enormous opportunity for the group. Investing for growth, particularly in the fragmented European market, remains key to create value for our shareholders.
appReCiationThis was an extraordinary year that made extraordinary demands on our people. I would like to extend my appreciation to my fellow executive directors, for their dedication and continued unrelenting support to all group operations. My management team and I would also like to commend and thank our non-executive directors whose experience and guidance proved invaluable to us in these times. Thanks to our chairman for his continued hard work and dedication to the group. And finally, to our employees, a huge thank you, your spirit, loyalty and support make it such an exciting and fun group to work for.
markus Jooste8 September 2009
chief executive’S Review • Steinhoff AnnuAl RepoRt 2009 • 23

The global economic slowdown and negative consumer sentiment affected our trading operations to varying degrees, but overall, the group’s operations traded satisfactorily. The entrepreneurial culture inherent in the group enabled us to adapt quickly to the changed business environment.
fInance reportfRikkie nel, f inAnciAl diRectoR
StéhAn GRoBleR, diRectoR tReASuRy And finAnce ActivitieS

2000 2001 2002 2003 2004 2005 2006 2007 2008 2009
6 000 160%
0%
20%
40%
60%
80%
100%
120%
140%
1 000
0
2 000
3 000
4 000
5 000
Cash generated before working capital changes
Operating profit
Rm
CASH GENERATED
• Revenuegrowthof13%toR50,9billion• HeadlineearningsofR3,2billion• Distributionpersharemaintainedat60cents• Netgearingimprovesto35%Stakeholders are advised to read this review in conjunction with the annual financial statements. The purpose of this review is to provide further insight into the financial performance and position of the group.
finAnce RepoRt • Steinhoff AnnuAl RepoRt 2009 • 25

intRoDuCtionThe geographical mix of the group exposes it to currency fluctuations which impact on results. The group’s revenue achieved outside South Africa (foreign revenue) mainly consists of revenues in euro, UK pound (pound), Polish zloty (zloty) and Australian dollar. Foreign revenues (converted to euro) increased by 11% from €2,3 billion to €2,6 billion.
The average exchange rate used for converting euro income and expenditure to rand was R12,3503:1 euro compared to R10,7631:1 euro in respect of the previous financial year (15% change). The majority of the group’s assets are situated within our European division. These assets, as well as the foreign liabilities, were converted at a closing rate of R10,8265:1 euro compared to R12,3341:1 euro in the previous financial year (12% change). Currency fluctuations have a material impact on ratios calculated (such as return on assets, etc).
ExCHANGE RATES (RAND:EURO) 2009 2008 2007 2006 2005
Average rate 12,3503 10,7631 9,4103 7,8196 7,9091Closing rate 10,8265 12,3341 9,5735 9,1600 8,0965
AVERAGE TRANSLATION RATE CLOSING TRANSLATION RATE
f2009%
CHANGE F2008 f2009%
CHANGE F2008
EUR: ZAR 12,35 (15) 10,76 10,83 12 12,33EUR: PLN 3,91 (10) 3,56 4,47 (33) 3,36EUR: GBP 0,82 (12) 0,73 0,85 (7) 0,79EUR: AUD 1,70 (3) 1,64 1,75 (6) 1,64EUR: USD 1,49 (2) 1,47 1,43 11 1,58EUR: HUF 254,73 (6) 241,47 272,47 (15) 237,03EUR: CHF 1,57 4 1,63 1,52 5 1,61
finanCial peRfoRmanCe
2009 2008 2007
Rm Rm Rm
Turnover 50 869 45 046 34 229Operating profit before capital items 5 153 4 662 3 059Operating profit margin (%) 10,1% 10,3% 8,9%Profit attributable to shareholders 3 379 3 310 2 970Earnings per share (cents) 256,1 249,8 241,9Headline earnings per share (cents) 252,9 263,5 200,1
The global economic slowdown and negative consumer sentiment affected our global trading operations to varying degrees, but overall, the group’s operations traded satisfactorily. The entrepreneurial culture inherent in the group enabled it to adapt quickly to the changed business environment.
This segment benefitted from a marked shift in consumers’ trading patterns and preferences towards the value and discount segments. European Retail Management (ERM) was consolidated for a full year during the year under review accounting for the majority of the retail household goods segment’s increased revenue.
26 • Steinhoff AnnuAl RepoRt 2009 • finAnce RepoRt

We measure our financial performance internally in terms of a number of economic ratios. These ratios relate to several performance areas including earnings growth, gearing and cash flow generation, which are described in more detail hereafter.
The increase in earnings coupled with the stable operating margin was encouraging. Earnings attributable to shareholders increased by 2%, while headline earnings decreased by 4% from R3 375 million to R3 226 million, and headline earnings per share decreased by 4% from 263,5 cents per share to 252,9 cents per share.
EARNINGS INCREASE 2009 2008
Rm Rm %
Headline earnings 3 226 3 375 (4)Preference dividends 111 111Exceptional items (net of taxation) 42 (176)
Impairment of associate – (155)Profit/(loss) on capital disposals 51 (15)Other capital adjustments (9) (6)
Attributable earnings 3 379 3 310 2
opeRatinG peRfoRmanCeRevenue The group’s revenue increased by 13% to R50,9 billion (2008: R45,0 billion).
Geographical revenue was generated as follows, 38% in southern Africa, 37% in continental Europe, 19% in the United Kingdom and 6% in the Pacific Rim. The geographical revenue should be evaluated taking into account the effect of the various exchange rates.
revenue per segMent
Retail activities – household goods and
building supplies
Retail activities – automotive
Manufacturing and sourcing of household
goods and related raw materials
Logistics services
Corporate services
39%
35%
16%
9%1%
Operating segments and their impact on revenue:• Retailofhouseholdgoodsandbuildingsupplies
The 45% increase in revenue in this segment is mainly attributable to the group’s retail operations in continental Europe, as well as the full-year consolidation of the ERM. This market is characterised by various trading concepts, particularly large scale discount formats which offer a full range of furniture and household goods. The resilience of the retail discount segment resulted in double-digit like-for-like sales growth and this division continues to benefit from consumers buying down.
Steinhoff UK retail had a stable performance, with both the furniture and household goods and bed divisions gaining market share despite the difficult economic conditions in this area.
finAnce RepoRt • Steinhoff AnnuAl RepoRt 2009 • 27

• RetailautomotiveThe automotive retail division reported an 18% decline in revenue. The division’s strategy and market positioning in the volume segment of the vehicle market provided some protection in the declining market.
• ManufacturingandsourcingofhouseholdgoodsandrelatedrawmaterialsThe diversity and flexibility of our manufacturing and sourcing operations continued to support the group-owned and external retail customers. Revenue increased by 23% in this segment.
• LogisticsservicesThis segment benefitted from numerous long-term contracts negotiated in the current and prior year, resulting in balanced industry exposure and market share gain. This market share gain contributed to the 16% growth achieved for the year.
• CorporateservicesBrand management – comprises group income whereby the group charges market-related royalties to its group operations for centrally owned and managed brands. Central royalty income is only applicable to certain of the group’s operations and was flat, in euro terms, for the year under review.
Investment participation – comprises income earned in respect of investments and loans with strategic retail partners in continental Europe. In line with increased investments (as disclosed under the segmental assets detail), income from investment participation increased by 21% in euro terms.
Central treasury and other – comprises all group and treasury-related income as it relates to central operational hedging activities, volume rebates, trade commissions, discounts and similar income. The 34% decrease in central treasury income reflects the challenging market conditions including the volatile currencies.
Operating profit The diversity of operations, good financial management and the scale of manufacturing and sourcing operations enabled the group to maintain the average operating margin at 10,1% (2008: 10,3%).
OPERATING MARGIN BEFORE CAPITAL ITEMS 2009 2008
% %
Retail activities 5,2 5,3– Household goods and building supplies 6,4 6,5– Automotive 2,8 3,9Manufacturing and sourcing of household goods and related raw materials 10,8 11,3Logistics services 11,7 9,2Total after intersegment eliminations 10,1 10,3
28 • Steinhoff AnnuAl RepoRt 2009 • finAnce RepoRt

operating profit before capitaL iteMs and eLiMinations
Retail activities – household goods and
building supplies
Retail activities – automotive
Manufacturing and sourcing of household
goods and related raw materials
Logistics services
Corporate services
43%
12%
17%23%
5%
net finanCe ChaRGesNet finance charges increased to R1 billion (2008: R705 million). The increased interest charges are mainly as a result of the R1,6 billion convertible bond, issued in June 2008 (maturing in June 2015) and the increased currency conversion rate of euro-denominated interest charges. The net finance charges are further characterised by lower Euribor and Libor rates, partly offset by higher spreads charged by financial institutions. The higher spreads were largely payable on short-term facilities accessed by the group.
taxation The group’s effective tax rate for the year increased to 13,8% (2008: 9,6%). This increase is mainly attributable to the full-year consolidation of retail operations which are located in higher taxation rate jurisdictions such as Germany.
The tax rate is influenced by, inter alia, the following:
• ThegroupownsandmanagesmostofitsbrandsinSwitzerland.ThetaxationrateinSwitzerland on intellectual property holding companies are fixed at combined rates ranging between 8% and 12%.
• ThegroupbenefitsfromvarioustaxationdispensationsinselectedeasternEuropeancountries.
The group expects that for the foreseeable future the total taxation expense will remain below 15% of profit before taxation.
DebtThe group finances its operations through cash generated by the business and a mixture of short, medium and long-term bank credit facilities, bank loans, corporate and convertible bonds and commercial paper. In this way, the group is able to gain exposure to a balanced mix of funding sources.
On 28 November 2008, FitchRatings affirmed Steinhoff’s national long-term rating at A(zaf) and the short-term rating at F1(zaf), but revised the outlook on Steinhoff from stable to negative. The revised outlook reflects Fitch’s concerns about the downturn in the retail and automotive sector in the regions where the group operates. Phaello Finance Company (Proprietary) Limited, a wholly owned subsidiary of the group, is also A(zaf) rated.
finAnce RepoRt • Steinhoff AnnuAl RepoRt 2009 • 29

The group’s long-term capital expansion projects are financed by a combination of floating and fixed-rate long-term debt. Debt is normally financed in the same currency as the underlying project and repayment terms are designed to match the cash flows expected to be generated by that project.
The Steinhoff Africa and Steinhoff Europe balance sheets are managed separately. The group’s European debt is mainly denominated in euro and was converted at a closing rate of R10,8265:1 euro, 12% lower than the conversion rate on 30 June 2008.
The long-term debt profile and terms of the group’s debt remained largely unchanged during the year under review. As at 30 June 2009, the group had net interest-bearing debt of R8,8 billion (2008: R9,4 billion) resulting in a net debt:equity ratio of 35% (2008: 38%). On 30 June 2009 the total cash and cash equivalents and confirmed unused borrowing facilities amounted to R8,1 billion (30 June 2008: R10 billion).
NET DEBT 2009 2008
Rm Rm
Funds on call and deposit 1 269Bank balances and cash 4 735 4 726Long-term interest-bearing loans and borrowings (12 704) (12 685)Short-term interest-bearing loans and borrowings (5 111) (2 970)Bank overdrafts (67) (1 075)Gross debt net of cash (13 146) (11 735)Interest-bearing investments and loans 4 312 2 347Net debt (8 834) (9 388)
GEARING RATIO AND NET DEBT
2000 2001 2002 2003 2004 2005 2006 2007 20092008
10 000 40%
0%
5%
10%
15%
20%
25%
30%
35%
0
-2 000
2 000
4 000
6 000
8 000
Rm Net debt
Gearing ratio
The objective of capital management is to maintain the optimal level of capital in the most cost-efficient way. Gearing is monitored on a group-wide basis, in line with limits and internal covenants set by the board.
The focus continues to be on ensuring capital strength after taking into account all planned projects influencing the capital structure, as well as providing for unexpected events and certain stress scenarios. The approved capital plan is reviewed and tested on an ongoing basis. The group is appropriately capitalised as shown by the considered ranges of normal to more severe scenarios evaluated. Given the current uncertainty in the international and domestic financial markets, funding and liquidity remains a primary focus.
30 • Steinhoff AnnuAl RepoRt 2009 • finAnce RepoRt

During the year, the group commenced with issuing short-term commercial paper under the UTR02 (Unitrans Services) domestic medium-term note programme. This note programme was used continuously to manage the costs of short-term financing.
Subsequent to year-end, Hemisphere International Properties BV (an associate investment of Steinhoff Europe at 30 June 2009), secured a syndicated loan facility resulting in Hemisphere repaying €100 million of the shareholder’s loan held by Steinhoff Europe.
Cash flow analysisCash flow remains an internal key performance indicator of the group and forms part of all divisional managements’ performance criteria and short-term incentives. In line with the group’s strategy to benefit from the challenges brought about by the global economic slowdown, all short-term incentive bonuses have been enhanced with primary focus being on cash management to optimise working capital resources within all divisions and regions where the group operates.
The group’s policy in the current economic climate to extend and improve credit terms to creditworthy retailers supported continued sales growth and margins, particularly in the manufacturing and sourcing division. This remains a focused strategy in respect of major retailers operating in areas where the group previously had no presence.
The group maintained its early settlement creditor policy and this benefitted margins with higher settlement discounts available, particularly in the current economic environment. These initiatives also supported key suppliers and secured lasting supply arrangements which should continue to benefit the group. Improved focus on inventory management enabled the group to reduce inventories and improve stock turnover.
CASH FLOW 2009 2008
Rm Rm %
Operating profit before capital items 5 153 4 662 11Depreciation 975 831 17Revaluation of biological assets and other non-cash adjustments (257) (107) 139Working capital changes (1 937) 98Inventory 541 43Debtors and other current assets (933) (129)Creditors and other current liabilities (1 545) 184Dividends, taxation and interest (1 350) (1 253) 8Cash flows from operating activities 2 584 4 231 (39)
Capital expenditure is largely restricted to maintaining the group’s current operational capacity.
CASH FLOW 2009 2008
Rm Rm
Cash flows from operating activities 2 584 4 231Investing activities (3 987) (5 943)
Capital expenditure (1 273) (2 719)Investment in subsidiaries (30) (2 042)(Increase)/decrease in investments and loans (1 791) 1 403Increase in investment in associates (860) (1 630)Increase in treasury shares (33) (955)
Financing activities 1 701 1 399Movement in cash and cash equivalents 298 (313)
finAnce RepoRt • Steinhoff AnnuAl RepoRt 2009 • 31

Investing activities include:
• Thegrouphasre-evaluateditscapitalexpenditureprogrammeinlightofthechanging
consumer environment and is selectively investing to support future growth, including
capacity expansion.
• Thegroupextendedinterest-bearingloansinordertosecureadditionalretailproperties
through its associate investment company, Hemisphere International Properties BV as well
as to certain strategic partners during the year. These loans should support future growth.
intanGible assets anD GooDwillIAS 36 requires that the following items be reviewed for impairment at least annually,
irrespective of whether there is any indication of impairment:
• Intangibleassetswithanindefiniteusefullife.
• Intangibleassetsnotyetavailableforuse.
• Goodwillacquiredinabusinesscombination.
All intangible assets and goodwill were tested for impairment. For more information on
the underlying assumptions and testing methods, refer to notes 9 and 10 of the financial
statements. These impairment tests did not result in any impairment charges during the
current year. Impairment testing was done consistently with the prior year.
The 11% decrease in intangible assets and goodwill is mainly attributable to the 12%
decrease in the rand:euro closing exchange rate at 30 June 2009.
DistRibutionsThe board has proposed a distribution of 60 cents per share – unchanged from the previous
year – this represents a dividend cover in excess of four times headline earnings per share
and basic earnings per share. All shareholders will be awarded a capitalisation share
award with the right to elect to receive a cash distribution of 60 cents per share. Details of
payment dates and related matters are disclosed in the directors’ report.
key aReas wheRe manaGement’s juDGement has been applieDDepreciation ratesAn entity is required to measure the residual value of an item of property, plant and equipment as the amount the entity estimates it would currently receive for the asset if the asset was already of the age and in the condition expected at the end of its useful life. Although the group made use of all available market information in assessing the residual values and useful lives of these assets, these could vary depending on a number of factors, such as technological advancements and changes in property markets.
Impairments and fair valuationsImpairment assessments of property, plant and equipment, goodwill and intangible assets are performed annually. Intangible assets and goodwill are primarily tested using the relief-from-royalty method or discounting the future cash flows expected to be generated by these assets. The relevant cash flows are then discounted using the weighted average cost of capital (WACC) and the net present value of these cash flows is compared to the current net asset value and, if lower, the assets are impaired to the net present value. Management uses its best estimates when forecasting market conditions and expected useful lives that drive these calculations, but these estimates can also be influenced by a number of different factors in various countries.
WACC drives many of the group’s fair valuation estimates. The WACC rate differs from country to country. The resulting net present value for similar cash flows year-on-year will be influenced by changes in the WACC rate. External uncontrollable variables such as interest rates influence the WACC rate, and could result in impairments or derecognition of previous impairments. The principal assumptions used in calculating the carrying values of intangible assets are highlighted in note 10 to the annual financial statements.
The group also owns and manages timber plantations for use in manufacturing timber products. The Faustman formula and discounted cash flows were applied in determining the fair values of the plantations. In the current year, the carrying value of the group’s consumable biological assets was increased, as explained in more detail in note 14.
32 • Steinhoff AnnuAl RepoRt 2009 • finAnce RepoRt

The Faustman formula comprises many variables including timber prices and timber yields that are influenced by a number of external factors and could result in material fluctuations in the fair valuations of the group’s timber interests.
Valuation of financial instrumentsDerivative financial instruments are marked to market at balance sheet date. The value of these derivative instruments fluctuates daily and the actual amounts realised may differ materially from the value at which they are reflected on balance sheet date.
Also refer to note 35 to the annual financial statements for further details.
Risk manaGementThe group’s success in its overall strategy is largely attributable to its business philosophy, which supports decentralised, autonomous business units with an entrepreneurial culture.
The board recognises that some elements of risk management can only be achieved on an integrated basis and, as such, financial risks such as exchange rate risk, interest rate risk, liquidity risk and commodity price risk are largely controlled centrally and explained in the risk management section of the corporate governance report.
We draw your attention to some pertinent risks within the business.
Financial risk managementThe group’s financial instruments are listed in note 19 of the annual financial statements. Derivative instruments are used by the group for hedging purposes.
Such instruments include forward exchange and currency option contracts and interest rate swap agreements. The group does not speculate in trading derivative or other financial instruments.
A finance forum consisting of senior financial group executives meets regularly to analyse currency and interest rate exposure and to re-evaluate treasury management strategies in the context of prevailing economic conditions and forecasts. The finance forum also reviews the hedging policy of the group on an annual basis.
Liquidity risk managementThe group’s policy is to manage debt maturities to be spread over a wide range of periods, to manage the risk of excessive refinancing risk in any one year. The group further manages liquidity risk by monitoring forecast cash flows and maintaining adequate unused borrowing facilities. The group uses a variety of debt suppliers and instruments to cap its exposure to any one supplier or instrument.
Currency risk managementThe principal objective of our currency risk management and hedging strategy is to seek to mitigate exposure to movements in foreign exchange rates for the major currencies the group is exposed to namely US dollar, euro, pound, Australian dollar and zloty denominated net assets and earnings, taking into account its potential effect on our net debt and related credit statistics. The group’s reported profits, net assets and gearing are all affected by movements in foreign exchange rates. It is group policy to hedge exposure to cash transactions in foreign currencies other than the reporting currency of the underlying operation for a range of forward periods but not to hedge exposure for the translation of reported profits. In addition, currency assets should be hedged by way of currency borrowing where practicable.
The responsibility for monitoring and managing these risks is that of management in conjunction with the central treasury and foreign exchange support functions.
Interest rate risk managementInterest rate exposure is managed within limits agreed by the board. The group continues to manage its interest rate exposure by maintaining a percentage of its debt at fixed and floating rates of interest. This is done either directly by means of fixed rate debt issues or by use of interest and cross-currency swaps to convert variable-rate debt into fixed-rate debt and fixed/variable non-functional currency denominated debt into fixed-rate functional currency debt and vice versa. The use of derivative financial instruments relates directly to underlying existing indebtedness and exposure.
The exposure to fluctuating interest rates is managed by either issuing fixed or floating rate debt or using a range of financial derivative instruments to create the desired fixed/floating mix.
finAnce RepoRt • Steinhoff AnnuAl RepoRt 2009 • 33

All treasury transactions are undertaken to manage the risks arising from underlying activities and no speculative trading is undertaken.
As part of the process of managing the group’s borrowing mix, the interest rate characteristics of new borrowings and the refinancing of existing borrowings are positioned according to expected movements in interest rates.
Credit risk managementTrade accounts receivable and short-term cash investments pose a potential credit risk to the group. The role of the group’s credit function is to set consistent standards for assessing, quantifying (scoring), monitoring, mitigating and controlling the credit risk introduced by contractual obligations of trading partners and commercial clients. The group’s trade accounts receivable consist mainly of a large and widespread customer base. Group companies monitor the financial position of their customers continually, and appropriate use is made of credit guarantee insurance. The granting of credit is controlled by application and account limits. Provision is made for both specific and general bad debts and at year-end management did not consider there to be any material credit risk exposure that was not already covered by credit guarantee insurance or bad debt provision. In the current economic climate, much attention was paid to analyse the creditworthiness of existing and potential customers.
Cash surpluses and short-term financing needs of manufacturing and sales companies are mostly centralised at the African, European and Asian Pacific central offices which invest net cash reserves on the financial markets, mainly in short-term instruments indexed to variable rates.
Pension and provident fund riskA suitably qualified board of trustees exists for each fund, where statutorily required, which together with professional investment advisors and internal investment subcommittees, is responsible for evaluating the effectiveness of investment decisions. The group and, where applicable, relevant subsidiaries remain committed to its retirement obligations to current and former employees, and to retirement benefits in general as a key part of its remuneration package.
Downturn in the global economySteinhoff maintains a geographic and operational diversity of businesses to help protect the group against an economic downturn in specific regions. The geographical spread of the manufacturing, sourcing, retailing and warehousing functions allows units to quickly adjust operations to counter market difficulties.
Regulatory environmentThe board utilises various committees, led by functional experts, throughout the group to communicate to key management within our business units the direction and effect of possible legislative and regulatory changes of countries in which we operate.
Acquisition riskA formal due diligence process and procedure is in place that sets out the approach and framework to be used when acquisitions are made. This includes continuous strategic analysis of intended targets, development of acquisition criteria, both in terms of the group’s strategic direction and potential value creation for the respective business units of the group.
A dedicated mergers and acquisition department reviews and manages the entire process relating to mergers and the application and implementation of business combinations. All possible merger and acquisition opportunities are reviewed by the executive committee.
Insurance risk managementWhere cost-effective, the group maintains a wide-ranging insurance programme providing financial protection against unforeseen events that could cause financial loss. The renewal of the group’s main insurance policies for 2009/10 has been completed, maintaining prior-year levels of cover.
All risks are considered to be adequately covered, except for political risks. Self-insurance programmes are in operation, covering primary levels of risk at a cost more advantageous than open-market premiums. Regular risk management audits are conducted by the group’s risk management and insurance consultants, whereby improvement areas are identified and resultant action plans implemented accordingly.
34 • Steinhoff AnnuAl RepoRt 2009 • finAnce RepoRt

key peRfoRmanCe inDiCatoRsThe primary key performance indicators used to measure operational management and to manage the financial performance of the business proved successful and remain in place.
These include:
• Theanalysisofvolumesandsalepricesagainstbudgetandhowthebusinessisregenerating itself in the short term and positioning itself for the long term.
• Trendsinmarketandinternalvolumeswhichprovideinsightsintounderlying business growth.
• Cashflowgenerated.• Risingcoststhroughwhichwemanageandanalysethecostbaseinrelationtosales.• Operatingprofitmarginprogressionovertime,whichdemonstratestheoverallquality
of the business and earnings.
finanCial stRateGy anD taRGetsThe group’s diversified nature and geographical spread of both products and operations have, in the past, provided a flexible business model to compete in volatile and changing market conditions as demonstrated by the earnings and margin performance of the group.
Given the global market conditions, the group will continue to embrace opportunities with caution. The group’s vertical integration model and strategic procurement relationships with selected suppliers remain key strengths on which to capitalise.
Opportunities exist for the group to increase volumes sourced and manufactured through our existing supply chain that could result in increased economies of scale in Europe and in our international sourcing division.
In Africa, our capital expenditure programme has been largely completed and increased cash flows as well as a sustainable medium-term performance are expected from the logistics and timber businesses. The motor retail division’s performance is closely linked to the industry as a whole. This industry is affected by the current market slowdown, but we are confident that the product mix in this division will again result in an outperformance of our peer group.
ConClusionIn the current macro-economic environment effective working capital management and financial prudence remain a priority to us. The objective is to ensure a robust balance sheet that can weather the current cycle, and to protect and support the operating divisions to ensure that the group is well positioned when business conditions improve.
appReCiationThe finance function within Steinhoff spans many territories and regulatory environments. As such we are supported by a team of experienced decentralised finance professionals that has served the group for many years, in particular Hein Odendaal (Group audit executive), Siegmar Schmidt (CFO: Northern Hemisphere), Ben la Grange (CFO: Southern Hemisphere), Philip Dieperink (CFO: UK), Gerrit Venter (CFO: continental Europe) and Michael Gordon (CFO: Asia Pacific).
A special word of thanks to our auditors and internal financial management teams for the way in which the group’s financial results were prepared, audited and presented for the year under review.
frikkie nel stéhan grobler8 September 2009
finAnce RepoRt • Steinhoff AnnuAl RepoRt 2009 • 35

Geographical diversity, mass-market positioning of retail activities, and scale of manufacturing, sourcing, and logistic operations supported solid results.
Steinhoff operates a vertically integrated and geographically diverse business model, consolidating all points of contact from raw materials to retail outlets across extensive product offerings that focus on furniture, beds and related homewares and, in Africa, also includes building supplies, automotive products and vehicles.
Geographically, Steinhoff focuses on Europe, Asia Pacific and Africa. Each region applies the most appropriate supply chain given the strengths and opportunities inherent in that individual market.
The vertically integrated business model allows the retail operations to either make use of external suppliers or effectively “pull” from the group’s manufacturing and sourcing supply chain and make use of the integrated warehouse and distribution platform of the group. Management is acutely aware of the risks associated with a vertical integration strategy. Therefore the businesses are managed in comparable operational silos, that allow skill and expertise aggregation by individual business segments, and allows for margin and market positioning comparison against peers.
The group services teams in different regions support operational management in all corporate services that allows local management to devote their full attention on operational issues. These teams ensure that the corporate assets and financial risks are professionally managed, particularly as it relates to brand management, participation interests, treasury and other activities.
operatIonal reportoperat ional areas, geographica l areas and f inancia l h ighl ights
36 • Steinhoff AnnuAl RepoRt 2009 • opeRAtionAl RepoRt

SEGMENTAL RESULTS: OPERATING MARGINS 2009 2008
% %
Retail activities 5,2 5,3– Household goods and building supplies 6,4 6,5– Automotive 2,8 3,9Manufacturing and sourcing 10,8 11,3Logistics services 11,7 9,2Total after intersegment eliminations 10,1 10,3
Gross revenue by operating segment
Retail – aUtOMOtiVe
Retail – hOUsehOld gOOds and
bUilding sUpplies
35%
lOgisticsManUfactURing and sOURcing
Retail activities – household goods and
building supplies
Retail activities – automotive
Logistics services
Manufacturing and sourcing
Corporate services
Continental Europe
Pacific Rim
United Kingdom
Africa and India
geographicaL revenue anaLysis
19% 16%
37%35%
38%39%
6%9%
1%
segMentaL revenue anaLysis
cORpORate seRVices
16% 39% 9% 1%
opeRAtionAl RepoRt • Steinhoff AnnuAl RepoRt 2009 • 37

Manufacturing and sourcingAfr ica and India, Pacif ic Rim, United Kingdom, continental Europe
This segment includes the integrated timber operations of PG Bison and raw material operations within Africa, as well as the integrated furniture and household goods manufacturing and sourcing operations in Europe and the Pacific Rim.
Since listing in 1998, the group transformed from a manufacturing and sourcing business to a diversified vertically integrated business. In the current economic climate, the strategic importance of this transformation was highlighted. The segment grew organically by virtue of the inherent flexibility within the manufacturing and sourcing operations.
The group’s strategy to support selective external retailers within Europe and add group-owned retail footprints to the existing manufacturing and sourcing supply chain within Europe and the Pacific Rim, has proved particularly valuable in this time, achieving organic growth in excess of 23% from this ‘pull-effect’.
38 • Steinhoff AnnuAl RepoRt 2009 • opeRAtionAl RepoRt

nUmBer of faCtories
Australia 3Germany 3Hungary 2Netherlands 1Poland 10Ukraine 1UK 6Total furniture 26Africa
BCM 2PG Bison 16Mattex 1Vitafoam 7
India 2UK 1Total raw materials 29
totaL assets revenue contribution
operating profit before capitaL iteMs
Locations
Australia
Germany
Hungary
India
Kenya
Namibia
Netherlands
Poland
South Africa
Ukraine
UK
sourcing Locations
Africa
China
Eastern Europe
India
Malaysia
Thailand
Vietnam
26%39% 43%
opeRAtionAl RepoRt • Steinhoff AnnuAl RepoRt 2009 • 39

easteRn euRope anD GeRmanyThe division owns the majority of the group’s manufacturing capacity and comprise the production facilities in eastern Europe and Germany and includes:
The European upholstery division• SevenfactoriesinPoland,onefactoryintheUkraine,onefactoryinHungaryandtwo
factories in Germany
The European case goods division/Klose• ThreefactoriesinPolandandoneinHungary
Bathroom furniture/PurisBad• OnefactoryinGermany
European trading division/BST• Varioustradingoffices
The division reported satisfactory results, broadly similar to the previous year.
The depreciation and volatility of the Polish zloty (zloty) coupled with the decrease in raw material costs caused some deflationary pressure on selling prices and gross margins. As reported previously, the relatively strong zloty in prior periods, and labour migration following EU inclusion, has resulted in a major restructuring of this division, which was completed in the previous financial year. This resulted in the group maintaining competitive operating margins, notwithstanding the above deflationary pressures on gross margins in the year under review.
The division continued to take advantage of the rationalisation and consolidation prevalent in the household goods industry within Europe. Additionally, the growth experienced from the mass-market volume segment in the European retail market, benefitted volumes further, given the group’s competence in appropriately satisfying consumers’ requirements and preferences in this market segment.
Continental eUropean trade Brands
40 • Steinhoff AnnuAl RepoRt 2009 • opeRAtionAl RepoRt

During the year under review, the division embarked on a deliberate strategy to support its key suppliers and develop increased business relationships with creditworthy European retailers. The resultant working capital investment stood the division in good stead and has resulted in market share growth for the division as a whole. The benefits emanating from this strategy, included accelerated growth within the French and Austrian regions, previously underdeveloped sales territories for this division.
The division’s proximity to the large European furniture markets, its ability to manufacture and assemble furniture sourced from Asia and Europe, coupled with its ability to replace or repair products under warranty, remains a key competitive advantage to group-owned and external retailers.
Additionally, the extensive marketing initiatives, coupled with a broad range of brands across price segments, has resulted in record order intakes.
The wholesale/trading arm of the European manufacturing and sourcing business focuses on sourcing primarily tables, chairs and occasional furniture for the traditional European furniture retailers and large discounters. The division works closely with the Steinhoff International sourcing offices across the world and again exceeded growth expectations in the year under review. Germany remains the largest supply market, but significant inroads have been made in supplying to external retailers in France, Austria and Switzerland. Given this division’s product and customer knowledge and expertise in sourcing from the Far East through Steinhoff International sourcing division and eastern European suppliers, continued growth is expected as scale benefits translate into further margin enhancements for the internal and external customer base.
uniteD kinGDomThe manufacturing and sourcing division in the UK comprises six manufacturing plants, including four bed manufacturing plants, the Pritex foam conversion production plant as well as one upholstery plant in Bridgend, Wales. The entire European mattress manufacturing operations form part of the UK management team and include the manufacturing operations in Holland (Norma) and Germany (Hukla). These manufacturing plants are supported by import offices that work closely with the Steinhoff International sourcing division.
The UK has seen particular tough trading conditions in our key markets during the year under review. However, increased intra-group trading activity with our retail division compensated for weaknesses experienced in the external markets. This, together with considerable operational rationalisation, has positioned our business well for any economic upturn.
Relyon, the bed manufacturing operation, remains focused on the dual challenge of building key account sales, while reducing input costs.
Pritex’s outstanding growth track record was knocked off stride by the rapid decline in automotive sales, severely impacting the automotive and industrial acoustic insulation businesses. This was offset, to a degree, by the rapid growth in foam mattress sales for the UK’s bed retail businesses. Pritex is focused on recovering all of its lost ground within the acoustic insulation business as automotive and industrial sales are slowly rebuilding, which bodes well for the prospect of continued growth for the foam mattress and acoustic insulation business in the longer term.
Steinhoff UK Upholstery has now been fully integrated into the Harveys furniture retail chain. After three successful years of growth, this division now manufactures over 400 upholstered suites per week (over 95% for Harveys) and manages the import supply chain of all imports for Harveys from the Far East.
opeRAtionAl RepoRt • Steinhoff AnnuAl RepoRt 2009 • 41

On the continent, our mattress manufacturing operations, Hukla and Norma, continue to experience difficult trading conditions. The market in Holland appears to be lagging that of the UK, and recovery still seems several months away. Reduced raw material costs, and the experience and scale of the consolidated mattress manufacturing group, will however, benefit margins in time to come.
paCifiC RimThe division’s operations include three production plants which produce solely for the group’s own use and operate in close association with the Steinhoff International sourcing division which supplements group manufactured products with imported products from the east.
Australia experienced historical lows in consumer spending which had a direct impact on the retail market, adversely affecting capacity utilisation in these manufacturing operations. Better utilisation of the manufacturing facilities continues to provide the competitive advantages of quality, shorter lead times and customisation of products to our group-owned retail operations and their customers’ preferences.
Certain risks, specific to manufacturing activities, have been identified within the division and plans have been put in place to address those risks. This is done by actively reviewing manufacturing processes, reducing costs, mitigating cost pressures, and guarding against skill shortages and implementing effective vendor management programmes.
United Kingdom divisional Brands
* European mattress brands managed as part of the UK business.
*
*
42 • Steinhoff AnnuAl RepoRt 2009 • opeRAtionAl RepoRt

steinhoff inteRnational souRCinGThis division continued to build capacity within their supplier base to satisfy the group’s sourcing demand. Good growth was achieved, coupled with improved quality and customer service levels, thereby benefitting margins within the retail divisions they serve.
As a service division to the group, Steinhoff International sourcing creates a distinct competitive advantage by providing speed to market, and identifying and assessing potential suppliers. In addition, this division is responsible for the following functions: comprehensive material procurement, product and fabric development; technical assistance; coordination of sample approvals; assessment of lab tests and raw material availability; and the supervision of logistics and shipping information as well as undertaking quality assurance inspections at all vendor production sites.
The past financial year’s slowdown in the economy provided some interesting opportunities. Raw material prices decreased and Asian manufacturers struggled to fill their capacity. The diversified nature of our external retailers and the growth of Steinhoff’s owned retail division, gave the sourcing office a strong bargaining position with regards to suppliers. This growth and scale enabled us to reduce prices, negotiate credit terms with larger suppliers and improve manufacturing lead times.
As many suppliers faced an uncertain financial future and possible closure, it became more critical for the group to manage this risk through intensified supplier evaluation and support. Supplier selection became key to ensure continuity, reliability of supply, and quality. The growth of the retail business also influenced supplier selection as the division had to support its suppliers who could deliver on the growth of the demand. Despite harsh market realities, Steinhoff believes in strategic supplier alliances. Together with the retail partners, careful supplier selection and consolidation have ensured that Steinhoff remained a key partner to many suppliers. Further consolidation will open up more opportunities to also service the smaller retail operations at better prices and service levels.
The product focus of the sourcing activities is on upholstery and case goods, beds and bedroom furniture, sourced from China, Thailand and Vietnam, and recently out of Malaysia. The division does not invest in production capacity or assets, but retains a permanent employee base focused on quality service delivery to our global operations. The team of employees is structured around category management and product specialisation, and serves customers in the UK, continental Europe and Australia, with Africa as an identified area of future growth.
opeRAtionAl RepoRt • Steinhoff AnnuAl RepoRt 2009 • 43

afRiCaThe first six months of the 2009 financial year saw consumer consumption slowing down, resulting in a decline in business activity across most sectors. Levels of debt, as a ratio of disposable income, increased substantially, thereby limiting discretionary spend.
PG BisonIn line with the majority of our African investments PG Bison is closely linked to the infrastructural development within the African continent.
The operations of PG Bison include three sawmills and nine manufacturing plants that are supplied partially by PG Bison’s 44 000 hectare plantations, growing on 95 000 hectares of land in KwaZulu-Natal, Western and Eastern Cape. Collectively, these plantations yield some 690 000m³ timber per annum on a sustainable basis, which is supplemented by numerous independent growers. PG Bison’s integrated value chain, stretching from seedling to lifestyle products is built on forestry, timber beneficiation, board and laminate production, component cutting, distribution and retail, and allows the company to service different sectors of the market throughout the country. Strong brands such as BisonBord, Formica, MelaWood, SupaWood, Surinno, MOJA and Woodline make up some of PG Bison’s well-known household product names.
afriCan trade Brands
BEDDING COMPONENT MANUFACTURERS
44 • Steinhoff AnnuAl RepoRt 2009 • opeRAtionAl RepoRt

The demand for wood-based panel products was negatively affected by the global economic conditions as evidenced by the slowdown of the construction and furniture sectors. This has affected a large part of PG Bison’s diverse customer base. The strong rand led to more imports entering the South African market, while resellers responded to the volatility by maintaining low stock levels. As a result, net sales for the group remained static, but PG Bison retained its market share. The forest and pole division, as well as Woodchem, came in with strong performances for the year while the sawmill business reduced production levels in response to the lower demand.
The softer market conditions allowed PG Bison to focus on business optimisation and rationalisation after almost a decade of rapid growth. The business brought forward medium-term initiatives to mothball the less efficient particleboard line in Pietermaritzburg and accelerated the investments within its own forests. The company’s strategy of optimising tree utilisation has gained renewed momentum with the development of the new particleboard plant at Ugie, in the North Eastern Cape. This forestry cluster was further enhanced in the current year by extending existing areas under cultivation, resulting in improved utilisation of owned timber supply. PG Bison has also embarked on processes to improve overall timber yields through improved silvicultural practices and better utilisation of available fibre.
Raw material divisionThe division comprises Vitafoam (foam), Mattex (textile), BCM (springs and components) and Alam Tannery (leather) and operates from seven foam factories, two bedding component factories, one textile factory, a tannery and a cut-and-sewn facility in India. The slowdown in the South African household goods retail market continued to affect this division to varying degrees, exacerbated by customers (and end consumers) trading down and buying lower specification raw material products.
The foam division, being the largest contributor of revenue and profits within this division, continues to show encouraging growth and margin expansion as a result of improved raw material utilisation, wastage and expense reductions, and lower prevailing chemical prices. In addition, the foam division experiences less competition from imports (given the nature of foam products) compared to that of the textile and bedding component divisions.
Alam tannery mainly serves European customers, including Steinhoff group manufacturing facilities in Poland and Hungary. While revenue was affected by the European market decline, the division reported satisfactory results on the back of operational efficiencies achieved within the new Calcutta tannery and the cut-and-sewn facility.
Mattex recently concluded an agreement in principle with Deslee Clama, a European textile group. Deslee Clama will supply knitting machines and modern technology looms to Mattex which will increase the latter’s capacity and capabilities substantially.
The bedding component business was adversely affected by import duties imposed by the USA, previously a major customer base of this division. Sales in the local market also slowed and the division has responded by targeting independent manufacturers and new export markets.
opeRAtionAl RepoRt • Steinhoff AnnuAl RepoRt 2009 • 45

LogisticsAfr ica, Pacif ic Rim, United Kingdom, continental Europe
Our logistics functions are closely aligned to our business strategy in each region. These operations are well positioned to bridge infrastructural challenges in Africa, and connects manufacturing and sourcing activities to retail customers in Europe and the Pacific Rim.
Provision of logistic services through comprehensive supply chain solutions and effective management of warehouses and distribution networks remains essential to each of our businesses, ranging from hauling saw logs from a forest to the ultimate delivery of household goods to the end consumer. Control over the supply chain gives rise to better service levels and ability to guarantee product delivery within a competitive cost structure.
Worldwide volatility in fuel prices, pressure on natural resources, greater awareness of sustainability and safety requirements, has increased the barriers to entry within this industry. This, coupled with the specialist nature of the supply chain management contracts continues to insulate this division from any irrational competition and protects margins throughout the integrated value chains.
unitRans supply Chain solutions (usCs)The USCS business is built on the vision:
• tobethemostinnovativeproviderofsupplychainsolutions;and• excellenceinpartnershipswithclients.
The division aims to design, implement and operate integrated supply chain solutions for its customer base, based on operational excellence, customer knowledge and sustainability.
46 • Steinhoff AnnuAl RepoRt 2009 • opeRAtionAl RepoRt

nUmBer of sites
Asia Pacific 7Germany 2Netherlands 2Poland 1UK 59Rest of Europe 2Total 73Africa
BCM 1Unitrans 160Vitafoam 2
Total 163
totaL assetsrevenue contribution
operating profit before capitaL iteMs
11%12%9%
43%
Locations: europeGermanyNetherlandsPolandUK
Locations: pacific riMAustraliaNew Zealand
Locations: africaBotswanaLesothoMadagascarMalawiMozambiqueNamibiaSouth AfricaSwazilandTanzania
opeRAtionAl RepoRt • Steinhoff AnnuAl RepoRt 2009 • 47

In a declining and uncertain market, the division increased its market share through growth in long-term contracts and increased business off existing customers that resulted in an outstanding performance with both revenue and earnings growth. USCS serves diverse industry segments that include petrochemical, sugar and agriculture, construction, mining, food and animal feed. In the year under review, USCS diversified further, with the addition of the fast moving consumer goods customers and the addition of the Global Warehouse Logistics operations in Germany.
This diversification of industry exposure protected the division from the volume declines experienced by the industrial and resource segments in the year under review. In addition, more than 90% of revenues earned by the division are governed by long-term contractual service agreements, protecting the business from any over-supply in the market at any one time.
The uncertainty brought about by the prevailing economic climate focused trade customers’ attention on their business critical services and forced them to evaluate the financial soundness and longevity of such business critical suppliers. This increased USCS’ preferred supplier status, benefitting revenues and margins. In addition, focus on supply chain management costs and the savings that could be extracted allowed USCS to further integrate themselves into their customers’ supply chains which bodes well for sustainable growth. This customer loyalty and increased business, coupled with prudent cost control, management of working capital, and focused management were all contributing factors to the strong financial performance achieved within USCS despite the challenging market conditions.
Through the thorough understanding of client and industry segment requirements, crafting the optimum logistical solution and demonstrating excellent execution, the division will maintain its competitive edge.
Global waRehouse anD loGistiCsGlobal Warehouse and Logistics provides services to the European furniture and household goods market. Managed by the freight and logistics team, the company controls the movement of goods on behalf of many customers from the source
(mostly in China) through to the retail store. The main operations are in Leinefelde (in the centre of Germany) and Westerstede (close to the port of Willemshaven in the north of Germany). The company employs a combination of sophisticated technology and state-of-the-art warehousing facilities to deliver a world-class service. The business has seen significant growth in the year under review and is looking forward to expanding its footprint to other countries in Europe.
paCifiC RimOur Pacific Rim logistics team is responsible for all inbound, warehousing and outbound logistics functions from source to delivery of products to our stores and our customers’ homes. The logistics group operates six distribution centres located in each of Australia’s state capital cities and in Auckland, New Zealand. Recent upgrades to the Kings Park (located in Sydney, Australia) state-of-the-art 50,000 m2 distribution centre have seen the introduction of an automated homewares storage and conveyor system, delivering world-class service at a competitive cost structure. A continuous improvement culture in our logistics team has ensured that we deliver a best practice service at a competitive cost structure.
unitRans passenGeRThe emerging market attributes of South Africa are complemented by its major cities and their tourism and commerce demands in-line with more developed countries. Transport remains part of a mostly underdeveloped infrastructure within South Africa. During 2008 an estimated 9,5 million tourists visited the country, and the recent and forthcoming international sporting events, which include the 2010 Soccer World Cup, position many sectors well for growth opportunities. Within the South African commuter market, estimated at 10 million passengers per annum who are dependent on public transport, coupled with the tourism transport demands, Unitrans provides an essential service to industries and communities at large.
Unitrans Passenger recorded one of its best years since inception, with revenue growth of more than 20%. These results are attributable not only to the decrease in fuel prices but also the increase in new contracts in the personnel transport segment. Results were enhanced by increased activity in the existing operations, dynamic pricing models and cost control measures.
48 • Steinhoff AnnuAl RepoRt 2009 • opeRAtionAl RepoRt

The passenger division operates in three market segments, personnel and commuter, intercity as well as tourism. Unitrans passenger is synonymous with their brands that include Mega Bus, Mega Coach, Mega Tourer, Magic Bus, Greyhound, Citiliner and Bojanala Bus, the latter being a B-BBEE investment. Our transport services of this division cater for various passenger requirements and operate across southern Africa.
Personnel transportMost of the brands of the division operate within an environment where long-term contracts are awarded, and in the case of Mega Bus and Bojanala Bus, these contracts are in place for up to seven years. This division caters mainly for the commuter transport sectors and services primarily the mining, resource and industrial sectors. These are located outside the larger metropolitan areas in communities where merely an estimated 26% of the population have access to own transport. The results were enhanced by securing additional long-term contracts which underpin sustainable growth.
Intercity transportAfter the turnaround of Greyhound and Citiliner in 2006, these brands have grown market share in both the luxury and economy intercity segments.
Tourism transportAdditional growth for this division of Unitrans Passenger will eminate from the utilisation of subcontractors and the projected influx of tourists during the following financial year. The order book already reflects an approximate 10% increase in bookings and bodes well for this division.
Gautrain – Commuter transportGautrain, the long awaited rapid rail system between Tshwane and Johannesburg, was developed to provide public transport for an estimated 100 000 people a day. This is the only metropolitan transport service of its kind in southern Africa and is expected to commence in March 2010. Unitrans Passenger has been awarded a 15-year contract to manage and operate the bus feeder and distribution service, transporting commuters to and from seven stations on the train route.
logistiCs Brands
opeRAtionAl RepoRt • Steinhoff AnnuAl RepoRt 2009 • 49

rEtaiLAfr ica, Pacif ic Rim, United Kingdom, continental Europe
This segment includes the retailing of furniture and household goods within Europe and the Pacific Rim and the retailing of building supplies in Africa.
Since listing in 1998, the group transformed from a manufacturing and sourcing business to a diversified vertically integrated business, adding a group-owned national retail footprint to its external European retail customer base and do-it-yourself (DIy) market in southern Africa. The strategic importance of this transformation, coupled with the group’s strategy to focus on the mass-market volume segment of the European market proved critical in growing market share within the softer market conditions of the year under review.
50 • Steinhoff AnnuAl RepoRt 2009 • opeRAtionAl RepoRt

44%
nUmBer of retail oUtlets
Australia and New Zealand 172Germany 87Hungary 6Switzerland 13UK 615Rest of Europe* 281Total 1 174
Southern Africa 72
totaL assets revenue contribution
operating profit before capitaL iteMs
23%35%
retaiL Locations
Australia and New Zealand
France
Germany
Hungary
Namibia
Netherlands
South Africa
Switzerland
United Kingdom
* Include studio/store-in-store concepts
opeRAtionAl RepoRt • Steinhoff AnnuAl RepoRt 2009 • 51
householD GooDsukWithin the UK, the group’s retail operations consist of a balanced mix of retail chains:
BensonsforBeds: A large bed retailer in the UK, retailing mostly branded beds.The Bed shed: Lower-end unbranded beds concentrated in North-East England
and Scotland.Cargo: 50/50 split between furniture and housewares serving the more
affluent market.harveys: Furniture specialist retail chain concentrated on traditional furniture
serving the middle-market consumer.reid: Biggest furniture retailer in Scotland and Ireland.sleepmasters: Own-label beds focused on the middle-market.
The operating profit for the retail division as a whole grew from last year. This is mainly attributable to Harveys, as the bed division’s improved profitability in both The Bed Shed and Sleepmasters was offset by the drop in profitability at Bensons which was directly attributable to a lower recovery of fixed costs as a result of lower sales.
The division’s revenue in pound terms was 4% ahead of last year while gross margins also improved. This is a commendable performance considering the prevailing market conditions and confirms the success of the previous three years’ turnaround strategy and remedial steps that were implemented timeously.
After three years in turnaround mode the growth prospects of Harveys are now looking much more promising. Upholstery sales have been buoyant in recent months, aided by the demise of certain competitors and the integration of the UK upholstery division in Wales for both manufactured and imported ranges.
United Kingdom Brands
52 • Steinhoff AnnuAl RepoRt 2009 • opeRAtionAl RepoRt
The Harveys management team under the recently appointed Alan Marnie (formerly from Reid) is now a strong and cohesive unit, focused on expansion and growth, rather than turnaround. Several high quality store openings on excellent rental terms are being finalised, which also reflect the prospects that occupational rent in the UK retail space is to remain beneficial for some time to come.
In-line with the trading-down trends that prevailed in most of the markets where the group operates, the bed retail division had mixed results. Sleepmasters (serving the middle market) increased sales compared to last year, while Benson’s (branded beds aimed at the more affluent market) decreased sales. As a whole, the bed division’s revenue was slightly down on last year.
After a period of considerable instability in the bed division due to the loss of some concession partners, the focus for 2009/10 is on stability with limited store growth aimed at complementary locations. We are now trading from 362 stores versus over 400 a year ago, reflecting a better quality estate. Store numbers have now stabilised and several quality new stores at favourable occupancy costs and terms are under review. Early indications for the new financial year are promising, evidenced by increased order intake versus that of last year, in a market which remains challenging.
Continental euRopeThe group’s retail operations in continental Europe are characterised by various trading concepts, particularly large scale discount formats which offer a full range of furniture and household goods. The resilience of the retail discount segment resulted in double-digit, like-for-like, sales growth and this division continues to benefit from consumers’ quests for a good value proposition. This is especially prevalent in the more conservative markets of central Europe. Additionally, the central European market is fragmented, with the largest retailers in this market being a few independent private retailers. Strategically Steinhoff plays to this market’s strength by selectively investing in privately held furniture retailers as disclosed in the investment participation segment.
Continental eUropean BrandsContinental eUrope Brands
opeRAtionAl RepoRt • Steinhoff AnnuAl RepoRt 2009 • 53

During the previous financial year, the group converted the majority of its investment instruments (previously accounted for under the investment participations segment) into equity of the businesses concerned. That led to the first-time consolidation of the results of various retail participation investments in this region. The inclusion of these retail operations’ revenue accounted for the majority of growth achieved in this segment as a whole. ERM, incorporates an extensive retail footprint throughout Europe. During the current financial year, Reid (previously part of ERM) was transferred to the UK retail division and is now managed as part of the UK structure.
The constituent investments of ERM comprise large scale discount retail formats. The current consumer behaviour of “buying down” has resulted in double-digit growth within the ERM business. The division experienced some once-off costs in continuing to rebrand its retail activities, in order to establish a uniformly branded national footprint, and streamlining overheads and back-office functions for all individual retail operations to be supported by a single administration and IT system. This restructuring is mostly complete and as a result, margins have increased in the second half of the financial year.
In addition to the ERM retail platform, Steinhoff Europe provides selected retailers on an exclusive, and in certain instances, non-exclusive, basis with a retail and/or studio concept based on the well-known store-in-store concepts. These concepts are positioned in the more affluent part of the retail environment. Although the Esprit concept stores suffered revenue declines, the flexibility in respect of product range and innovative concepts within the Henders & Hazel and Habufa studios, have again resulted in healthy growth within these concept stores.
paCifiC RimWithin the Pacific Rim, the group’s retail operations include:
Blr: BayLeatherRepublic positioned as Australia’s flagship leather destination, trading from 10 stores.
freedom: Furniture retailer positioned in the modern upper-mid market segment trading through 68 full concept stores and 17 Freedom home stores.
paCifiC rim Brands
54 • Steinhoff AnnuAl RepoRt 2009 • opeRAtionAl RepoRt

snooze: Bed retailer positioned as ‘sleep solutions specialist’ trading from 72 stores.other: Andersons and BBO (Big Brand Outlet) serve as support retail concepts to
the main portfolio.
The macro-economic environment had a greater impact on the Australian retail division than that of the group’s UK or European retail operations, as a result of its upper-mid market segment positioning. Consequently, the division as a whole is more exposed to discretionary consumer spending trends.
During the year under review both the Australian and New Zealand economies experienced downward pressure in line with the economic slowdown experienced globally. This was exacerbated by a dramatic decline in the value of the Australian dollar to the US dollar (from 95 cents in July 2008 to 61 cents by January 2009), forcing price increases in an already depressed consumer market.
Each of the retail operations sought to reduce the fixed operating costs by reducing overheads and accelerating projects aimed at delivering cost savings. On a retail marketing level, the businesses focused on regular tactical promotional activity to drive sales. Whilst a decline in sales was ultimately unavoidable, the businesses each improved their sales densities in the second half of the financial year.
Despite the pressure on revenues and margins, the group retained market share. Although trading conditions remain challenging, there has been a strong lift in the consumer confidence index in the last quarter, which is usually a leading indicator of an improved performance. We remain confident that our core strengths of vertically integrated businesses, reduced infrastructure costs and continued focus on customers connecting with our brands, will enable us to protect and grow our market share in the future.
builDinG suppliessteinbuilDThe Steinbuild division consists of the group’s retail interests within the building supplies market segment in southern Africa. The division manages 29 Pennypinchers and 33 Timbercity retail outlets. The specialised services include roof truss manufacturing, timber processing and contract supply of flooring solutions. The global economic crisis, particularly its effect on the South African construction market, had a material impact on the trading results of this division, especially in the third and fourth quarters. The division continued its strategic consolidation initiatives with regard to new, franchised and joint-venture stores that resulted in extra costs that adversely affected margins. It is expected that these investments will continue in the short to medium term in order to establish the appropriate national footprint in support of its existing customer base throughout South Africa.
opeRAtionAl RepoRt • Steinhoff AnnuAl RepoRt 2009 • 55

rEtaiL – autoMotivEAfr ica
The Unitrans automotive division offers a complete range of cars, products and services including new and used vehicles, parts and accessories, servicing, insurance and car rental. Operations and dealerships are located in and service the Namibian and South African markets.
revenue contribution
16%
operating profit before capitaL iteMs
5% 5%
totaL assets contribution
56 • Steinhoff AnnuAl RepoRt 2009 • opeRAtionAl RepoRt

Globally, automotive sales reached a record low due to the economic slowdown. It is forecasted that 2009 car sales figures within South Africa will have decreased by more than 20% compared to that of 2008. The division responded to the unfavourable trading conditions by strictly managing the cost base and aggressively managing working capital. Although the division reported a decline in revenue of 18%, it still outperformed the broader market as a result of its strategy and market share within the volume segment of vehicle sales, that also support growth within the after-sales service segment.
Dealer sales of new vehicles were particularly adversely affected as a result of industry contractions, restricted consumer access to finance and a slowdown in the fleet market. The value of used vehicles improved in the second half of the financial year, on the back of price escalations in new vehicles. However, sales were still compromised by the lack of finance available to consumers. After-sales services continued to increase, mainly as a result of service volumes but also attributable in part to sales volumes.
Despite the declining market, the division managed to return a satisfactory 2,8% margin on sales. A streamlined management structure, strict management of the cost base and working capital, and a commitment to a strong recognised brand portfolio proved successful in protecting the division to some degree from the declining market, with no branch closures necessary during the year.
The new financial year is expected to continue the trend of 2008/09 with a recovery only expected in late 2010. Availability of credit will continue to constrain the industry while improved used vehicle trading will provide some relief. Growth from after sales is expected to continue, albeit at a slower pace.
The Hertz rent-a-car operations reported a credible performance in a declining market.
Unitrans aUtomotive dealerships and Brands
opeRAtionAl RepoRt • Steinhoff AnnuAl RepoRt 2009 • 57

The group services teams in the different regions support operational management through a variety of services under the leadership of the international group services team based in Johannesburg. These teams ensure that the corporate services segment is completely and professionally serviced and that activities comprising brand management, participation interests, treasury and other functions are aligned and conducted in the best interests of the group.
corporatE and group sErvicEs
58 • Steinhoff AnnuAl RepoRt 2009 • opeRAtionAl RepoRt

A key priority of the group services team is to ensure that risks are properly identified and managed appropriately through the various activities provided to group companies which include:
bRanD manaGementBrand management revenue is earned from customers and group entities that are levied royalties for the use and development of the group’s brands, trade names and trademarks. A central brand management team oversees all brand management activities.
investment paRtiCipationIn implementing our strategic direction, the group invests in strategic retail and supply partners either through equity investments and/or through loans on an arm’s length basis. These loans are often structured in a way that the group will participate in profits earned by the relevant partners.
tReasuRy anD otheR aCtivitiesFinancial managementOur financial management department implements and oversees controls and procedures which prescribes the preparation of financial reports and taxation assessments. It also ensures that adequate risk control measures are in place. This includes appropriate insurance cover for directors’ liability, product liability, general liability, motor liability, business interruption, credit default debts, and the group’s assets.
Human resources (HR)HR are generally managed through regional divisions that report to the group HR director.
We currently have succession-planning procedures in place for management and senior employees. These contingency plans include, when required, outside recruitment, selection and assessment procedures and proper training for successor employees. In accordance with South African legislation, HR also implements and oversees training programmes to ensure that historically disadvantaged employees receive specific training and development.
Information technology (IT)IT decisions and day-to-day IT management within the group are managed at regional level and overseen centrally by group services IT management.
Although implementation, roll out, and subsequent maintenance and support are conducted at regional level, group services IT management conducts regular on-site visits to evaluate system performance and development plans.
Given the disparate operational requirements and variety of infrastructure between the different regions and industries where we operate, we have decided not to implement a single platform or application solution. We have, however, implemented a worldwide standard to which all our divisions must comply, with certain guidelines, when implementing any form of new technology.
Internal control and auditThe internal control and audit department is mainly responsible for independent financial, internal control and operational system reviews and audits. This department also evaluates and assesses risk management processes and internal control frameworks.
This includes financial and non-financial controls over all processes in the group, contributing to the achievement of organisational objectives. We currently have 34 full-time internal auditors in our employ.
opeRAtionAl RepoRt • Steinhoff AnnuAl RepoRt 2009 • 59

LegalWe currently have 14 qualified legal professionals. They are all actively involved in internal issues, such as drafting agreements, and oversight of the group’s statutory and legal reporting requirements. Country-specific matters are outsourced to accredited practitioners.
Property servicesThe property team advises and assists group companies with new property developments, redevelopments, property acquisitions and sales; property and maintenance management as well as assisting with lease negotiations.
Strategic developmentOur strategic development is driven by management at regional divisional level, who develop proposals for possible joint-ventures, mergers and acquisitions, special projects and potential growth areas and expansion of current divisions. These initiatives are supported by different members with specific skills expertise.
TaxationWe have an in-house taxation department to ensure worldwide competence and compliance.
Technical supportGroup services provides technical support in connection with factory layouts, plant and equipment procurement as well as advice on production processes to enhance efficiencies.
Treasury servicesOur treasury services department organises adequate funding to enable us to explore or realise strategic opportunities and developments. Based on feasibility reports and decisions on a particular opportunity, we decide whether and what type of funding to procure, manage and maintain.
CoRpoRate ResponsibilityCorporate responsibility is managed centrally by a steering group which provides strategic direction with input from the Northern and Southern Hemisphere management teams. Accountability and responsibility for the implementation of all sustainability initiatives remain with the divisional management teams. Policies address social, environmental and economic impacts in line with generally accepted practices like the JSE Sustainable Reporting Index requirements.
60 • Steinhoff AnnuAl RepoRt 2009 • opeRAtionAl RepoRt

Corporate and groUp serviCes management team
Nadine Bird
Age: 29CA(SA)
Hein Odendaal
Age: 52CA(SA)
Philip Robinson
Age: 34CA(SA)
Iwan Schelbert
Age: 47BAcc
Dirk Schreiber
Age: 38Diplom-Kaufman
director: corporate affairs and Mergers and acquisitionsPiet Ferreira
Age: 54BCompt (Hons), CA(SA)
director: treasury and finance activitiesStéhan Grobler
Age: 50BComm (Hons), LLB
Dieter Helmrich
Age: 49BSc Eng (Civil)
Mariza Nel
Age: 36ACMA (UK)
Helmut Apel
Age: 45SAIFM
Jan Radnay
Age: 65HDip Company Law
Yvette Boshoff
Age: 35CA(SA)
Michael Egan
Age: 31CA(SA), CFA, MSc (Finance), MComm
Lynette Tredoux
Age: 44BCompt (Hons), CTA
Michael Eggers
Age: 37Diplom-Kaufman
Johan Geldenhuys
Age: 53MBA (HR)
Chris Grove
Age: 52BComm, SEP
Marie-Aurelie Girard
Age: 41BA, LLB
Johann du Plessis
Age: 60BComm, LLB
Ray Cox
Age: 67Dip Mgmt
opeRAtionAl RepoRt • Steinhoff AnnuAl RepoRt 2009 • 61

We believe that a corporate culture of compliance with applicable laws, regulations, internal policies and procedures is a non-negotiable, fundamental component of good corporate governance. The culture of responsible corporate citizenship that has been established in each jurisdiction within which we operate, has played a key role in securing sustainable returns and serves to provide all stakeholders with the assurance that the group’s businesses are being managed appropriately.
The group’s corporate governance structures, systems and policies are constantly reviewed and, where required, are adapted or augmented to recognise internal and external developments and to remain at the forefront of best practice.
ComplianCe with the kinG RepoRt on CoRpoRate GoveRnanCe (“kinG ii”)The group endorses the principles of openness, integrity, sustainability, transparency, fairness, responsibility and accountability advocated by King ll and Steinhoff is fully compliant with the code.
corporate Governance
The Steinhoff group (the group) and its directors remain fully committed to ensuring that good corporate governance is a way of life. All of the group’s businesses share this commitment and the adoption of, and adherence to, sound corporate governance policies, has become a business imperative for the group. Our focus remains not just on what we do, but how we do it and on creating value for all our stakeholders in an ethical and sustainable manner.
62 • Steinhoff AnnuAl RepoRt 2009 • coRpoRAte GoveRnAnce

the boaRDBoard of directorsThe board currently consists of 15 (fifteen) directors, 6 (six) of whom serve as executive directors and 8 (eight) of whom serve as independent non-executive directors, together with 1 (one) non-executive director. The composition of the board complies with King II, which requires the majority of the directors to be independent non-executive directors, and the chairman to be an independent non-executive director. Mr Bruno Steinhoff stepped down as chairman at the end of September 2008 and Dr Len Konar, an independent non-executive director, was appointed chairman from that date.
No individual has unfettered powers of decision-making and there is a clear division of responsibilities at board level to ensure an appropriate balance of power and authority.
Terms of office of non-executive directors are subject to three-year rotation and age restriction provisions, while executive directors are appointed for terms of office not exceeding five years, subject to the company’s general conditions of service.
Chairman and the chief executiveResponsibility for running the board and executive responsibility for the conduct of the business are clearly defined. Accordingly, the roles of the chairman of the board and the chief executive are separate.
The chairman is responsible for leadership of the board and for ensuring that the board plays an effective role. He also ensures appropriate communication with shareholders and facilitates constructive relations between executive and non-executive directors. The chief executive’s principal role is to provide leadership to the executive team in running the group’s businesses.
Financial directorThe financial director of the company is Mr Frikkie Nel. The appropriateness of his expertise and experience has been confirmed by the audit committee.
Board composition/classification of directorsFull details of the current board are given on pages 78 to 82 of this annual report. Messrs Claas Daun, Dirk Ackerman, Jannie Mouton, Dave Brink, Ms yolanda Cuba and Drs Len Konar, Steve Booysen and Franklin Sonn are classified as independent non-executive directors in accordance with the classification guidelines detailed in King II. Mr Bruno Steinhoff is classified as a non-executive director.
Retirement of directorsThe articles of association provide that, at every annual general meeting, at least one-third of the non-executive directors shall retire from the board by rotation. If eligible, such directors may offer themselves for re-election.
At the annual general meeting to be held on 7 December 2009, shareholders will be asked to confirm the reappointment of Mr Dave Brink, Dr Franklin Sonn and Mr Bruno Steinhoff who will retire by rotation in accordance with the company’s articles of association but, being eligible, have offered themselves for re-election.
Appointment of directorsAppointments to the board are recommended by the nomination committee and are considered by the board as a whole, subject to shareholder approval.
At the annual general meeting to be held on 7 December 2009, resolutions will be proposed to ratify the appointments of Messrs Piet Ferreira and Stéhan Grobler (previously appointed as alternate directors) who were appointed as executive directors with effect from 1 May 2009, together with the appointment of Dr Steve Booysen who was appointed as an independent non-executive director with effect from 8 September 2009.
Resignation of directorsOn 1 May 2009, Mr Jan van der Merwe resigned as chief financial officer and executive director of the company and was appointed as chief executive officer of the PG Bison group. Mr van der Merwe remains a member of the Steinhoff International executive committee.
coRpoRAte GoveRnAnce • Steinhoff AnnuAl RepoRt 2009 • 63

In December 2009, Mr Dirk Ackerman will be retiring from the board and from the committees on which he serves.
Appointment requirementsThe non-executive directors, drawing on their respective skills, business acumen, expertise and experience bring impartial and objective viewpoints to the board’s decision-making processes and to the group’s standards of conduct. These non-executive directors are able to bring significant influence to bear to board and committee deliberations. Steinhoff’s directors have a wide range of business-related expertise, as well as significant experience in financial, commercial, retail, logistics and furniture industry activities. Directors are appointed on the basis of skill, acumen, experience and on their actual or potential level of contribution to and impact on the activities of the group.
Directors are required to dedicate sufficient time to be able to monitor, evaluate and comment effectively to the board and management on the financial and operational information supplied to the board.
Director development/inductionAll directors have access to management, including the company secretary, the legal department and the group’s compliance manager, and to information required to enable them to carry out their duties and responsibilities fully and effectively. Directors are apprised, wherever relevant, of any new legislation and changing commercial risks that may affect the group’s affairs and operations.
Directors are encouraged to stay abreast of the group’s businesses through independent site visits and meetings with senior management. Directors are provided with guidelines on their duties and responsibilities and a formal induction programme, with particular emphasis on internal controls, has been established to familiarise newly appointed directors with the group’s businesses, competitive stance, strategic plans and objectives and with its corporate governance requirements.
The induction programme includes meetings with other directors and senior executives to
enable new directors to receive information on and familiarise themselves with all aspects of
the group’s businesses. Opportunities to update and develop skills and knowledge, through
externally run seminars, regular circulation of relevant industry, regulatory and economic
news and analysis, as well as briefings by senior executives, are provided to all directors.
Board meetings
The board meets at least four times a year and more frequently, should circumstances
require. Directors declare their interests in contracts and other appointments at all
board meetings. Meetings are conducted according to a formal agenda, ensuring that all
substantive matters are properly addressed and followed up on.
The board charter: Responsibilities of the board
The general powers of the directors are set out in the company’s articles of association.
The board charter, which is modelled on principles recommended by King ll, details
the powers of the board, provides a clear division of responsibilities and sets out the
accountability of board members, collectively and individually, to ensure an appropriate
balance of power and authority.
The responsibilities of the board, as detailed in the charter, include:
• Settingthestrategyforthegroupandapprovingtheoperatingplanspresentedby
management for the achievement of the strategic objectives.
• EnsuringtheefficientdispositionofSteinhoff’sresourcesfortheachievementof
these objectives.
• Settinglevelsofauthorityanddeterminingprocedures,bothatcorporateandregional
level, for approving capital and investment expenditures.
• Consideringand,whereappropriate,approvingmajorcapitalexpenditureprogrammes
and significant acquisitions and disposals.
64 • Steinhoff AnnuAl RepoRt 2009 • coRpoRAte GoveRnAnce

• Reviewing,onaregularbasis,thestrategicdirectionofinvestmentdecisionsandperformance against approved plans, budgets and best-practice standards.
• Determiningpolicyandprocessestoensuretheintegrityofthegroup’sriskmanagement processes, internal controls, communication and reporting.
• Monitoringandevaluatingthecompany’sperformanceagainstapprovedbudgetsandprevailing economic conditions.
• Assumingultimateresponsibilityforregulatorycompliance.Notwithstandingthedelegation by the board of certain powers and authorities to executive management, the board is ultimately responsible for the retention of full and effective control over the group. Decisions on material matters are reserved by the board (including but not limited to capital expenditure, procurement, property transactions, borrowings and investments other than at preapproved materiality levels).
• Processing,selectingandappointingdirectorsontherecommendationofthenominationcommittee (as detailed below). The board also reviews and considers structured management succession planning for purposes of identifying, developing and advancing future leaders in the group.
Board evaluationsAn annual self-evaluation process to review the effectiveness of the board, the individual directors and the board committees has been established and is an invaluable tool in ensuring the ongoing efficacy of the board and in assessing the individual performance and contribution of the directors. The chairman is required to assess the performance of the individual board members and the board is required to assess the chairman. Assessments take into account several factors, including relevant expertise, enquiring attitude, objectivity and independence, judgement and an understanding of Steinhoff’s businesses and commitment. All related board and committee minutes and approvals are made available to the group’s external auditors.
A board effectiveness survey was conducted in November 2008 and changes were effected to areas needing attention.
Selection and succession planningThe nomination committee is responsible for leading the process for board appointments and for identifying and nominating candidates, for approval by the board and ultimately by the shareholders, for appointment to the board. In fulfilling this function, the committee evaluates the pool of skills, knowledge and experience on the board and identifies the role and capabilities required for a particular appointment. Care is taken that candidates would have sufficient time to devote to the interests of Steinhoff.
The committee makes recommendations to the board as appropriate concerning:
• plansforsuccessionforbothexecutiveandnon-executivedirectors;• theappointmentofanydirector;• theappointmentofanydirectortobecomeanexecutiveorotherofficer;• therenewalofthetermsofofficeofnon-executivedirectors;• inconsultationwiththechairmanoftheboardandtherelevantcommitteechairmen
candidates for membership of the board committees; and• anymattersrelatingtothecontinuationinofficeofanydirectoratanytime.
Board committeesSubject to specific fundamental, strategic and formal matters reserved for its decision, the board delegates certain responsibilities to a number of standing committees, which operate within defined terms of reference laid down by the board.
The board has appointed executive, audit, human resources and remuneration, nomination and group risk advisory committees to assist with its duties. Details of the subcommittees of the board are contained on the following pages 66 and 67 of this annual report.
All of the committees of the board operate within defined terms of reference and authority granted to them by the board and, with the exception of the executive committee, are comprised only of non-executive directors. The composition of these committees may change from time to time in accordance with new board appointments.
coRpoRAte GoveRnAnce • Steinhoff AnnuAl RepoRt 2009 • 65

COMMITTEE PURPOSE COMPOSITION MEETINGS ATTENDANCE
• Executivecommittee(dealco)
Markus Jooste (chairman)Johann du Plessis Piet FerreiraStéhan GroblerJo GrovéBen la GrangeFrikkie NelDanie van der Merwe Jan van der Merwe
Responsible for assisting and advising the chief executive (CE) in implementing the strategies and policies determined by the board, managing the business and affairs of the company, prioritising the allocation of capital, technical and human resources and establishing best management practices.
Monitors the performance of the company and assists the CE and financial officers in preparing the annual budget for review and approval by the board.
Responsible for reviewing and monitoring the company’s system of internal control.
Comprises nine executives, under the chairmanship of the CE.
Meets regularly, approximately every three weeks and formally each month, with senior executive management, designated staff members and divisional directors.
The members of the executive committee attended all 11 meetings of the committee held between July 2008 and June 2009. The chairman, Len Konar, and Bruno Steinhoff, as well as various members of the executive team, regularly attend these meetings as invitees.
• Auditcommittee
Dave Brink* (chairman)Dirk Ackerman** Len Konar ***Steve Booysen#
Responsible for the integrity of financial reporting and the audit process. In fulfilling this role, the committee reviews accounting principles, policies and practices adopted in the preparation of financial information in South Africa, the United Kingdom, Europe and Australia.Responsible for ensuring that risk management and internal control systems are maintained.Considers significant risk and control issues arising from the chief financial officers’ reports on financial and accounting frameworks.Oversees relations with external auditors and reviews the effectiveness of the internal audit function and co-operation between the parties.Approves external auditor’s appointment, terms of engagement, fees, scope of work, process of annual audit, applicable levels of materiality.Reviews the independence of external auditors and the services they provide, and establishes principles to ensure that their independence is not impaired by non-audit services provided.Responsible for overall compliance with corporate governance principles regarding external audit functions.Monitors the internal control and audit function. These functions report to and have unrestricted access to the audit committee.Considers, on an annual basis, the appropriateness of the expertise and experience of the financial director.The committee’s charter was revised during the year and a new charter was adopted in June 2009. The committee, which was previously titled the audit and risk management committee, is now called the audit committee.
Comprises four members, all of whom are independent non-executive directors, under the chairmanship of the independent, non-executive director, Dave Brink.
(Following the resignation of Dirk Ackerman in December 2009, the committee will comprise three members.)
Meets formally at least four times per annum, with external auditors attending the meetings.
There was full attendance by serving committee members during the year.
Four committee meetings were held.
* Appointed as chairman with effect from September 2008
** To retire in December 2009 *** Stepped down as chairman
in September 2008# Appointed with effect from
September 2009
66 • Steinhoff AnnuAl RepoRt 2009 • coRpoRAte GoveRnAnce

COMMITTEE PURPOSE COMPOSITION MEETINGS ATTENDANCE
• Humanresourcesandremuneration committee
Dirk Ackerman (chairman)*Len Konar**Franklin Sonn Dave Brink***
Responsible for reviewing and approving the remuneration and employment terms and conditions of executive directors and senior group executives in all divisions of the group.
Considers senior appointments to the group.
Responsible for the group’s remuneration philosophy, policies, annual incentive bonus schemes and allocation of share rights.
Determines the rewards of the chairman, CE, executive and non-executive directors and senior executives for individual contributions to the company’s overall performance. Reviews executive succession and development plans.
Reviews remuneration strategies, packages and schemes and monitors these so that they remain related to performance objectives, suitably competitive and give due regard to shareholders’ interests.
Ensures maintenance of appropriate human resource strategies, policies and practices.
Comprises four independent, non-executive directors under the chairmanship of the independent, non-executive director, Dirk Ackerman.
(Following the resignation of Dirk Ackerman in December 2009, the committee will comprise three members.)
Divisional remuneration committees have been established to deal with management remuneration at all divisions. These committees are comprised of the group CE, the divisional managing director and the group’s human resource executive. These divisional committees report directly to the human resources and remuneration committee.
Meets at least twice a year with ad hoc meetings as and when required.
There was full attendance by serving committee members during the year.
Two committee meetings were held.
* To retire with effect from December 2009
** To be appointed as chairman with effect from December 2009
*** Appointed with effect from September 2009
• Nominationcommittee
Len Konar (chairman) Franklin Sonn
Makes recommendations to the board on the appointment of executive and non-executive directors and the composition of the board.
Comprises two independent non-executive directors, under the chairmanship of Len Konar.
Meets at least once a year.
Both committee members attended the two meetings held during the year.
• GroupriskadvisorycommitteeLen Konar (Chairman)Dirk Ackerman*Dave Brink yolanda CubaJannie MoutonFranklin Sonn Angela Krüger-Steinhoff•
Steve Booysen#
Assists the board in reviewing risk management processes and significant risks facing the group.Sets the group’s risk strategy in consultation with executive directors and senior management, making use of generally recognised risk management and internal control frameworks.Monitors and reports on key performance indicators and risks.
Comprises seven independent non-executive directors and one non-executive alternate director under the chairmanship of Len Konar.
(Following the resignation of Dirk Ackerman in December 2009, the committee will comprise seven members.)
Meets at least once a year.
There was full attendance by serving committee members during the year.
* To retire in December 2009# Appointed in September 2009;
to chair the committee from December 2009
• Appointed in September 2008
coRpoRAte GoveRnAnce • Steinhoff AnnuAl RepoRt 2009 • 67

aCCountabilityThe chief executive (CE) is responsible and accountable to the board for all group operations. As the group operates on a decentralised basis, the CE has appointed regional/divisional managing directors (MDs) and/or CEs of the main operating divisions to assist in discharging this responsibility. The duties and responsibilities of the MDs are detailed in formal role descriptions, together with prescribed limits of authority. These duties and responsibilities are approved and reviewed annually by the CE.
The company’s policy of decentralisation and its flat organisational structure means that each region/division is managed autonomously. Principally, the group is managed within an organisational structure that distinguishes between the Northern Hemisphere and the Southern Hemisphere and, within these regions, each underlying region or division has its own operational, marketing, environmental, health and safety and social responsibility budget. Each division is responsible for its own results and responds individually to customer needs, pricing policies and environmental and social responsibility requirements. As the group operates in diverse industries and in differing global regions, environmental policies are set at divisional level, together with policies on health and safety and employee matters, but subject to overall guidelines set by the group.
Notwithstanding the delegation by the board of certain powers and authorities to executive management, the ultimate responsibility for retaining full and effective control over the group rests with the board. Decisions on material matters are reserved by the board, including, but not limited to, decisions on the allocation of capital resources to optimise the return on shareholders’ funds and the authorisation of procurement, capital expenditure, property transactions, borrowings and investments, other than where preapproved materiality levels apply.
Company seCRetaRyAll directors have access to the advice and services of the company secretary, supported by the legal department and the group secretariat. The company secretary is responsible for the duties set out in section 268G of the Companies Act (the Act) and for ensuring compliance with the listings requirements of the JSE Limited.
The certificate required to be signed in terms of subsection (d) of the Act appears on page 89.
RemuneRationThe human resources and remuneration committeeThe group human resources and remuneration committee (the remuneration committee) is responsible for setting the remuneration strategy of the group, approving mandates for incentive schemes within the group and for determining the remuneration of executive and senior management positions, relative to local and international industry benchmarks. It also makes recommendations to the board on the remuneration of non-executive directors.
Full details of the group’s remuneration strategy are included in the corporate responsibility report which accompanies this annual report.
Remuneration philosophyThe remuneration philosophy of Steinhoff is to attract, retain and motivate employees while considering applicable market levels of remuneration. The company’s primary executive remuneration objective is to appropriately reward executive directors to ensure that their interests, as far as possible, are aligned with the interests of shareholders and to attract and retain high calibre individuals who will successfully guide the company.
Annual incentive bonus arrangements have been structured so that “stretch targets” are based on corporate, business unit and individual performance.
68 • Steinhoff AnnuAl RepoRt 2009 • coRpoRAte GoveRnAnce

In setting remuneration levels, the remuneration committee commissions an independent evaluation of the roles and responsibility of the executive teams, and also that of the next levels of management in the group. The remuneration committee takes independent advice from consultants on market-level remuneration, based on like-for-like comparisons with other companies operating in fields within which the group competes for executive talent.
The remuneration committee recognises the importance of linking rewards to business and personal performance and believes that the arrangements implemented provide an appropriate focus on performance and a balance between short-term and long-term incentives. The annual bonus plan and long-term incentive arrangements provide a significant portion of the total reward for achieving business and personal performance objectives.
The remuneration committee constantly monitors market practice in order to remain competitive and to ensure that reward policies embrace all aspects of remuneration, support company strategy, and reflect good corporate governance practices. The committee has implemented changes to Steinhoff’s incentive strategy to help deliver enhanced shareholder returns. Currently, no substantial changes to the company’s policies on directors’ remuneration are envisaged. However, the remuneration committee may from time to time develop policy and, should it determine any changes to be appropriate, the company will report these changes to shareholders through established channels of consultation and reporting.
Remuneration of employees in generalThe following principles are used to determine appropriate remuneration levels:
• Employeeslinkedtocompulsoryandbindingbargainingandotherregulatorystructures and forums are paid accordingly. Team performance-related incentive systems at this level are optional to ensure achievement of targets.
• Supervisoryandmiddlemanagementremunerationislinkedtocompetencylevelsandmarket relativities.
• Underperformanceisnotincentivised.Shouldanyemployeeunderperform,activestepsare taken to improve performance.
• Ateamperformance-relatedincentivesystemiscompulsoryforallbusinessunitmanagement teams.
• Stronglong-termincentives,linkedtoperformancecriteria,arecreatedtoensurethatemployees who perform well are retained.
• Thecollectiveincentivespromoteandrewardentrepreneurialskills,accordingtoperformance.
Directors’ remunerationThe board applies the principles of good corporate governance relating to directors’ remuneration. Governance of directors’ remuneration in Steinhoff is undertaken by the remuneration committee.
The remuneration committee has resolved that the directors’ fees, including fees payable to non-executive directors, are to be submitted in advance for approval at each annual general meeting. In this regard, see the notice to shareholders which is separate to this annual report, detailing the matters to be considered at the forthcoming annual general meeting to be held on 7 December 2009.
The remuneration and fees paid to directors for the financial year ended 30 June 2009 are detailed on pages 196 to 199 of this annual report.
Executive directors’ remunerationRemuneration for executive directors consists of a basic salary, a performance-related incentive bonus, retirement contributions, medical scheme membership and long-term share incentive schemes. It also includes fees earned for services on the board of Steinhoff. All benefits are calculated in terms of the remuneration principles outlined in this report.
In line with the group’s remuneration philosophy, remuneration is reviewed annually by the remuneration committee after evaluating each executive director’s performance, including that of the CE. In addition, the remuneration packages are benchmarked individually, taking into account local, regional and global responsibilities. Details of the remuneration of the executive directors and information on share rights are set out on pages 196 to 204 of the financial statements.
coRpoRAte GoveRnAnce • Steinhoff AnnuAl RepoRt 2009 • 69

Non-executive directors’ remunerationFees for non-executive directors are recommended to the board by the remuneration committee, for approval by shareholders. The fees are reviewed annually with the assistance of external service providers. The remuneration committee takes cognisance of market norms and practices as well as the increasing responsibilities placed on board members by new legislation, regulations and corporate governance guidelines. The independent non-executive directors do not have service contracts and are not members of the group’s retirement funding schemes. At the annual general meeting to be held on 7 December 2009, on the recommendation of the human resources and remuneration committees, resolutions will be proposed to maintain the fees earned by non-executive directors at the same level as that previously approved.
With effect from 2007, awards of shares or options under the group’s share incentive schemes to non-executive directors were discontinued. All outstanding rights granted to non-executive directors were exercised during the 2008 financial year.
Non-executive directors receive an annual fee for their participation. The fee consists of a base fee and retainer and, where applicable, committee membership fees including fees for specific committees. Steinhoff pays for all reasonable travelling and accommodation expenses to attend board and committee meetings. The fees payable to the non-executive directors for the 2009/2010 year, including the fee payable to the chairman, will be submitted to shareholders for approval at the annual general meeting to be held on 7 December 2009.
Details of the emoluments paid to non-executive directors are shown on page 198 of the financial statements.
Basic salary and benefitsSalaries for executives are reviewed annually in September. Salaries are adjusted based on market-related activities and the performance of the individual and the group.
Annual bonusThe remuneration committee uses an annual performance bonus as an incentive to executives to achieve predetermined financial targets, based on earnings’ growth and cash flow. The committee sets the financial targets annually and monitors performance against these targets.
Share incentive schemes:Steinhoff Share Incentive SchemesThe company operates share incentive schemes for senior executives. These schemes were approved by shareholders at the annual general meetings held on 6 December 1999 and 1 December 2003 respectively.
The remuneration committee grants rights which reflect a multiple of the executive directors’ remuneration. Broad-based rights are granted subject to time limits and clearly measurable performance criteria. These criteria have been set as Steinhoff achieving a compound growth in headline earnings per share over the relevant three-year period equal to or exceeding the weighted average growth of the companies included in the JSE Indi 25 index and that the volume-weighted average traded share price of Steinhoff shares equals or exceeds a formula-driven share price based on the JSE Indi 25 index and the Steinhoff share price.
The remuneration committee resolved to reduce the number of rights granted from 2006 onwards and to simplify the scheme by making annual allocations, subject to similar time limits and the same performance criteria as were applicable to the rights granted in December 2003.
The 2006 allocation was made subject to the three completed financial years commencing on 1 July 2006. The committee authorised the granting of 7 873 392 rights (of which 4 978 666 were granted). The rights were granted to both South African resident and non-resident participants and included 190 identified participants. It is anticipated that the 2006 allocation will not have met the prescribed criteria and will therefore lapse.
70 • Steinhoff AnnuAl RepoRt 2009 • coRpoRAte GoveRnAnce

In 2007, a total of 9 506 874 rights were authorised to be granted to 228 participants for the three completed financial years commencing on 1 July 2007 and, in 2008, altogether 15 525 00 rights were authorised to be granted to participants for the three completed financial years commencing on 1 July 2008.
Recently, the committee considered the long-term share incentive award for the 2009 financial year and the applicable performance criteria. The committee authorised the granting of further rights, to both resident and non-resident participants.
Unitrans Share Incentive SchemesFollowing the acquisition by the group on 8 May 2007 of the businesses of Unitrans Limited (Unitrans), the rights of participants to receive shares in Unitrans in terms of the Unitrans Limited Share Scheme and rights over shares in terms of the Unitrans Executive Share Rights Scheme, were amended. Participants in these schemes would now receive shares or rights, as appropriate, over shares in Steinhoff. The terms and conditions of these schemes, including vesting periods and performance hurdles, remained unchanged save that the beneficiaries became entitled to shares or rights over shares in Steinhoff, as opposed to shares or rights over shares in Unitrans. No further allocations have been made under the Unitrans Limited Share Scheme. The Unitrans Executive Share Rights Scheme, which was introduced from December 2005 and under which rights vest after three years subject to the meeting of the specified performance hurdles applicable to the Steinhoff Executive Share Rights Scheme, has now been integrated into the Steinhoff Executive Share Rights Scheme.
As at 30 June 2009, the following options/rights over shares in Steinhoff were outstanding in respect of the Unitrans’ share schemes:
Unitrans Limited Share Scheme: 2 876 950
Unitrans Executive Share Rights Scheme: 1 313 812
Going forward, the remuneration committee will continue to implement long-term incentive schemes by making further annual grants against clearly measurable performance.
manaGement RepoRtinGManagement reporting disciplines include the preparation of annual budgets by the operating entities. These budgets are reviewed by the board and are subject to final board approval. Monthly results and the financial status of operating entities are reported against the approved budgets. Profit projections and cash flow forecasts are reviewed regularly, while working capital and borrowing levels are monitored continually. Divisional management is additionally charged with the duty of reporting on social, ethical and environmental concerns. This is more fully reported on in the corporate responsibility report issued together with this annual report.
finanCial ContRol anD RepoRtinGThe directors are responsible for ensuring that the group companies maintain adequate records, and for reasonable, accurate and reliable reporting on the financial position of the group and the results of its activities. Financial reporting procedures are applied in the group at all levels to meet this responsibility. Group services’ executives meet regularly and formally with operating management and are effectively involved in the major decision-making processes of all group companies. Financial and other information is constantly reviewed and any action necessary is taken immediately. The financial statements are prepared in accordance with International Financial Reporting Standards.
coRpoRAte GoveRnAnce • Steinhoff AnnuAl RepoRt 2009 • 71

inteRnal ContRol anD Risk manaGementThe group operates a robust internal control structure. The executive team is responsible for implementing the risk management strategy to ensure that an appropriate risk management framework is operating effectively across the group, embedding a risk culture throughout the group.
The board and the audit committee are provided with a consolidated view of the risk profile of the group and any major exposures and relevant mitigating actions are identified. This strategy supports the board in discharging its responsibility for ensuring that the wide range of risks associated with the group’s diverse operations is effectively managed, to create and preserve shareholder wealth.
The board’s policy on risk management encompasses all significant business risks to the group, including financial, operational, environmental, market compliance and general risk, which could undermine the achievement of the group’s business objectives. This system of risk management has been designed so that the different business units are able to tailor and adapt their risk management processes to suit their specific circumstances. Risk assessment and reporting criteria have been structured to provide the board with a consistent, company-wide perspective of the key risks. The system of internal control, which is embedded in all key operations, provides reasonable rather than absolute assurance that the company’s business objectives will be achieved within the risk tolerance levels defined by the board.
Regular management reporting, which provides a balanced assessment of key risks and controls, is an important component of board assurance. The chief financial officer(s) provide(s) quarterly confirmation to the board that the financial and accounting control frameworks established have operated satisfactorily and consistently. The board also receives assurance from the audit committee, which derives its information in part from regular internal control throughout the group and from the divisional audit committees.
inteRnal ContRol systemsThe internal control system that operated throughout the year covered the following areas:
• ControlenvironmentThe board has put in place a documented organisational structure with clearly defined and communicated lines of responsibility and delegation of authority to operating units. Policies and procedures, including the code of ethics referred to on page 76 and the divisional policies on environmental and social issues, have been put in place to foster a strong ethical environment.
• MaincontrolproceduresThe board has adopted a schedule of matters which it requires to be brought to it for consideration, ensuring that it maintains full and effective control over appropriate strategic, financial, organisational and compliance issues. The board has identified a number of key areas that require regular reporting to the board, including treasury, legal and other matters. Financial controls and procedures are in place, including procedures for seeking and obtaining approval for capital expenditure, major transactions and organisational changes, as well as organisational controls involving the segregation of incompatible duties and controls relating to the safeguarding of assets.
• IdentificationandevaluationofbusinessrisksandcontrolobjectivesThe company’s strategy on risk is to assume prudent risk, which is appropriately managed and mitigated, in exchange for measurable rewards. The board has the primary responsibility for identifying the major business risks facing the group and for developing appropriate policies to manage those risks. The risk management approach is used to focus the attention of directors and management on the group’s most significant areas of risk and to determine key control objectives. This process is supported by group risk advisory services.
72 • Steinhoff AnnuAl RepoRt 2009 • coRpoRAte GoveRnAnce

• MonitoringThe board has delegated implementation of the system of risk management and internal financial control to executive management. The operation of the system is monitored and a programme of reviews, focusing on key aspects of the business, has been carried out.
The board conducts an annual review of the operation and effectiveness of this system of internal financial control. Following this review and after making reasonable enquiries, the board believes there have been no weaknesses in the system that have failed to bring to the board’s attention any material losses or contingencies during the review period, or the period from the balance sheet date to the date of this annual report, except if noted elsewhere in this annual report.
The directors accept responsibility for maintaining appropriate internal control systems to ensure that the group’s assets are safeguarded and managed, and that losses arising from fraud or other illegal acts are minimised. Control systems are continually monitored and improved in accordance with generally accepted best practice.
• InformationsystemsThe group operates a comprehensive annual planning and budgeting system and annual budgets are reviewed and approved by the board. The financial reporting system compares results with monthly budgets to identify any significant deviation from approved plans. Reports include a monthly cash flow analysis, projected for 12 months, which is used in determining whether the group has adequate funding for its future needs.
inteRnal auDitThe company’s internal audit function has a formal collaboration process in place with the external auditors to ensure efficient coverage of internal controls and to eliminate any duplication of effort.
The internal audit department is a function established at corporate level, reporting directly to the audit committee and the divisional audit committees. It assists executive management and the respective audit committees in the effective discharge of their responsibilities by means of independent financial internal control and operational systems reviews.
The internal audit function operates in terms of an internal audit charter approved by the audit committee.
Internal audit evaluates and assesses the adequacy of risk management processes and internal control frameworks and reports any significant issues, making recommendations to improve these processes. The internal audit function reviews the effectiveness of financial and non-financial controls over all processes that contribute to the achievement of organisational objectives. It also provides information on the status and results of the annual audit plan.
Any weaknesses or breakdown in controls identified by internal audit are discussed with the relevant management team and are reported to the divisional audit committees and, if material, to the Steinhoff audit committee. A programme of follow-up audits on any unsatisfactory ratings is rigorously applied to ensure appropriate and timeous remedial action. The results of follow-up audits are tabled at the relevant divisional audit committee meetings.
The internal audit function has mainly been internalised and dedicated group personnel have been charged with the responsibility of undertaking internal audits independently from operational management. However, in certain parts of the group, the internal audit function has been outsourced to independent professional service providers.
During the review period the internal audit process did not highlight any material breakdowns in internal control.
coRpoRAte GoveRnAnce • Steinhoff AnnuAl RepoRt 2009 • 73

STEINHOFF INTERNATIONAL HOLDINGS LIMITED(holding company board)
Ultimately responsible for group risk management
STEINHOFF GROUP RISK ADVISORy COMMITTEE
Annual international non-executive report on key risks
STEINHOFF INTERNATIONAL GROUP RISK ADVISORy
COMMITTEE (NON-ExECUTIVE)
Evaluates group risk strategy•Monitors and reports on KPIs in respect of risks•Independent identification of major risks facing group•
STEINHOFF AFRICA/ PACIFIC RIM
Quarterly regional executive report on key risks
STEINHOFF PACIFIC RIM(subsidiary company board)
steinhoff pacific rim
Quarterly regional executive •report on key risksMonthly executive meetings: evaluates •and monitors risks at a micro-levelAudit committees are in place•
STEINHOFF AFRICA(subsidiary company board)
steinhoff africa divisional boards (unitrans, pg bison, raw Materials, steinbuild)
Quarterly regional executive report on •key risksMonthly executive meetings: evaluates •and monitors risks at a micro-levelAudit committees are in place for all •divisional boards
STEINHOFF EUROPE(subsidiary company board)
steinhoff europe divisional boards (german, eastern european, benelux)
Quarterly regional executive report on •key risksMonthly executive meetings: evaluates •and monitors risks at a micro-levelAudit committees are in place•
steinhoff uk holdings
Audit committee•Quarterly regional executive reports •on key risks and their management are given
STEINHOFF EUROPE
Quarterly regional executive report on key risks
AUDIT COMMITTEE
Quarterly internal audit report on group management of risk
Evaluates and reviews group risk•Evaluates and reviews internal controls and audit •processes continually and reports quarterly at group level, receives reports and reviews quarterlyEvaluates and reviews group risk management process•Evaluates and reviews reports of the external auditor•Monitors implementation of the recommendations of •the external auditor
74 • Steinhoff AnnuAl RepoRt 2009 • coRpoRAte GoveRnAnce

Risk manaGementThe board of Steinhoff recognises the critical importance of risk management and takes ultimate responsibility for this function. The company complies with the risk management requirements and principles of King II, and an enterprise-wide integrated risk management approach has been adopted in line with international best practice. The board is supported by executive and non-executive committees in the identification and management of risks, in accordance with the process highlighted above.
The internal audit department regularly reviews the implementation and management of the risk profile through the internal audit process.
The group manages its risks with a varying degree of central guidance. The major classifications of the risks facing the group have been identified as follows.
• Financialrisks:refertothefinancereportonpages33and34fordetailsofthefinancialrisks.
• Operationalrisksandmarket-relatedandgeneralrisks(includingenvironmentalrisks):refer to the separate corporate responsibility report accompanying this annual report for details of the risk management approach adopted to mitigate and/or manage these risks.
The group risk management structure outlined on page 74 reflects the risk reporting and management structures in place throughout the group.
exteRnal auDitThe external auditors report on their audit findings to the various divisional audit committees and to the audit committee of Steinhoff. The external auditors have unrestricted access to the chairman of the Steinhoff audit committee should they wish to discuss any findings.
The audit committee considered the position of Deloitte & Touche and resolved that Deloitte & Touche is independent of the group and has recommended the reappointment of Deloitte & Touche as auditors. This view and recommendation was endorsed by the board of directors on 8 September 2009. The reappointment of the auditors will be a matter for consideration by the shareholders at the annual general meeting to be held on 7 December 2009.
The external auditors have confirmed to the audit committee that they are not aware of any relationships between the group and themselves that were in place or occurred during the year under review that, in their professional opinion, could reasonably be held or perceived to impact on their independence.
The group has adopted a policy to regulate the use of the external auditors for non-audit services, including consulting services. The policy details the non-audit services which may not be performed by the external auditors and prescribes preapproval requirements for non-audit services that, subject to the requisite preapprovals being obtained, may be undertaken by the external auditors. The principles for this policy have been determined by the audit committee.
stakeholDeR CommuniCation anD investoR RelationsThe board believes that balanced and understandable communication of the group’s activities to stakeholders is essential and it strives to clearly present any matters material to a proper appreciation of the group’s position. The interests and concerns of stakeholders are addressed wherever possible by communicating information as it becomes known, regardless of any potentially positive or negative impact. The company encourages the active participation of shareholders at general meetings and arranges for corporate and divisional executives to attend regular meetings with shareholders and potential investors. The annual general meeting is normally attended by all the directors and shareholders are encouraged to be present and to ask questions. Shareholders are afforded the opportunity to meet with the directors after the formal proceedings have ended.
coRpoRAte GoveRnAnce • Steinhoff AnnuAl RepoRt 2009 • 75

The group values its relationships with both institutional and private investors and adopts a proactive approach to ensure that communications are handled appropriately. There is regular two-way communication with investors and analysts, including presentations after the interim and year-end results and site visits. The results for the year under review were presented on 8 September 2009 and, simultaneously, to invited global institutional shareholders via electronic medium.
The board ensures that all directors, including non-executive directors, develop an understanding of the views of major shareholders through attendance at analyst presentations and other meetings with institutional investors and their representative bodies. Directors met with representatives of institutional shareholders in 2009 to discuss corporate governance matters.
The group adopts a proactive stance in disseminating appropriate operational information to stakeholders through print and electronic news releases in addition to the statutory publication of the group’s financial performance and announcements required in terms of the listings requirements of the JSE Limited.
The website, www.steinhoffinternational.com enables all shareholders to access results presentations and detailed information on the group and its portfolios. Ms Mariza Nel is responsible for stakeholder and investor communication and relations for Steinhoff (email: [email protected] ). Further information on stakeholder communication is contained in the corporate responsibility report which accompanies this annual report.
ethiCsWe require our employees, in the performance of their duties, to act in good faith in a manner promoting our aspiration to be a good corporate citizen and we have adopted a code of ethics committing the group, its directors and employees to the highest standards of conduct.
This code has been endorsed by the directors and a formal ethics programme has been rolled out throughout the group under the guidance of the company secretary and group compliance manager, who ensure that the code is reviewed annually.
The code addresses inter alia:
• Conflictsofinterest.Thecodeincorporatesspecificpolicyandguidelinesonthedisclosure of any conflicts of interest and on making sensitive payments.
• Theacceptanceofgifts.Withtheexceptionofsmall,tokengiftswhichmustberecordedin a register, no employee may accept any gift, payment, incentive, favour or any other business courtesy that may influence his or her actions, or Steinhoff’s actions, with regards to a third party. The code includes a list of prohibited transactions.
• Bribesandpoliticalcontributions.Adherencetoanti-corruptionlawsandregulationsisnon-negotiable.
• Recordkeeping.Thebooksandrecordsofthecompanymustreflectallbusinesstransactions in an accurate and timely manner.
• Promotionofcompetition.Steinhoffbelievesintheprinciplesoffreecompetitiveenterprise and the code incorporates the group’s anti-competition/anti-trust policy and guidelines, detailing specific prohibitions.
• Non-discrimination.Steinhoffexpectsallemployeestotreatfellowemployeeswithrespect and consideration.
• Thegroup’scommitmenttoshareholdersandstakeholders,aswellaspoliciesandguidelines on the personal conduct of management officials and other employees.
Compliance with the code is monitored by divisional management and any infringements are dealt with appropriately at that level. Serious contraventions of the code are reported at board level. No serious breaches of the code were reported during the period under review.
76 • Steinhoff AnnuAl RepoRt 2009 • coRpoRAte GoveRnAnce

fRauD anD illeGal aCtsThe group does not engage in or accept or condone the engaging in of any illegal acts in the conduct of its business. The directors’ policy is to actively pursue and encourage prosecution of perpetrators of fraudulent or other illegal activities should they become aware of any such acts and a zero tolerance approach has been adopted. The group has implemented a confidential fraud line, which is managed and administered by KPMG, to facilitate the reporting of any fraud or illegal acts. Further information is contained on page 51 of the corporate responsibility report which accompanies this annual report.
All reports are followed up on and are the subject of separate investigations. There were no frauds or misdemeanours of any significance which were reported via the confidential fraud line during the year ended 30 June 2009.
insiDeR tRaDinGThe group has an insider trading policy, which prohibits directors and named officers of the company and its material subsidiaries from dealing in the company’s shares, either directly or indirectly, on the basis of unpublished price sensitive information about the business or affairs of the group and its subsidiaries. Employees are advised not to deal, directly or indirectly, in the company’s shares or warrants or shares of listed subsidiaries of the group on the basis of unpublished price-sensitive information. No director or officer who is privy to such information may trade in the company’s shares or warrants during embargo periods determined by the board, or during closed periods, and all dealings by directors and officers in the company’s shares, or shares of any listed subsidiaries of the group, must receive the prior approval of the CE to ensure compliance with this policy. Dealings in such shares by the CE must receive the prior approval of the compliance officer and dealings in such shares by the chairman must in turn receive the prior approval of the CE and the compliance officer. Closed periods are the periods between the end of the interim and annual reporting periods and the announcement of financial and operating results for these reporting periods, together with any periods during which the company may be trading under a cautionary announcement.
A report of all dealings by directors and officers in the shares of the company is tabled at each board meeting of the company. All share dealings by directors of the company and its major subsidiaries, including share dealings by the company secretary, are notified to the JSE Limited for publication via the Stock Exchange News Services (SENS).
inteRest in ContRaCtsThe group has a policy regulating disclosure of interest in contracts. The policy dictates that all employees must disclose any interest in contracts to assess any possible conflict of interest. The policy also covers directors and senior officers of the group who must disclose any interest in contracts, as well as other appointments, to assess any conflict of interest in fiduciary duties. During the year under review, save as may be disclosed in the financial statements, none of the directors had a significant interest in any material contract or arrangement entered into by the company or its subsidiaries.
GoinG ConCeRn statementThe directors report that, after making enquiries, they have a reasonable expectation that the group has adequate resources to continue in operational existence for the foreseeable future. For this reason, they continue to adopt the going-concern basis in preparing the financial statements.
coRpoRAte GoveRnAnce • Steinhoff AnnuAl RepoRt 2009 • 77

daniËL Maree van der Merwe (51) BComm, LLB Danie was elected to the Steinhoff board in 1999 and is chief executive officer for Steinhoff Africa and Asia Pacific. He was admitted as an attorney of the High Court of South Africa in 1986 and practised as an attorney specialising in the commercial and labour law fields. In 1990, Danie joined the Roadway Transport Group and was instrumental in developing the strategic direction and growth of this group. In early 1998, following the merger of Roadway Transport Group with Steinhoff Africa, Danie joined the group. He currently serves on the boards of Unitrans Holdings (Proprietary) Limited, PG Bison Group, Steinhoff Asia Pacific Limited, KAP International Holdings Limited and holds several other appointments within the group, with specific responsibility for the company’s operations in Africa, Australia, New Zealand, China and India.
Markus Johannes Jooste (48) BAcc, CA(SA) Markus is an executive director and chief executive officer of the Steinhoff group. In 1988, Markus joined Gommagomma Holdings (Proprietary) Limited (now Steinhoff Africa Holdings (Proprietary) Limited) as financial director and became involved in merging the southern African furniture operation with the extensive interests of Bruno Steinhoff. In 1998, Markus was appointed as executive director and took responsibility for the European operations of the group and also for directing the group’s international marketing and financial disciplines. In 2000, Markus was appointed group managing director of Steinhoff International and chairman of Steinhoff Africa. Markus also serves on the boards of various non-listed group companies and the following listed companies: PSG Group Limited (member of the remuneration committee), KAP International Holdings Limited (member of the remuneration committee) and Phumelela Gaming and Leisure Limited (member of the remuneration committee).
ian MichaeL topping (49) MA, MBA As the chief executive officer of the UK division, Ian heads the group’s manufacturing, retail and logistics operations in the United Kingdom. He joined the group in 2001 following the acquisition of Relyon Group plc in the United Kingdom, a furniture manufacturing group of which he was chief executive from 1993 to 2001. Ian has an MA in Engineering Science and Economics from Oxford University and an MBA from Manchester Business School combined with a period of study at New York University Graduate School of Business. His early career was in the oil industry and management consultancy. Ian was appointed as executive director in December 2005.
fredrik Johannes neL (50) BCompt (Hons), CA(SA) Frikkie is an executive director and the financial director of Steinhoff. He was appointed as financial director of Steinhoff in 1998 and also acted as company secretary for the group. After serving as an accountant with a private company, he joined Gommagomma Holdings (Proprietary) Limited (now Steinhoff Africa Holdings (Proprietary) Limited) as financial manager in 1989, becoming financial director in 1990. He qualified as a chartered accountant in 1993.
BoarD of DIrectorsexecut ive
78 • Steinhoff AnnuAl RepoRt 2009 • BoARd of diRectoRS

Johannes nicoLaas stephanus du pLessis (60)* BComm, LLB Johann has been a non-executive director of Steinhoff since 2002 and was appointed an executive member of the group services team and alternate executive director with effect from 1 March 2006. He is a trial lawyer by profession and was a member of the Johannesburg and later the Cape Bar. He was admitted as counsel during 1974 and took silk in 1989. He has been exposed during the course of his career to a wide range of commercial matters. He has occasionally acted as judge in the High Court. He advises on and is engaged in matters related to governance, tax, property, competition and the environment; he also deals with litigation.
* Alternate director
stephanus Johannes grobLer (50) BComm (Econ Hons), LLB Stéhan is an executive director and company secretary. In December 1999, Stéhan was appointed company secretary of Steinhoff and joined the group in a more formal relationship on 1 July 2000. Stéhan was admitted as an attorney of the High Court of South Africa in 1989. He is also admitted as a notary public, conveyancer and to appear in the High Court of South Africa. Stéhan gained extensive experience practising in the business and corporate law fields advising various companies, listed and unlisted, on commercial and company law issues. Stéhan also acts as the compliance officer and as director for various group and other companies. Stéhan was appointed as alternate executive director in December 2005 and became an executive director of Steinhoff with effect from 1 May 2009. In addition Stéhan took over the responsibilities of group treasury and financing activities for the group.
kareL Johan grovÉ (60)* Jo is the chief executive officer of Unitrans and joined Steinhoff as a non-executive director in September 2000. He has more than 36 years’ experience in the accounting and banking industries.
His career began in 1969 when he was appointed cost and works accountant with Shaft Sinkers (Proprietary) Limited. In 1976 he founded Medical Leasing Services, a company providing specialised financial services, mainly to medical doctors. In 1987 the business was sold to the Absa group, the name was changed to MLS Bank, and Jo was appointed chief executive officer, a position he held until 1995. Later that year, he established Imperial Bank and served on the main board of Imperial Holdings until he joined Unitrans Limited as chief executive in September 1998.
Jo was appointed an executive director of Steinhoff, following the approval and implementation of the acquisition of the majority shareholding in Unitrans Limited. He also serves on the board of SA PGA Tour. Jo became an alternate executive director with effect from 10 December 2007.
hendrik Johan kareL ferreira (piet) (54) BCompt (Hons), CA(SA) Piet was appointed as an alternate executive director with effect from December 2005. He commenced his career in corporate finance in 1986 and worked in several merchant banks before joining Steinhoff on 1 January 2002. During his career with South African merchant banks, he was involved with various corporate finance transactions, including Steinhoff’s initial public offering on the JSE in 1998. Piet has extensive experience and expertise in the field of mergers and acquisitions (M & A), rights offers, company restructures and general corporate finance advice. His responsibilities with Steinhoff International Group Services include the provision of internal corporate advisory services relating, in particular, to M & A and other growth opportunities. Piet is also a serving member of the Issuer Services Advisory Committee of the JSE Limited. Piet became an executive director of Steinhoff and Steinhoff Investment Holdings Limited with effect from 1 May 2009. In addition he took on full responsibility for the Group’s Corporate Services, which department focuses on M & A and general advisory and secretarial services.
BoARd of diRectoRS • Steinhoff AnnuAl RepoRt 2009 • 79

deenadayaLen konar (55) BComm, MAS, DComm, CA(SA) Len was appointed as the independent non-executive chairman of the board with effect from 30 September 2008. Len is a professional director of companies. Prior positions include executive director of internal audit portfolio and head of investments at the Independent Development Trust, and professor and head of the department of accountancy at the University of Durban-Westville. He is a past Patron of the Institute of Internal Auditors South Africa, and a member of the King Committee on Corporate Governance in South Africa, the Securities Regulation Panel and the Institute of Directors. He was appointed Chairperson of the ministerial panel for the review of the regulation of accountants and auditors in South Africa in 2003. He is co-chairman of the Implementation Oversight Panel of the World Bank, Washington and past chairman and member of the External Audit Committee of the International Monetary Fund. Len is also a non-executive director of the South African Reserve Bank, Sappi Limited and Exxaro Resources Limited. During the year under review, Len was a member of the audit committee and chairman of the risk advisory committee and the nomination committee. He was recently elected as chairman of the human resources and remuneration committee.
david charLes brink (70) MSc Eng (Mining), DComm (hc), Graduate Diploma in Company Direction Dave was appointed to the board as an independent non-executive director in December 2008.
Dave is chairman of Absa Bank Limited and Absa Group Limited and a director of Sappi Limited. He retired recently from the boards of BHP Billiton and BHP Billiton PLC, where he was chairman of the sustainability committee and a member of the risk management and audit committee. He is currently a board member of the National Business Initiative, co-chairman of the Business Trust and a vice-president of the Institute of Directors in South Africa.
Dave previously acted as independent non-executive chairman to Unitrans Limited until the termination of its listing on 27 May 2007.
dirk eMiL ackerMan (75) Dirk is an independent non-executive director and the chairman of the human resources and remuneration committee, a position he has held since joining the group in September 1998. He has more than 41 years of management experience. He joined Chubb and Sons Lock & Safe Group in 1961 and was appointed managing director of Chubb Holdings Limited in 1981. In addition, during the 1980s and 1990s, Dirk acted as chairman of the Security Officers Board, chairman of The Air Traffic and Navigation Company and chairman of Sun Air. He became chairman and chief executive in 1986 and, from retirement in June 1994, acted as non-executive chairman until 1996. Dirk completed several management courses with the University of Cape Town Graduate School of Business and Henley Management College in the United Kingdom. In October 1993, Dirk received the order for meritorious service – silver from the state for public and private sector service.
Dirk will be retiring from the board in December 2009.
BoarD of DIrectorsnon-execut ive
80 • Steinhoff AnnuAl RepoRt 2009 • BoARd of diRectoRS

stefanes francois booysen (47) BCompt (Accounting)(Hons), MCompt DComm(Accounting), CA(SA) Steve was appointed to the board as an independent non-executive director on 8 September 2009.
He completed his articles with Ernst & Young and acted as lecturer at the University of South Africa. In 2006 he was appointed as Council Member of the University of Pretoria. Steve is the former Group chief executive officer of Absa Group Limited.
yoLanda ZoLeka cuba (32) BComm (Statistics), BComm Hons (Accounting), CA(SA) Yolanda was appointed to the board as an independent non-executive director in December 2008.
Yolanda Cuba is the chief executive officer of Mvelaphanda Group Limited, one of South Africa’s leading listed black-owned investment companies. She joined Mvelaphanda in their Corporate Finance division in early 2003 and was appointed Deputy CEO later that year. She has been responsible for initiating and executing a number of the group’s major investments. At 29 years of age, she became one of the youngest CEOs of a JSE-listed company.
She is a Chartered Accountant by profession and holds a BComm (Statistics) from the University of Cape Town and a BComm Honours degree in Accounting from the University of Natal (Durban). She has worked at Robertsons Foods (now part of Unilever) and Fisher Hoffman PKF.
She also sits on a number of boards including Absa Bank Limited, AVUSA Limited and Life Healthcare.
cLaas edMund daun (66) BAcc, CA Claas joined Steinhoff Germany as non-executive director in 1992 and has acted as a non-executive director of Steinhoff since its listing in 1998. Claas has extensive experience of management and investments worldwide and is a corporate investor in several industries. He is currently a member of the boards of KAP International Holdings Limited, KAP AG, Courthiel Holdings (Proprietary) Limited, DAUN & CIE. AG, Stöhr AG, Mech. Baumwoll-Spinnerei & Weberei Bayreuth AG and Oldenburgische Landesbank AG, and holds several other directorships. Claas is also honorary consul of South Africa in Lower Saxony, Germany. Claas holds a masters’ degree in business commerce from the University of Cologne and qualified as a chartered accountant in 1975.
Johannes fredericus Mouton (63) BComm (Hons), CA(SA), AEP Jannie is the executive chairman of PSG Group which he founded in 1995. PSG has, inter alia, established Capitec Bank, PSG Konsult, Zeder Investments, PSG Fund Management and Paladin Capital. Jannie is currently chairman of Zeder Investments and Paladin Capital and was chairman of Capitec Bank from inception in 2001 until 2007. He also serves on the boards of Pioneer, Kaap Agri and KWV.
Jannie commenced his career with articles at the now-named PricewaterhouseCoopers, after which he joined Federal Volksbeleggings. In 1982 he co-founded the stockbroking firm Senekal Mouton and Kitshoff.
BoARd of diRectoRS • Steinhoff AnnuAl RepoRt 2009 • 81

bruno ewaLd steinhoff (71) Bruno is the founder of the Steinhoff group and served as chairman until the end of September 2008. He relinquished executive duties from 1 April 2008 and continues to serve as non-executive director. After studying industrial business, Bruno started his furniture trade and distribution business in June 1964 in Westerstede, Germany. In 1971, he expanded into manufacturing with the first upholstery factory in Remels. During the 1980s, Bruno acquired interests in central and eastern Europe and also ventured into South Africa in a joint-venture with Claas Daun involving Gommagomma Holdings. He has 45 years of experience in the furniture business and more than 38 years’ manufacturing experience. Bruno also serves on the regional board of Commerzbank for Northern Germany.
frankLin abrahaM sonn (70) BA, HdipEd (Hons), FIAC Franklin joined Steinhoff as an independent non-executive director in 2002. He was appointed democratic South Africa’s first ambassador to the United States of America from 1995 to 1998. He returned to South Africa in 1999 and is the recipient of 13 honorary doctorates in law, education, humanities and philosophy from various institutions in South Africa, Europe and North America. He served as rector of Peninsula Technikon for 17 years and has been serving as chancellor of the University of the Free State since 2002. Current board positions include chairman of Piazza (Proprietary) Limited (holding company for the 5-star Airport Sun Inter-Continental Hotel at OR Tambo Airport), Imalivest (Proprietary) Limited, Xinergistics Management Services (Proprietary) Limited, African Star Ventures (Proprietary) Limited, KV3 Engineers (Proprietary) Limited, Ekapa Mining (Proprietary) Limited as well as non-executive director of Sappi Limited, Macsteel Holdings Limited, Esorfranki Limited, Pioneer Food Group Limited and RGA Reinsurance Company of South Africa.
BoarD of DIrectorsnon-execut ive
angeLa krüger–steinhoff (38)* BComm: Economic Science Angela obtained her degree in Economic Science in 1997 at the European Business School, Oestrich-Winkel, Germany. She began her professional career with Walt Disney World Company in Florida in 1991 and also worked for various European and US Corporations. She joined the Steinhoff Group in 1997 as a financial manager. In 1999 she was seconded to act as Managing Director of the Australian operations. She resigned from the group at the end of 2005 and now attends to the Steinhoff Family Investments. She has 10 years’ experience in the industry, specific knowledge of and extensive experience of management and investments globally. She was appointed as an alternate non-executive director to Bruno Steinhoff on 7 March 2007.
* Alternate non-executive director
82 • Steinhoff AnnuAl RepoRt 2009 • BoARd of diRectoRS

ATTENDANCE AT MEETINGS 9 SEPTEMBER 2008 1 DECEMBER 2009 2 MARCH 2009 1 JUNE 2009
steinhoff international holdings limited Board
Dirk Ackerman
Dave Brink
yolanda Cuba
Claus Daun
Piet Ferreira‡
Stéhan Grobler‡
Markus Jooste
Len Konar#
Jannie Mouton
Frikkie Nel
Franklin Sonn
Bruno Steinhoff+
Ian Topping
Danie van der Merwe
Jan van der Merwe* –
alternates
Johann du Plessis
Jo Grové
Angela Krüger-Steinhoff
+ Stepped down as chairman at the end of September 2008 – now serving as a non-executive director# Appointed independent non-executive chairman at the end of September 2008* Resigned from the board with effect from 1 May 2009‡ Appointed as executive directors with effect from 1 May 2009 (previously served as alternate directors)
BoARd of diRectoRS • Steinhoff AnnuAl RepoRt 2009 • 83

VALUE-ADDED STATEMENT 2009 2008
R’000 R’000
Turnover 50 868 641 45 045 885
Cost of products and services (37 080 365) (32 057 176)
Value added 13 788 276 12 988 709
Income from investments (959 424) (786 768)
Totalwealthcreated 12 828 852 12 201 941
Distributionofwealth
Salaries and wages 8 598 977 7 224 435
Interest paid 1 968 348 1 554 962
Taxation paid 581 254 366 133
Dividends and capital distributions paid 939 626 736 058
Reinvested 740 647 2 320 353
12 828 852 12 201 941
distribution of weaLth
Salaries and wages
Interest paid
Taxation paid
Dividends and capital distributions paid
Reinvested
4%
12%
2007
6%
12%66%
5%
6%
15%
2009
7%
67%
3%
19%
2008
6%
13%
59%
value-aDDeD statement
84 • Steinhoff AnnuAl RepoRt 2009 • vAlue-Added StAtement

We have audited the group annual financial statements of Steinhoff International Holdings
Limited, which comprise the directors’ report, audit committee report the balance sheet at
30 June 2009, the income statement, the statement of recognised income and expense and
cash flow statement for the year then ended, a summary of significant accounting policies
and other explanatory notes as set out on pages 86 to 210.
Directors’ responsibility for the financial statementsThe company’s directors are responsible for the preparation and fair presentation of these
financial statements in accordance with International Financial Reporting Standards,
and in the manner required by the Companies Act of South Africa. This responsibility
includes: designing, implementing and maintaining internal control relevant to the
preparation and fair presentation of financial statements that are free from material
misstatement, whether due to fraud or error; selecting and applying appropriate accounting
policies; and making accounting estimates that are reasonable in the circumstances.
auDitors’ responsibilityOur responsibility is to express an opinion on these financial statements based on our
audit. We conducted our audit in accordance with International Standards on Auditing.
Those standards require that we comply with ethical requirements and plan and perform
the audit to obtain reasonable assurance whether the financial statements are free from
material misstatement.
An audit involves performing procedures to obtain audit evidence about the amounts and
disclosures in the financial statements. The procedures selected depend on the auditor’s
judgement, including the assessment of the risks of material misstatement of the financial
statements, whether due to fraud or error. In making those risk assessments, the auditor considers
internal control relevant to the entity’s preparation and fair presentation of the financial
statements in order to design audit procedures that are appropriate in the circumstances, but not
for the purpose of expressing an opinion on the effectiveness of the entity’s internal control.
An audit also includes evaluating the appropriateness of accounting principles used and
the reasonableness of accounting estimates made by the directors, as well as evaluating the
overall financial statement presentation.
We believe that the audit evidence we have obtained is sufficient and appropriate to provide
a basis for our audit opinion.
opinionIn our opinion, the group financial statements present fairly, in all material respects, the
financial position of the group as at 30 June 2009, and of its financial performance and its
cash flows for the year then ended in accordance with International Financial Reporting
Standards, and in the manner required by the Companies Act of South Africa.
Deloitte & Touche
Registered Auditors
Per U Böhmer
Partner
8 September 2009
221 Waterkloof Road
Waterkloof
Pretoria
0181National Executive: GG Gelink Chief Executive AE Swiegers Chief Operating Officer GM Pinnock Audit DL Kennedy Tax & Legal and Risk Advisory L Geeringh Consulting L Bam Corporate Finance CR Beukman Finance TJ Brown Clients & Markets NT Mtoba Chairman of the Board CR Qually Deputy Chairman of the Board Regional Leader: X Botha
A full list of partners and directors is available on request.
Independent audItors’ reportto the members of Ste inhoff Internat ional Hold ings L imited
Independent audItors’ report • steInhoff annual report 2009 • 85

The directors have pleasure in presenting the group annual financial statements of Steinhoff International Holdings Limited (Steinhoff), for the year ended 30 June 2009.
Steinhoff is a holding company invested predominantly in household goods and related industries with interests in continental Europe, the Pacific Rim, the United Kingdom and southern Africa. With revenues in excess of R50 billion (2008: R45 billion), Steinhoff today employs a vertically integrated and geographically diverse business model, consolidating all points of contact from raw material to retail outlet across an extensive product offering.
The results for the year under review are fully set out in the attached annual financial statements.
The board has resolved to award non-renounceable capitalisation shares from the share premium account to shareholders recorded in the register at the close of business on Friday 4 December 2009 (2008: 5 December 2009) (the capitalisation share award). All shareholders will be awarded the opportunity to elect to receive a cash distribution of 60 cents per share in lieu of the capitalisation share award. Elections will close on Friday, 4 December 2009 at 12:00 and the payment and issue date will be Monday, 7 December 2009 (2008: 8 December 2008).
ISSued SHare
capItaL
effectIve SHareHoLdIng
%
Steinhoff ’s subsidiary is Steinhoff Investment Holdings Limited (Steinhoff Investment)
Ordinary shares R75 000 100
Preference shares R15 000 31
Steinhoff Investment’s subsidiaries are:
Phaello Finance Company (Proprietary) Limited R22 000 100*
Steinhoff Africa Holdings (Proprietary) Limited R35 700 100
Steinhoff Möbel Holdings Alpha GmbH (incorporated in Austria) €35 790 100
* Held 50% directly and 50% indirectly.
The attributable interest of the company in the aggregated net income after taxation of all its direct and indirect subsidiaries for the year ended 30 June is:
2009 r’000
2008 r’000
Aggregate amount of profit after taxation 3 974 207 3 873 884
Aggregate amount of loss after taxation (595 329) (563 847)
3 378 878 3 310 037
dIrectors’ reportfor the year ended 30 June 2009
86 • steInhoff annual report 2009 • dIrectors’ report

During the year, the group invested R1 547 million (2008: R2 200 million) in property, plant and equipment and R23 million (2008: R20 million) in investment property. Capital expenditure was funded by internally generated cash and bank facilities.
Further information relating to the investment in property, plant and equipment and investment property of the group is presented in notes 11 and 12 to the annual financial statements.
major transactionsBroad-based black economic empowerment (B-BBEE) ownership transaction (the B-BBEE transaction)On 2 December 2008, Steinhoff introduced its B-BBEE ownership transaction to the participating staff members. This transaction was approved at the annual general meeting held on 1 December 2008. The transaction was well received by staff and a detailed roll-out and implementation programme commenced in January 2009. This transaction introduced Steinhoff’s permanent South African staff and black management as shareholders. Upon the release of the 2009 annual financial statements of the operating entities, the B-BBEE ownership points obtained through this transaction will be verified by an accredited rating agency and all South African operations will benefit from the score obtained.
share capitalThe company’s authorised share capital comprises R16 million, divided into 3 000 000 000 ordinary shares of 0,5 cents each and 1 000 000 000 non-cumulative, non-redeemable, non-participating, variable rate preference shares of 0,1 cents each.
The following ordinary shares were issued during the year:
date number of shares r’000
24 November 2008 19 698 873 10 480
The issue of shares was for the settlement of the group’s obligation under the share incentive schemes.
At year-end, subsidiaries and special-purpose vehicles of the group held 89 072 056 (2008: 80 976 206) shares which have been netted off against issued ordinary share capital as treasury shares. In addition, the company has reserved for the allocation and potential issue on conversion 119 338 793 (2008: 119 338 793) ordinary shares under its obligations to the holders of convertible bonds due in 2013 and 2015 respectively.
contractsNo contracts, other than those disclosed in note 42.6, in which directors and officers of the company had an interest and that significantly affected the affairs or business of the company or any of its subsidiaries or which could have resulted in a conflict of interest, were entered into during the year.
post-balance sheet eventsOn 31 July 2009, Steinhoff Investment entered into an agreement to acquire the remaining 55% interest in Hemisphere International Properties BV (Hemisphere) from Dolus Grundstücksverwaltungs GmbH. At 30 June 2009, Steinhoff Europe AG, held a 45% interest in Hemisphere. The purchase consideration of €106 190 000 was settled by the delivery of 72 143 777 (delivery of 15 000 000 from treasury shares and the issue of 57 143 777) ordinary listed shares in the company at the price of R16,15, equating to a total consideration of R1 165 122 000 (at the exchange rate of €1:R10,97205).
At the board meeting held on 8 September 2009, the company appointed Dr Stefanes Francois Booysen as an independent non-executive director of the company.
Except as disclosed above, the directors are not aware of any significant post-balance sheet events that will have a material effect on the group’s results or financial position as presented in these financial statements.
dIrectors’ report • steInhoff annual report 2009 • 87

DirectorateThe executive directors in office during the financial year and date of this report were:
Markus Johannes Jooste – Chief executive officerHendrik Johan Karel Ferreira (appointed 1 May 2009) (previously alternate director)Stephanus Johannes Grobler (appointed 1 May 2009) (previously alternate director)Fredrik Johannes Nel – Financial directorIan Michael Topping (British)Daniël Maree van der MerweJohannes Henoch Neethling van der Merwe (resigned 1 May 2009)
The non-executive directors in office during the financial year and date of this report were: Dr Deenadayalen Konar* – ChairmanDirk Emil Ackerman*Dr Stefanes Francois Booysen* (appointed 8 September 2009)David Charles Brink*Yolanda Zoleka Cuba*Claas Edmund Daun (German)*Johannes Fredericus Mouton*Dr Franklin Abraham Sonn*Bruno Ewald Steinhoff (German)
The alternate directors in office during the financial year and date of this report were:Johannes Nicolaas Stephanus du PlessisKarel Johan GrovéAngela Krüger-Steinhoff (German)**
Directors’ shareholDingAt 30 June 2009, the present directors of the company held direct and indirect interests in 231 374 284 (2008: 221 238 365) or 16,9% (2008: 16,4%) of the company’s issued ordinary shares.
There have been no changes to directors’ shareholding between year-end and the date of this report. Details of individual holdings are disclosed in note 43.
corporate governanceThe group complies with the listings requirements of the JSE Limited (JSE) and in all material respects with the Code of Corporate Practice and Conduct published in the King II Report on Corporate Governance.
share incentive schemesThe share incentive schemes were approved by shareholders to provide for 10% of issued share capital from time to time. The directors are authorised to issue, allot or grant rights in respect of up to a maximum of 18 500 000 (2008: 36 000 000) shares of the company from time to time in terms of the employee share incentive schemes. It is noted that the market-related performance hurdles in respect of the share incentive scheme granted December 2003 were met and the last tranche matured on 1 December 2008. Details of participation by directors in the share incentive schemes are set out in note 43 of the annual financial statements.
secretaryStephanus Johannes Grobler acts as secretary to the company.
Business address Postal address28 Sixth Street PO Box 1955Wynberg Bramley2090 2018
dIrectors’ reportfor the year ended 30 June 2009 (cont inued)
* Independent non-executive director
** Non-executive director
88 • steInhoff annual report 2009 • dIrectors’ report

approval of the annual financial statementsIt is the directors’ responsibility to ensure that the annual financial statements fairly present the state of affairs of the group. The external auditors are responsible for independently auditing and reporting on the financial statements.
The directors are also responsible for the systems of internal control. These are designed to provide reasonable, but not absolute, assurance on the reliability of the financial statements, to adequately safeguard, verify and maintain accountability of assets, and to prevent and detect material misstatement and loss. The systems are implemented and monitored by suitably trained personnel with an appropriate segregation of authority and duties. Nothing has come to the attention of the directors to indicate that any material breakdown in the functioning of these controls, procedures and systems has occurred during the year under review.
The financial statements set out in this report have been prepared by management on the basis of appropriate accounting policies which have been consistently applied except where stated otherwise. The financial statements have been prepared in accordance with International Financial Reporting Standards (IFRS).
The directors reasonably believe that the group has adequate resources to continue in operation for the foreseeable future, and the annual financial statements have therefore been prepared on the going-concern basis.
The annual financial statements for the year ended 30 June 2009, which appear on pages 92 to 210, were approved by the board and signed on its behalf on 8 September 2009.
Dr Deenadayalen Konar Markus Johannes JoosteIndependent non-executive chairman Chief executive officer
secretary certificationI certify, in accordance with section 268 G(d) of the South African Companies Act, 1973, as amended (the Act) that the company has lodged with the Registrar of Companies all such returns as are required for a public company in terms of the Act and that all such returns are true, correct and up to date.
Stephanus Johannes GroblerCompany secretary
dIrectors’ report • steInhoff annual report 2009 • 89

backgrounDThe committee is pleased to present our report for the financial year ended 30 June 2009 as recommended by the King II report on Corporate Governance and in line with the South African Companies Act, 61 of 1973 (as amended) (the Act).
The committee’s operation is guided by a formal detailed charter that is in line with the Act and is approved by the board as and when it is amended. The committee has discharged all its responsibilities as contained in the charter. This process is supported by the audit subcommittees which are in place for all operating divisions and subsidiaries. These subcommittees meet in terms of formal mandates and deal with all issues arising at the operational division or subsidiary level. These subcommittees, then elevate any unresolved issues of concern to the Steinhoff International audit committee.
objective anD scopeThe overall objectives of the committee are as follows:
• Toreviewtheprinciples,policiesandpracticesadoptedinthepreparationoftheaccounts of companies in the group and to ensure that the annual financial statements of the group and any other formal announcements relating to the financial performance comply with all statutory, regulatory and Steinhoff requirements as may be required.
• Toensurethattheconsolidatedinterimabridgedfinancialstatementsofthegroupcomply with all statutory, regulatory and Steinhoff requirements and similarly, that the financial information contained in any consolidated submissions to Steinhoff is suitable for inclusion in its consolidated financial statements.
• Toannuallyassesstheappointmentoftheauditorsandtheirindependence,recommend their appointment and approve their fees.
• Toreviewtheworkofthegroup’sexternalandinternalauditorstoensuretheadequacyandeffectiveness of the group’s financial, operating compliance and risk management controls.
• Toreviewthemanagementofriskandthemonitoringofcomplianceeffectivenesswithin the group.
• ToperformdutiesthatareattributedtoitbytheAct,theJSEandKingII.
The committee performed the following activities:
• Receivedandreviewedreportsfrombothinternalandexternalauditorsconcerningtheeffectiveness of the internal control environment, systems and processes.
• Reviewedthereportsofbothinternalandexternalauditorsdetailingtheirconcernsarising out of their audits and requested appropriate responses from management resulting in their concerns being addressed.
• Madeappropriaterecommendationstotheboardofdirectorsregardingthecorrectiveactions to be taken as a consequence of audit findings.
• Consideredtheindependenceandobjectivityoftheexternalauditorsandensuredthatthe scope of their additional services provided was not such that they could be seen to have impaired their independence.
• Reviewedandrecommendedforadoptionbytheboardsuchfinancialinformationthatis publicly disclosed which for the year included:– the annual report for the year ended 30 June 2009– the interim results for the six months ended 31 December 2008.
• Consideredtheeffectivenessofinternalaudit,approvedtheoneyearoperationalstrategicinternal audit plan and monitored adherence of internal audit to its annual plan.
The audit committee is of the opinion that the objectives of the committee were met during the year under review.
Where weaknesses in specific controls had been identified, management undertook to implement appropriate corrective actions to mitigate the weakness identified.
audIt commIttee reportfor the year ended 30 June 2009
90 • steInhoff annual report 2009 • audIt commIttee report

membershipDuring the course of the year, the membership of the committee comprises solely independent non-executive directors. They are:
DC Brink (chairman – appointed 30 September 2008)DE AckermanDr D Konar (past chairman – retired as chairman of the committee 30 September 2008)Dr SF Booysen (appointed 8 September 2009)
external auDitThe committee has satisfied itself through enquiry that the auditor of Steinhoff is independent as defined by the Act.
The committee, in consultation with executive management, agreed to an audit fee for the 2009 financial year. The fee is considered appropriate for the work that could reasonably have been foreseen at that time. Audit fees are disclosed in note 3.2 to the financial statements.
There is a formal procedure that governs the process whereby the external auditor is considered for the provision of non-audit services, and each engagement letter for such work is reviewed in accordance with set policy and procedure.
Meetings were held with the auditor where management was not present, and no matters of concern were raised.
The committee has reviewed the performance of the external auditors and nominated, for approval at the annual general meeting, Deloitte & Touche as the external auditor for the 2010 financial year, and Mr Udo Böhmer as the designated auditor. This will be his fifth year as auditor of the company.
annual financial statementsThe audit committee has evaluated the consolidated annual financial statements for the year ended 30 June 2009 and considers that it complies, in all material aspects, with the requirements of the Act and International Financial Reporting Standards. The committee has therefore recommended the annual financial statements for approval to the board. The board has subsequently approved the financial statements which will be open for discussion at the forthcoming annual general meeting.
David Charles BrinkAudit committee chairman8 September 2009
audIt commIttee report • steInhoff annual report 2009 • 91

NoTeS 2009 2008 r’000 r’000
Revenue 1 50 868 641 45 045 885
Cost of sales (33 169 786) (30 219 790)
Gross profit 17 698 855 14 826 095
Other operating income 1 203 141 1 201 797
Distribution expenses (3 332 252) (2 787 374)
Other operating expenses (10 416 975) (8 578 905)
Capital items 2 49 295 (192 890)
Operating profit 3 5 202 064 4 468 723
Finance costs 4 (1 959 277) (1 490 821)
Income from investments 5 959 424 786 768
Share of profit of associate companies 15 6 527 37 071
Profit before taxation 4 208 738 3 801 741
Taxation 6 (581 254) (366 133)
Profit for the year 3 627 484 3 435 608
Attributable to:
Equity holders of the parent 3 378 878 3 310 037
Minority interests 248 606 125 571
Profit for the year 3 627 484 3 435 608
Basic earnings per share (cents) 7 256,1 249,8
Diluted earnings per share (cents) 7 245,8 238,8
Income statementfor the year ended 30 June 2009
92 • steInhoff annual report 2009 • Income statement

2009 2008 r’000 r’000
Actuarial losses recognised in equity (22 430) (13 137)Cash flow hedges recognised in equity (49 110) 15 219Exchange differences on consolidation of foreign subsidiaries (2 583 131) 2 353 086Fair value adjustments on available for sale financial assets 132 (3 157)Net (expense)/income recognised directly in equity (2 654 539) 2 352 011Profit for the year 3 627 484 3 435 608Total recognised income and expense for the year 972 945 5 787 619
Attributable to:Equity holders of the parent 1 106 807 5 021 490Minority interests (133 862) 766 129
972 945 5 787 619
statement of recognIsed Income and expense
for the year ended 30 June 2009
statement of recognIsed Income and expense • steInhoff annual report 2009 • 93

NoTeS 2009 2008 r’000 r’000
ASSeTSNon-current assetsGoodwill 9 7 195 513 8 300 991 Intangible assets 10 11 679 815 12 925 604 Property, plant and equipment 11 9 807 538 10 265 213 Investment property 12 304 455 304 835 Vehicle rental fleet 13 40 002 12 137 Consumable biological assets 14 1 125 036 706 283 Investments in associate companies 15 3 004 766 2 457 992 Interest in joint-venture companies 16 9 997 5 634 Investments and loans 17 2 358 080 1 273 045 Deferred taxation assets 18 1 101 321 1 390 020
36 626 523 37 641 754 Current assetsDerivative financial assets 19 1 115 27 021 Vehicle rental fleet 13 142 954 296 844 Inventories 20 4 756 962 5 553 033 Trade and other receivables 21 7 740 517 7 301 606 Short-term loans receivable 22 792 770 454 814 Taxation receivable 203 234 198 564 Value added taxation receivable 257 907 404 256 Funds on call and deposit 41 670 269 050 Bank balances and cash 41 4 735 527 4 726 181
18 631 656 19 231 369 Assets classified as held for sale 23 29 246 42 621
18 660 902 19 273 990 Total assets 55 287 425 56 915 744
Balance sheetas at 30 June 2009
94 • steInhoff annual report 2009 • balance sheet

NoTeS 2009 2008 r’000 r’000
eQUITY AND LIABILITIeSCapital and reservesOrdinary share capital and premium 24 3 718 081 4 501 476 Reserves 25 17 303 240 16 271 471 Preference share capital and premium 26 1 042 474 1 042 474 Total equity attributable to equity holders of the parent 22 063 795 21 815 421 Minority interests 25 2 859 958 2 968 732 Total equity 24 923 753 24 784 153 Non-current liabilitiesInterest-bearing loans and borrowings 28 12 703 880 12 684 508 Equalisation of operating lease payments 29 113 786 90 106 Employee benefits 30 209 720 256 965 Deferred taxation liabilities 18 3 020 423 3 203 448 Deferred government grants 31 10 467 11 710 Provisions 32 536 400 587 687 Derivative financial liabilities 19 93 068 467 598
16 687 744 17 302 022 Current liabilitiesTrade and other payables* 33 7 199 592 8 728 887 Equalisation of operating lease payments 29 8 041 15 249 Employee benefits 30 364 949 377 326 Provisions 32 270 637 659 683 Derivative financial liabilities 19 88 889 4 244 Interest-bearing loans and borrowings* 28 4 808 052 2 880 635 Taxation payable 595 187 687 544 Value added taxation payable 273 700 400 980 Bank overdrafts 66 881 1 075 021
13 675 928 14 829 569 Total equity and liabilities 55 287 425 56 915 744 Net asset value per ordinary share (cents) 7 1 642 1 637
* Floorplan creditors of R89 million was reallocated in 2008 from interest-bearing short-term liabilities to trade and other payables to better reflect the nature of the liability.
balance sheet • steInhoff annual report 2009 • 95

NoTeS 2009 2008 r’000 r’000
CASH FLoWS FRoM oPeRATING ACTIVITIeS
Cash generated from operations 36 3 934 136 5 484 852
Dividends received 598 11 423
Interest received 935 853 772 019
Interest paid (1 820 052) (1 532 053)
Dividends paid (157 258) (119 639)
Taxation paid 37 (309 110) (385 623)
Net cash inflow from operating activities 2 584 167 4 230 979
CASH FLoWS FRoM INVeSTING ACTIVITIeS
Additions to property, plant and equipment, vehicle rental fleet and investment property (1 804 511) (2 583 024)
Proceeds on disposal and scrapping of property, plant and equipment, vehicle rental fleet and investment property 655 171 544 943
Additions to intangible assets (133 712) (728 095)
Proceeds on disposal of intangible assets 9 986 48 081
Cash flow on minority take-out and acquisition of minority interest in subsidiary companies – (354)
Proceeds on disposal of minority shareholders 584 –
Acquisition of subsidiary companies, net of cash acquired 38 (20 617) (3 394 977)
Disposal of subsidiaries and businesses, net of cash disposed 39 (4 749) 1 352 891
(Increase)/decrease in investments and loans (1 341 832) 1 482 077
Increase in treasury shares (32 906) (955 254)
Increase in short-term loans receivable (448 977) (75 121)
Net increase in interest in joint-venture companies (4 363) (4 307)
Net increase in investments in associate companies (860 683) (1 629 896)
Net cash outflow from investing activities (3 986 609) (5 943 036)
cash flow statementfor the year ended 30 June 2009
96 • steInhoff annual report 2009 • cash flow statement

NoTeS 2009 2008 r’000 r’000
CASH FLoWS FRoM FINANCING ACTIVITIeS
Proceeds on issue of share capital 40 10 409 (337)
Capital distribution paid (760 900) (633 905)
(Decrease)/increase in bank overdrafts (592 518) 319 184
Increase in long-term interest-bearing loans and borrowings 1 356 106 2 553 878
Increase/(decrease) in short-term interest-bearing loans and borrowings 1 688 120 (839 977)
Net cash inflow from financing activities 1 701 217 1 398 843
NeT INCReASe/(DeCReASe) IN CASH AND CASH eQUIVALeNTS 298 775 (313 214)
Cash and cash equivalents at beginning of the year 4 995 231 5 064 987
Effects of exchange rate translations on cash and cash equivalents (557 809) 243 458
CASH AND CASH eQUIVALeNTS AT eND oF THe YeAR 41 4 736 197 4 995 231
cash flow statement • steInhoff annual report 2009 • 97

2009 2008
r’000 r’000
RevenueRetail activities 31 861 813 27 309 464– Household goods and building supplies 21 659 722 14 889 601– Automotive 10 202 091 12 419 863Manufacturing and sourcing of household goods and related raw materials 23 790 810 19 267 783Logistics services 5 775 860 4 984 554Corporate services 919 529 925 745– Brand management 414 204 361 619– Investment participation 254 169 182 004– Central treasury and other activities 251 156 382 122
62 348 012 52 487 546Intersegment eliminations (11 479 371) (7 441 661)
50 868 641 45 045 885operating profit before capital itemsRetail activities 1 661 884 1 453 312– Household goods and building supplies 1 379 253 964 689– Automotive 282 631 488 623Manufacturing and sourcing of household goods and related raw materials 2 560 368 2 184 219Logistics services 676 714 460 659Corporate services 991 711 1 045 409– Brand management 414 204 361 620– Investment participation 254 169 182 004– Central treasury and other activities 323 338 501 785
5 890 677 5 143 599Intersegment eliminations (737 908) (481 986)
5 152 769 4 661 613Reconciliation between operating profit per income statement and operating profit before capital items per segmental analysisOperating profit per income statement 5 202 064 4 468 723Capital items (note 2) (49 295) 192 890Operating profit before capital items per segmental analysis 5 152 769 4 661 613
segmental reportIngfor the year ended 30 June 2009
98 • steInhoff annual report 2009 • segmental reportIng

2009 2008
r’000 r’000
Total assetsRetail activities 22 642 402 25 679 545 – Household goods and building supplies 20 328 572 23 035 434 – Automotive 2 313 830 2 644 111 Manufacturing and sourcing of household goods and related raw materials 12 072 163 13 920 171 Logistics services 5 261 014 4 629 291 Corporate services 6 331 828 6 609 356 – Brand management 3 836 533 4 143 382 – Investment participation 1 921 790 1 356 566 – Central treasury and other activities 573 505 1 109 408
46 307 407 50 838 363 Reconciliation between total assets per balance sheet and total assets per segmental analysisTotal assets per balance sheet 55 287 425 56 915 744Less: Cash and cash equivalents (4 736 197) (4 995 231)Less: Investments in associate companies (3 004 766) (739 532)Less: Investments in preference shares (216 389) (193 285)Less: Interest-bearing loans receivable (1 022 666) (149 333)Total assets per segmental analysis 46 307 407 50 838 363Geographical analysisRevenueContinental Europe 19 048 930 13 167 533Pacific Rim 3 070 062 3 015 132Southern Africa 19 348 947 20 331 063United Kingdom 9 400 702 8 532 157
50 868 641 45 045 885Non-current assetsContinental Europe 17 201 993 16 756 588Pacific Rim 1 262 208 1 522 139Southern Africa 10 863 921 10 063 893United Kingdom 7 298 401 9 299 134
36 626 523 37 641 754
segmental reportIng • steInhoff annual report 2009 • 99

segmental reportIngfor the year ended 30 June 2009 (cont inued)
basis of segmental presentationThe segmental information has been prepared in accordance with IFRS 8 – Operating Segments (IFRS 8) which defines requirements for the disclosure of financial information of an entity’s operating segments. The standard requires segmentation based on the group’s internal organisation and reporting of revenue and operating income based upon internal accounting methods.
iDentification of segmentsThe group discloses its operating segments according to the entity components regularly reviewed by the chief operating decision-makers. The components comprise various operating segments located globally. The revenue and non-current assets are further disclosed within the geographical areas in which the group operates. Segmental information is prepared in conformity with the measure that is reported to the chief operating decision-makers. These values have been reconciled to the consolidated financial statements. The measures reported by the group is in accordance with the accounting policies adopted for preparing and presenting the consolidated financial statements.
Segment revenue excludes value added taxation and includes intersegment revenue. Net revenue represents segment revenue from which intersegment revenue has been eliminated. Sales between segments are made on a commercial basis. Segment operating profit before capital items represents segment revenue less segment operating expenses, excluding capital items included in note 2. Segment expenses include distribution expenses and other operating expenses. Depreciation and amortisation have been allocated to the segments to which they relate.
The segment assets comprise all assets of the different segments that are employed by the segment and that either are directly attributable to the segment, or can be allocated to the segment on a reasonable basis.
operational segmentsRetail activities: Household goods and building suppliesRevenue in this segment is derived through retailing furniture, beds, related homewares, building supplies and household products in continental Europe, the United Kingdom, Australia, New Zealand and South Africa. This segment incorporates all the retail operations of Steinhoff Asia Pacific in Australia and New Zealand, Steinhoff UK Holdings in the United Kingdom, Steinhoff Hungary in Hungary, Steinhoff Retail in the European Union and the do-it-yourself (DIY) and building products retail operations in South Africa.
Retail activities: AutomotiveThe principal activity within this segment is the motor retail organisation of Unitrans, with representation across dealerships nationwide. Its activities span new and pre-owned vehicle sales, parts and accessories sales, financial services and after-sale services.
Manufacturing and sourcing of household goods and related raw materialsThis segment hosts all of Steinhoff’s global manufacturing and sourcing interests. Revenue in southern Africa is derived from the timber operations of PG Bison and the manufacturing and supply of raw materials. In continental Europe, revenue is generated from manufactured and imported/sourced household goods and related homewares. European revenue also includes the importing operations in the Netherlands, the manufacturing and sourcing operations in Germany, the low-cost manufacturing operations in Hungary, Poland and Ukraine, and the manufacturing of household goods and automotive products in the United Kingdom, while in the Pacific Rim revenue is derived from the manufacturing operations in Australia and sourcing from the East.
100 • steInhoff annual report 2009 • segmental reportIng

Logistics servicesRevenue in this segment includes, in Africa, Unitrans Freight (specialised distribution and warehousing services to the mining, manufacturing, industrial and allied sectors of the economy, together with express delivery services), Unitrans Fuel and Chemical (specialised transportation and fuel logistics services to the petrochemical and gas industries), Unitrans Sugar and Agriculture (transport and related logistics services to the sugar and agricultural industry including forestry), Unitrans Supply Chain (provision of supply chain re-engineering and warehousing management services) and Unitrans Passenger (transport of passengers under contract and through services to the public at large). This segment further includes the specialised distribution and warehousing services delivered to the group and external parties through our distribution and warehouse companies situated in continental Europe, the United Kingdom and the Pacific Rim.
Corporate servicesSteinhoff’s various global corporate offices provide strategic direction and services to the decentralised operations globally, adding value through identifying and implementing our various strategies across the globe, which mainly comprise:
Brand managementWithin the brand management segment, revenue is principally derived where customers and operating entities are levied royalties for the use and development of our own brands, trade names and trademarks.
Investment participationIn implementing our strategic direction, the group invests in strategic retail and supply partners either through equity investments and/or through loans on an arm’s length basis. Revenue derived from these investments and loans (excluding interest thereon) are consolidated within the investment participation segment.
Treasury and other activitiesOther activities include the managing of all group treasury-related income in various currencies, volume rebates, trade commissions, discounts and similar activities. Rentals received from investment property are also allocated to this segment.
geographical segmentsThe group’s operations are principally located in continental Europe, the Pacific Rim, southern Africa and the United Kingdom.
major customers No single customer contributes 10% or more of the group’s revenue.
segmental reportIng • steInhoff annual report 2009 • 101

summary of accountIng polIcIesfor the year ended 30 June 2009
Steinhoff is a South African registered company. The consolidated annual financial statements of Steinhoff for the year ended 30 June 2009 comprise Steinhoff and its subsidiaries (together referred to as the Steinhoff Group) and the group’s interest in associate companies and joint-venture companies.
statement of complianceThe consolidated annual financial statements have been prepared in accordance with International Financial Reporting Standards (IFRS), the interpretations adopted by the International Accounting Standards Board (IASB), the International Financial Reporting Interpretations Committee of the IASB (IFRIC) and the requirements of the South African Companies Act, 1973, as amended.
aDoption of new anD reviseD stanDarDsDuring the current year, the group has adopted and early adopted all of the new and revised standards and interpretations issued by the IASB and the IFRIC that are relevant to its operations and effective for annual reporting periods beginning on 1 July 2008. The adoption of these new and revised standards and interpretations has resulted in changes to the group’s accounting policies that have affected the disclosure for the current year.
The group adopted the following standards, interpretations and amended standards during the year:
IFRS 7 Financial Instruments: Disclosures: Reclassification of financial assets
IAS 39 Financial Instruments: Recognition and Measurement: Applicable effective interest rate on cessation of fair value hedge accounting; Eligible hedged items; Embedded derivatives; Reclassification of financial assets
IFRIC 9 Reassessment of Embedded Derivatives: Embedded derivatives
IFRIC 14 IAS 19 – The Limit on a Defined Benefit Asset, Minimum Funding Requirements and their Interaction
IFRIC 17 Distributions of Non-cash Assets to Owners
IFRIC 18 Transfers of Assets from Customers
The group adopted the following 2008 Improvements to IFRSs during the year:
IAS 19 Employee Benefits: Curtailments and negative past service costs; Plan administration costs; Replacement of term ‘fall due’; Guidance on contingent liabilities
The group adopted the following 2009 Improvements to IFRSs during the year:
IFRS 5 Non-current Assets Held for Sale and Discontinued Operations: Disclosure of non-current assets classified as held for sale or discontinued operations
IFRS 8 Operating Segments: Disclosure of information about segment assets
IAS 1 Presentation of Financial Statements: Current/non-current classification of convertible instruments
IAS 7 Statement of Cash Flows: Classification of expenditures on unrecognised assets
IAS 17 Leases: Classification of leases of land and buildings
IAS 18 Revenue: Determining whether an entity is acting as a principal or as an agent
IAS 36 Impairment of Assets: Unit of accounting for goodwill impairment test
IAS 38 Intangible Assets: Measuring the fair value of an intangible asset acquired in a business combination
102 • steInhoff annual report 2009 • summary of accountIng polIcIes

IAS 39 Financial Instruments: Recognition and Measurement: Cash flow hedge accounting; Scope exemption for business combinations; Treating loan prepayment penalties as closely related embedded derivatives
IFRIC 16 Hedges of a Net Investment in a Foreign Operation: Amendment to the restriction on the entity that can hold hedging instruments.
basis of preparationThe annual financial statements are prepared in thousands of South African rands (R’000) on the historical-cost basis, except for certain assets and liabilities which are carried at amortised cost, and derivative financial instruments and biological assets which are stated at their fair value.
The preparation of financial statements in conformity with IFRS requires management to make judgements, estimates and assumptions that may affect the application of policies and reported amounts of assets, liabilities, income and expenses. The estimates and associated assumptions are based on historical experience and various other factors that are believed to be reasonable under the circumstances, the results of which form the basis of making the judgements about carrying values of assets and liabilities that are not readily apparent from other sources.
The estimates and underlying assumptions are reviewed on an ongoing basis. Revisions to accounting estimates are recognised in the period in which the estimate is revised if the revision only affects that period, or in the period of the revision and future periods if the revision affects both current and future periods.
Judgements made by management in the application of IFRS that have a significant effect on the financial statements and estimates with a significant risk of material adjustment in the next financial year are discussed in note 35.
The accounting policies set out below have been applied consistently to the periods presented in these consolidated annual financial statements, except where stated otherwise.
The accounting policies have been applied consistently by all group entities.
basis of consoliDationSubsidiariesSubsidiaries are entities controlled by the group (including special-purpose entities). Control exists when the group has the power to, directly or indirectly, govern the financial and operating policies of an entity so as to obtain benefits from its activities. In assessing control, potential voting rights that are presently exercisable or convertible are taken into account.
On acquisition, the assets, liabilities and contingent liabilities of a subsidiary are measured at their fair value at the date of acquisition. Any excess of the cost of acquisition over the fair values of the identifiable net assets acquired is recognised as goodwill. If the group’s interest in the fair values of the identifiable net assets acquired exceeds the cost of acquisition (negative goodwill), the excess is recognised in profit or loss in the period of acquisition. The interest of minority shareholders is stated at the minority’s proportion of the fair values of the assets and liabilities recognised.
Minority interests in the net assets (excluding goodwill) of consolidated subsidiaries are identified separately from the group’s equity therein. Minority interests consist of the amount of those interests at the date of the original business combination and the minority’s share of changes in equity since the date of the combination.
Subsequently, any losses applicable to the minority interest in excess of the minority interest are allocated against the interest of the parent, unless the minority has a binding obligation to fund the losses and is able to make an additional investment to cover their share of the losses.
The financial statements of subsidiaries are included in the consolidated financial statements from the date that control commences until the date that control ceases.
All material intergroup transactions, balances, income and expenses and unrealised gains and losses between group companies are eliminated on consolidation.
Associate companiesAn associate company is an entity over which the group is in a position to exercise significant influence, through participation in the financial and operating policy decisions of the entity, but which it does not control or jointly control.
The results of associate companies are incorporated in the consolidated financial statements using the equity method of accounting, from the date that significant influence commences until the date that significant influence ceases, except when the investment is classified as held for sale, in which case it is accounted for under IFRS 5 – Non-current Assets Held for Sale and Discontinued Operations (IFRS 5). When the group’s share of losses exceeds its investment in the associate company, the group’s carrying amount is reduced to nil and recognition of further losses is discontinued except to the extent that the group has incurred legal or constructive obligations or made payments on behalf of an associate company.
Where a group entity transacts with an associate company, unrealised profits and losses are eliminated to the extent of the group’s interest in the relevant associate company, except where unrealised losses provide evidence of an impairment of the asset transferred.
summary of accountIng polIcIes • steInhoff annual report 2009 • 103

summary of accountIng polIcIesfor the year ended 30 June 2009 (cont inued)
Any difference between the cost of acquisition and the group’s share of the net identifiable assets, liabilities and contingent liabilities, fairly valued, is recognised and treated according to the group’s accounting policy for goodwill and is included in the carrying value of the investment in associate companies.
Joint-venture companiesA joint-venture company is defined as a contractual arrangement whereby two or more entities undertake an economic activity, which is subject to joint control. Joint control implies that neither of the contracting parties is in a position to unilaterally control the assets of the venture. Joint-venture companies are accounted for by the proportionate consolidation method whereby the attributable share of each of the assets, liabilities, income and expenses and cash flows of the joint-venture company is combined on a line-by-line basis with similar items in the group’s consolidated financial statements, from the date that joint control commences until the date joint control ceases, except when the investment is classified as held for sale, in which case it is accounted for under IFRS 5. A proportionate share of intergroup items is eliminated and unrealised profits and losses are eliminated to the extent of the group’s interest in the relevant joint-venture company, except where unrealised losses provide evidence of an impairment of the asset transferred.
Any difference between the cost of acquisition and the group’s share of the net identifiable assets, liabilities and contingent liabilities, fairly valued, is recognised and treated according to the group’s accounting policy for goodwill.
Deferred contingent purchase considerationWhere a structured business combination contains a puttable instrument on the interest of apparent minority shareholders, a financial liability for the present value of the best estimate thereof is recognised upon initial accounting for the business combination.
The liability arising is regarded as a deferred contingent purchase consideration and the unwinding of the present value of the liability is presented as an interest expense. Any other change in the liability is recognised through goodwill as an adjustment to the cost of the business combination, including the impact of changes in interest rates on liabilities measured at fair value.
If the puttable arrangement is not exercised and settled, the derecognition of the financial liability is treated as a disposal of the anticipated interest in the subsidiary in accordance with the group’s accounting policy for common control transactions.
Common control transactions – premiums and discounts arising on subsequent purchases from, or sales to minority interest in subsidiariesAny increases or decreases in ownership interest in subsidiaries without a change in control are recognised in line with the group’s goodwill policy as set out in these accounting policies.
Broad-based black economic empowerment (B-BBEE) transactionsB-BBEE transactions involving the disposal or issue of equity interests in subsidiaries are only recognised when the accounting recognition criteria have been met.
Although economic and legal ownership of such instruments may have transferred to the B-BBEE partner, the derecognition of such equity interest sold or recognition of equity instruments issued in the underlying subsidiary by the parent shareholder is postponed until the accounting recognition criteria have been satisfied.
A dilution in the earnings attributable to the parent shareholders (in the interim period) is adjusted for in the diluted earnings per share calculation by an appropriate adjustment to the earnings used in such calculation.
104 • steInhoff annual report 2009 • summary of accountIng polIcIes

gooDwillAll business combinations are accounted for by applying the purchase method. Goodwill arising on the acquisition of a subsidiary, associate company or joint-venture company represents the excess of the cost of acquisition over the group’s interest in the net fair value of the identifiable assets, liabilities and contingent liabilities of the subsidiary, associate company or joint-venture company recognised at the date of acquisition. Goodwill is initially recognised as an asset at cost and is subsequently measured at cost less any accumulated impairment losses.
Goodwill is allocated to cash-generating units (CGUs) and is tested annually for impairment or more frequently when there is an indication that the unit may be impaired. If the recoverable amount of the CGU is less than the carrying amount of the unit, the impairment loss is allocated first to reduce the carrying amount of any goodwill allocated to the unit and then to the other assets of the unit pro rata on the basis of the carrying amount of each asset in the unit. In respect of associate companies, the carrying amount of goodwill is included in the carrying amount of the investment in the associate company.
On disposal of a subsidiary, associate company or joint-venture company, the attributable amount of goodwill is included in the determination of the profit or loss on disposal.
Negative goodwill arising on acquisition is recognised directly as a capital item in profit or loss.
intangible assetsResearch and developmentExpenditure on research activities, undertaken with the prospect of gaining new scientific or technical knowledge and understanding, is recognised in profit or loss as an expense as it is incurred.
Expenditure on development activities, whereby research findings are applied to a plan or design for the production of new or substantially improved products and processes, is capitalised if the product or process can be identified, the products and processes are technically and commercially feasible, it is probable that the asset created will generate future economic benefits, the cost can be measured reliably and the group intends to and has sufficient resources to complete development.
The expenditure capitalised includes the cost of materials, direct labour and an appropriate proportion of overheads. Other development expenditure is recognised in profit or loss as an expense as incurred. Capitalised development expenditure is stated at cost less accumulated amortisation and impairment losses.
Other intangible assetsOther intangible assets that are acquired by the group are stated at cost less accumulated amortisation and impairment losses. If an intangible asset is acquired in a business combination, the cost of that intangible asset is measured at its fair value at the acquisition date.
Expenditure on internally generated goodwill and brands is recognised in profit or loss as an expense as incurred.
Subsequent expenditureSubsequent expenditure on capitalised intangible assets is capitalised only when it increases the future economic benefits embodied in the specific asset to which it relates. All other expenditure is expensed as incurred.
AmortisationAmortisation of intangible assets is recognised in profit or loss on a straight-line basis over the assets’ estimated useful lives, unless such lives are indefinite. An intangible asset is regarded as having an indefinite useful life when, based on analysis of all relevant factors, there is no foreseeable limit to the period over which the asset is expected to generate net cash inflows. Goodwill, intangible assets with indefinite useful lives and intangible assets not yet available for use are not amortised but are tested for impairment annually or more often when there is an indication that the asset may be impaired. Other intangible assets are amortised from the date they are available for use.
The amortisation methods, estimated useful lives and residual values are reassessed annually, with the effect of any changes in estimate being accounted for on a prospective basis.
property, plant anD equipmentOwned assetsProperty, plant and equipment are stated at cost to the group, less accumulated depreciation and impairment losses. The cost of self-constructed assets includes the costs of materials, direct labour, the initial estimate, where relevant, of the cost of dismantling and removing the items and restoring the site on which they are located, borrowing costs capitalised and an appropriate proportion of production overheads.
Where components of an item of property, plant and equipment have different useful lives, they are accounted for as separate items of property, plant and equipment.
The gain or loss on disposal or retirement of an item of property, plant and equipment is determined as the difference between the sale proceeds and the carrying amount of the asset and is recognised in profit or loss.
summary of accountIng polIcIes • steInhoff annual report 2009 • 105

summary of accountIng polIcIesfor the year ended 30 June 2009 (cont inued)
Leased assetsLeases that transfer substantially all the risks and rewards of ownership of the underlying asset to the group are classified as finance leases. Assets acquired in terms of finance leases are capitalised at the lower of fair value and the present value of the minimum lease payments at inception of the lease.
The capital element of future obligations under the leases is included as a liability in the balance sheet. Lease payments are allocated using the effective-interest method to determine the lease finance costs, which are charged against income over the lease period, and the capital repayment, which reduces the liability to the lessor.
Subsequent costsThe group recognises in the carrying amount of an item of property, plant and equipment the cost of replacing part of such an item when the cost is incurred, if it is probable that additional future economic benefits embodied within the item will flow to the group and the cost of such item can be measured reliably. Costs of the day-to-day servicing of property, plant and equipment are recognised in profit or loss as an expense when incurred.
DepreciationDepreciation is recognised in profit or loss on a straight-line basis at rates that will reduce the book values to estimated residual values over the estimated useful lives of the assets.
Land is not depreciated. Leasehold improvements on premises occupied under operating leases are written off over their expected useful lives or, where shorter, the term of the relevant lease.
The depreciation methods, estimated useful lives and residual values are reassessed annually.
Assets held under finance leases are depreciated over their expected useful lives on the same basis as owned assets or, where shorter, the term of the relevant lease.
investment propertyInvestment property is land and buildings which are held to earn rental income or for capital appreciation, or both.
Investment property is initially recognised at cost, including transaction costs, when it is probable that future economic benefits associated with the investment property will flow to the group and the cost of the investment property can be measured reliably. The cost of a purchased investment property comprises its purchase price and any directly attributable expenditure. The cost of a self-constructed investment property is its cost at the date when the construction development is complete.
Investment property is accounted for under the cost model and the accounting treatment after initial recognition follows that applied to property, plant and equipment.
Any gains or losses on the retirement or disposal of an investment property are recognised in profit or loss in other operating income or expenses in the year of retirement or disposal. Transfers are made to investment property when there is a change in use of the property. Transfers are made from investment property when there is a change in use or when the amount will be recovered principally through a sale transaction.
consumable biological assetsThe group’s timber plantations and livestock are classified as consumable biological assets. These assets are measured on initial recognition and at each balance sheet date at their fair value less estimated costs to sell. Costs to sell include all costs that would be necessary to sell the assets, excluding costs necessary to get the assets to the market. Gains and losses arising from changes in the fair value of the plantations less estimated costs to sell are recorded in profit or loss.
106 • steInhoff annual report 2009 • summary of accountIng polIcIes

borrowing costsBorrowing cost is recognised as an expense in the period in which it is incurred, except to the extent that it is directly attributable to the acquisition, construction or production of assets that necessarily take a substantial period to prepare for their intended use or sale. Borrowing costs directly attributable to these qualifying assets are capitalised as part of the costs of those assets.
To the extent that funds are borrowed specifically for the purpose of obtaining a qualifying asset, the amount of borrowing costs capitalised are the actual borrowing costs incurred on that borrowing during the period less any investment income on the temporary investment of those borrowings. To the extent that funds are borrowed generally and used for the purposes of obtaining a qualifying asset, the amount of borrowing costs capitalised is determined by applying a capitalisation rate to the expenditures on that asset. The capitalisation rate applied is the weighted average of the borrowing costs applicable to the borrowings of the group that are outstanding during the period, other than borrowings made specifically for the purpose of obtaining a qualifying asset.
Capitalisation of borrowing costs is suspended during extended periods in which active development is interrupted.
Capitalisation of borrowing costs ceases when the assets are substantially ready for their intended use or sale.
impairment of assetsThe carrying amounts of the group’s assets, other than assets carried at fair value, are reviewed at each balance sheet date to determine whether there is any indication of impairment.
If such indication exists, the recoverable amount of the asset is estimated in order to determine the extent of the impairment loss. For goodwill, assets that have an indefinite useful life and intangible assets that are not yet available for use, the recoverable amount is estimated annually and when there is an indication of impairment.
An impairment loss is recognised whenever the carrying amount of an asset or its CGU exceeds its recoverable amount. Impairment losses are recognised in profit or loss as capital items.
Financial assets are considered to be impaired if objective evidence indicates one or more events have had a negative effect on the estimated future cash flows of that asset. Impairment losses recognised in respect of CGUs are allocated first to reduce the carrying amount of any goodwill allocated to CGUs (group of units) and then to reduce the carrying amounts of the other assets in the unit (group of units) on a pro rata basis.
When a decline in the fair value of an available for sale financial asset has been recognised directly in equity and there is objective evidence that the asset is impaired, the cumulative loss that has been recognised directly in equity is recognised in profit or loss even though the financial asset has not been derecognised. The amount of the cumulative loss that is recognised in profit or loss is the difference between the acquisition cost and current fair value, less any impairment loss on that financial asset previously recognised in profit or loss.
Calculation of recoverable amountThe recoverable amount of the group’s loans and receivables carried at amortised cost is calculated as the present value of estimated future cash flows, discounted at the original effective interest rate (ie the effective interest rate computed at initial recognition of these financial assets).
The recoverable amount of non-financial assets is the greater of an asset’s fair value less costs to sell and value in use. In assessing value in use, the estimated future cash flows are discounted to their present value using a pre-tax discount rate that reflects current market assessments of the time value of money and the risks specific to the asset. For an asset that does not generate cash inflows largely independent of those from other assets, the recoverable amount is determined for the CGU to which the asset belongs.
Reversal of impairment lossesAn impairment loss in respect of loans and receivables carried at amortised cost is reversed if the subsequent increase in recoverable amount can be related objectively to an event occurring after the impairment loss was recognised.
An impairment loss in respect of an investment in an equity instrument classified as available for sale is not reversed through profit or loss but recognised directly in equity. If the fair value of a debt instrument classified as available for sale increases and the increase can be objectively related to an event occurring after the impairment loss was recognised in profit or loss, the impairment loss shall be reversed, with the amount of the reversal recognised in profit or loss.
An impairment loss in respect of goodwill is not reversed.
In respect of other assets, an impairment loss is only reversed if there is an indication that the impairment loss may no longer exist and there has been a change in the estimates used to determine the recoverable amount, however, not to an amount higher than the carrying amount that would have been determined (net of depreciation or amortisation) had no impairment loss been recognised in previous years.
summary of accountIng polIcIes • steInhoff annual report 2009 • 107

summary of accountIng polIcIesfor the year ended 30 June 2009 (cont inued)
taxationCurrent taxationIncome taxation on the profit or loss for the year comprises current and deferred taxation. Income taxation is recognised in profit or loss except to the extent that it relates to items recognised directly in equity, in which case it is recognised directly in equity. Taxable profit differs from profit as reported in the income statement because it excludes items of income or expense that are taxable or deductible in other years and it further excludes items that are never taxable or deductible.
Current taxation is the expected taxation payable on the taxable income for the year, using taxation rates enacted or substantially enacted at the balance sheet date, and any adjustment to taxation payable in respect of previous years.
Deferred taxationDeferred taxation is provided for using the balance sheet liability method in respect of temporary differences arising from differences between the carrying amount of assets and liabilities for financial reporting purposes and the amounts used in the computation of taxable income. The following temporary differences are not provided for: goodwill not deductible for taxation purposes, the initial recognition of assets or liabilities that affect neither accounting nor taxable profit, and differences relating to investments in subsidiaries to the extent that they will not reverse in the foreseeable future. The amount of deferred taxation provided is based on the expected manner of realisation or settlement of the carrying amount of assets and liabilities, using taxation rates enacted or substantially enacted at the balance sheet date.
Deferred taxation liabilities are recognised for taxable temporary differences arising on investments in subsidiaries and associate companies and interest in joint-venture companies, except where the group is able to control the reversal of the temporary differences and it is probable that the temporary differences will not reverse in the foreseeable future.
Deferred taxation assets and liabilities are offset when there is a legally enforceable right to set off current taxation assets against current taxation liabilities and when they relate to income taxes levied by the same taxation authority and the group intends to settle its current taxation assets and liabilities on a net basis.
Deferred taxation assets and liabilities are measured at the taxation rates that are expected to apply in the period in which the liability is settled or the asset realised, based on the taxation rates (and taxation laws) that have been enacted or substantively enacted by the balance sheet date. The measurement of deferred taxation liabilities and assets reflects the taxation consequences that would follow from the manner in which the group expects, at the reporting date, to recover or settle the carrying amount of its assets and liabilities.
A deferred taxation asset is recognised only to the extent that it is probable that future taxable profits will be available against which the asset will be utilised. Deferred taxation assets are reduced to the extent that it is no longer probable that the related taxation benefit will be realised.
Secondary taxation on companies (STC) and additional income taxes on distribution of dividendsSTC and other additional taxes arising from the distribution of dividends are recognised in the year dividends are declared. A deferred taxation asset is recognised on unutilised STC credits when it is probable that such unused STC credits will be utilised in the future.
inventoriesInventories are stated at the lower of cost and net realisable value. Net realisable value is the estimated selling price in the ordinary course of business, less the estimated costs of completion and selling and distribution expenses.
The cost of harvested timber is its fair value less estimated costs to sell at the date of harvest, determined in accordance with the accounting policy for consumable biological assets. Any change in fair value at the date of harvest is recognised in profit or loss.
108 • steInhoff annual report 2009 • summary of accountIng polIcIes

The cost of other inventories is based on the first-in first-out principle and includes expenditure incurred in acquiring the inventories and bringing them to their existing location and condition. In the case of manufactured inventories and work-in-progress, cost includes an appropriate share of overheads based on normal operating capacity.
Development properties comprise land valued at cost and development expenditure attributable to unsold properties.
Where necessary, the carrying amounts of inventory is adjusted for obsolete, slow-moving and defective inventories.
cash anD cash equivalentsCash and cash equivalents are defined as cash and bank and short-term, highly liquid investments, that are readily convertible to known amounts of cash and which are subject to an insignificant risk of changes in value. Bank overdrafts are only included where the group has a legal right of set-off due to cash management.
non-current assets helD for sale anD DiscontinueD operationsNon-current assets and disposal groups are classified as held for sale if their carrying amount will be recovered principally through a sale transaction rather than through continuing use. This condition is regarded as met only when the sale is highly probable and the asset (or disposal group) is available for immediate sale in its present condition. Management must be committed to the sale, which should be expected to qualify for recognition as a completed sale within one year from the date of classification. These assets may be a component of an entity, a disposal group or an individual non-current asset. Upon initial classification as held for sale, non-current assets and disposal groups are recognised at the lower of carrying amount and fair value less costs to sell.
A discontinued operation is a component of the group’s business that represents a separate major line of business or geographical area of operation or a subsidiary acquired exclusively with a view to resale. Classification as a discontinued operation occurs upon disposal or when the operation meets the criteria to be classified as held for sale. A disposal group that is to be abandoned may also qualify as a discontinued operation, but not as assets held for sale.
Discontinued operations are separately recognised in the financial statements once management has made a commitment to discontinue the operation without a realistic possibility of withdrawal which should be expected to qualify for recognition as a completed sale within one year from date of classification.
share capitalPreference sharesPreference shares are classified as equity if they are non-redeemable and any dividends are discretionary, or are redeemable but only at the group’s option. Dividends on preference share capital classified as equity are recognised as distributions within equity.
In order to calculate earnings attributable to ordinary shareholders, the amount of preference dividends (taking into account STC) for cumulative preference shares required for that period, whether or not declared, is deducted from profit attributable to equity holders in determining earnings per ordinary share.
The amount of preference dividends for the period used to calculate earnings per ordinary share does not include the amount of any preference dividends for cumulative preference shares paid or declared during the current period in respect of previous periods.
Preference share capital is classified as a liability if it is redeemable on a specific date or at the option of the shareholders or if dividend payments are not discretionary. Dividends thereon are recognised in accordance with the dividend policy below.
Treasury sharesWhen shares recognised as equity are purchased by group companies in their holding company and by the employee share trusts, the amount of the consideration paid, including directly attributable costs, is recognised as a change in equity. When treasury shares are sold or reissued subsequently, the amount received is recognised as an increase in equity, and the resulting surplus or deficit on the transaction is transferred to/from retained earnings.
Repurchase of issued sharesRepurchased shares are classified as treasury shares and presented as a deduction from total equity.
DividendsDividends on redeemable preference shares are recognised as a liability and recognised as an interest expense using the effective-interest method. Other dividends are recognised as a liability in the period in which they are declared.
Dividends received on treasury shares are eliminated on consolidation.
summary of accountIng polIcIes • steInhoff annual report 2009 • 109

summary of accountIng polIcIesfor the year ended 30 June 2009 (cont inued)
share-baseD payment transactionsEquity-settledThe fair value of the deferred delivery shares and the share rights granted to employees is recognised as an employee expense with a corresponding increase in equity. The fair value is measured at grant date and is expensed over the period during which the employees are required to provide services in order to become unconditionally entitled to the equity instruments. The fair value of the instruments granted is measured using generally accepted valuation techniques, taking into account the terms and conditions upon which the instruments are granted. The amount recognised as an expense is adjusted to reflect the actual number of deferred delivery shares and the share rights that vest, except where forfeiture is only due to share prices not achieving the threshold for vesting.
Cash-settledThe fair value of the amount payable to employees in respect of share appreciation rights is recognised as an expense with a corresponding increase in liabilities. The fair value is initially measured at grant date and expensed over the period during which the employees are required to provide services in order to become unconditionally entitled to payment. The liability is remeasured at each balance sheet date and at settlement date to fair value. The fair value of the instruments granted is measured using generally accepted valuation techniques, taking into account the terms and conditions upon which the instruments are granted.
Broad-based black economic empowerment transactionsWhere goods or services are considered to have been received from black economic empowerment partners as consideration for equity instruments of the group, these transactions are accounted for as share-based payment transactions, even when the entity cannot specifically identify the goods or services received.
Group share-based payment transactionsTransactions in which a parent grants rights to its equity instruments directly to the employees of its subsidiaries are classified as equity settled in the financial statements of the subsidiary, provided the share-based payment is classified as equity settled in the consolidated financial statements of the parent.
The subsidiary recognises the services acquired with the share-based payment as an expense and recognises a corresponding increase in equity representing a capital contribution from the parent for those services acquired. The parent recognises in equity the equity-settled share-based payment and recognises a corresponding increase in the investment in subsidiary.
A recharge arrangement exists whereby the subsidiary is required to fund the difference between the exercise price on the share option and the market price of the share at the time of exercising the option. The recharge arrangement is accounted for separately from the underlying equity-settled share-based payment as follows upon initial recognition:
• Thesubsidiaryrecognisesarechargeliabilityatfairvalue,usingcash-settledshare-basedpayment principles, and a corresponding adjustment against equity for the capital contribution recognised in respect of the share-based payment.
• Theparentrecognisesacorrespondingrechargeassetatfairvalueandacorrespondingadjustment to the carrying amount of the investment in the subsidiary.
Subsequent to initial recognition, the recharge arrangement is remeasured at fair value at each subsequent reporting date until settlement date to the extent vested. Where the recharge amount recognised is greater than the initial capital contribution recognised by the subsidiary in respect of the share-based payment, the excess is recognised as a net capital distribution to the parent. The amount of the recharge in excess of the capital contribution recognised as an increase in the investment in subsidiary is deferred and recognised as dividend income by the parent when settled by the subsidiary.
110 • steInhoff annual report 2009 • summary of accountIng polIcIes

convertible bonDsBonds which are convertible to share capital, where the number of shares to be issued does not vary with changes in their fair value, are accounted for as compound financial instruments. Transaction costs that relate to the issue of a compound financial instrument are allocated to the liability and equity components in proportion to the allocation of the proceeds. The equity component of the convertible bonds is calculated as the excess of the issue proceeds over the present value of the future interest and principal payments, discounted at the market rate of interest applicable to similar liabilities that do not have a conversion option. The interest expense recognised in profit or loss is calculated using the effective-interest method.
employee benefitsShort-term employee benefitsThe costs of all short-term employee benefits are recognised during the period in which the employee renders the related service. The provisions for employee entitlements to salaries, performance bonuses and annual leave represent the amounts which the group has a present obligation to pay as a result of the employee’s services provided. The provisions have been calculated at undiscounted amounts based on current salary levels.
Defined contribution plansObligations for contributions to defined contribution pension plans and provident funds are recognised as an expense in profit or loss as incurred.
Obligations to state-managed pension schemes are dealt with as defined contribution plans where the group’s obligations under the schemes are equivalent to those arising in a defined contribution pension plan.
Defined benefit plansThe group’s net obligation in respect of defined benefit pension plans is calculated separately for each plan by estimating the amount of future benefits that employees have earned in return for their service in the current and prior periods; those benefits are discounted to determine their present values, and the fair values of any plan assets are deducted. The calculations are performed by qualified actuaries using the projected unit credit method with actuarial updates being carried out at each balance sheet date.
When the benefits of a plan are improved, the portion of the increased benefit relating to past service by employees is recognised as an expense in profit or loss on a straight-line basis over the average period until the benefits become vested. To the extent that benefits vest immediately, the expense is recognised immediately in profit or loss.
Actuarial gains and losses are recognised in equity in the period in which they occur.
Where the calculation results in a benefit to the group, the recognised asset is limited to the net total of any unrecognised actuarial losses and past-service costs and the present value of any future refunds from the plan or reductions in future contributions to the plan.
Long-term service benefitsThe group’s net obligation in respect of long-term service benefits, other than pension plans, is the amount of future benefits that employees have earned in return for their service in the current and prior periods. The obligation is calculated using the projected unit credit method and is discounted to its present value and the fair value of any related assets is deducted.
government grantsGovernment grants are assistance by government in the form of transfers of resources in return for compliance with conditions related to operating activities. Government assistance is action by government designed to provide an economic benefit specific to an entity or range of entities qualifying under certain criteria. Government includes government agencies and similar bodies whether local, national or international.
The group does not recognise government grants until there is reasonable assurance that the group will comply with the conditions attaching to them and the grants will be received. When the conditions attaching to government grants have been complied with and they will be received, they are recognised in profit or loss on a systematic basis over the period necessary to match it with the related costs which it is intended to compensate.
For government grants, other than those related to assets, a deferred income account is set up at initial recognition. This deferred income is recognised in profit or loss on a systematic basis over the period necessary to match it with the related costs which it is intended to compensate. Government grants related to assets, including non-monetary grants at fair value, are presented in the balance sheet by deducting the grant in arriving at the carrying amount of the assets. The grant is recognised as income over the life of a depreciable asset by way of a reduced depreciation charge.
summary of accountIng polIcIes • steInhoff annual report 2009 • 111

summary of accountIng polIcIesfor the year ended 30 June 2009 (cont inued)
provisionsProvisions are recognised when the group has a present constructive or legal obligation as a result of a past event, and it is probable that it will result in an outflow of economic benefits that can be reasonably estimated.
If the effect is material, provisions are determined by discounting the expected future cash flows that reflect current market assessments of the time value of money and, where appropriate, the risks specific to the liability.
WarrantiesA provision for warranties is recognised when the underlying products or services are sold. The provision is based on historical warranty data and a weighting of all possible outcomes against their associated probabilities.
RestructuringA provision for restructuring is recognised when the group has approved a detailed and formal restructuring plan, and the restructuring either has commenced or has been announced publicly. Future operating costs are not provided for.
Onerous contractsA provision for onerous contracts is recognised when the expected benefits to be derived by the group from a contract are lower than the unavoidable cost of meeting the obligation under the contract.
foreign currencyForeign currency transactionsTransactions in currencies other than the functional currency of entities are initially recorded at the rates of exchange ruling on the dates of the transactions. Monetary assets and liabilities denominated in such currencies are translated at the rates ruling on the balance sheet date. Foreign exchange differences arising on translation are recognised in profit or loss. Non-monetary assets and liabilities that are measured in terms of historical cost in a foreign currency are translated using the exchange rate at the date of the transaction. Non-monetary assets and liabilities denominated in foreign currencies that are stated at fair value are translated at rates ruling at the dates the fair value was determined.
Financial statements of foreign operationsThe assets and liabilities of all foreign operations, including goodwill and fair value adjustments arising on consolidation, are translated at rates of exchange ruling at the balance sheet date. The revenues and expenses of foreign operations are translated at rates approximating the foreign exchange rates ruling at the date of the transactions.
Foreign exchange differences arising on translation are recognised directly in a separate component of equity, the foreign currency translation reserve (FCTR). The FCTR applicable to a foreign operation is released to profit or loss as a capital item upon disposal of that foreign operation.
Net investment in foreign operationsExchange differences arising from the translation of the net investment in foreign operations, and of related hedges, are taken directly to the FCTR. They are released to profit or loss as a capital item upon disposal of that foreign operation.
Goodwill and fair value adjustments arising on the acquisition of foreign operations are treated as assets and liabilities of the foreign operation and translated at the rates of exchange ruling at the balance sheet date.
112 • steInhoff annual report 2009 • summary of accountIng polIcIes

financial instrumentsFinancial assets and financial liabilities are recognised on the group’s balance sheet when the group becomes a party to the contractual provisions of the instrument.
Effective-interest methodThe effective-interest method is a method of calculating the amortised cost of a financial instrument and of allocating interest income over the relevant period. The effective interest rate is the rate that exactly discounts estimated future cash receipts (including all fees on points paid or received that form an integral part of the effective interest rate, transaction costs and other premiums or discounts) through the expected life of a financial instrument, or, where appropriate, a shorter period.
Financial assetsFinancial assets are classified into the following specified categories: financial assets ‘at fair value through profit or loss’ (FVTPL), ‘available for sale’ financial assets and ‘loans and receivables’. The classification depends on the nature and purpose of the financial assets and is determined at the time of initial recognition.
Financial assets at FVTPLFinancial assets are classified as at FVTPL where the financial asset is either held for trading or it is designated as at FVTPL.
A financial asset is held for trading if:
• Ithasbeenacquiredprincipallyforthepurposeofsellinginthenearfuture.• Itispartofanidentifiedportfoliooffinancialinstrumentsthatthegroupmanages
together and has a recent actual pattern of short-term profit-taking.• Itisaderivativethatisnotdesignatedandeffectiveasahedginginstrument.
A financial asset other than a financial asset held for trading may be designated as at FVTPL upon initial recognition if:
• Suchdesignationeliminatesorsignificantlyreducesameasurementorrecognitioninconsistency that would otherwise arise.
• Thefinancialassetformspartofagroupoffinancialassetsorfinancialliabilitiesor both, which is managed and its performance is evaluated on a fair value basis, in accordance with the group’s documented risk management or investment strategy, and information about the grouping is provided internally on that basis.
• Itformspartofacontractcontainingoneormoreembeddedderivatives,and IAS 39 – Financial Instruments: Recognition and Measurement (IAS 39) permits the entire combined contract (asset or liability) to be designated as at FVTPL.
Financial assets at FVTPL are stated at fair value, with any resultant gain or loss recognised in profit or loss. The net gain or loss recognised in profit or loss incorporates any dividend or interest earned on the financial asset, fair value adjustments and foreign exchange gains or losses. Fair value is determined in the manner described in note 19.
Available for sale financial assetsListed and unlisted shares and listed redeemable notes held by the group that are traded in an active market are classified as being available for sale and are stated at fair value. Fair value is determined in the manner described in note 19. Gains and losses arising from changes in fair value are recognised directly in equity in the investment revaluation reserve with the exception of impairment losses, interest calculated using the effective-interest method and foreign exchange gains and losses on monetary assets, which are recognised directly in profit or loss. Where the investment is disposed of or is determined to be impaired, the cumulative gain or loss previously recognised in the investments revaluation reserve is included in profit or loss for the period.
Dividends on available for sale equity instruments are recognise in profit or loss when the group’s right to receive the dividends is established.
The fair value of available for sale monetary assets denominated in a foreign currency is determined in that foreign currency and translated at the spot rate at the balance sheet date. The change in fair value attributable to translation differences that result from a change in amortised cost of the asset is recognised in profit or loss, and other changes are recognised in equity.
The net gain or loss recognised in profit or loss incorporates any dividend or interest earned on the financial asset, impairment losses, gains or losses on disposal of the investment and foreign exchange gains or losses. The net gain or loss recognised in equity incorporates all gains or losses resulting from changes in fair value.
Loans and receivablesTrade receivables, loans and other receivables that have fixed or determinable payments that are not quoted in an active market are classified as loans and receivables. Loans and receivables are measured at amortised cost using the effective-interest method, less any impairment. Interest income is recognised by applying the effective interest rate, except for short-term receivables when the recognition of interest would be immaterial.
The net gain or loss recognised in profit or loss incorporates any dividends and interest earned on the financial assets, profit-sharing, impairments and foreign exchange gains or losses.
summary of accountIng polIcIes • steInhoff annual report 2009 • 113

summary of accountIng polIcIesfor the year ended 30 June 2009 (cont inued)
Impairment of financial assetsFinancial assets, other than those at FVTPL, are assessed for indicators of impairment at each balance sheet date. Financial assets are impaired where there is objective evidence that, as a result of one or more events that occurred after the initial recognition of the financial asset, the estimated future cash flows of the investment have been impacted.
For unlisted shares classified as available for sale, a significant or prolonged decline in fair value of the security below its cost is considered to be objective evidence of impairment.
For all other financial assets, including redeemable notes classified as available for sale and finance lease receivables, objective evidence of impairment could include:
• Significantfinancialdifficultyoftheissuerorcounterparty.• Defaultordelinquencyininterestorprincipalpayments.• Itbecomingprobablethattheborrowerwillenterbankruptcyorfinancialreorganisation.
For certain categories of financial assets, such as trade receivables, assets that are assessed not to be impaired individually are subsequently assessed for impairment on a collective basis. Objective evidence of impairment for a portfolio of receivables could include the group’s past experience of collecting payments, an increase in the number of delayed payments in the portfolio past the average credit period, as well as observable changes in national or local economic conditions that correlate with default on receivables.
For financial assets carried at amortised cost, the amount of the impairment is the difference between the asset’s carrying amount and the present value of estimated future cash flows, discounted at the financial asset’s original effective interest rate.
The carrying amount of the financial asset is reduced by the impairment loss directly for all financial assets, with the exception of trade and other receivables, where the carrying amount is reduced through the use of an allowance account. When trade and other receivables are considered uncollectible, they are written off against the allowance account. Changes in the carrying amount of the allowance account are recognised in profit or loss.
With the exception of available for sale equity instruments, if, in a subsequent period the amount of the impairment loss decreases and the decrease can be related objectively to an event occurring after the impairment was recognised, the previously recognised impairment loss is reversed through profit or loss to the extent that the carrying amount of the investment at the date the impairment is reversed does not exceed what the amortised cost would have been had the impairment not been recognised.
In respect of available for sale equity securities, impairment losses previously recognised through profit or loss are not reversed through profit or loss. Any increase in fair value subsequent to an impairment loss is recognised directly in equity.
Financial assets that would otherwise have been impaired or past due but have been renegotiated are accounted for by rolling over the old financial asset into the new financial asset with no resultant gain or loss from the renegotiation of the financial instrument.
Derecognition of financial assetsThe group derecognises a financial asset only when the contractual rights to the cash flows from the asset expire or it transfers the financial asset and substantially all the risks and rewards of ownership of the asset to another entity. If the group neither transfers nor retains substantially all the risks and rewards of ownership and continues to control the transferred asset, the group recognises its retained interest in the asset and an associated liability for amounts it may have to pay. If the group retains substantially all the risks and rewards of ownership of a transferred financial asset, the group continues to recognise the financial asset and also recognises a collateralised borrowing for the proceeds received.
114 • steInhoff annual report 2009 • summary of accountIng polIcIes

Financial liabilities and equity instruments issued by the groupClassification of debt or equityDebt and equity instruments are classified as either financial liabilities or as equity in accordance with the substance of the contractual arrangement.
Equity instrumentsAn equity instrument is any contract that evidences a residual interest in the assets of an entity after deducting all of its liabilities. Equity instruments issued by the group are recorded at proceeds received, net of direct issue costs.
Compound instrumentsThe component parts of compound instruments issued by the group are classified separately as financial liabilities and equity in accordance with the substance of the contractual arrangement. At the date of issue, the fair value of the liability component is estimated using the prevailing market interest rate for a similar non-convertible instrument. This amount is recorded as a liability on an amortised cost basis using the effective-interest method until extinguished upon conversion or at the instrument’s maturity date. The equity component is determined by deducting the amount of the liability component from the fair value of the compound instrument as a whole. This is recognised and included in equity, net of income taxation effects, and is not subsequently remeasured.
Financial guarantee contract liabilitiesFinancial guarantee contract liabilities are measured initially at their fair values and are subsequently measured at the higher of:
• Theamountoftheobligationundercontract,asdeterminedinaccordancewith IAS 37 – Provisions, Contingent Liabilities and Contingent Assets.
• Theamountinitiallyrecognisedless,whereappropriate,cumulativeamortisationrecognised in accordance with the revenue recognition policies.
Financial liabilitiesFinancial liabilities are classified as either financial liabilities ‘at FVTPL’ or ‘other financial liabilities’.
Financial liabilities at FVTPLFinancial liabilities are classified as at FVTPL where the financial liability is either held for trading or is designated as at FVTPL.
A financial liability is classified as held for trading if:
• Ithasbeenincurredprincipallyforthepurposeofrepurchasinginthenearfuture.
• Itispartofanidentifiedportfoliooffinancialinstrumentsthatthegroupmanagestogether and has a recent actual pattern of short-term profit-taking.
• Itisaderivativethatisnotdesignatedandeffectiveasahedginginstrument.
A financial liability other than a financial liability held for trading may be designated as at FVTPL upon initial recognition if:
• Suchdesignationeliminatesorsignificantlyreducesameasurementorrecognitioninconsistency that would otherwise arise.
• Thefinancialliabilityformspartofagroupoffinancialassetsorfinancialliabilitiesor both, which is managed and its performance is evaluated on a fair value basis, in accordance with the group’s documented risk management or investment strategy and information about the grouping is provided internally on that basis.
• Itformspartofacontractcontainingoneormoreembeddedderivatives,andIAS39permits the entire combined contract (asset or liability) to be designated as at FVTPL.
Financial liabilities at FVTPL are stated at fair value, with any resultant gain or loss recognised in profit or loss. The net gain or loss recognised in profit or loss incorporates any interest accrued or paid on the financial liability, fair value adjustments and foreign exchange gains and losses. Fair value is determined in the manner described in note 19.
Other financial liabilitiesOther financial liabilities, including borrowings, are initially measured at fair value, net of transaction costs.
Other financial liabilities are subsequently measured at amortised cost using the effective-interest method, with interest expense recognised on an effective yield basis.
The net gain or loss recognised in profit or loss incorporates any interest accrued or paid on the financial liability and foreign exchange gains or losses.
Derecognition of financial liabilitiesThe group derecognises financial liabilities when, and only when, the group’s obligations are discharged, cancelled or they expire.
Derivative financial instrumentsThe group enters into a variety of derivative financial instruments to manage its exposure to interest rate and foreign exchange rate risk, including foreign exchange forward contracts, interest rate swaps and cross-currency swaps. Further detail of derivative financial instruments are disclosed in note 19.
summary of accountIng polIcIes • steInhoff annual report 2009 • 115

summary of accountIng polIcIesfor the year ended 30 June 2009 (cont inued)
Derivatives are initially recognised at fair value at the date a derivative contract is entered into and are subsequently remeasured to their fair value at each balance sheet date. The resulting gain or loss is recognised in profit or loss immediately unless the derivative is designated and effective as a hedging instrument, in which event the timing of the recognition in profit or loss depends on the nature of the hedge relationship. The group designates certain derivatives as either hedges of the fair value of recognised assets or liabilities of firm commitments (fair value hedges), hedges of highly probable forecast transactions or hedges of foreign currency risk of firm commitments (cash flow hedges), or hedges of net investments in foreign operations.
A derivative is presented as a non-current asset or a non-current liability if the remaining maturity of the instrument is more than 12 months and it is not expected to be realised or settled within 12 months. Other derivatives are presented as current assets or current liabilities.
Embedded derivativesDerivatives embedded in other financial instruments or other host contracts are treated as separate derivatives when their risk and characteristics are not closely related to those of the host contracts and the host contracts are not measured at fair value with changes in fair value recognised in profit or loss.
Hedge accountingThe group designates certain hedging instruments, which include derivatives, embedded derivatives and non-derivatives in respect of foreign currency risk, as either fair value hedges, cash flow hedges, or hedges of net investments in foreign operations. Hedges in foreign exchange risk on firm commitments are accounted for as cash flow hedges.
At the inception of the hedge relationship, the entity documents the relationship between the hedging instrument and the hedged item, along with its risk management objectives and its strategy for undertaking various hedge transactions. Furthermore, at the inception of the hedge and on an ongoing basis, the group documents whether the hedging instrument that is used in a hedging relationship is highly effective in offsetting changes in fair values of cash flows of the hedged item.
Note 19 sets out details of the fair value of the derivative instruments used for hedging purposes. Movements in the hedging reserve in equity are also detailed in note 25.
Fair value hedgesChanges in fair value of derivatives that are designated and qualify as fair value hedges are recorded in profit or loss immediately, together with any changes in fair value of the hedged item that are attributable to the hedged risk. The change in the fair value of the hedging instrument and the change in the hedged item attributable to the hedged risk are recognised in the line of the income statement relating to the hedged item.
Hedge accounting is discontinued when the group revokes the hedging relationship, the hedging instrument expires or is sold, terminated, or exercised, or no longer qualifies for hedge accounting. The adjustment to the carrying amount of the hedged item arising from the hedged risk is amortised to profit or loss from that date.
Cash flow hedgesThe effective portion of changes in the fair value of derivatives that are designated and qualify as cash flow hedges are deferred in equity. The gain or loss relating to the ineffective portion is recognised immediately in profit or loss.
Amounts deferred in equity are recycled to profit or loss in the periods when the hedged item is recognised in profit or loss, and it is included in the same line of the income statement as the recognised hedged item. However, when the forecast transaction that is being hedged results in the recognition of a non-financial asset or a non-financial liability, the gains or losses previously deferred in equity are transferred from equity and included in the initial measurement of the cost of the asset or liability.
Hedge accounting is discontinued when the group revokes the hedging relationship, the hedging instrument expires or is sold, terminated, or exercised, or no longer qualifies for hedge accounting. Any cumulative gain or loss deferred in equity at the time remains in equity and is recognised when the forecast transaction is ultimately recognised in profit or loss.
116 • steInhoff annual report 2009 • summary of accountIng polIcIes

When a forecast transaction is no longer expected to occur, the cumulative gain or loss that was deferred in equity is recognised immediately in profit or loss.
Hedges of net investments in foreign operationsHedges of net investments in foreign operations are accounted for similarly to cash flow hedges. Any gain or loss on the hedging instrument relating to the effective portion of the hedge is recognised in equity in the FCTR. The gain or loss relating to the ineffective portion is recognised immediately in profit or loss.
Gains and losses deferred in the FCTR are recognised in profit or loss on disposal of the foreign operation.
insurance contractsClassification of contractsContracts under which the group accepts significant insurance risk from the policyholders, by agreeing to compensate the policyholder or other beneficiary if a specified uncertain future event affects the policyholder or other beneficiary are classified as insurance contracts.
recognition anD measurement of contractsPremiumsGeneral business written premiums comprise the premiums on contracts entered into during the year, irrespective of whether they relate in whole or in part to a later accounting period. Premiums are disclosed gross of commissions payable to intermediaries and exclude value added tax. Premiums written include adjustments to premiums written in prior accounting periods. Premiums are earned from the date of the attachment of risk, over the indemnity period, based on the pattern of risks underwritten. Outward reinsurance premiums are recognised as an expense in accordance with the pattern of reinsurance service received.
Unearned premium provisionThe provision for unearned premiums comprises the proportion of gross premiums written which is estimated to be earned in the following or subsequent financial years, computed separately for each insurance contract using the daily pro rata method, adjusted if necessary to reflect any variation in the incidence of risk during the period covered by the contract.
ClaimsClaims incurred in respect of general business consist of claims and claims handling expenses paid during the financial year together with the movement in the provision for outstanding claims.
Claims outstanding comprise provisions for the group’s estimate of the ultimate cost of settling all claims incurred but unpaid at the balance sheet date whether reported or not, and related internal and external claims handling expenses and appropriate prudential margin. Claims outstanding are assessed by reviewing individual claims and making allowance for claims incurred but not yet reported. Anticipated reinsurance recoveries are disclosed separately as assets. Reinsurance and other recoveries are assessed in a manner similar to the assessment of claims outstanding.
The directors consider whether or not the gross provisions for claims and the related reinsurance recoveries are fairly stated on the basis of the information currently available to them. The methods used, and the estimates made, are reviewed regularly.
Deferred acquisition costsThe cost of acquiring new and renewal insurance business that is primarily related to the production of that business, which represents commission and other related expenses, are deferred over the period in which the related premiums are earned.
ReinsuranceAmounts recoverable under reinsurance contracts are assessed for impairment at each balance sheet date. Such assets are deemed impaired if there is objective evidence, as a result of an event that occurred after its initial recognition, that the group may not recover all amounts due and that the event has a reliably measurable impact on the amounts that the group will receive from the reinsurer.
The group ceded reinsurance in the normal course of business for the purpose of limiting its net loss potential through the diversification of its risks. Reinsurance arrangements do not relieve the group from its direct obligation to its policyholders. Premiums ceded and benefits reimbursed are presented in the income statement and balance sheet on a gross basis.
Provisional reinsurance commission are recognised upfront where the group is not required to render further services. The provisional profit commission is recognised at the amount received, unless the group is aware of actual experience that will result in the final commission amount being different from the expected amount.
Liabilities and related assets under liability adequacy testInsurance contracts are tested for adequacy by discounting current estimates of all future contractual cash flows and comparing this amount to the carrying value of the liability net of deferred acquisition costs and any related assets. Where a shortfall is identified, an additional provision is made and the group recognised the deficiency in income for the year.
summary of accountIng polIcIes • steInhoff annual report 2009 • 117

summary of accountIng polIcIesfor the year ended 30 June 2009 (cont inued)
revenue recognitionRevenue is measured at the fair value of the consideration received or receivable. Revenue is reduced for estimated customer returns, rebates and other similar allowances.
Goods sold and services renderedRevenue from the sale of goods is recognised when the significant risks and rewards of ownership have been transferred to the buyer. Revenue from services rendered is recognised in profit or loss in proportion to the stage of completion of the transaction at balance sheet date. The stage of completion is assessed by reference to surveys of the work performed.
Revenue is not recognised if there are significant uncertainties regarding recovery of the consideration due, associated costs or the possible return of goods as well as continuing management involvement with goods to a degree usually associated with ownership. Where the group acts as agent and is remunerated on a commission basis, only the commission income, and not the value of the business transaction, is included in revenue.
Insurance premiumsInsurance premiums are stated before deducting reinsurances and commissions, and are accounted for when they become due.
InterestInterest is recognised on the time proportion basis, taking account of the principal debt outstanding and the effective rate over the period to maturity.
Rental incomeRental income is recognised in profit or loss on a straight-line basis over the term of the lease.
Dividend incomeDividend income from investments is recognised when the right to receive payment has been established.
Royalty incomeRoyalty income is recognised on an accrual basis in accordance with the substance of the relevant agreement.
operating leasesPayments and receipts under operating leases are recognised in profit or loss on a straight-line basis over the term of the lease. Lease incentives received or granted are recognised in profit or loss as an integral part of the total lease expense or revenue.
segmental reportingA segment is a distinguishable component of the group that is engaged in providing products or services which are subject to risks and rewards that are different from those of other segments. The basis of segmental reporting is representative of the internal structure used for management reporting as well as the structure in which the chief operating decision-makers review the information.
The basis of segmental allocation is determined as follows:
• Revenuethatcanbedirectlyattributedtoasegmentandtherelevantportionoftheprofit that can be allocated on a reasonable basis to a segment, whether from sales to external customers or from transactions with other segments of the group.
• Operatingprofitthatcanbedirectlyattributedtoasegmentandarelevantportionofthe operating profit that can be allocated on a reasonable basis to a segment, including profit relating to external customers and expenses relating to transactions with other segments of the group.
• Totalassetsarethoseassetsthatareemployedbyasegmentinitsoperatingactivitiesand that are either directly attributable to the segment or can be allocated to the segment on a reasonable basis. Total assets exclude investments in associate companies, investments in preference shares, certain interest-bearing loans receivable, and cash and cash equivalents.
118 • steInhoff annual report 2009 • summary of accountIng polIcIes

2009 2008 r’000 r’000
1. ReVeNUe
Retail activities 31 861 813 27 309 464
– Household goods and building supplies 21 659 722 14 889 601
– Automotive* 10 202 091 12 419 863
Manufacturing and sourcing of household goods and related raw materials 23 790 810 19 267 783
Logistics services 5 775 860 4 984 554
Corporate services 919 529 925 745
– Brand management 414 204 361 619
– Investment participation 254 169 182 004
– Central treasury and other activities 251 156 382 122
62 348 012 52 487 546
Intersegment eliminations (11 479 371) (7 441 661)
50 868 641 45 045 885
* Includes revenue from insurance contracts which has been disclosed as premiums in note 44.
notes to the annual fInancIal statements
for the year ended 30 June 2009
notes to the annual fInancIal statements • steInhoff annual report 2009 • 119

2009 2008 r’000 r’000
2. CAPITAL ITeMS
Capital items reflect and affect the resources committed in producing operating/trading performance and are not the performance itself. These items deal with the platform/capital base of the entity.
(Income)/expenses of a capital nature are included in the ‘capital items’ line in the income statement. These (income)/expense items are:
2.1 Foreign currency translation reserve released on disposal of subsidiary (4 776) –
2.2 Goodwill adjustment on recognition of deferred taxation asset – 15 581
2.3 Gain on sale of investments (657) –
2.4 Impairment 11 414 166 314
Associate companies – 154 764
Goodwill – 800
Joint-venture companies – 349
Property, plant and equipment 11 667 9 490
Other (253) 911
Impairment losses on property, plant and equipment primarily arose upon the closure of certain retail operations and plant rendered obsolete following changes in technology and specification of manufacturing processes. These events caused the group to assess the recoverable amounts of items affected at their estimated net realisable values (note 11).
2.5 Loss on disposal of intangible asset 4 –
2.6 Negative goodwill released on business combination – (8 723)
2.7 (Profit)/loss on disposal of property, plant and equipment (42 756) 14 416
2.8 Profit on disposal of investment property (18 612) (2 348)
2.9 Loss on disposal and scrapping of vehicle rental fleet 6 088 7 650
(49 295) 192 890
notes to the annual fInancIal statementsfor the year ended 30 June 2009 (cont inued)
120 • steInhoff annual report 2009 • notes to the annual fInancIal statements

2009 2008 r’000 r’000
3. oPeRATING PRoFIT
Operating profit is stated after taking account of the following items:
3.1 Amortisation charges
Patents and trademarks 76 65
Software 41 563 29 471
Customer relationships 149 –
Licence agreements 865 5 812
Contracts 936 741
Other 2 518 1 779
46 107 37 868
3.2 Auditors’ remuneration
Audit fees 62 897 52 573
Expenses 541 304
Fees for other services 10 117 10 502
(Over)/underprovision in prior year (355) 432
73 200 63 811
3.3 Personnel expenses
Retirement plans 477 539 430 203
Salaries and wages 7 988 694 6 715 285
Share-based payments – equity-settled (note 24.7) 66 372 78 947
8 532 605 7 224 435
Recognised in:Cost of sales 4 838 915 4 020 397
Distribution expenses 111 634 110 701
Operating expenses 3 582 056 3 093 337
8 532 605 7 224 435
3.4 Directors’ emoluments (included in personnel expenses)
Directors’ fees (note 43)
Paid by:Company 3 300 1 733
Subsidiary companies 5 487 5 583
8 787 7 316
Remuneration
Paid by:Company 566 901
Subsidiary companies 59 073 67 425
59 639 68 326
notes to the annual fInancIal statements • steInhoff annual report 2009 • 121

notes to the annual fInancIal statementsfor the year ended 30 June 2009 (cont inued)
2009 2008 r’000 r’000
3. oPeRATING PRoFIT (continued)3.5 Post-retirement benefit expenses
Contributions to defined benefit plans 70 095 49 959
Contributions to defined contribution plans 145 946 123 124
Contributions to state-managed pension funds 261 498 257 120
477 539 430 203
3.6 Fees paid for services
Administrative 65 088 59 972
Managerial 24 876 48 990
Secretarial 495 326
Technical, consultancy and ‘know-how’ 57 526 54 904
147 985 164 192
3.7 Foreign exchange losses/(gains)
Net loss/(gain) on forward exchange contracts 58 824 (2 573)
Net gains on conversion of monetary assets and liabilities (361 074) (235 737)
(302 250) (238 310)
3.8 Depreciation
Buildings 117 085 109 589
Plant and machinery 123 058 116 719
Long-haul motor vehicles and equipment 287 312 214 632
Bus fleet 70 101 57 937
Motor vehicles 33 688 35 101
Leasehold improvements 150 657 158 704
Office and computer equipment, furniture and other assets 148 485 114 042
930 386 806 724
Vehicle rental fleet 44 328 23 829
122 • steInhoff annual report 2009 • notes to the annual fInancIal statements

2009 2008 r’000 r’000
3. oPeRATING PRoFIT (continued)
3.8 Depreciation (continued)
Recognised in:
Cost of sales 475 628 424 909
Distribution expenses 281 431 269 844
Other operating expenses 217 655 135 800
974 714 830 553
3.9 operating lease charges
Rental of properties 2 395 281 1 600 022
Leases of plant, equipment, vehicles and other 245 056 193 659
2 640 337 1 793 681
The expense in respect of operating property lease charges of R2 395 million (2008: R1 600 million) is effectively reduced by R33 million (2008: R210 million) in respect of rental income received from sublet properties.
3.10 Research and development costs 252 313
3.11 Fair value (gains)/losses (excluding forward exchange contracts)
Fair value adjustment on cross-currency and interest rate swaps (390 084) 196 728
Fair value adjustment on note purchase agreements 425 307 (190 647)
Fair value adjustment on consumable biological assets (506 069) (233 576)
Other – (75)
(470 846) (227 570)
3.12 expenses directly attributable to timber plantations
Harvesting expenses (91 238) (38 599)
Other operating expenses (76 472) (82 602)
(167 710) (121 201)
3.13 expense raised through provision for warranties 109 028 38 091
3.14 Government grants recognised in income (2 487) (2 938)
3.15 Number of employees 41 493 43 331
notes to the annual fInancIal statements • steInhoff annual report 2009 • 123

notes to the annual fInancIal statementsfor the year ended 30 June 2009 (cont inued)
2009 2008 r’000 r’000
4. FINANCe CoSTS
Interest paid
Bank overdrafts 687 074 548 743
Convertible bonds 328 366 135 083
Lease liabilities 6 573 4 487
Loans 933 258 854 284
Vendor liabilities – 1 208
Other 13 077 11 157
Less: Capitalised to property, plant and equipment (9 071) (64 141)
1 959 277 1 490 821
5. INCoMe FRoM INVeSTMeNTS
Dividends received
Listed preference shares 598 584
Interest received
Associate and joint-venture companies 2 535 381
Bank balances 460 990 381 280
Loans receivable 481 679 397 846
Other 13 622 6 677
959 424 786 768
124 • steInhoff annual report 2009 • notes to the annual fInancIal statements

2009 2008 r’000 r’000
6. TAxATIoN6.1 Taxation charge
Normal taxationSouth African normal taxation – current year 51 218 136 739South African normal taxation – prior year adjustment 5 145 (24 405)Foreign normal taxation – current year 166 278 226 932Foreign normal taxation – prior year adjustment 1 142 47 434
223 783 386 700Deferred taxation
South African deferred taxation – current year 112 498 29 837South African deferred taxation – prior year adjustment (8 872) 12 392South African deferred taxation – change in rate of taxation – (1 087)Foreign deferred taxation – current year 232 735 (72 889)Foreign deferred taxation – prior year adjustment 550 1 310Foreign deferred taxation – change in rate of taxation – 94
336 911 (30 343)Capital gains taxation
Current year 4 737 982Prior year (112) –
4 625 982Secondary taxation on companies (STC)
Current year 15 935 8 794581 254 366 133
For detail on deferred taxation assets/(liabilities) refer to note 18. Deferred taxation comprises:Movement in South African deferred taxation assets
Taxation losses (111 993) (342 963)Other 174 575 387 470
Movement in South African deferred taxation liabilitiesTaxation losses 45 346 (14 287)Other (4 302) 10 922
Total South African deferred taxation movement 103 626 41 142Movement in foreign deferred taxation assets
Taxation losses (7 863) (11 020)Other 148 917 (54 143)
Movement in foreign deferred taxation liabilitiesTaxation losses 3 205 (5 405)Other 89 026 (917)
Total foreign deferred taxation movement 233 285 (71 485)Total current year deferred taxation income statement charge 336 911 (30 343)
notes to the annual fInancIal statements • steInhoff annual report 2009 • 125

notes to the annual fInancIal statementsfor the year ended 30 June 2009 (cont inued)
2009 2008
6. TAxATIoN (continued)6.2 Reconciliation of rate of taxation % %
Standard rate of taxation 28,0 28,0
Effect of different statutory taxation rates of foreign subsidiaries in other jurisdictions (11,6) (13,4)
Effect of profit of associate companies – (0,3)
Prior year adjustments (0,1) (0,3)
STC 0,4 0,2
Capital gains taxation 0,1 –
Net utilisation of unrecognised taxation losses and deductible temporary differences (2,4) (4,5)
Permanent differences and other (0,6) (0,1)
Effective rate of taxation 13,8 9,6
7. eARNINGS PeR SHARe
7.1 Basic earnings per share ’000 ’000
Basic earnings per share is calculated by dividing the net earnings attributable to ordinary shareholders by the weighted average number of ordinary shares in issue during the year, excluding shares purchased by the group and held as treasury shares.
Weighted average number of ordinary shares
Issued ordinary shares at beginning of the year 1 349 719 1 294 350
Effect of own shares held (85 697) (45 011)
Effect of shares issued in November 2007 – 3 343
Effect of shares issued in December 2007 – 27 859
Effect of shares issued in November 2008 11 819 –
Weighted average number of ordinary shares at end of the year 1 275 841 1 280 541
earnings r’000 r’000
Earnings for the year attributable to equity holders of the parent 3 378 878 3 310 037
Dividend entitlement on non-redeemable cumulative preference shares (111 446) (110 998)
Earnings from operations attributable to equity holders of the parent 3 267 432 3 199 039
Basic earning per share (cents) 256,1 249,8
126 • steInhoff annual report 2009 • notes to the annual fInancIal statements

2009 2008 ’000 ’000
7. eARNINGS PeR SHARe (continued)
7.2 Diluted earnings per share
Diluted earnings per share is calculated by dividing the diluted earnings attributable to ordinary shareholders by the diluted weighted average number of ordinary shares in issue during the year. The calculation assumes conversion of all dilutive potential shares, regardless of whether the applicable market price triggers have been met. The calculation does not recognise any funds to be received from the exercise of allocated rights or any projected growth in attributable earnings arising from such additional funds, which could compensate for any dilution in earnings per share.
Reconciliation between number of shares used for earnings per share and diluted earnings per share
Weighted average number of ordinary shares 1 275 841 1 280 541
Effect of dilutive potential ordinary shares – convertible bonds* 119 339 54 745
Effect of dilutive potential ordinary shares – other* 55 677 58 923
Weighted average number of ordinary shares for the purpose of diluted earnings per share 1 450 857 1 394 209
Reconciliation between earnings attributable to equity holders of the parent and diluted earnings r’000 r’000
Earnings for the year attributable to equity holders of the parent 3 378 878 3 310 037
Dividend entitlement on non-redeemable cumulative preference shares (111 446) (110 998)
Dilutive adjustment on earnings – convertible bonds* 252 627 88 871
Dilutive adjustment on earnings – other* 46 452 41 125
Diluted earnings attributable to equity holders of the parent 3 566 511 3 329 035
Diluted earnings per share (cents) 245,8 238,8
Dilution percentage (%) 4% 5%
7.3 Headline earnings per share ’000 ’000
Headline earnings per share is calculated by dividing the headline earnings by the weighted average number of ordinary shares in issue during the year.
Weighted average number of ordinary shares 1 275 841 1 280 541* The shares owned by Steinhoff Sikhulasonke Investments (Proprietary) Limited and classified as treasury shares, were anti-dilutive for the year under review. For the prior period, the convertible bond due 2015 was anti-dilutive
and had consequently been excluded from the calculation of diluted headline earnings per share.
notes to the annual fInancIal statements • steInhoff annual report 2009 • 127

2009 2009 2008 2008
gross of ta x atIon and
mInorIt y IntereStS
r’000
ne t of ta x atIon and
mInorIt y IntereStS
r’000
gross of ta x atIon and
mInorIt y IntereStS
r’000
ne t of ta x atIon and
mInorIt y IntereStS
r’000
7. eARNINGS PeR SHARe (continued)7.3 Headline earnings per share (continued)
Reconciliation between earnings and headline earnings
Earnings for the year attributable to equity holders of the parent 3 378 878 3 310 037
Dividend entitlement on non-redeemable cumulative preference shares (111 446) (110 998)
3 267 432 3 199 039
Adjusted for:
Goodwill adjustment on recognition of deferred taxation asset (IFRS 3, paragraph 65) – – 15 581 –
Impairment of associate company – – 154 764 154 764
Impairment of property, plant and equipment 11 667 8 250 9 490 8 110
Loss on sale of intangible asset 4 3 – –
Loss on scrapping of vehicle rental fleet 6 088 4 383 7 650 5 508
Negative goodwill on business combination released to profit or loss – – (8 723) (4 384)
Other assets – (reversal of impairments)/impairments (253) (253) 2 060 2 060
Profit on disposal of investment property (18 612) (16 543) (2 348) (2 019)
Foreign currency translation reserve released on disposal of subsidiary (5 433) (5 249) – –
(Profit)/loss on disposal of property, plant and equipment (42 756) (38 759) 14 416 11 620
Remeasurements included in equity-accounted earnings of associate companies 7 018 7 018 63 63
Headline earnings attributable to equity holders of the parent 3 226 282 3 374 761
Headline earnings per share (cents) 252,9 263,5
notes to the annual fInancIal statementsfor the year ended 30 June 2009 (cont inued)
128 • steInhoff annual report 2009 • notes to the annual fInancIal statements

2009 2008 ’000 ’000
7. eARNINGS PeR SHARe (continued)7.4 Diluted headline earnings per share
Diluted headline earnings per share is calculated by dividing the headline earnings by the diluted weighted average number of shares in issue during the year.
Weighted average number of ordinary shares for the purpose of diluted headline earnings per share (note 7.2). 1 450 857 1 394 209
Reconciliation of headline earnings attributable to equity holders of the parent and diluted headline earnings r’000 r’000
Headline earnings attributable to equity holders of the parent 3 226 282 3 374 761
Dilutive adjustment on earnings – convertible bonds* 252 627 88 871
Dilutive adjustment on earnings – other* 46 452 41 125
Diluted headline earnings attributable to equity holders of the parent 3 525 361 3 504 757
Diluted headline earnings per share (cents) 243,0 251,4
Dilution percentage (%) 4% 5%* The shares owned by Steinhoff Sikhulasonke Investments (Proprietary) Limited and classified as treasury shares, were anti-dilutive for the year under review.
For the prior period, the convertible bond due 2015 was anti-dilutive and had consequently been excluded from the calculation of diluted headline earnings per share.
7.5 Net asset value per ordinary share
Net asset value per ordinary share is calculated by dividing the ordinary shareholders’ equity, adjusted by the non-redeemable cumulative preference shares, by the number of issued ordinary shares at year-end. ’000 ’000
Number of ordinary shares issued at year-end 1 280 346 1 268 743
Net asset value r’000 r’000
Attributable to equity holders of the parent 22 063 795 21 815 421
Preference share capital and premium (1 042 474) (1 042 474)
Attributable to ordinary shareholders 21 021 321 20 772 947
Net asset value per ordinary share (cents) 1 642 1 637
8. DISTRIBUTIoN To SHAReHoLDeRS centS centS
8.1 Capital distribution to ordinary shareholders
The board has resolved to award non-renounceable capitalisation shares from the share premium account to shareholders recorded in the register at the close of business on Friday, 4 December 2009 (2008: 5 December) (the capitalisation share award). All shareholders will be awarded the opportunity to elect to receive a cash distribution of 60 cents per share in lieu of the capitalisation share award. Elections will close on Friday, 4 December 2009 at 12:00 and the payment and issue date will be Monday, 7 December 2009 (2008: 8 December 2008). 60 60
8.2 Distribution to preference shareholders
A preference dividend in respect of the period 1 January 2008 to 30 June 2008 (2008: 1 January 2007 to 30 June 2007) was paid to those Steinhoff Investment preference shareholders recorded in the books of the company at the close of business on 27 October 2008 (2008: 19 October 2007). A preference dividend in respect of the period 1 July 2008 to 31 December 2008 (2008: 1 July 2007 to 31 December 2007) was paid on 28 April 2009 (2008: 29 April 2008) to those Steinhoff Investment preference shareholders recorded in the books of the company at the close of business on 24 April 2009 (2008: 25 April 2008). 1 136 983
The directors of Steinhoff Investment have resolved to declare and pay preference dividends on 26 October 2009 (2008: 27 October 2008) for the period 1 January 2009 to 30 June 2009 (2008: 1 January 2008 to 30 June 2008) to those preference shareholders recorded in the books of Steinhoff Investment at the close of business on 23 October 2009 (2008: 24 October 2008). 489 552
notes to the annual fInancIal statements • steInhoff annual report 2009 • 129

notes to the annual fInancIal statementsfor the year ended 30 June 2009 (cont inued)
2009 2008 r’000 r’000
9. GooDWILL
Carrying amount at beginning of the year 8 300 991 4 659 334
Arising on business combinations (note 38) 34 052 2 470 355
Arising on business combinations – adjustment of previous year purchase price allocation – 5 924
Goodwill adjustment on recognition of deferred taxation asset (IFRS 3, paragraph 65) – (15 581)
Impairments – (800)
Exchange differences on consolidation of foreign subsidiaries (1 139 530) 1 181 759
Carrying amount at end of the year 7 195 513 8 300 991
Cost 7 286 184 8 407 759
Accumulated impairment (90 671) (106 768)
Carrying amount at end of the year 7 195 513 8 300 991
When the group acquires a business that qualifies as a business combination in respect of IFRS 3, the group allocates the purchase price paid to the assets acquired, including identifiable intangible assets, and the liabilities assumed. Any excess of the amount paid over the fair value of those net assets is considered to be goodwill. The goodwill acquired in a business combination is allocated, at acquisition, to the cash-generating unit (CGU) that is expected to benefit from that business. Goodwill is assessed for impairment annually, irrespective of whether there is any indication of impairment.
Review of impairmentThe impairment test compares the carrying amount of the unit, including goodwill, to the value in use, or fair value of the unit. The recoverable amount of the CGU is determined from the value in use calculation. The key assumptions for the value in use calculation are those regarding the discount rates, growth rates and the expected changes to the selling prices and the direct costs during the period. The discount rates are based on the weighted average cost of capital, while growth rates are based on management’s experience and expectations. Growth rates used do not exceed the long-term average growth rate for the area in which the CGU operates. Changes in selling prices and direct costs are based on past practices and expectations of future changes in the market, and are derived from the most recent financial budgets and forecasts that have been prepared by management.
Where an intangible asset, such as a trademark, trade name and brand name and/or patent has been assessed as having an indefinite useful life (see note 35), the cash flow of the CGU, supporting the goodwill and driven by the trademark, brand or patent are also assumed to be indefinite.
An impairment charge is required for both goodwill and other indefinite lived intangible assets when the carrying amount exceeds the recoverable amount. No impairment charges were recorded for the year ended 30 June 2009 (2008: R0,8 million).
130 • steInhoff annual report 2009 • notes to the annual fInancIal statements

2009 2008
9. GooDWILL (continued)The group prepared cash flow forecasts derived from the most recent financial budgets approved by management for the next year and extrapolated cash flows for the following years based on an estimated growth rate as set out below.
Impairment tests for CGUs containing goodwill
The following units have significant carrying amounts of goodwill:
pre-ta x d IScount
r ate forecasted cash flows r’000 r’000
Europe
Steinhoff Retail GmbH (Austria) 5,80% Budget year 1, thereafter 4,7% growth rate. 2 486 425 3 166 274
Pacific Rim
Steinhoff Asia Pacific 12,10% Budget year 1, thereafter 3,5% growth rate. 849 978 1 030 798
Southern Africa
BCM Group 15,01% Budget year 1, thereafter 13% growth rate up to 30 June 2012. The estimated subsequent cash flows were
based on declining growth rates.
9 252 9 252
PG Bison Holdings (Proprietary) Limited 13,96% Budget year 1, thereafter 15% growth rate up to 30 June 2012. The estimated subsequent cash flows were
based on declining growth rates.
116 556 116 556
Unitrans Holdings (Proprietary) Limited 13,09% Budget year 1, thereafter 16% growth rate up to 30 June 2013. The estimated subsequent cash flows were
based on declining growth rates.
573 255 573 255
United Kingdom
Steinhoff UK Holdings 5,46% Budget year 1 to 3, thereafter 2,7% growth rate. 3 020 569 3 295 692
Various other units 5,50% – 15,00% Budget year 1, thereafter 1% – 2% growth rate. 139 478 109 164
Carrying amount at end of the year 7 195 513 8 300 991
notes to the annual fInancIal statements • steInhoff annual report 2009 • 131

notes to the annual fInancIal statementsfor the year ended 30 June 2009 (cont inued)
tr ade & br and nameS
r’000
patentS & tr ade-
markSr’000
sof t warer’000
cuStomer reL atIon-
SHIpSr’000
L Icence agree-mentS
r’000contractS
r’000otHer
r’000totaLr’000
10. INTANGIBLe ASSeTS
Cost
Balance at 1 July 2007 4 386 250 1 124 221 328 748 13 417 17 951 7 095 4 975 5 882 657
Acquisition of subsidiaries and joint-venture companies 4 333 916 – 51 056 – – 2 337 – 4 387 309
Additions 679 808 – 33 111 – 8 794 – 6 382 728 095
Disposals (1 711) (452) (132 709) (4 714) – – (1 059) (140 645)
Reclassifications 10 123 (8 000) 146 (10 117) 3 202 (2 315) (465) (7 426)
Exchange differences on consolidation of foreign subsidiaries 2 314 991 (8) 79 646 1 774 5 551 – – 2 401 954
Balance at 30 June 2008 11 723 377 1 115 761 359 998 360 35 498 7 117 9 833 13 251 944
Disposal of subsidiaries and joint-venture companies – – (61) – – – – (61)
Additions – 97 767 30 056 137 – – 5 752 133 712
Disposals – – (59 022) – (3 100) – – (62 122)
Reclassifications – – (428) 2 215 – – (2 185) (398)
Exchange differences on consolidation of foreign subsidiaries (1 360 998) (28) (5 443) – (5 150) – (10 136) (1 381 755)
Balance at 30 June 2009 10 362 379 1 213 500 325 100 2 712 27 248 7 117 3 264 11 941 320
132 • steInhoff annual report 2009 • notes to the annual fInancIal statements

tr ade & br and nameS
r’000
patentS & tr ade-
markSr’000
sof t warer’000
cuStomer reL atIon-
SHIpSr’000
L Icence agree-mentS
r’000contractS
r’000otHer
r’000totaLr’000
10. INTANGIBLe ASSeTS (continued)Amortisation and impairment
Balance at 1 July 2007 (2 643) (10 758) (268 323) (719) (7 354) (2 043) (3 108) (294 948)
Acquisition of subsidiaries and joint-venture companies (213) – (24 412) – – – – (24 625)
Amortisation for the year – (65) (29 471) – (5 812) (741) (1 779) (37 868)
Disposals 1 711 194 88 716 1 345 – – 598 92 564
Reclassifications 823 8 000 (146) (829) (3 202) 754 2 026 7 426
Exchange differences on consolidation of foreign subsidiaries (23) (5) (66 175) (157) (2 529) – – (68 889)
Balance at 30 June 2008 (345) (2 634) (299 811) (360) (18 897) (2 030) (2 263) (326 340)
Disposal of subsidiaries and joint-venture companies – – 61 – – – – 61
Amortisation for the year – (76) (41 563) (149) (865) (936) (2 518) (46 107)
Disposals – – 49 034 – 3 100 – – 52 134
Reclassifications – – 428 (1 946) – – 1 916 398
Impairment reversal – – 70 – – – – 70
Exchange differences on consolidation of foreign subsidiaries 64 2 44 547 – 3 725 – 9 941 58 279
Balance at 30 June 2009 (281) (2 708) (247 234) (2 455) (12 937) (2 966) 7 076 (261 505)
Carrying amount at 30 June 2007 4 383 607 1 113 463 60 425 12 698 10 597 5 052 1 867 5 587 709
Carrying amount at 30 June 2008 11 723 032 1 113 127 60 187 – 16 601 5 087 7 570 12 925 604
Carrying amount at 30 June 2009 10 362 098 1 210 792 77 866 257 14 311 4 151 10 340 11 679 815
During the prior year the group acquired European Retail Management SA (ERM). As a result of the investment in ERM, the group now effectively controls and therefore consolidates various European retail operations based in the European Union. The prior year increase in intangible assets relates largely to this acquisition. Detail of the prior year fair valuations are disclosed in note 38.
Review of impairmentIn determining the appropriate methodology to be adopted in the valuation of the value in use of the majority of the group’s intangible assets, the relief from royalty approach was considered to be the most applicable as a primary valuation methodology because it is predominantly and widely used as a basis for the structuring of licensing agreements both locally in the countries where these intangible assets originate and internationally, and this approach is generally accepted internationally as a reliable means of valuing trademarks.
IAS 38 – Intangible Assets (IAS 38) gives guidance on how the fair value of intangible assets can be determined. The guidance has been applied throughout the valuation of the trade names, brand names and trademarks. Impairment tests typically take into account the most recent management forecast whereafter a reasonable rate of growth is applied based on market and industry conditions. Discount rates used in the discounted cash flow models are based on a weighted average cost of capital, while royalty rates used are determined with reference to industry benchmarks.
ImpairmentAll intangible assets were tested for impairment during the year under review and no impairments were recognised for the current or prior year on intangible assets. All impairment testing was done consistently with methods used in the prior year.
Useful livesUnder IAS 38, the useful life of an asset is either finite or indefinite. An indefinite life does not mean an infinite useful life, but rather that there is no foreseeable limit to the period over which the asset can be expected to generate cash flows for the entity. Intangible assets with an indefinite useful life are not amortised; they are tested for impairment at least annually.
notes to the annual fInancIal statements • steInhoff annual report 2009 • 133

notes to the annual fInancIal statementsfor the year ended 30 June 2009 (cont inued)
10. INTANGIBLe ASSeTS (continued)All of the European trade names, brand names and/or trademarks have been assessed as having an indefinite useful life. In southern Africa the intangible assets acquired in the Unitrans and PG Bison business combinations, have also been assessed as having indefinite useful lives. The majority of these trade names and brand names were assessed independently at the time of the acquisition, and the indefinite useful life assumptions were supported by the following evidence:
• Theindustryisamature,well-establishedindustry. • Thetradenames,brandnamesand/ortrademarksarelong-establishedrelativetothemarketandhavebeeninexistenceforalongtime.• Theintangibleassetsrelatetotradenames,brandnames,trademarksandpatentsratherthanproductsandarethereforenotvulnerabletotypicalproductlifecyclesortothetechnical,
technological, commercial or other types of obsolescence that can be seen to limit the useful lives of other trade names and brand names.• Thereisarelativelylowturnoverofcomparableintangibleassetsimplyingstabilitywithintheindustry.
Royalty rates The royalty rate represents the assumed amount which would be paid to the owner of the intangible asset as a royalty fee, expressed as a percentage of revenue, for the use of the intangible asset. It is necessary to look to the industry in which the brand is operational to determine an appropriate notional royalty rate.
A database search of the RoyaltySource Intellectual Property Database for comparable worldwide licensing or franchising transactions of trademarks in the retail industry, focusing on furniture and/or household goods revealed royalty rates varying from 2,5% to 5,0%, with an average rate of 4,0%. The royalty rates used in assessing the value in use of the Steinhoff trade names and brand names all fall within or below this recommended range and vary from 0,5% to 3,1%.
134 • steInhoff annual report 2009 • notes to the annual fInancIal statements

L and & buILdIngS
r’000
pL ant & machInery
r’000
Long-HauL motor
vehIcles & equIpment
r’000
buS flee tr’000
motor vehIcles
r’000
capItaL work- In-
progreSSr’000
Le aSeHoLd Improve-
mentSr’000
offIce & computer
equIpment, furnIture
& otHer aSSe tS
r’000totaLr’000
11. PRoPeRTY, PLANT AND eQUIPMeNT
Cost
Balance at 1 July 2007 3 931 437 1 420 397 1 916 792 541 824 193 080 812 200 1 538 202 987 398 11 341 330
Additions 269 916 95 104 963 544 127 209 67 937 352 525 93 342 126 077 2 095 654
Assets held for sale (10 399) (4 841) 6 755 – (131) – – (203) (8 819)
Disposals (559 847) (81 859) (158 875) (41 090) (33 374) (6 619) (243 548) (161 091) (1 286 303)
Impairments (2 561) (9 627) – – (2) – (31) (522) (12 743)
Intergroup (disposals)/purchases (2 132) (1 949) (24 224) – (48) – – (1 604) (29 957)
Acquisition of subsidiary companies 1 748 277 222 961 – – 16 723 2 805 713 898 212 257 2 916 921
Disposal of subsidiary companies (1 640 978) (210) – – – – – (24 409) (1 665 597)
Reclassification 496 415 626 532 125 30 15 227 (1 068 208) (849) (69 272) –
Transferred to investment property and inventory (330 275) – – – – – – – (330 275)
Exchange differences on consolidation of foreign subsidiaries 1 393 863 146 913 17 543 103 22 914 11 836 389 060 (58 680) 1 923 552
Balance at 30 June 2008 5 293 716 2 413 421 2 721 660 628 076 282 326 104 539 2 490 074 1 009 951 14 943 763
Additions 253 957 77 485 517 924 111 674 40 537 198 014 119 433 228 857 1 547 881
Assets held for sale 10 400 – (6 590) – – – – – 3 810
Disposals (62 725) (120 835) (194 867) (29 942) (22 273) (6 007) (20 626) (135 647) (592 922)
Impairments (718) – – – – – (14 573) – (15 291)
Acquisition of subsidiary companies 1 357 12 413 – – 19 251 – 3 684 10 972 47 677
Disposal of subsidiary companies – (1 036) – – (15) – – (283) (1 334)
Reclassification 53 947 47 228 (43 417) 49 571 (24 941) (141 804) (91 618) 123 315 (27 719)
Transferred to investment property and inventory 1 244 – – – – – – – 1 244
Exchange differences on consolidation of foreign subsidiaries (545 023) (147 419) (19 063) (85) (44 255) (25 652) (311 515) (223 482) (1 316 494)
Balance at 30 June 2009 5 006 155 2 281 257 2 975 647 759 294 250 630 129 090 2 174 859 1 013 683 14 590 615
notes to the annual fInancIal statements • steInhoff annual report 2009 • 135

notes to the annual fInancIal statementsfor the year ended 30 June 2009 (cont inued)
L and & buILdIngS
r’000
pL ant & machInery
r’000
Long-HauL motor
vehIcles & equIpment
r’000
buS flee tr’000
motor vehIcles
r’000
Le aSeHoLd Improve-
mentSr’000
offIce & computer
equIpment, furnIture
& otHer aSSe tS
r’000totaLr’000
11. PRoPeRTY, PLANT AND eQUIPMeNT (continued)Accumulated depreciation and impairment
Balance at 1 July 2007 (518 652) (725 262) (781 014) (215 977) (107 193) (857 059) (676 663) (3 881 820)
Assets held for sale – 3 321 (3 541) – 11 – 9 (200)
Current year depreciation (109 589) (116 719) (214 632) (57 937) (35 101) (158 704) (114 042) (806 724)
Disposals 465 600 70 259 99 852 29 090 21 840 221 214 147 530 1 055 385
Impairments – 2 947 – – – – 306 3 253
Intergroup (purchases)/disposals 2 132 1 949 24 224 – 48 – 1 604 29 957
Acquisition of subsidiary companies (483 692) (34 936) – – (5 510) (194 080) (34 302) (752 520)
Disposal of subsidiary companies 342 296 12 – – – – 11 113 353 421
Reclassification (130) (51 860) 122 – 4 747 (879) 48 000 –
Exchange differences on consolidation of foreign subsidiaries (170 824) (99 312) (8 902) (103) (12 593) (283 899) (103 669) (679 302)
Balance at 30 June 2008 (472 859) (949 601) (883 891) (244 927) (133 751) (1 273 407) (720 114) (4 678 550)
Assets held for sale – – 4 492 – – – – 4 492
Current year depreciation (117 085) (123 058) (287 312) (70 101) (33 688) (150 657) (148 485) (930 386)
Disposals 24 386 92 972 93 164 19 468 15 140 20 525 72 817 338 472
Impairments 70 3 500 – – – – 54 3 624
Acquisition of subsidiary companies – (3 526) – – (12 093) (1 377) (4 378) (21 374)
Disposal of subsidiary companies – 868 – – 61 – 196 1 125
Reclassification 3 812 (9 666) 7 059 (537) 10 970 6 370 9 711 27 719
Exchange differences on consolidation of foreign subsidiaries 89 747 105 050 9 166 82 23 021 148 749 95 986 471 801
Balance at 30 June 2009 (471 929) (883 461) (1 057 322) (296 015) (130 340) (1 249 797) (694 213) (4 783 077)
136 • steInhoff annual report 2009 • notes to the annual fInancIal statements

2009 2008 2007 r’000 r’000 r’000
11. PRoPeRTY, PLANT AND eQUIPMeNT (continued)
Net book value
Land and buildings 4 534 226 4 820 857 3 412 785
Plant and machinery 1 397 796 1 463 820 695 135
Long-haul motor vehicles and equipment 1 918 325 1 837 769 1 135 778
Bus fleet 463 279 383 149 325 847
Motor vehicles 120 290 148 575 85 887
Capital work-in-progress 129 090 104 539 812 200
Leasehold improvements 925 062 1 216 667 681 143
Office and computer equipment, furniture and other assets 319 470 289 837 310 735
9 807 538 10 265 213 7 459 510
Land and buildingsDetails of land and buildings are available for inspection by members on request at the various registered offices of the company and its subsidiaries.
encumbered assetsAssets with a book value of R1 612 276 000 (2008: R1 503 271 000) are encumbered as set out in note 28.
Strategic Industrial Projects Programme (SIP Programme)PG Bison has entered into an agreement with the South African Department of Trade and Industry in terms of which its north-eastern Cape Forest Project forms part of the SIP Programme. The benefit has been deemed to be akin to an investment taxation credit, and the group therefore accounts for the benefit in terms of its policy for government grants related to assets. R168 million was therefore deducted in 2008 from the cost of the project’s assets.
InsuranceProperty, plant and equipment, with the exception of motor vehicles, bus fleet, long-haul motor vehicles and land, are insured at approximate cost of replacement. Motor vehicles are insured at market value. Bus fleet and long-haul motor vehicles are self-insured.
Capitalisation of interestInterest capitalised to the cost of property, plant and equipment was included in additions during the current year.
Impairment lossesRefer to “Capital items” (note 2).
Useful livesThe estimated useful lives are reflected under “Judgements and estimates” (note 35).
notes to the annual fInancIal statements • steInhoff annual report 2009 • 137
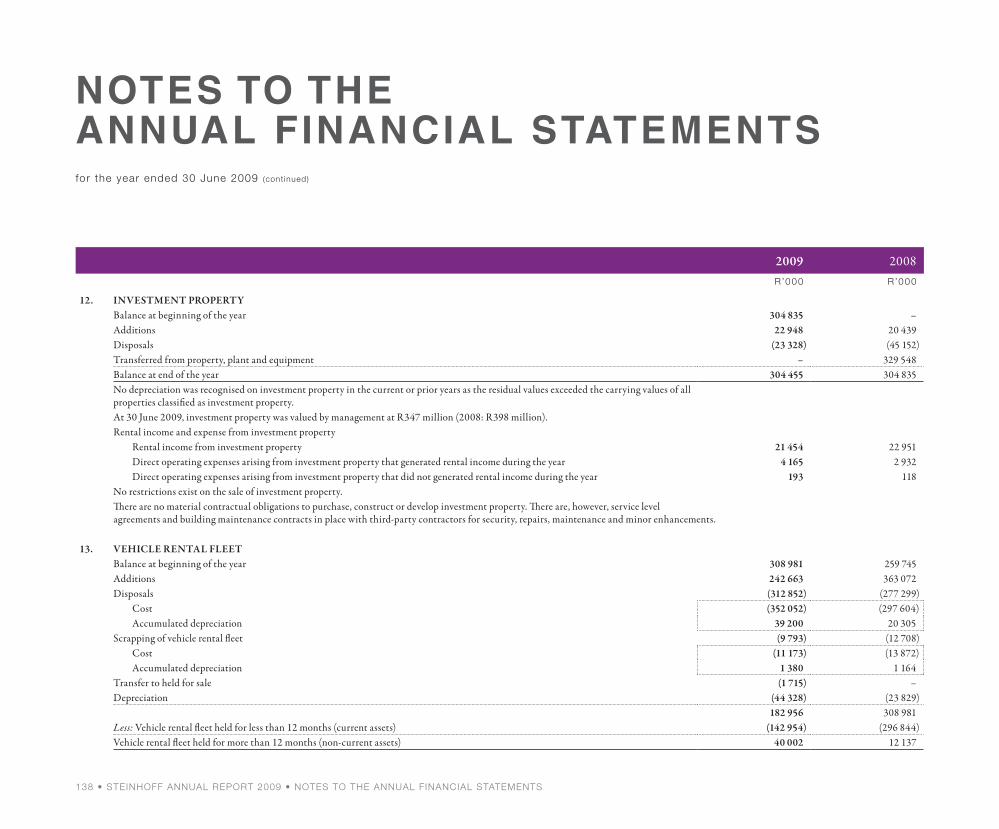
2009 2008 r’000 r’000
12. INVeSTMeNT PRoPeRTYBalance at beginning of the year 304 835 –Additions 22 948 20 439Disposals (23 328) (45 152)Transferred from property, plant and equipment – 329 548Balance at end of the year 304 455 304 835No depreciation was recognised on investment property in the current or prior years as the residual values exceeded the carrying values of all properties classified as investment property.At 30 June 2009, investment property was valued by management at R347 million (2008: R398 million).Rental income and expense from investment property
Rental income from investment property 21 454 22 951Direct operating expenses arising from investment property that generated rental income during the year 4 165 2 932Direct operating expenses arising from investment property that did not generated rental income during the year 193 118
No restrictions exist on the sale of investment property.There are no material contractual obligations to purchase, construct or develop investment property. There are, however, service level agreements and building maintenance contracts in place with third-party contractors for security, repairs, maintenance and minor enhancements.
13. VeHICLe ReNTAL FLeeTBalance at beginning of the year 308 981 259 745Additions 242 663 363 072Disposals (312 852) (277 299)
Cost (352 052) (297 604)Accumulated depreciation 39 200 20 305
Scrapping of vehicle rental fleet (9 793) (12 708)Cost (11 173) (13 872)Accumulated depreciation 1 380 1 164
Transfer to held for sale (1 715) –Depreciation (44 328) (23 829)
182 956 308 981Less: Vehicle rental fleet held for less than 12 months (current assets) (142 954) (296 844)Vehicle rental fleet held for more than 12 months (non-current assets) 40 002 12 137
notes to the annual fInancIal statementsfor the year ended 30 June 2009 (cont inued)
138 • steInhoff annual report 2009 • notes to the annual fInancIal statements

2009 2008 r’000 r’000
14. CoNSUMABLe BIoLoGICAL ASSeTS
Timber plantations
Carrying amount at beginning of the year 706 283 511 306
Decrease due to harvesting (91 238) (38 599)
Fair value adjustment to plantations 506 069 233 576
Carrying amount at end of the year 1 121 114 706 283
Livestock 3 922 –
1 125 036 706 283
expenses incurred in the management and operations of plantations (167 710) (121 201)
The group owns and manages timber plantations for use in manufacturing timber products. In terms of IAS 41 – Agriculture, the plantations are valued at fair value less estimated costs to sell. The Faustman formula and discounted cash flow models were applied in determining the fair value of the plantations. The principal assumptions used in the Faustman formula include surveying physical hectares planted, age analysis and the industry mean annual incremental growth.
The fair value of mature standing timber, being the age at which it becomes marketable, is based on the market price of the estimated recoverable timber volumes, net of harvesting costs. The fair value of younger standing timber is based on the present value of the net cash flows expected to be generated by the plantation at maturity.
Livestock was introduced to the plantations as part of the fire prevention strategy of the group.
The group is exposed to a number of risks regarding its timber plantations:• Regulatoryandenvironmentalrisks
The group’s timber plantation operations are subject to laws and regulations. The group has established environmental policies and procedures aimed at compliance with local environmental and other laws. The Thesens and north-eastern Cape forests are Forestry Stewardship Council certified (refer to sustainability report). Management performs regular reviews to identify environmental risks and to ensure that the systems in place are adequate to manage those risks.
• SupplyanddemandrisksFor external sale of timber, the group is exposed to risks arising from the fluctuations of price and sales volumes of timber. Where possible, the group manages these risks by aligning its harvest volume to market supply and demand. Management performs regular industry trend analysis to ensure that the group’s pricing structure is in line with the market and to ensure that projected harvest volumes are consistent with the expected demand.
• ClimateandotherrisksThe group’s timber plantations are exposed to the risk of damage from climate changes, disease, forest fires and other natural forces. The group has extensive processes in place aimed at monitoring and mitigating those risks, including regular forest health inspections and industry and pest disease surveys. The group also insures itself, where cost-effective, against natural disasters such as fire.
encumbered consumable biological assetsNone of the group’s consumable biological assets are encumbered.
CommitmentsThere are no amounts committed for the development and acquisition of consumable biological assets.
notes to the annual fInancIal statements • steInhoff annual report 2009 • 139

2009 2008 2009 2008 nature of busIness % HoLdIng % HoLdIng r’000 r’000
15. INVeSTMeNTS IN ASSoCIATe CoMPANIeSCarrying valueListedAmalgamated Appliances Holdings Limited Supplies and distributes appliances and electrical accessories 27,6 27,6 135 921 155 419
Shares 114 629 114 629Post-acquisition earnings 21 292 40 790
KAP International Holdings Limited Diverse manufacturing, wholesale and retail businesses 30,8 30,8 522 412 533 881Shares (including Micawber 455 (Proprietary) Limited (note 27)) 426 873 426 873Post-acquisition earnings 95 539 107 008
UnlistedAsste Management Holding GmbH Holding company 45,0 – 97 –Emergent Office Solutions (Proprietary) Limited Sale and distribution of office furniture 24,5 – 3 291 –Hemisphere International Property BV Property holding company 45,0 45,0 947 795 1 009 151Induna Tippers (Proprietary) Limited Supplies trucks to the Gautrain project 49,0 49,0 4 684 2 408Loungefoam (Proprietary) Limited Manufactures foam products 47,5 47,5 21 239 22 854Xinergistix Limited Industrial long-distance haulage 27,6 27,6 31 502 28 960Zimbabwean associate company (impaired) Manufactures panel products 40,0 40,0 – –
1 666 941 1 752 673Loans due by/(to) associate companiesEmergent Office Solutions (Proprietary) Limited 3 000 –Hemisphere International Property BV 1 344 825 709 309Induna Tippers (Proprietary) Limited (10 000) (4 000)Loungefoam (Proprietary) Limited – 10
1 337 825 705 3193 004 766 2 457 992
Market value of listed investments 247 650 383 682Directors’ valuation of unlisted investments 1 008 608 1 063 373
1 256 258 1 447 055
notes to the annual fInancIal statementsfor the year ended 30 June 2009 (cont inued)
140 • steInhoff annual report 2009 • notes to the annual fInancIal statements

2009 2008 r’000 r’000
15. INVeSTMeNTS IN ASSoCIATe CoMPANIeS (continued)
The June 2009 30-day volume-weighted average share prices on the JSE Limited were used to determine the market value of listed investments. Where there were impairment indicators, discounted cash flows were used to determine the value in use of these investments. For listed investments, publically available information was used to determine value in use. No impairment was recognised in the current year (2008: R155 million).
Investments at cost
Listed investments
Amalgamated Appliances Holdings Limited 114 629 114 629
Share of net asset value 119 432 119 432
Fair value adjustments on acquisition of associate 24 049 24 049
Goodwill 144 126 144 126
Impairment (154 764) (154 764)
Capital distribution received (18 214) (18 214)
KAP International Holdings Limited 426 873 426 873
Share of net asset value 339 707 339 707
Fair value adjustments on acquisition of associate 8 799 8 799
Goodwill 98 319 98 319
Capital distribution received (19 952) (19 952)
541 502 541 502
Unlisted investments
Asste Management Holding GmbH 97 –
Emergent Office Solutions (Proprietary) Limited 3 000 –
Hemisphere International Property BV 917 990 1 009 151
Opening balance 1 009 151 1 009 151
Additions for the year 36 829 –
Foreign currency translation reserve (127 990) –
Loungefoam (Proprietary) Limited 9 576 9 576
Xinergistix Limited 20 720 20 720
951 383 1 039 447
Total investments at cost 1 492 885 1 580 949
notes to the annual fInancIal statements • steInhoff annual report 2009 • 141

2009 2008 r’000 r’000
15. INVeSTMeNTS IN ASSoCIATe CoMPANIeS (continued)Attributable share of post-acquisition retained earnings
At beginning of the year 171 724 134 653
Current year share of income 6 527 37 071
Foreign currency translation difference (4 195) –
At end of the year 174 056 171 724
CommitmentsThe group’s obligation in respect of losses and contingent liabilities from associate companies is limited to the extent of the carrying values of the investments.
Information in respect of investments in associate companies
Balance sheet
AssetsIntangible assets and goodwill 265 138 281 534
Property, plant and equipment 5 429 629 5 981 198
Non-current assets 53 662 2 488 019
Deferred taxation assets 210 712 137 856
Current assets 2 065 847 65 900
8 024 988 8 954 507
Equity and liabilitiesShare capital and reserves 3 419 359 4 055 202Minority interests 213 382 40 733Non-current liabilities 1 477 619 40 730Deferred taxation liabilities 25 249 968 642Current liabilities 2 889 379 3 849 200
8 024 988 8 954 507
notes to the annual fInancIal statementsfor the year ended 30 June 2009 (cont inued)
142 • steInhoff annual report 2009 • notes to the annual fInancIal statements

2009 2008 r’000 r’000
15. INVeSTMeNTS IN ASSoCIATe CoMPANIeS (continued)Income statement
Revenue 5 609 841 6 805 749
Profit/(loss) before taxation 19 701 (112 396)
Taxation 3 746 (14 512)
Profit/(loss) for the year 23 447 (126 908)
Attributable to:
Equity holders of the parent 28 047 (119 408)
Minority interest (4 600) (7 500)
Profit/(loss) for the year 23 447 (126 908)
16. INTeReST IN JoINT-VeNTURe CoMPANIeS
nature of busIness % HoLdIng % HoLdIng
Buffalo Pocket Spring Company (Proprietary) Limited Manufactures pocket inner springs 50 50
Kronotex South Africa (Proprietary) Limited Supplier of flooring accessories to retail outlets 50 50
La-Z-Boy Europe BV Manufactures recliner chairs 50 50
Pennypinchers stores and Timbercity stores Distribution of building materials, hardware, home improvement products and related goods and services
* 50
PG Bison Kenya Limited Retail outlet selling hardware materials 50 50
Samstar Services (Proprietary) Limited Provider of security services 33 33
Steitex (Proprietary) Limited Fabric sourcing 50 50
Univiron (Proprietary) Limited Waste removal specialists 50 50
Van den Bosch Beheer BV Wholesale and distribution of household goods 50 50
r’000 r’000
Loans due by joint-venture companies 9 997 5 983
Less: Impairments written off – (349)
9 997 5 634
Impairment lossesNo impairment loss was recognised in profit or loss for the year ended 30 June 2009 (2008: R0,3 million).
CommitmentsThe joint-venture companies did not have any contingent liabilities at year-end.* The restructuring of the building supply retail division (Steinbuild) led to control of the joint-venture operations, requiring the consolidation of its results in the year under review. This division was proportionally consolidated in
the previous year.
notes to the annual fInancIal statements • steInhoff annual report 2009 • 143

2009 2008 r’000 r’000
16. INTeReST IN JoINT-VeNTURe CoMPANIeS (continued)The proportionate share of the aggregated financial information of the joint-venture companies consolidated is:Assets and liabilitiesIntangible assets and goodwill 861 776Property, plant and equipment 123 259 168 246Deferred taxation assets 394 130Other non-current assets – 12 246Current assets 306 038 572 143Non-current liabilities (16 479) (169 855)Deferred taxation liabilities (4 915) (19 944)Current liabilities (242 972) (263 004)
166 186 300 738Capital and reserves (166 186) (300 738)Income statementRevenue 848 996 1 389 538Net expenditure (783 445) (1 309 752)Profit before taxation 65 551 79 786Taxation (20 916) (14 497)Profit for the year 44 635 65 289
17. INVeSTMeNTS AND LoANSListed investments – preference shares 4 526 4 395Unlisted investments 274 173 248 574
Ordinary shares 62 310 59 684Preference shares 211 863 188 890
Loans receivable carried at amortised cost 2 079 381 1 020 0762 358 080 1 273 045
Directors’ valuation of unlisted investments 274 173 248 574
notes to the annual fInancIal statementsfor the year ended 30 June 2009 (cont inued)
144 • steInhoff annual report 2009 • notes to the annual fInancIal statements

2009 2008 r’000 r’000
17. INVeSTMeNTS AND LoANS (continued)A fair value adjustment of R0,1 million (2008: R0,6 million) on the listed preference shares was processed directly in equity during the year. This fair value adjustment increased (2008: decreased) the carrying value of the investment to equal the market value as at 30 June.Discounted cash flows were used to determine the value in use of unlisted preference shares. No fair value adjustment was processed during the year. A prior year adjustment of R2,6 million was processed directly to equity.The directors’ valuation of unlisted ordinary shares and loans is based on valuation of the underlying assets of the investments.The unsecured loans receivable consist of various loans with repayment terms ranging between 13 and 73 months, bearing interest at market-related interest rates and participating in profit share.None of the loans receivable included as non-current financial assets are past due or impaired at balance sheet date and there are no indications that any of these counterparties will not meet their repayment obligations.Details of investments are available at the registered office of the company for inspection by members.
18. DeFeRReD TAxATIoN ASSeTS/(LIABILITIeS)18.1 Deferred taxation movement
(Liabilities)/assetsBalance at beginning of the year (1 813 428) (285 112)Deferred taxation of subsidiaries acquired – (1 250 192)Deferred taxation of subsidiaries disposed (1 776) (10 842)Strategic Industrial Projects allowance – 168 000Amounts charged directly to equity
Actuarial reserve 8 477 (10 806)Cash flow hedges 108 108Equity component of convertible bonds – (59 162)Share-based payments (18 034) (35 622)
Current year (charge)/credit (336 911) 30 343Exchange differences on consolidation of foreign subsidiaries 242 462 (360 143)Balance at end of the year (1 919 102) (1 813 428)
18.2 Deferred taxation balancesAssetsProvision for taxation on temporary differences resulting from South African normal taxation rate (28%), South African capital gains taxation (SA CGT) rate (14%) and foreign taxation rates (ranging from 8% to 38%):
Cash flow hedges 108 –Operating leases 159 600 241 447Prepayments and provisions 306 365 347 371Property, plant and equipment (including consumable biological assets) (142 104) 140 995Share-based payments 80 049 70 271Other 34 245 46 732
Secondary taxation on companies (10%) 23 23438 286 846 839
Taxation losses and creditsTaxation losses 663 035 543 181
Total deferred taxation assets 1 101 321 1 390 020
Realisation of the deferred taxation asset is expected out of future taxable income which was assessed and deemed to be reasonable.
notes to the annual fInancIal statements • steInhoff annual report 2009 • 145

2009 2008 r’000 r’000
18. DeFeRReD TAxATIoN ASSeTS/(LIABILITIeS) (continued)18.2 Deferred taxation balances (continued)
LiabilitiesProvision for taxation on temporary differences resulting from South African normal taxation rate (28%), SA CGT rate (14%) and foreign taxation rates (ranging from 8% to 38%):
Equity component of convertible bonds (116 551) (132 769)
Intangible assets (1 816 590) (2 127 194)
Prepayments and provisions (124 349) (50 771)
Property, plant and equipment (including consumable biological assets) (917 442) (810 726)
Share-based payments 1 938 7 080
Other (134 065) (224 255)
Secondary taxation on companies (10%) 3 514 3 514
(3 103 545) (3 335 121)
Taxation losses and creditsTaxation losses 83 122 131 673
Total deferred taxation liabilities (3 020 423) (3 203 448)18.3 Unrecognised deferred taxation assets
Deferred taxation assets have not been recognised in respect of the following items:
Net deductible temporary differences 2 144 1 209
Taxation losses 1 346 429 1 634 260
1 348 573 1 635 469
The taxation losses and deductible temporary differences do not expire under current taxation legislation. Deferred taxation assets have not been recognised in respect of these items because it is not yet certain that future taxable profits will be available against which the group can realise the benefits therefrom.
18.4 Taxation lossesEstimated taxation losses available for offset against future taxable income 4 158 067 4 026 154
notes to the annual fInancIal statementsfor the year ended 30 June 2009 (cont inued)
146 • steInhoff annual report 2009 • notes to the annual fInancIal statements

19. FINANCIAL INSTRUMeNTS
The executive team is responsible for implementing the risk management strategy to ensure that an appropriate risk management framework is operating effectively across the group, embedding a risk management culture throughout the group. The board and the audit committee are provided with a consolidated view of the risk profile of the group, and any major exposures and relevant mitigating actions are identified.
The system of risk management is designed so that the different business units are able to tailor and adapt their risk management processes to suit their specific circumstances.
Regular management reporting and internal audit reports provide a balanced assessment of key risks and controls. The financial director provides quarterly confirmation to the board that financial and accounting control frameworks have operated satisfactorily and consistently.
The group does not speculate in the trading of derivative or other financial instruments. It is group policy to hedge exposure to cash and future contracted transactions.
19.1 Total financial assets and liabilities
at fa Ir value
tHrougH profIt or
LoSS1
r’000
deSIgnated as at fa Ir
value tHrougH
profIt or LoSSr’000
avaIl able for sale
f InancIal aSSe tS
r’000
LoanS & receIvables
& otHer fInancIal
L Iab IL It IeS at amortISed
coStr’000
totaL carryIng
valuesr’000
LoanS & receIvables
& otHer fInancIal
L IabIL It IeS at fa Ir
valuer’000
totaL faIr
valuesr’000
2009
Investments and loans – – 278 699 2 079 381 2 358 080 2 079 381 2 358 080
Derivative financial assets 1 115 – – – 1 115 – 1 115
Trade and other receivables (excluding prepayments) – – – 7 193 141 7 193 141 7 193 141 7 193 141
Short-term loans receivable – – – 792 770 792 770 792 770 792 770
Gross debt net of cash – (2 340 202) – (10 502 414) (12 842 616) (10 989 577) (13 329 779)
Funds on call and deposit – – – 670 670 670 670
Bank balances and cash – – – 4 735 527 4 735 527 4 735 527 4 735 527
Long-term interest-bearing loans and borrowings – (2 340 202) – (10 363 678) (12 703 880) (10 850 841) (13 191 043)
Short-term interest-bearing loans and borrowings – – – (4 808 052) (4 808 052) (4 808 052) (4 808 052)
Bank overdrafts – – – (66 881) (66 881) (66 881) (66 881)
Trade and other payables – – – (7 199 592) (7 199 592) (7 199 592) (7 199 592)
Derivative financial liabilities (181 957) – – – (181 957) – (181 957)
(180 842) (2 340 202) 278 699 (7 636 714) (9 879 059) (8 123 877) (10 366 222)
Net (gains) and losses recognised in profit or loss 91 696 35 211 – (4 664) 122 243
Net gain recognised in equity – – (132) – (132)
91 696 35 211 (132) (4 664) 122 111
Total interest income (22 973) (931 487) (954 460)
Total interest expense – 1 809 834 1 809 834
(22 973) 878 347 855 374
1 This category includes derivative financial instruments that are not designated as effective hedging instruments.
notes to the annual fInancIal statements • steInhoff annual report 2009 • 147

19. FINANCIAL INSTRUMeNTS (continued)19.1 Total financial assets and liabilities (continued)
at fa Ir value
tHrougH profIt or
LoSS1
r’000
deSIgnated as at fa Ir
value tHrougH
profIt or LoSSr’000
avaIl able for sale
f InancIal aSSe tS
r’000
LoanS & receIvables
& otHer fInancIal
L Iab IL It IeS at amortISed
coStr’000
totaL carryIng
valuesr’000
LoanS & receIvables
& otHer fInancIal
L IabIL It IeS at fa Ir
valuer’000
totaL faIr
valuesr’000
2008Investments and loans – – 259 084 1 013 961 1 273 045 1 013 961 1 273 045Derivative financial assets 27 021 – – – 27 021 – 27 021Trade and other receivables (excluding prepayments) – – – 6 449 097 6 449 097 6 456 547 6 456 547Short-term loans receivable – – – 454 814 454 814 454 814 454 814Gross debt net of cash – (2 241 982) – (9 402 951) (11 644 933) (9 235 496) (11 477 478)Funds on call and deposit – – – 269 050 269 050 269 050 269 050Bank balances and cash – – – 4 726 181 4 726 181 4 726 181 4 726 181Long-term interest-bearing loans and borrowings – (2 241 982) – (10 442 526) (12 684 508) (10 275 071) (12 517 053)Short-term interest-bearing loans and borrowings – – – (2 880 635) (2 880 635) (2 880 635) (2 880 635)Bank overdrafts – – – (1 075 021) (1 075 021) (1 075 021) (1 075 021)Trade and other payables – – – (8 728 887) (8 728 887) (8 728 887) (8 728 887) Derivative financial liabilities (471 842) – – – (471 842) – (471 842)
(444 821) (2 241 982) 259 084 (10 213 966) (12 641 685) (10 039 061) (12 466 780)Net (gains) and losses recognised in profit or loss 2 332 14 724 (531) (240 486) (223 961)Net losses recognised in equity 264 – 3 157 – 3 421
2 596 14 724 2 626 (240 486) (220 540)Total interest income (18 942) (765 953) (784 895)Total interest expense – 1 359 685 1 359 685
(18 942) 593 732 574 790
No items were classified as ‘held to maturity’ during either period presented. 1 This category includes derivative financial instruments that are not designated as effective hedging instruments.
notes to the annual fInancIal statementsfor the year ended 30 June 2009 (cont inued)
148 • steInhoff annual report 2009 • notes to the annual fInancIal statements

19. FINANCIAL INSTRUMeNTS (continued)19.2 Fair values
The fair values of financial assets and financial liabilities are determined as follows:
Investments in equity and debt securitiesThe fair value of an available for sale financial asset is determined by reference to its 30-day volume-weighted average quoted bid price at the reporting date. Where the quoted bid price of the listed investment is less than the carrying value and the directors are of the opinion that the decline in value is permanent, an impairment loss is recognised.
Trade and other receivables and short-term loans receivableThe fair values of trade and other receivables and short-term loans receivable are estimated as the present value of future cash flows, discounted at the market rate of interest at the reporting date.
Derivatives The fair values of forward exchange contracts are based on their listed market price, if available. If a listed market price is not available, then the fair value is estimated by discounting the difference between the contractual forward price and the current forward price for the residual maturity of the contract using a risk-free interest rate (based on government bonds).
The fair values of interest rate swaps are based on broker’s quotes. Those quotes are tested for reasonability by discounting estimated future cash flows based on the terms and maturity of each contract using market interest rates for a similar instrument at the measurement date.
Non-derivative financial liabilitiesFair value, which is determined for disclosure purposes, is calculated based on the present value of future principal and interest cash flows, discounted at the market rate of interest at the reporting date. In respect of the liability component of convertible notes, the market rate of interest is determined by reference to similar liabilities that do not have conversion options.
The fair values are not necessarily indicative of the amounts the group could realise in the normal course of business.
IFRS 7 – Financial Instruments: Disclosure (IFRS 7), has established a three-level hierarchy for making fair value measurements:• Level1–Unadjustedquotedpricesforfinancialassetsandfinancialliabilitiestradedinanactivemarketforidenticalfinancialassetsorfinancialliabilities.• Level2–Inputsotherthanquotedpricesincludedinlevel1thatareobservableforthefinancialassetorfinancialliability,eitherdirectly(ieasprices)orindirectly(iederivedfromprices).• Level3–Inputsforthefinancialassetorfinancialliabilitythatarenotbasedonobservablemarketdata.
The fair values of the financial assets and liabilities as determined by the IFRS 7 hierarchy are as follows:
le vel 1r’000
le vel 2r’000
le vel 3r’000
2009
Investments and loans 4 526 – 274 173
Derivative financial assets – 1 115 –
Long-term interest-bearing loans and borrowings – (2 340 202) –
Derivative financial liabilities – (181 957) –
4 526 (2 521 044) 274 173
The movement in fair value of assets measured at level 3 is as follows:
Balance as at 30 June 2008 248 574
Interest 22 973
Purchases 11 201
Exchange differences on consolidation of foreign subsidiaries (8 575)
Balance as at 30 June 2009 274 173
IFRS 7 does not require comparative disclosures in the first year of application of the amendments to IFRS 7.
notes to the annual fInancIal statements • steInhoff annual report 2009 • 149

notes to the annual fInancIal statementsfor the year ended 30 June 2009 (cont inued)
19. FINANCIAL INSTRUMeNTS (continued)19.3 Foreign currency risk
The group’s manufacturing and sourcing operating costs and expenses are principally incurred in South African rand, Polish zloty, US dollars, Hungarian forint and Ukrainian hryvna. Its revenue derived from outside southern Africa, however, is principally in euros, UK pounds, US dollars and Australian dollars. The group’s business model is based on the strategy of locating production in, and sourcing materials from, emerging low-cost economies and supplying finished products into developed economies.
It is group policy to hedge exposure to cash and future contracted transactions in foreign currencies for a range of forward periods, but not to hedge exposure for the translation of reported profits.
Exposure to currency riskCurrency risk (or foreign exchange risk) as defined by IFRS 7, arises on financial instruments that are denominated in a foreign currency, ie in a currency other than the functional currency in which they are measured. For the purpose of IFRS 7, currency risk does not arise from financial instruments that are non-monetary items or from financial instruments denominated in the functional currency.
Differences resulting from the translation of subsidiary financial statements into the group’s presentation currency are not taken into consideration.
The carrying amounts of the group’s material foreign currency denominated monetary assets and liabilities (excluding intragroup loan balances) that will have an impact on profit or loss when exchange rates change, at balance sheet date are as follows:
euroSr’000
uk poundSr’000
uS doLL arSr’000
2009
Investments and loans – – 40 524
Trade and other receivables (excluding prepayments) 334 485 9 259 24 642
Bank balances and cash 8 960 799 34 097
Long-term interest-bearing loans and borrowings – (920 740) (2 376 724)
Trade and other payables (398 661) (872) (22 341)
Bank overdrafts (4 560) (176) 840
Pre-derivative position (59 776) (911 730) (2 298 962)
Derivative effect (51 769) 733 2 276 084
Open position (111 545) (910 997) (22 878)
150 • steInhoff annual report 2009 • notes to the annual fInancIal statements
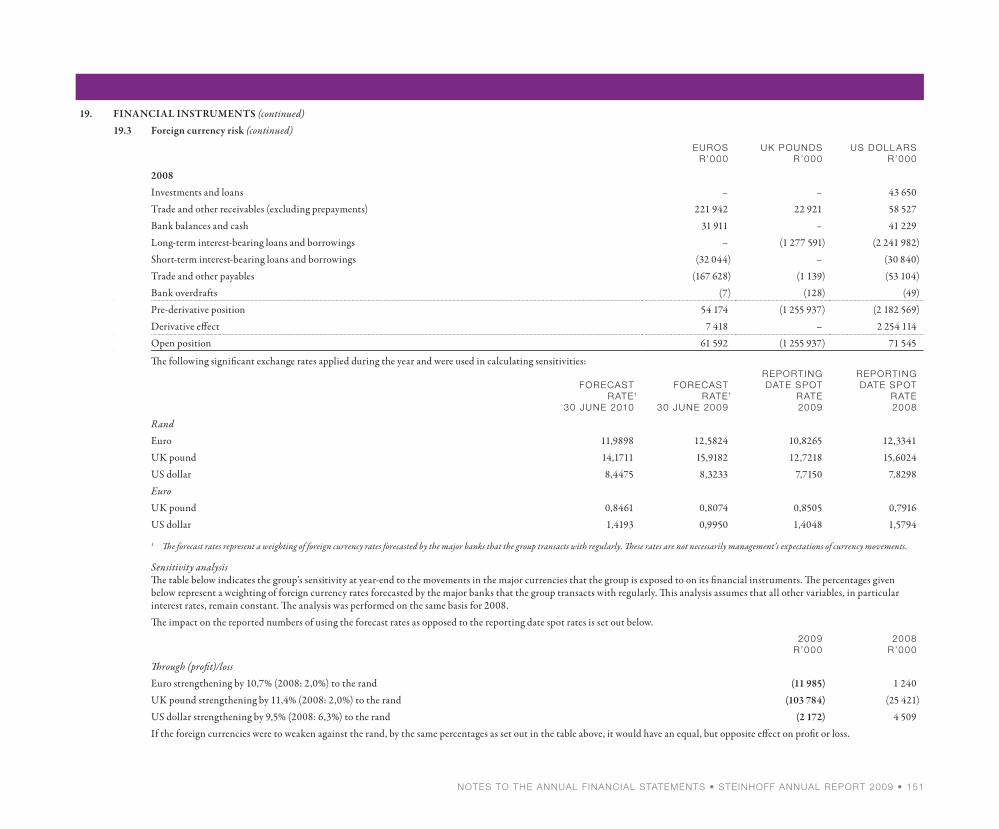
19. FINANCIAL INSTRUMeNTS (continued)19.3 Foreign currency risk (continued)
euroSr’000
uk poundSr’000
uS doLL arSr’000
2008
Investments and loans – – 43 650
Trade and other receivables (excluding prepayments) 221 942 22 921 58 527
Bank balances and cash 31 911 – 41 229
Long-term interest-bearing loans and borrowings – (1 277 591) (2 241 982)
Short-term interest-bearing loans and borrowings (32 044) – (30 840)
Trade and other payables (167 628) (1 139) (53 104)
Bank overdrafts (7) (128) (49)
Pre-derivative position 54 174 (1 255 937) (2 182 569)
Derivative effect 7 418 – 2 254 114
Open position 61 592 (1 255 937) 71 545
The following significant exchange rates applied during the year and were used in calculating sensitivities:
forecastr ate1
30 June 2010
forecastr ate1
30 June 2009
reportIng date Spot
r ate2009
reportIng date Spot
r ate2008
RandEuro 11,9898 12,5824 10,8265 12,3341
UK pound 14,1711 15,9182 12,7218 15,6024
US dollar 8,4475 8,3233 7,7150 7,8298
EuroUK pound 0,8461 0,8074 0,8505 0,7916
US dollar 1,4193 0,9950 1,4048 1,5794
1 The forecast rates represent a weighting of foreign currency rates forecasted by the major banks that the group transacts with regularly. These rates are not necessarily management’s expectations of currency movements.
Sensitivity analysisThe table below indicates the group’s sensitivity at year-end to the movements in the major currencies that the group is exposed to on its financial instruments. The percentages given below represent a weighting of foreign currency rates forecasted by the major banks that the group transacts with regularly. This analysis assumes that all other variables, in particular interest rates, remain constant. The analysis was performed on the same basis for 2008.
The impact on the reported numbers of using the forecast rates as opposed to the reporting date spot rates is set out below.2009
r’0002008
r’000
Through (profit)/lossEuro strengthening by 10,7% (2008: 2,0%) to the rand (11 985) 1 240
UK pound strengthening by 11,4% (2008: 2,0%) to the rand (103 784) (25 421)
US dollar strengthening by 9,5% (2008: 6,3%) to the rand (2 172) 4 509
If the foreign currencies were to weaken against the rand, by the same percentages as set out in the table above, it would have an equal, but opposite effect on profit or loss.
notes to the annual fInancIal statements • steInhoff annual report 2009 • 151

notes to the annual fInancIal statementsfor the year ended 30 June 2009 (cont inued)
2009 2008 ’000 ’000
19. FINANCIAL INSTRUMeNTS (continued)19.3 Foreign currency risk (continued)
Foreign exchange contractsThe group uses forward exchange contracts to hedge its foreign currency risk against the functional currency of its various global operations. Most of the forward exchange contracts have maturities of less than one year after balance sheet date. As a matter of policy, the group does not enter into derivative contracts for speculative purposes. The fair values of such contracts at year-end, by currency, were:
Net currency forward contracts to sell/(buy) foreign currency:
Australian dollar 9 975 28 000
Euro (32 290) 4 744
Japanese yen (2 643) (10 035)
Swedish kroner – (670)
Swiss franc – (176)
UK pound (208) –
US dollar (101 523) 19 340
The components of the fair value of derivative financial assets and liabilities are summarised below:
Short-term derivatives r’000 r’000
Assets
Fair value of foreign exchange contracts
Australian dollar 1 115 790
Euro – 16 327
Other – 9 904
1 115 27 021
152 • steInhoff annual report 2009 • notes to the annual fInancIal statements

2009 2008 r’000 r’000
19. FINANCIAL INSTRUMeNTS (continued)19.3 Foreign currency risk (continued)
Short-term derivatives (continued)LiabilitiesFair value of foreign exchange contracts
Australian dollar (5) –Euro (13 314) (8)Japanese yen (22) (12)Swedish kroner – (16)Swiss franc – (11)UK pound (176) –US dollar (75 372) (4 197)
(88 889) (4 244)Net derivative (liabilities)/assets (87 774) 22 777
Long-term derivativesInterest rate swaps and cross-currency derivatives (93 068) (467 598)
Currency options are only purchased as a cost-effective alternative to forward currency contracts.The group classifies certain of its forward exchange contracts that hedge forecast transactions as cash flow hedges. The fair value of such contracts recognised as derivative assets and liabilities and adjusted against the hedging reserve at year-end was:Fair value movement for the year (49 218) 15 111Deferred taxation 108 108Amount recognised in equity (49 110) 15 219The following table indicates the periods in which the cash flows associated with derivatives that are cash flow hedges are expected to occur:0 – 3 months 81 175 614 – 12 months 44 239 (862)Total expected cash flows 125 414 (801)The cash flow hedges have been applied against contractual firm orders to acquire plant and machinery and the effective portion of the hedges will be applied as a basis adjustment to the cost of such items.Changes in the fair value of forward exchange contracts of economically hedged monetary assets and liabilities in foreign currencies and for which no hedge accounting is applied, are recognised in profit or loss.
19.4 Interest rate riskGiven the group’s global footprint and its strategy of low-cost manufacturing and sourcing in emerging markets and sales in developed countries, the group follows a policy of maintaining a balance between fixed and variable rate loans to reflect, as accurately as possible, different interest rate environments, the stability of the relevant currencies, the effect which the relevant interest rates have on group operations and consumer spending within these environments. These variables are taken into account in structuring the group’s borrowings to achieve a reasonable, competitive, market-related cost of funding.As part of the process of managing the group’s borrowings mix, the interest rate characteristics of new borrowings and the refinancing of existing borrowings are positioned according to expected movements in interest rates. Interest rate exposure is managed within limits agreed by the board.The interest and related terms of the group’s interest-bearing loans are disclosed in note 28.
notes to the annual fInancIal statements • steInhoff annual report 2009 • 153

notes to the annual fInancIal statementsfor the year ended 30 June 2009 (cont inued)
19. FINANCIAL INSTRUMeNTS (continued)19.4 Interest rate risk (continued)
At the reporting date the interest rate profile of the group’s financial instruments were:subJect to Interest r ate movement
varIable L Iborr’000
varIable eurIbor
r’000
varIable J Ibar & sa
prImer’000
varIable otHer
r’000
fIxed r ate
r’000
non- IntereSt-
be arIngr’000
totaLr’000
2009Investments and loans 799 689 1 137 356 27 728 303 214 352 178 652 2 358 080Trade and other receivables (excluding prepayments) – – 29 752 – 5 301 7 158 088 7 193 141Short-term loans receivable – 792 770 – – – – 792 770Funds on call and deposit – – 589 81 – – 670Bank balances and cash 21 339 24 663 586 529 145 487 78 747 3 878 762 4 735 527Long-term interest-bearing loans and borrowings (1 028 030) (3 258 789) (1 934 376) (64 064) (6 418 532) (89) (12 703 880)Short-term interest-bearing loans and borrowings (372 886) (1 339 097) (2 399 091) (240 733) (398 657) (57 588) (4 808 052)Trade and other payables – – (351 291) – – (6 848 301) (7 199 592)Bank overdrafts – – (66 705) – (176) – (66 881)Pre-derivative position (579 888) (2 643 097) (4 106 865) (158 926) (6 518 965) 4 309 524 (9 698 217)Derivative effect – (2 431 567) 98 297 – 2 240 202 (87 774) (180 842)Open position (579 888) (5 074 664) (4 008 568) (158 926) (4 278 763) 4 221 750 (9 879 059)2008Investments and loans – – 249 881 – 871 577 151 587 1 273 045Trade and other receivables (excluding prepayments) – 120 924 78 644 9 862 17 826 6 221 841 6 449 097Short-term loans receivable – – 28 539 – 426 143 132 454 814Funds on call and deposit – – 268 853 – – 197 269 050Bank balances and cash 7 807 31 974 1 212 744 114 087 84 429 3 275 140 4 726 181Long-term interest-bearing loans and borrowings (1 213 355) (3 233 014) (1 633 873) – (6 603 853) (413) (12 684 508)Short-term interest-bearing loans and borrowings (30 840) – (1 528 748) – (189 413) (1 131 634) (2 880 635)Trade and other payables – – (189 918) – – (8 538 969) (8 728 887)Bank overdrafts – – (905 861) – (169 160) – (1 075 021)Pre-derivative position (1 236 388) (3 080 116) (2 419 739) 123 949 (5 562 451) (22 119) (12 196 864)Derivative effect – (2 679 620) – – 2 221 926 12 873 (444 821)Open position (1 236 388) (5 759 736) (2 419 739) 123 949 (3 340 525) (9 246) (12 641 685)
154 • steInhoff annual report 2009 • notes to the annual fInancIal statements

2009 2008 r’000 r’000
19. FINANCIAL INSTRUMeNTS (continued)19.4 Interest rate risk (continued)
Sensitivity analysisThe group is sensitive to movements in the LIBOR, EURIBOR, JIBAR and SA prime rates, which are the primary interest rates to which the group is exposed.The sensitivities calculated below are based on an increase of 100 basis points for each interest category. These rates are also used when reporting sensitivities internally to key management personnel.Through (profit)/lossLIBOR – 100 basis point increase 5 799 12 364EURIBOR – 100 basis point increase 50 747 57 597JIBAR & SA prime – 100 basis point increase 40 086 24 197A 100 basis point decrease in the above rates would have had an equal, but opposite effect on profit or loss.Cross-currency interest rate swap contractsThe group has entered into three cross-currency interest rate swap contracts to effectively convert fixed-interest US dollar borrowings into variable interest euro borrowings. The value of the group’s cross-currency interest rate swaps can effectively be split into two components: a portion that is attributable to converting a US dollar-denominated borrowing liability into a euro-denominated borrowing liability (the currency portion) – the value of this portion changes as currency exchange rates change; and a portion that is attributable to converting fixed-rate US dollar interest payments into variable rate euro interest payments (the interest portion) – the value of this portion of the swap changes as US dollar fixed-interest rates, euro variable interest rates and foreign currency exchange rates change.The swaps are dedicated to convert a total of US$284,5 million of the fixed-rate US dollar-denominated senior notes (note 28) to a variable rate euro liability. The interest rate swap was 90% (2008: 93%) effective during the year. The maturity dates of the swaps are identical to those of the underlying series of senior notes that they effectively hedge. Under the terms of the swaps, the group receives fixed interest at rates varying from 5,02% to 5,32% and pays floating rate interest at fixed spreads above the six-month EURIBOR rate. The interest payments are due bi-annually, with reset dates being the first day of each calculation period. The transaction has been accounted for as a fair value hedge and the embedded derivative contained within the transaction was calculated with the assistance of a major investment bank.The fair value of the swaps was estimated as a liability of R69,2 million (2008: R467,6 million) and is offset with the asset arising from the fair value of the underlying debt liability (the US dollar-denominated senior notes, see note 28) which effectively increased with a similar amount.The fixed-interest rate note purchase agreement liabilities are fair valued through profit or loss in order to eliminate the potential accounting mismatch arising from measuring the derivative cross-currency interest rate swaps at fair value through profit or loss.
19.5 other price risksEquity price sensitivity analysisDue to the listed investments of the group being immaterial (refer note 17), the exposure to equity risk is limited.
19.6 Credit riskPotential concentration of credit risk consists principally of short-term cash and cash equivalent investments, trade and other receivables, and loans receivable. The group deposits short-term cash surpluses with major banks of quality credit standing. Trade receivables comprise a large and widespread customer base and group companies perform ongoing credit evaluations on the financial condition of their customers, and appropriate use is made of credit guarantee insurance. At 30 June 2009, the group did not consider there to be any significant concentration of credit risk which had not been adequately provided for. The amounts presented in the balance sheet are net of provisions for bad debts, estimated by the group companies’ management based on prior experience and the current economic environment.The carrying amounts of financial assets represent the maximum credit exposure.
notes to the annual fInancIal statements • steInhoff annual report 2009 • 155

notes to the annual fInancIal statementsfor the year ended 30 June 2009 (cont inued)
2009 2008 r’000 r’000
19. FINANCIAL INSTRUMeNTS (continued)19.6 Credit risk (continued)
The maximum exposure to credit risk at the reporting date without taking account of the value of any collateral obtained was:Investments and loans 2 358 080 1 273 045Derivative financial assets 1 115 27 021Trade and other receivables (excluding prepayments) 7 193 141 6 449 097Short-term loans receivable 792 770 454 814Funds on call and deposit 670 269 050Bank balances and cash 4 735 527 4 726 181
15 081 303 13 199 208The maximum exposure to credit risk at the reporting date by segment was (carrying amounts):Retail customers 3 541 929 2 909 379– Household goods and building supplies 2 972 096 2 201 585– Automotive 569 833 707 794Manufacturing and sourcing customers 3 644 348 3 846 459Logistics customers 1 279 798 1 739 642Corporate customers 6 615 228 4 703 728– Brand management – 8 185– Investment participation 2 792 601 1 356 566– Central treasury and other activities 3 822 627 3 338 977
15 081 303 13 199 208The maximum exposure to credit risk at the reporting date by geographical region was (carrying amounts):Continental Europe 10 719 857 8 367 262Pacific Rim 217 309 376 107Southern Africa 2 857 046 3 874 196United Kingdom 1 244 471 425 189Other regions 42 620 156 454
15 081 303 13 199 208
156 • steInhoff annual report 2009 • notes to the annual fInancIal statements

19. FINANCIAL INSTRUMeNTS (continued)19.6 Credit risk (continued)
2009r’000
2009%
2008r’000
2008%
Ageing of financial assets
Not past due or impaired 14 336 705 95,1 12 565 216 95,2
Renegotiated terms 19 379 0,1 24 015 0,2
Past due 1 to 30 days but not impaired 311 860 2,1 244 650 1,8
Past due 31 to 60 days but not impaired 163 758 1,1 102 873 0,8
Past due 61 to 90 days but not impaired 97 109 0,6 58 882 0,4
Past due more than 90 days but not impaired 139 606 0,9 117 632 0,9
Past due but not impaired in full 12 886 0,1 85 940 0,7
Impaired balance 278 271 379 474
Impairment provision (265 385) (293 534)
15 081 303 100,0 13 199 208 100,0
2009r’000
2008r’000
Movement in provision for bad debts and impairments
Balance at beginning of the year (293 534) (175 989)
Additional provision raised (99 019) (36 719)
Amounts unused reversed 31 198 48 918
Amounts used during the year 23 310 5 353
Arising on acquisition of subsidiaries (4 092) (82 938)
Eliminated on disposal of subsidiaries and businesses 467 –
Exchange differences on consolidation of foreign subsidiaries 76 285 (52 159)
Balance at end of the year (265 385) (293 534)
The group has liens over items sold until full payment has been received from customers. The fair value of collateral held against these loans and receivables is linked to the value of the liens. Furthermore the group has credit insurance to cover its exposure to risk on receivables. On top of the liens over inventories, the group has collateral over other assets of counterparties valued at R196 million (2008: R59 million).
19.7 Liquidity risk
Liquidity risk is the risk that an entity will encounter difficulty in meeting its obligations associated with financial liabilities. Liquidity risk arises because of the possibility that the entity could be required to pay its liabilities earlier than expected.
The group manages liquidity risk by monitoring forecast cash flows and by ensuring that adequate borrowing facilities are available. Cash surpluses and short-term financing needs of manufacturing and sales companies are mainly centralised in African and European central offices. These central treasury offices invest net cash reserves on the financial markets, mainly in short-term instruments linked to variable interest rates.
notes to the annual fInancIal statements • steInhoff annual report 2009 • 157

notes to the annual fInancIal statementsfor the year ended 30 June 2009 (cont inued)
19. FINANCIAL INSTRUMeNTS (continued)19.7 Liquidity risk (continued)
The following table details the group’s remaining contractual maturity for its financial liabilities. The table has been drawn up on the undiscounted cash flows of financial liabilities based on the earliest date on which the group can be required to pay. The table includes both interest and principal cash flows:
0 to 3 montHS
r’000
4 to 12 montHS
r’000ye ar 2
r’000
ye ars 3 to 5r’000
af ter 5 ye ars
r’000
2009
Long-term interest-bearing loans and borrowings (378 009) (357 792) (5 149 692) (5 858 881) (4 144 395)
Short-term interest-bearing loans and borrowings (3 034 032) (2 381 069) – – –
Trade and other payables (6 883 587) (336 945) – – –
Derivative financial liabilities (67 665) (22 929) – (35 284) (56 081)
Bank overdrafts (66 881) – – – –
(10 430 174) (3 098 735) (5 149 692) (5 894 165) (4 200 476)
2008
Long-term interest-bearing loans and borrowings (169 958) (808 981) (2 161 404) (8 132 768) (5 860 727)
Short-term interest-bearing loans and borrowings (1 717 418) (1 326 965) – – –
Trade and other payables (8 557 072) (103 433) – – –
Derivative financial liabilities (4 244) – – (233 799) (233 799)
Bank overdrafts (1 075 020) – – – –
(11 523 712) (2 239 379) (2 161 404) (8 366 567) (6 094 526)
19.8 Treasury risk
A finance forum, consisting of senior executives of the group, meets on a regular basis to analyse currency and interest rate exposure and to review and, if required, adjust the group’s treasury management strategies in the context of prevailing and forecast economic conditions.
158 • steInhoff annual report 2009 • notes to the annual fInancIal statements

2009 2008
19. FINANCIAL INSTRUMeNTS (continued)19.9 Capital risk
The group manages its capital to ensure that entities in the group will be able to continue as going concerns while maximising the return to stakeholders through the optimisation of the debt and equity balance.
The capital structure of the group consists of debt, which includes the borrowings disclosed in note 28, cash and cash equivalents, and equity attributable to equity holders of the parent, comprising issued capital, reserves and retained earnings as disclosed in notes 24, 25 and 26.
The group’s risk management committee reviews the capital structure of the group on a semi-annual basis. As a part of this review, the committee considers the cost of capital and the risks associated with each class of capital. Based on recommendations of the committee, the group will balance its overall capital structure through the payment of dividends, new share issues and share buy-backs as well as the issue of new debt or the redemption of existing debt.
The group’s overall strategy remains unchanged from 2008.
20. INVeNToRIeS r’000 r’000
20.1 Inventories at cost less provisions
Consumables and spares 254 434 240 386
Development properties 4 182 7 433
Finished goods 3 164 087 3 565 669
Packing materials 764 698
Raw materials 363 447 484 210
Vehicles 849 415 1 123 155
Work-in-progress 120 633 131 482
4 756 962 5 553 033
20.2 Inventories carried at net realisable value 502 979 577 997
20.3 Amount of write-down of inventories to net realisable value included as an expense during the year 3 482 5 921
Included in the above are vehicles relating to the operations of Unitrans, which are subject to amounts payable of R617 million (2008: R475 million) in respect of the manufacturers’ floorplan financing, comprising of interest-bearing and interest-free amounts and which are included in trade and other payables.
notes to the annual fInancIal statements • steInhoff annual report 2009 • 159

notes to the annual fInancIal statementsfor the year ended 30 June 2009 (cont inued)
2009 2008 r’000 r’000
21. TRADe AND oTHeR ReCeIVABLeS
Trade receivables 7 137 767 6 465 745
Less: Provision for bad debts – trade receivables (264 779) (293 197)
Less: Provision for credit notes and discounts (81 901) (107 258)
6 791 087 6 065 290
Other amounts due 402 660 384 144
Less: Provision for bad debts – other receivables (606) (337)
Trade and other receivables (excluding prepayments) 7 193 141 6 449 097
Prepayments 547 376 852 509
7 740 517 7 301 606
The credit period on sales of goods is between 30 and 90 days. Where relevant, interest is charged at market-related rates on outstanding balances.
Before accepting any new customers, credit risk management uses various credit bureaux and performs credit assessments to assess the potential customer’s credit potential and credit limit. The credit limits are reviewed on a regular basis as and when increased limits are required. Customers with material balances are subject to additional security requirements or are insured as appropriate.
In determining the recoverability of a customer, the group considers any change in the credit quality of the customer from the date credit was initially granted up to the reporting date.
Given the diverse nature of the group’s operations (both geographically and segmentally), it does not have significant concentration of credit risk in respect of trade receivables, with exposure spread over a large number of customers. Accordingly, the directors believe that there is no further credit provision required in excess of the provision for bad debts.
No customer represents more than 5% of the total trade receivables at year-end.
R50 million (2008: R34 million) of the BCM group trade receivables, as well as the applicable insurance policies was ceded in favour of facilities with banks.
The group’s exposure to currency and credit risk related to trade and other receivables is disclosed in note 19.3 and 19.6.
160 • steInhoff annual report 2009 • notes to the annual fInancIal statements

2009 2008 2009 2008 r’000 r’000
22. SHoRT-TeRM LoANS ReCeIVABLe
These loans are made to various entities, including suppliers. The loans are unsecured, interest-bearing and repayable on demand. 792 770 454 814
The group’s exposure to currency and credit risk related to short-term loans receivable are disclosed in note 19.3 and 19.6.
23. ASSeTS CLASSIFIeD AS HeLD FoR SALe
The directors resolved to dispose of certain items of property, plant and equipment and vehicle rental fleet in the Unitrans group and Rotique Timbers Natal (Proprietary) Limited. The property, plant and equipment and vehicle rental fleet are included in automotive services and manufacturing and sourcing of household goods and building supplies respectively for segmental purposes. The proceeds on disposal are expected to exceed the net carrying amount of the property, plant and equipment and vehicle rental fleet, and accordingly no impairment losses have been recognised.
These assets are available for immediate sale in their present condition. Management is committed to the sale, which is expected to occur within 12 months of being classified as held for sale.
The carrying amount of total assets held for sale still carried on the balance sheet is:
Property, plant and equipment 27 531 41 205
Vehicle rental fleet 1 715 1 416
29 246 42 621
number of
SHareSnumber of
SHareS r’000 r’000
24. oRDINARY SHARe CAPITAL AND PReMIUM
24.1 Authorised
Ordinary shares of 0,5 cents each 3 000 000 000 3 000 000 000 15 000 15 000
24.2 Issued
Shares in issue at beginning of the year 1 349 719 254 1 294 350 381 6 749 6 472
Shares issued during the year 19 698 873 55 368 873 98 277
Shares in issue at end of the year 1 369 418 127 1 349 719 254 6 847 6 749
24.3 Share premium
Balance at beginning of the year 6 175 721 5 867 820
Profit on treasury share transactions – 4 920
Share issue expenses (71) (337)
Share premium arising on issue of shares 10 382 953 063
Capital distribution (821 651) (649 745)
Balance at end of the year 5 364 381 6 175 721
notes to the annual fInancIal statements • steInhoff annual report 2009 • 161

notes to the annual fInancIal statementsfor the year ended 30 June 2009 (cont inued)
2009 2008 2009 2008
number of
SHareS number of
SHareS r’000 r’000
24. oRDINARY SHARe CAPITAL AND PReMIUM (continued)24.4 Treasury shares
Balance at beginning of the year (80 976 206) (37 897 095) (1 680 994) (870 062)
Disposal of shares – 4 634 771 – 187 545
Issue of shares in terms of the deferred delivery share schemes 1 234 304 3 017 223 10 822 15 383
Issue of shares in terms of the share rights schemes 12 979 697 17 922 360 65 90
Issue of shares to Steinhoff International Share Trust (19 698 873) (14 364 360) (10 480) (72)
Purchases of shares (2 610 978) (54 289 105) (33 311) (1 029 718)
Capital distribution – – 60 751 15 840
Balance at end of the year (89 072 056) (80 976 206) (1 653 147) (1 680 994)
Total issued ordinary share capital and premium 1 280 346 071 1 268 743 048 3 718 081 4 501 476
24.5 Movement of net share capital and premium
Balance at beginning of the year 4 501 476 5 004 230
Movement for the year (22 495) 131 151
Issue of shares in terms of the deferred delivery share schemes 10 822 15 383
Issue of shares in terms of the share rights schemes 65 90
Net shares issued – 953 268
Purchases of shares (33 311) (1 029 718)
Share issue expenses (71) (337)
Treasury shares sold – 192 465
Capital distribution (760 900) (633 905)
Balance at end of the year 3 718 081 4 501 476
The holders of ordinary shares are entitled to receive dividends as declared from time to time and are entitled to one vote per share at the meetings of the company.
162 • steInhoff annual report 2009 • notes to the annual fInancIal statements
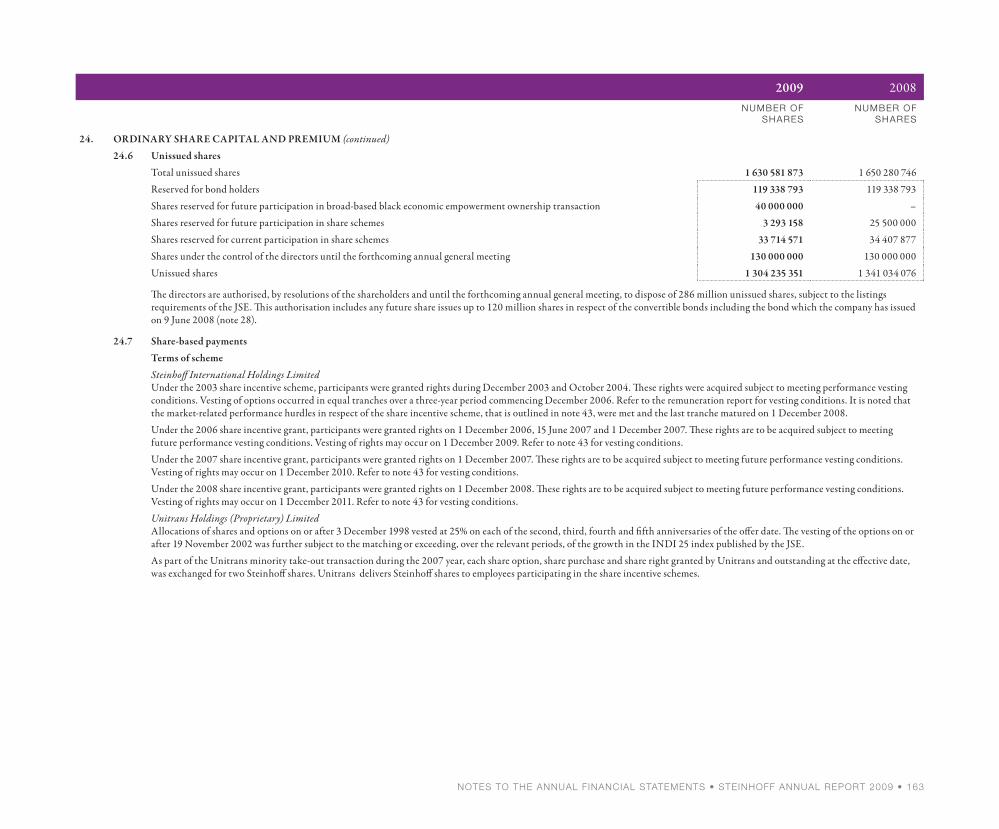
2009 2008 number of
SHareSnumber of
SHareS
24. oRDINARY SHARe CAPITAL AND PReMIUM (continued)24.6 Unissued shares
Total unissued shares 1 630 581 873 1 650 280 746
Reserved for bond holders 119 338 793 119 338 793
Shares reserved for future participation in broad-based black economic empowerment ownership transaction 40 000 000 –
Shares reserved for future participation in share schemes 3 293 158 25 500 000
Shares reserved for current participation in share schemes 33 714 571 34 407 877
Shares under the control of the directors until the forthcoming annual general meeting 130 000 000 130 000 000
Unissued shares 1 304 235 351 1 341 034 076
The directors are authorised, by resolutions of the shareholders and until the forthcoming annual general meeting, to dispose of 286 million unissued shares, subject to the listings requirements of the JSE. This authorisation includes any future share issues up to 120 million shares in respect of the convertible bonds including the bond which the company has issued on 9 June 2008 (note 28).
24.7 Share-based payments
Terms of scheme
Steinhoff International Holdings LimitedUnder the 2003 share incentive scheme, participants were granted rights during December 2003 and October 2004. These rights were acquired subject to meeting performance vesting conditions. Vesting of options occurred in equal tranches over a three-year period commencing December 2006. Refer to the remuneration report for vesting conditions. It is noted that the market-related performance hurdles in respect of the share incentive scheme, that is outlined in note 43, were met and the last tranche matured on 1 December 2008.
Under the 2006 share incentive grant, participants were granted rights on 1 December 2006, 15 June 2007 and 1 December 2007. These rights are to be acquired subject to meeting future performance vesting conditions. Vesting of rights may occur on 1 December 2009. Refer to note 43 for vesting conditions.
Under the 2007 share incentive grant, participants were granted rights on 1 December 2007. These rights are to be acquired subject to meeting future performance vesting conditions. Vesting of rights may occur on 1 December 2010. Refer to note 43 for vesting conditions.
Under the 2008 share incentive grant, participants were granted rights on 1 December 2008. These rights are to be acquired subject to meeting future performance vesting conditions. Vesting of rights may occur on 1 December 2011. Refer to note 43 for vesting conditions.
Unitrans Holdings (Proprietary) LimitedAllocations of shares and options on or after 3 December 1998 vested at 25% on each of the second, third, fourth and fifth anniversaries of the offer date. The vesting of the options on or after 19 November 2002 was further subject to the matching or exceeding, over the relevant periods, of the growth in the INDI 25 index published by the JSE.
As part of the Unitrans minority take-out transaction during the 2007 year, each share option, share purchase and share right granted by Unitrans and outstanding at the effective date, was exchanged for two Steinhoff shares. Unitrans delivers Steinhoff shares to employees participating in the share incentive schemes.
notes to the annual fInancIal statements • steInhoff annual report 2009 • 163

notes to the annual fInancIal statementsfor the year ended 30 June 2009 (cont inued)
2009 2008
number of
rIgHtS number of
rIgHtS
24. oRDINARY SHARe CAPITAL AND PReMIUM (continued)24.7 Share-based payments (continued)
The number of share rights, for the above schemes, accounted for under IFRS 2 – Share-based payments (IFRS 2) is:
Outstanding at beginning of the year 35 396 630 41 752 297
Exercised during the year (12 979 697) (17 922 360)
Forfeited during the year (1 686 147) (248 816)
Granted during the year 15 206 842 11 815 509
Outstanding at end of the year 35 937 628 35 396 630
Exercisable at end of the year 1 489 100 2 600 794
r’000 r’000
Share-based payment reserve accounted for under IFRS 2 , is as follows:
Balance at beginning of the year 375 335 317 755
Deferred tax released on share-based payments (18 034) (21 367)
Employee expenses 66 372 78 947
Granted during the year 8 474 17 504
Forfeited during the year (3 869) (1 588)
Unlocking of the scheme 61 767 63 031
Balance at end of the year 423 673 375 335
Refer to note 43 for directors’ interests in the share incentive scheme.
164 • steInhoff annual report 2009 • notes to the annual fInancIal statements

24. oRDINARY SHARe CAPITAL AND PReMIUM (continued)24.7 Share-based payments (continued)
Assumptions
Steinhoff International Holdings LimitedThe fair value of services received in return for share rights granted is measured by reference to the fair value of the share rights granted. The estimated fair value of the services received is measured based on the assumption that all vesting conditions are met and all employees remain in service. The pricing model used was the Black-Schöles model. The volatility was estimated using the Steinhoff daily closing share price over a rolling three-year period.
2008 aLLocatIon
december 2008
gr ant
2007 aLLocatIon
december 2007
gr ant
2006 aLLocatIon
december 2007
gr ant
2006 aLLocatIon
June 2007
gr ant
2006 aLLocatIon
december 2006
gr ant
2003 aLLocatIon
december 2003
gr ant
Fair value of share rights and assumptions:Fair value at measurement date R2,87 R9,47 R2,46 R5,14 R12,12 R3,60–R3,80Share price at grant date – December 2003 – – – – – R7,02Share price at grant date – October 2004 – – – – – R8,61Share price at grant date – December 2006 – – – – R23,19 –Share price at grant date – June 2007 – – – R22,65 – –Share price at grant date – December 2007 – R19,08 R19,08 – – –Share price at grant date – December 2008 R9,74 – – – – –Exercise price R0,005 R0,005 R0,005 R0,005 R0,005 R0,005Expected volatility 64,09% 30,52% 31,57% 27,33% 26,88% 31,00%Dividend yield 3,67% 2,20% 2,20% 1,48% 1,52% 2,50%Risk-free interest rate 8,53% 9,08% 9,53% 8,58% 8,18% 7,78%Option life 3 years 3 years 2 years 2,5 years 3 years 5 years
Unitrans Holdings (Proprietary) LimitedThe options outstanding at the end of the year have a weighted average remaining contractual life of 4,6 years (2008: 5,6 years).Share rights were granted on 24 November 2006 (the grant date) at R0,10 per share right. Share rights with regard to 2005 did not vest as not all of the vesting conditions were met. Rights with regard to 2006 will vest and mature on 24 November 2009, provided that the vesting conditions are met. The estimated fair value of a 2005 share right was R15,07 and a 2006 right was R15,16 per share right on the date of exchange to Steinhoff shares.
24.8 Steinhoff International Share TrustTerms of schemeThe share incentive schemes were approved at the annual general meetings on 6 December 1999 and 1 December 2003. Rights were allocated in terms of a deferred delivery scheme.
2009 number of
rIgHtS
2008number of
rIgHtS
Outstanding at beginning of the year 16 788 718 33 543 613Exercised during the year (16 175 265) (20 939 583)Forfeited during the year (156 286) (705 312)Purchased during the year – 4 890 000Outstanding at end of the year 457 167 16 788 718
Refer to note 43 for directors’ interests in the Steinhoff International Share Trust Scheme.
notes to the annual fInancIal statements • steInhoff annual report 2009 • 165

notes to the annual fInancIal statementsfor the year ended 30 June 2009 (cont inued)
2009 2008 r’000 r’000
25. ReSeRVeS AND MINoRITY INTeReSTS
Distributable reserves 15 782 759 12 521 948
Balance at beginning of the year 12 521 948 9 372 749
Profit for the year attributable to equity holders of the parent 3 378 878 3 310 037
Preference dividends (117 975) (102 153)
Treasury shares issued in terms of share-based payment schemes – (66 598)
Net transfers (to)/from other reserves (92) 7 913
other reserves 1 520 481 3 749 523
17 303 240 16 271 471
Minority interests
Balance at beginning of the year 2 968 732 82 121
Acquired on acquisition of subsidiaries – 16 687
Arising on acquisition of subsidiaries 39 707 2 170 073
Dividends paid (39 273) (17 486)
Increase in investment in subsidiaries – (354)
Shares sold to minority equity holders 584 –
Minorities’ share of the foreign currency translation reserve (382 468) 640 558
Profit for the year attributable to minorities 248 606 125 571
Take-out of minorities – NECF – (48 243)
Exchange differences on consolidation of foreign subsidiaries 24 070 (195)
Balance at end of the year 2 859 958 2 968 732
166 • steInhoff annual report 2009 • notes to the annual fInancIal statements

actuarIaL gaInS
reserver’000
cash flow HedgIng & otHer
faIr value reserves
r’000
convertIble & redeem-
abLe bondS reserve
r’000
foreIgn currency
tranSLatIon reserve
r’000
SHare-baSed
payment reserve
r’000
statutory reserves
r’000totaLr’000
25. ReSeRVeS AND MINoRITY INTeReSTS (continued)other reserves
Balance at 1 July 2007 60 309 (12 444) 220 712 1 267 475 317 755 2 162 1 855 969
Actuarial losses (2 331) – – – – – (2 331)
Actuarial losses – deferred taxation (10 806) – – – – – (10 806)
Cash flow hedges capitalised to assets – (264) – – – – (264)
Convertible bonds – equity portion – – 191 306 – – – 191 306
Convertible bonds – deferred taxation – – (59 162) – – – (59 162)
Eliminated on disposal of subsidiaries – – – – – 554 554
Fair value adjustments on available for sale financial assets – (3 157) – – – – (3 157)
Insurance contingency reserves – – – – – (7 913) (7 913)
Restatement of cash flow hedges to fair value – 15 111 – – – – 15 111
Restatement of cash flow hedges to fair value – deferred taxation – 108 – – – – 108
Share-based payments – – – – 78 947 – 78 947
Share-based payments – deferred taxation – – – – (21 367) – (21 367)
Minorities’ share of the foreign currency translation differences – – – (640 558) – – (640 558)
Exchange differences on consolidation of foreign subsidiaries – – – 2 353 086 – – 2 353 086
Balance at 30 June 2008 47 172 (646) 352 856 2 980 003 375 335 (5 197) 3 749 523
Actuarial losses (30 907) – – – – – (30 907)
Actuarial losses – deferred taxation 8 477 – – – – – 8 477
Release of depreciation of at acquisition fair value adjustments to distributable reserves – – – – – (1 066) (1 066)
Foreign currency translation reserve released on disposal of subsidiary – – – (4 776) – (625) (5 401)
Fair value adjustments on available for sale financial assets – 132 – – – – 132
Insurance contingency reserves – – – – – 1 158 1 158
Restatement of cash flow hedges to fair value – (49 218) – – – – (49 218)
Restatement of cash flow hedges to fair value – deferred taxation – 108 – – – – 108
Share-based payments – – – – 66 372 – 66 372
Share-based payments – deferred taxation – – – – (18 034) – (18 034)
Minorities’ share of the foreign currency translation differences – – – 382 468 – – 382 468
Exchange differences on consolidation of foreign subsidiaries – – – (2 583 131) – – (2 583 131)
Balance at 30 June 2009 24 742 (49 624) 352 856 774 564 423 673 (5 730) 1 520 481
notes to the annual fInancIal statements • steInhoff annual report 2009 • 167

notes to the annual fInancIal statementsfor the year ended 30 June 2009 (cont inued)
25. ReSeRVeS AND MINoRITY INTeReSTS (continued)Distributable reserves
The accumulated distributable reserves, if declared as a cash dividend, would be subject to secondary taxation on companies.
Actuarial gains reserve
Comprises actuarial gains or losses on defined benefit plans and post-retirement medical benefits recognised in equity.
Cash flow hedging reserve and fair value reserves
Comprise the cumulative net change in the fair value of available for sale assets until the investment is derecognised as well as cash flow hedges recognised in equity.
Convertible and redeemable bonds reserve
This represents the equity component of the convertible and redeemable bonds (note 28).
Foreign currency translation reserve
Comprises all foreign exchange differences arising from the translation of the financial statements of foreign operations.
Share-based payment reserve
Comprises the net fair value of equity instruments granted to employees expensed under share incentive schemes.
Statutory reserves
Comprise reserves in terms of statutory requirements.
168 • steInhoff annual report 2009 • notes to the annual fInancIal statements

2009 2008 2009 2008
number of
SHareS number of
SHareS r’000 r’000
26. PReFeReNCe SHARe CAPITAL AND PReMIUM26.1 Authorised
Steinhoff Variable rate, non-cumulative, non-redeemable, non-participating preference shares of 0,1 cents each 1 000 000 000 1 000 000 000 1 000 1 000Steinhoff InvestmentVariable rate, cumulative, non-redeemable, non-participating preference shares of 0,1 cents each 495 000 000 495 000 000 495 495
26.2 IssuedSteinhoff InvestmentIn issue at beginning and end of the year 15 000 000 15 000 000 15 15
26.3 Share premiumBalance at beginning and end of the year 1 549 229 1 549 229
26.4 Treasury shares (4 615 755) (4 615 755) (506 770) (506 770)Total issued preference share capital and premium 10 384 245 10 384 245 1 042 474 1 042 474
Terms of issued preference sharesThe preference shares earn dividends on the issue price at the rate of 75% of the SA prime lending rate quoted by Absa Bank Limited or its successor in title in South Africa. Although the rights to receive dividends are cumulative, declaration of such dividends is at the discretion of the board of directors of Steinhoff Investment.The directors are authorised, by resolution of the shareholders and until the forthcoming annual general meeting, to dispose of the unissued shares, subject to the listings requirements of the JSE relating to a general authority of directors to issue shares for cash.
27. BRoAD-BASeD BLACK eCoNoMIC eMPoWeRMeNT (B-BBee) oWNeRSHIP TRANSACTIoNS
27.1 Steinhoff Sikhulasonke Investments (Proprietary) Limited (Sikhulasonke)On 2 December 2008 Steinhoff introduced its B-BBEE ownership transaction to the participating staff members. This transaction was approved at the annual general meeting held on 1 December 2008. The transaction was well received by staff and a detailed roll-out and implementation programme commenced in January 2009. This transaction introduced Steinhoff ’s permanent South African staff and black management as shareholders.Sikhulasonke acquired 40 million Steinhoff shares. This was funded by the issue of variable rate cumulative redeemable preference shares to Steinhoff Investment to the same value as the purchase price of the 40 million shares. Steinhoff Investment retained 18% of the ordinary share capital in Sikhulasonte for awarding to future participants of this scheme. It was concluded that Steinhoff Investment retains, due to the redeemable preference shares, the majority of the residual ownership risks related to Sikhulasonke and therefore should consolidate Sikhulasonke in terms of SIC 12 – Consolidation of Special Purpose Entities (SIC 12).
27.2 Fundiswa Investments (Proprietary) Limited (Fundiswa)During the 2005 financial year, Unitrans entered into a B-BBEE transaction with Fundiswa in terms of which Steinhoff assisted Fundiswa to obtain its Unitrans investment (converted to Steinhoff shares on the share exchange in 2007). Steinhoff retained the majority of the risks and rewards pertaining to the 23,2 million shares held by Fundiswa, resulting in the effective consolidation of Fundiswa in terms of SIC 12. These shares are treated as treasury shares on consolidation.The purchase of the equity instruments by Fundiswa is currently funded by cumulative, non-convertible, redeemable preference shares on which Fundiswa pays and accrues dividends at 67% of the SA prime interest rate. Steinhoff guaranteed the “A” preference shares through a put option and Fundiswa issued 6% cumulative, non-convertible, redeemable “B” preference shares to Steinhoff Investment as consideration for the put option.
27.3 Micawber 455 (Proprietary) Limited (Micawber)During the 2006 financial year, Steinhoff entered into an agreement with a B-BBEE party to obtain ordinary shares in an associate company, KAP International Holdings Limited (KAP). The B-BBEE party obtained equity instruments of the associate company through a new entity called Micawber. Micawber purchased the ordinary shares at a purchase price of R84,6 million. The transaction was funded through “A” preference shares on which Micawber pays and accrues dividends at 67% of the SA prime interest rate. Micawber also has an obligation to Steinhoff Investment, as a “B” preference shareholder, at 6% of the “A” preference share capital and dividends outstanding. In addition, Micawber and Steinhoff Africa entered into an equity-sharing arrangement whereby the parties agree to share the surplus equity interest resulting from the potential disposal of the shares based on a formula dependent on the timing of the potential disposal.Steinhoff does not control or have any interests in Micawber, but retains the majority of the risks and rewards pertaining to the KAP shares held by Micawber until the funding obligation has been repaid. The effective interest of Micawber’s shareholding in KAP was therefore accounted for as an increase in the holding of the group in KAP (effective consolidation of Micawber).
notes to the annual fInancIal statements • steInhoff annual report 2009 • 169

notes to the annual fInancIal statementsfor the year ended 30 June 2009 (cont inued)
2009 2008 r’000 r’000
28. INTeReST-BeARING LoANS AND BoRRoWINGS 28.1 Analysis of closing balance
Secured financingCapitalised finance lease and instalment sale agreements 74 574 73 995Long-term licence fee liability – 42 303Mortgage and term loans 950 970 1 370 230Phaello domestic medium-term note programme 304 004 –
1 329 548 1 486 528Unsecured financing
Convertible bonds (debt portions) 2 820 520 2 672 020Unitrans domestic medium-term note programme 1 420 019 1 424 019Promissory note programme 100 363 –Note purchase agreement 2 594 625 2 531 833Preference shares: Fundiswa 381 864 358 424Preference shares: Micawber 107 179 97 423Syndicated loan facilities 3 795 821 3 744 411Term loans 752 418 753 848Other loans 72 910 23 655
12 045 719 11 605 633Total interest-bearing loans and borrowings 13 375 267 13 092 161Portion payable before 30 June 2010 included in current liabilities (671 387) (407 653)Total non-current interest-bearing loans and borrowings 12 703 880 12 684 508
Except for the note purchase agreement carried at fair value, all other loans and borrowings are carried at amortised cost. The fair values of interest-bearing loans and borrowings are disclosed in note 19.Current interest-bearing loans and borrowings
Portion of non-current interest-bearing loans and borrowings payable before 30 June 2010 671 387 407 653Other current loans payable 4 136 665 2 472 982
Total current interest-bearing loans and borrowings 4 808 052 2 880 635
170 • steInhoff annual report 2009 • notes to the annual fInancIal statements

2009 2008 r’000 r’000
28. INTeReST-BeARING LoANS AND BoRRoWINGS (continued)28.2 Analysis of repayment
Repayable within the next year and thereafterNext year 4 808 052 2 880 635Within two to five years 9 326 178 8 119 729Thereafter 3 377 702 4 564 779
17 511 932 15 565 143
28.3 Loan details
facIl It y
’000maturIt y
dateIntereSt
r ate
SecuredCapitalised finance lease and instalment sale agreements – – 10,5% to 13,6% 74 574 73 995
Secured hire purchase and lease agreements repayable in monthly or annual instalments over periods of five to eight years. These leases are with various counterparties.
Long-term licence fee liability – 15 July 2008 – – 42 303This loan was repaid during the year under review.
Mortgage loanLoans with various banks, repayable over various repayment terms and secured under mortgage bonds over various properties in Germany in favour of the relevant banks.
€85 160 Various 3,05% to 6,13% 592 773 895 567
Term loansThis loan was repaid during the year. $5 700 30 June 2011 LIBOR plus 3% – 30 840This term loan is repayable in semi-annual instalments. This loan is secured by a charge over assets of the Relyon group.
£4 040 30 June 2012 LIBOR plus 0,75%
51 415 83 823
The loan facility is repayable at maturity date and bears interest at JIBAR plus 0,9% per annum, calculated according to selected interest periods. A general notarial bond in favour of noteholders and bank creditors is registered against this loan.
R500 000 27 August 2009 JIBAR plus 0,9%
200 766 360 000
This term loan is repayable in monthly instalments. This loan is secured by a charge over assets financed by this loan.
Pula 80 000 30 June 2012 Botswana prime minus 2,65%
64 064 –
This term loan is repayable in quarterly instalments. This loan is secured by a charge over assets with a book value of R51 064 815 (BIM = Banco International Mozambique rate).
MET 106 614 9 April 2014 BIM plus 1% 36 522 –
The loan facility is repayable in monthly instalments and bears interest at SA prime minus 1% per annum, calculated according to selected interest periods.
R5 430 1 April 2011 SA prime minus 1%
5 430 –
Phaello domestic medium-term note programme R5 000 000This loan facility is repayable at maturity date and bears interest at JIBAR plus 3% per annum. Interest is payable quarterly.
27 March 2011 JIBAR plus 3% 103 072 –
These senior secured floating rate notes bear interest at JIBAR plus 3,3% and are redeemable at maturity. Interest is payable quarterly.
6 July 2012 JIBAR plus 3,3%
200 932 –
The book value of assets encumbered in favour of the above mortgage and term loans and finance lease and instalment sale agreements amounts to R1 612 276 000 (2008: R1 503 271 000) (note 11).
notes to the annual fInancIal statements • steInhoff annual report 2009 • 171

2009 2008
facIl It y
’000maturIt y
dateIntereSt
r ate r’000 r’000
28. INTeReST-BeARING LoANS AND BoRRoWINGS (continued)28.3 Loan details (continued)
UnsecuredConvertible bond due 2013 R1 500 000 31 July 2013 5,7% 1 313 569 1 271 661
The bond is convertible to 54,74 million ordinary shares of Steinhoff at R27,40 per ordinary share. The coupon rate is 5,7% per annum. The fair values of the liability component and the equity conversion component were determined at issuance of the bond.
Convertible bond due 2015 R1 600 000 20 July 2015 9,625% 1 506 951 1 400 359 The bond is convertible to 64,59 million ordinary shares of Steinhoff at R24,77 per ordinary share. The coupon rate is 9,625% per annum and the redemption price is 120%. The fair values of the liability component and the equity conversion component were determined at issuance of the bond.The fair values of the liability components of both bonds were calculated using market interest rates for equivalent non-convertible bonds. The residual amounts, representing the values of the equity conversion components, are included in shareholders’ equity in other reserves (note 25), net of deferred taxes.
Unitrans domestic medium-term note programme R2 000 000UTR01 – domestic medium-term note 31 August 2010 9,5% 412 667 412 667 Note with a nominal value of R400 million and a coupon rate of 9,5%. The effective interest rate is 9,34%. Interest is payable semi-annually in arrears on 28 February and 31 August of each year, commencing on 31 August 2005.UTR02 – senior unsecured fixed rate notes 21 November 2012 10,49% 1 007 352 1 011 352 Note with a nominal value of R1 billion and a coupon rate of 10,49%. Interest is payable semi-annually in arrear on 21 May and 21 November of each year, commencing on 21 November 2007.Subsequent to year-end this issue has given notice to increase the programme to R3 500 000 000.Steinhoff, Steinhoff Africa and certain Unitrans subsidiaries have committed themselves as guarantors in respect of the Unitrans note programme.
Promissary note programme 5 December 2013 to 29 May 2014
11,20% to 11,53%
100 363 –
notes to the annual fInancIal statementsfor the year ended 30 June 2009 (cont inued)
172 • steInhoff annual report 2009 • notes to the annual fInancIal statements

2009 2008
facIl It y
’000maturIt y
date IntereSt r ate r’000 r’000
28. INTeReST-BeARING LoANS AND BoRRoWINGS (continued)28.3 Loan details (continued)
Note purchase agreement
Senior notes series A $142 500 15 March 2012 EURIBOR plus 0,82% 1 172 154 1 122 961
Senior notes series B $142 000 15 March 2015 EURIBOR plus 0,88% 1 168 048 1 119 021
Senior notes series C €23 500 15 March 2012 4,10% 254 423 289 851
The group has entered into a combined cross-currency interest rate swap on the series A and B loans (note 19). The series A and B loans are fair valued through profit or loss in order to eliminate the accounting mismatch arising from measuring the derivative hedging instrument through profit or loss.
Steinhoff has subordinated shareholders’ loans due from Steinhoff Europe AG (Austria), amounting to €275 million, and due from Steinhoff Möbel Holdings Alpha GmbH, amounting to €56,3 million until the senior debt has been unconditionally and irrevocably paid and discharged in full.
Preference shares: Fundiswa – 31 August 2010 67% of SA prime 381 864 358 424
“A” redeemable preference shares issued by Fundiswa with a par value of R1 per share.
Preference shares: Micawber – 15 December 2010 67% of SA prime 107 179 97 423
“A” redeemable preference shares issued by Micawber with a par value of R1 per share.
Syndicated loan facilities
Revolving credit facility* €235 000 31 July 2010 EURIBOR plus 0,85% 2 490 095 2 035 127
Revolving credit facility £30 000 30 November 2009 EURIBOR plus 2,75% 384 965 431 688
Term loan £30 000 30 June 2011 LIBOR plus 0,50% 297 023 405 091
Term loan £70 000 30 June 2012 LIBOR plus 0,50% 623 738 872 505
Steinhoff has subordinated shareholders’ loans due from Steinhoff Europe AG (Austria), amounting to €275 million, and due from Steinhoff Möbel Holdings Alpha GmbH, amounting to €56,3 million until the senior debt has been unconditionally and irrevocably paid and discharged in full.
Term loans
Term loan repayable at maturity date and bears interest at JIBAR plus 1% per annum, payable monthly.
R550 000 30 September 2010 JIBAR plus 1,00% 450 265 450 162
This term loan is repayable at maturity date and bears interest at JIBAR plus 1,15% per annum, calculated quarterly.
R740 000 30 September 2010 JIBAR plus 1,15% 302 153 303 686
Other loans – various various 72 910 23 655
13 375 267 13 092 161* Subsequent to year-end, Steinhoff Europe received firm proposals in respect of refinancing the €235 million syndicated loan facility due 31 July 2010. It is expected that this will extend the loan facility to beyond 2012.
This will have the effect that the margin relating to this loan will increase during the next financial year.
notes to the annual fInancIal statements • steInhoff annual report 2009 • 173

2009 2008
maturIt y date IntereSt r ate r’000 r’000
28. INTeReST-BeARING LoANS AND BoRRoWINGS (continued)28.3 Loan details (continued)
Current interest-bearing loans and borrowings•
Bank loans at variable interest rates Varying repayment terms 5% to 15% 3 592 666 2 113 897
Commercial paper 16 July 2009 to 23 June 2010 9% to 11,6% 449 411 –
Glenrand Premier Finance Solutions (Proprietary) Limited 1 March 2010 SA prime minus 1,8% 36 088 36 360
Trademark deliverable to Bravo Group (Proprietary) Limited – 13% per annum compounded monthly in arrear
– 202 028
Other various various 58 500 120 697
4 136 665 2 472 982
The facilities (AUD109 million) which includes a trade finance facility for Steinhoff Europe Group, due to ANZ Bank (Australia) included in current bank loans are secured by the first charge on the assets of Steinhoff Asia Pacific Holdings Proprietary Limited and its subsidiaries.
28.4 Convertible bonds
Balance at beginning of the year 2 672 020 1 233 730
Proceeds from issue of convertible bonds – 1 600 000
Amount classified as equity – (132 144)
Deferred taxation – (59 162)
Transaction costs – (19 986)
Coupon interest (179 866) (85 500)
Market implied interest 328 366 135 082
Balance at end of the year 2 820 520 2 672 020
• Floorplan creditors of R89 million were reallocated in 2008 from interest-bearing short-term liabilities to trade and other payables to better reflect the nature of the liability.
notes to the annual fInancIal statementsfor the year ended 30 June 2009 (cont inued)
174 • steInhoff annual report 2009 • notes to the annual fInancIal statements

2009 2008 r’000 r’000
29. eQUALISATIoN oF oPeRATING LeASe PAYMeNTS
Total 121 827 105 355
Current portion transferred to current liabilities (8 041) (15 249)
Long-term portion 113 786 90 106
30. eMPLoYee BeNeFITS
Afcol Pension Fund – –
Homestyle Pension Fund 113 839 114 177
PG Bison Pension Fund 5 648 37 107
Post-retirement medical benefits 7 625 8 815
Preference share scheme 95 890 99 533
Performance-based bonus accrual 94 693 109 150
Christmas bonus accrual 70 662 76 717
Leave pay accrual 184 211 188 792
Other 2 101 –
Total liability 574 669 634 291
Transferred to short-term employee benefits (364 949) (377 326)
Long-term employee benefits 209 720 256 965
30.1 Provident and pension funds
The majority of the group’s South African salaried employees and Homestyle employees are members of either a provident fund or a pension fund. The South African funds are all defined contribution funds, whereas the Homestyle employees belong to either defined benefit or contribution plans. Certain employees do not belong to group funds, but contribute to umbrella funds or industry funds established and administered by national bargaining councils.
The majority of the employees of the group’s subsidiaries in Europe and Australia are members of state-managed retirement benefit schemes operated by the governments of the various countries. The subsidiaries are required to contribute a specified percentage of their payroll costs to the retirement benefit schemes to fund the benefits. The only obligation of the group in terms of these retirement benefit schemes is to make the specified contributions.
All retirement benefit plans operated by group companies domiciled in the Republic of South Africa are governed by the Pension Funds Act (Act No 24 of 1956) (the Pension Funds Act). Approximately 99% (2008: 99%) of South African full-time group employees are covered by retirement benefit plans.
The total cost charged to profit or loss (note 3.5) represents contributions payable to these schemes by group companies at rates specified in the rules of these schemes.
30.2 Defined contribution plans
The assets of the defined contribution plans are held and managed separately from those of the group. The management of these funds is under the control of a suitably qualified board of trustees. The only obligation of the group to the retirement benefit plans is to deduct employee contributions monthly and to pay these over to the administrators. The group’s contribution to these funds amounted to R146 million (2008: R123 million).
notes to the annual fInancIal statements • steInhoff annual report 2009 • 175

notes to the annual fInancIal statementsfor the year ended 30 June 2009 (cont inued)
30. eMPLoYee BeNeFITS (continued)30.3 Defined benefit plans30.3.1 Defined benefit plans substantially closed: final surplus apportionment lodged with the Financial Services Board
Afcol Pension FundMost employees on the Afcol Pension Fund have transferred to the Steinhoff Group Retirement Fund as at 1 March 2004, currently there are 11 pensioners and deferred pensioners. The section 14 transfer was approved by the Financial Services Board on 6 September 2004.The process of surplus apportionment is complete. No future benefits will accrue after 29 February 2004, being the effective date of transfer to the Steinhoff Group Retirement Fund.During the 2005 year, the group’s actuaries confirmed that significantly more historical information on former members was identified. As these members have a right to a minimum benefit as outlined in the Pension Funds Act and regulations, it is unlikely that any surplus will be apportioned to the employer.The effective date of the most recent actuarial valuation is 31 March 2004. At that date, in the opinion of the actuary, the defined benefit plan was found to be in a sound financial position.The Financial Services Board approved the distribution of surplus in terms of the surplus scheme on 9 May 2007. The employer is not entitled to any surplus or unutilised reserves and the asset has thus been limited to Rnil.IAS 19 – Employee Benefits paragraph 58 only allows an asset to be recognised on the company’s balance sheet to the extent that economic benefits are available to the company in the form of refunds or reductions in future contributions. The Pension Funds Act precludes the company from accessing the assets of the above funds and, accordingly, they have not been recognised on the group’s balance sheet.PG Bison Pension FundThe PG Bison Pension Fund is both a defined benefit and defined contribution fund. The defined benefit fund has been closed for new entrants. The fund was last actuarially valued on 31 March 2004 and the valuation revealed the fund to be in a sound financial position. In the 2005 year, the fund underwent a process of obtaining former member data and investigating instances of improper use. These investigations have been finalised and the statutory valuation of the surplus at December 2003 has been updated. The Financial Services Board approved the surplus apportionment scheme of the fund during October 2008. The surplus allocated to former members, existing members and pensioners at the surplus apportionment date amounted to R77 million.Unitrans Retirement FundThere is a minimum guarantee in place for the pre-1995 members of the Unitrans Retirement Fund. An Rnil apportionment scheme as at 1 January 2003 was accepted by the Financial Services Board on 9 January 2006. Every three years the fund’s valuator carries out an actuarial valuation which is submitted to the Financial Services Board. The valuation as at 1 January 2006 confirmed that the fund is financially sound.Currently the fund is being restructured which has resulted in the fund being closed to new members from 1 April 2009. Further, the active members have been made paid-up and joined the Steinhoff Group Umbrella Provident Fund.
30.3.2 Active defined benefit plansHomestyle Pension FundThe Homestyle group operates two defined benefit pension schemes. Under the schemes, the employees are entitled to retirement benefits based on final salary on attainment of retirement age (or earlier withdrawal or death). No other post-retirement benefits are provided.Members have been assumed to take 70% of the maximum allowable amount of taxation-free cash at retirement. The remaining demographic assumptions at 30 June 2009 are the same as those used for the preliminary 31 December 2007 actuarial valuation of the scheme.
176 • steInhoff annual report 2009 • notes to the annual fInancIal statements

30. eMPLoYee BeNeFITS (continued)30.3 Defined benefit plans (continued)30.3.3 The financial details of the different funds and the effect on the group’s annual financial statements are highlighted below:
afcol pensIon fund homest yle pensIon fund pg bIson pensIon fund
2009
r’0002008
r’0002009
r’0002008
r’0002009
r’0002008
r’000
Amounts included in the balance sheet arising from the group’s obligation to defined benefit retirement plans are:
Present value of defined benefit obligations (23 780) (24 684) (748 577) (967 395) (82 486) (57 861)
Fair value of plan assets 46 438 43 468 634 738 853 218 76 838 67 931
Net pension asset/(liability) 22 658 18 784 (113 839) (114 177) (5 648) 10 070
Unrecognised due to paragraph 58 limit (22 658) (18 784) – – – (10 070)
Cumulative interest accrued – – – – – (37 107)
Liability recognised on the balance sheet – – (113 839) (114 177) (5 648) (37 107)
Components of income statement expenses/(income):
Current service cost – – – – 241 235
Expected return on plan assets (3 149) (2 443) (58 291) (62 880) (7 480) (3 758)
Interest cost 2 527 2 312 59 376 55 363 5 954 4 169
(622) (131) 1 085 (7 517) (1 285) 646
Changes in the present value of the defined benefit obligation are as follows:
Balance at beginning of the year (24 684) (29 864) (967 395) (929 576) (57 861) (53 583)
Actuarial (losses)/gains (486) 921 66 425 66 368 (18 448) 110
Benefits paid 3 917 6 571 41 346 37 148 – –
Current service cost – – – – (241) (235)
Interest cost (2 527) (2 312) (59 376) (55 363) (5 954) (4 169)
Member contributions – – – – (114) (98)
Risk premiums – – – – 132 114
Exchange differences on consolidation of foreign subsidiaries – – 170 423 (85 972) – –
Balance at end of the year (23 780) (24 684) (748 577) (967 395) (82 486) (57 861)
notes to the annual fInancIal statements • steInhoff annual report 2009 • 177

notes to the annual fInancIal statementsfor the year ended 30 June 2009 (cont inued)
30. eMPLoYee BeNeFITS (continued)30.3 Defined benefit plans (continued)30.3.3 The financial details of the different funds and the effect on the group’s annual financial statements (continued)
afcol pensIon fund homest yle pensIon pg b Ison pensIon fund
2009
r’0002008
r’0002009
r’0002008
r’0002009
r’0002008
r’000
Changes in fair value of plan assets are as follows:
Balance at beginning of the year 43 468 46 562 853 218 837 499 67 931 42 857
Actuarial gains/(losses) 3 738 1 034 (117 396) (115 517) (34 745) 21 192
Benefits paid (3 917) (6 571) (41 346) (37 148) – –
Employer contributions – – 27 745 29 030 36 190 140
Expected return on plan assets 3 149 2 443 58 291 62 880 7 480 3 758
Member contributions – – – – 114 98
Risk premiums – – – – (132) (114)
Exchange differences on consolidation of foreign subsidiaries – – (145 774) 76 474 – –
Balance at end of the year 46 438 43 468 634 738 853 218 76 838 67 931
expected contributions to defined benefit plans in next financial year – – 23 552 172 297 258
experience adjustments on plan liabilities 477 635 – 47 230 1 067 4
experience adjustments on plan assets 3 738 1 034 (117 396) (115 517) (18 547) (1 808)
The major categories of plan assets as a % of total plan assets are as follows: % % % % % %
Cash 100 100 5 5 38 18
Debt instruments – – 37 32 13 12
Equity – – 58 63 37 55
International – – – – 10 12
Property – – – – 1 1
Other – – – – 1 2
100 100 100 100 100 100
178 • steInhoff annual report 2009 • notes to the annual fInancIal statements

30. eMPLoYee BeNeFITS (continued)30.3 Defined benefit plans (continued)30.3.3 The financial details of the different funds and the effect on the group’s annual financial statements (continued)
afcol pensIon fund homest yle pensIon fund pg bIson pensIon fund
2009
%2008
%2009
%2008
%2009
%2008
%
Key assumptions used:Discount rate 9,3 10,3 6,4 6,5 9,5 10,3Expected return on plan assets 6,3 7,3 6,8 7,1 9,0 11,0Inflation 6,0 7,3 3,2 3,9 6,0 7,3Pension increase allowance 4,5 5,4 3,2 3,8 4,1 5,0Deferred pension increase allowance – – 3,2 3,9 – –Salary increase – – – – 7,0 8,3
2009
r’0002008
r’0002007
r’0002006
r’000
The history of the Afcol Pension Fund for the current and prior years is as follows:Fair value of plan assets 46 438 43 468 46 562 34 105Present value of benefit obligations (23 780) (24 684) (29 864) (6 106)Surplus 22 658 18 784 16 698 27 999
The history of the Homestyle Pension Fund for the current and prior years is as follows:Fair value of plan assets 634 738 853 218 837 499 732 623Present value of benefit obligations (748 577) (967 395) (929 576) (880 250)Deficit (113 839) (114 177) (92 077) (147 627)
The history of the PG Bison Pension Fund for the current and prior years is as follows:Fair value of plan assets 76 838 67 931 42 857 45 023Present value of benefit obligations (82 486) (57 861) (53 583) (49 327)(Deficit)/surplus (5 648) 10 070 (10 726) (4 304)
30.4 Post-retirement medical benefitsThe group provided certain post-retirement medical benefits by funding a portion of the medical aid contributions of certain retired members. These were charged against income as incurred. Through agreement with in-service and retired employees, the group came to a settlement in terms of which the present value of future benefits will be settled in cash.
2009r’000
2008r’000
Accrued liability at beginning of the year (8 815) (9 628)Actuarial gains 549 96Current service cost (40) (38)Employer benefit payments 232 212Interest cost (444) (317)Settlements 893 860Accrued liability at end of the year (7 625) (8 815)
notes to the annual fInancIal statements • steInhoff annual report 2009 • 179

2009 2008
30. eMPLoYee BeNeFITS (continued)30.4 Post-retirement medical benefits (continued)
Key assumptions used:
CPI inflation 6,0% 7,3%
Discount rate 9,3% 10,3%
Expected retirement age 63 years 63 years
Healthcare cost inflation 8,0% 9,3%
Orphan age 25 years 25 years
Assumed healthcare cost trends have a significant effect on the amounts recognised in profit or loss. The effect of a one percentage point change in assumed healthcare cost trend rates would be as follows:
2009one percentage
poInt Incre aSer’000
2009one percentage poInt decre aSe
r’000
2008one percentage
poInt Incre aSer’000
2008one percentage poInt decre aSe
r’000
(Increase)/decrease of the aggregate of the service costs and interest cost (68) 55 (78) 62
Effect on post-retirement obligation (624) 503 (659) 531
(692) 558 (737) 593
notes to the annual fInancIal statementsfor the year ended 30 June 2009 (cont inued)
180 • steInhoff annual report 2009 • notes to the annual fInancIal statements

2009 2008 r’000 r’000
30. eMPLoYee BeNeFITS (continued)30.5 Preference share scheme
The long-term employee benefit has been recognised as the present value of the obligation accrued over the service period using the projected unit credit method as follows:Present value of estimated redemption at end of the year 95 890 97 211Present value of estimated annual dividends – 16 677Total estimated consideration 95 890 113 888Less: Employee contributions (95 890) (95 890)Net amount for settlement – 17 998Expense portion recognised over five-year service period 6 933 7 200Dividends paid (6 933) (3 557)Employee contribution 95 890 95 890Total liability 95 890 99 533Estimated dividend transferred to short-term employee benefits – (3 306)Long-term employee benefits 95 890 96 227The preference share scheme was introduced with effect from 1 July 2006.The scheme is restricted to key employees of PG Bison. Participants subscribed for shares from proceeds received from the sale of shares agreement with Steinhoff in order to participate in the scheme, effective from 1 July 2006 to 30 June 2011.
30.6 Performance-based bonus accrualThe bonus payable is fixed by applying a specific formula based on the employee’s achievement of performance targets. The employee must be in service on 30 June 2009 to qualify for the bonus.Balance at beginning of the year 109 150 113 867Additional accrual raised 135 355 100 614Amounts unused reversed (44 298) (33 350)Amounts utilised (105 016) (75 292)Net acquisition and disposal of subsidiaries and businesses (289) –Reclassified (to)/from other accruals (68) 3 319Exchange differences on consolidation of foreign subsidiaries (141) (8)Balance at end of the year 94 693 109 150
30.7 Leave pay accrualThe leave pay accrual relates to vesting leave pay to which employees may become entitled on leaving the employment of the group. The accrual arises as employees render a service that increases their entitlement to future compensated leave and is calculated based on an employee’s total cost of employment. The accrual is utilised when employees become entitled to and are paid for the accumulated leave or utilise compensated leave due to them.Balance at beginning of the year 188 792 177 627Additional accrual raised 175 370 41 726Amounts unused reversed (15 022) (2 576)Amounts utilised (145 343) (51 752)Net acquisition and disposal of subsidiaries and businesses (282) 444Reclassified from/(to) other accruals 624 (69)Exchange differences on consolidation of foreign subsidiaries (19 928) 23 392Balance at end of the year 184 211 188 792
notes to the annual fInancIal statements • steInhoff annual report 2009 • 181

2009 2008 r’000 r’000
31. DeFeRReD GoVeRNMeNT GRANTSBalance at beginning of the year 11 710 5 057Released during the year to profit or loss (2 487) (1 000)Claims submitted 2 363 8 531Exchange differences on consolidation of foreign subsidiaries (1 119) (878)Balance at end of the year 10 467 11 710
32. PRoVISIoNS
2009
openIng baL ance
r’000
addItIonaL provIs Ion
r aISedr’000
amountS unuSed
re versedr’000
amountS ut IL ISed
r’000
net acquISItIon
& dIsposal of SubSIdIarIeS & buSIneSSeS
r’000
recl assIf y be t ween
provIs Ions & accruaLS
r’000
e xchange dIfferences
on con-SoLIdatIon of foreIgn
SubSIdIarIeSr’000
cLoSIng baL ance
r’000
Accident and insurance fund provisions 30 854 114 495 (21 797) (91 257) – – 4 32 299Buy-back lease commitments 988 145 (551) – – – – 582Dilapidation and onerous lease provisions 1 079 777 8 524 (95 022) (294 431) – – (110 093) 588 755Gross incurred but not reported reserve (IBNR) 2 796 3 574 (2 993) – – – – 3 377Maintenance fund 18 670 32 263 – (29 766) (21 167) – – –Warranty provisions 84 194 114 043 (5 014) (27 529) – 148 (23 195) 142 647Other 30 091 26 279 (6 859) (8 802) (1 184) (148) – 39 377
1 247 370 299 323 (132 236) (451 785) (22 351) – (133 284) 807 0372008Accident and insurance fund provisions 23 031 113 228 (16 304) (89 135) – – 34 30 854Buy-back lease commitments 4 552 908 – (2 650) (4 552) 2 730 – 988Dilapidation and onerous lease provisions 261 328 – (2 182) (130 918) 658 867 – 292 682 1 079 777Gross incurred but not reported reserve (IBNR) 8 989 – (6 193) – – – – 2 796Maintenance fund 18 101 21 065 (4 825) (15 671) – – – 18 670Warranty provisions 31 976 38 091 – (93) – – 14 220 84 194Other 80 174 11 525 (45 354) (2 603) 93 (14 760) 1 016 30 091
428 151 184 817 (74 858) (241 070) 654 408 (12 030) 307 952 1 247 370
notes to the annual fInancIal statementsfor the year ended 30 June 2009 (cont inued)
182 • steInhoff annual report 2009 • notes to the annual fInancIal statements

2009 2008 r’000 r’000
32. PRoVISIoNS (continued)Long-term provisions 536 400 587 687
Short-term provisions 270 637 659 683
807 037 1 247 370
Accident and insurance fund provisions
The Unitrans group covers its own expenses relating to damages to third-party property or goods transported. The balance of the fund relates to accidents that occurred but were not settled at balance sheet date.
Provisions relating to insurance contracts have been disclosed in note 44 – ‘Insurance and insurance risk management’.
Buy-back lease commitments
The property and buy-back lease commitments relate to buy-back commitments, which have to be financed over a period ranging between two and six years. The provision is based on the net present value of outstanding commitments.
Dilapidation and onerous lease provisions
Provision for dilapidation of buildings occupied by the group and provision for long-term leases containing onerous provisions or terms in comparison with average terms and conditions of leases.
Gross IBNR
This provision relates to the insurance business of the Unitrans group and is a statutory insurance provision for claims incurred but not yet reported. See note 44 – ‘Insurance and insurance risk management’.
Maintenance fund
The fund relates to the vehicle retailing operations of the Unitrans group and is in respect of probable future expenses on vehicles sold under a maintenance plan.
Warranty provisions
The warranty provision represents management’s best estimate, based on past experience, of the group’s liability under warranties granted on products sold.
33. TRADe AND oTHeR PAYABLeS
Trade payables 4 523 920 6 030 996
Accruals 441 502 529 596
Floorplan creditors* 617 451 475 047
Other payables and amounts due 1 616 719 1 693 248
7 199 592 8 728 887
Included in other payables and amounts due are deferred income and rebates.
The fair value of trade and other payables is disclosed in note 19.
* Floorplan creditors of R89 million were reallocated in 2008 from interest-bearing short-term liabilities to trade and other payables to better reflect the nature of the liability.
notes to the annual fInancIal statements • steInhoff annual report 2009 • 183

2009 2008 r’000 r’000
34. CoMMITMeNTS AND CoNTINGeNCIeS
34.1 Capital expenditure
Contracts for capital expenditure authorised 259 463 504 307
Capital expenditure authorised but not contracted for 223 510 240 164
Capital expenditure will be financed from cash and existing loan facilities.
34.2 Borrowing facilities
In term of the articles of association, the borrowing powers of the company are unlimited.
34.3 Unutilised borrowing facilities at 30 June 3 888 533 5 040 391
34.4 operating leases
propert yr’000
pL ant, equIpment, vehIcles & other
r’000totaLr’000
totaLr’000
Amounts outstanding under non-cancellable operating lease agreements payable within the next year and thereafter:
Next year 1 922 418 166 687 2 089 105 1 826 412
Within two to five years 6 741 622 247 978 6 989 600 6 037 184
Thereafter 8 545 406 76 154 8 621 560 7 462 709
Balances denominated in currencies other than South African rands were converted at the closing rates of exchange ruling at 30 June 2009.
notes to the annual fInancIal statementsfor the year ended 30 June 2009 (cont inued)
184 • steInhoff annual report 2009 • notes to the annual fInancIal statements

34. CoMMITMeNTS AND CoNTINGeNCIeS (continued)34.5 Contingent liabilities
In the 2007 financial year, the South African Revenue Service (SARS) issued additional assessments against a group company (amounting to approximately R129,7 million including interest and penalties), disallowing the taxation allowances claimed by the company during its 1999 to 2003 years of assessment on intellectual property rights acquired during its 1999 year of assessment. The company objected thereto but our objections were disallowed by SARS. No new grounds for the disallowance of the objections were raised by SARS. The company has, based on advice obtained from external counsel, appealed against the disallowance of the objections. SARS has agreed in the interim to a deferral of payment of the additional taxation and interest raised by it, until such time as the matter is finally resolved. Steinhoff Africa has provided a guarantee in respect of and to the extent that the amount assessed, together with interest, may become payable. The company, again in accordance with professional advice received from several authoritative external legal advisors, holds the view that it is unlikely that a liability will ultimately arise in this matter. This latter view is fortified by a recent judgment in a matter with similar facts. SARS has not appealed against the judgment. The construction placed upon the material tax provisions in that case by the Court, on our advice, bolsters the position adopted by us in the matter.Certain other companies in the group are involved in disputes where the outcomes are uncertain. However, the directors are confident that they will be able to defend these actions and that the potential of outflow or settlement is remote and, if not, that the potential impact on the group will not be material.There is no other litigation, current or pending, which is considered likely to have a material adverse effect on the group.The group has a number of guarantees and sureties outstanding at year-end. However, the directors are confident that no material liability will arise as a result of these guarantees and sureties.Steinhoff Investment has subordinated R1 650 million of the shareholder’s loan due from Steinhoff Africa in favour of all other creditors.Steinhoff has subordinated R29 million of the shareholder’s loan due from Steinhoff Investment in favour of all other creditors.Steinhoff Investment has contributed and subordinated directly and indirectly to Phaello Finance Company (Proprietary) Limited shareholders’ loans of R184 million.Steinhoff has subordinated shareholders’ loans due from Steinhoff Europe AG (Austria), amounting to €275 million, and due from Steinhoff Möbel Holdings Alpha GmbH, amounting to €56,3 million, until the senior debt has been unconditionally and irrevocably paid and discharged in full.
35. JUDGeMeNTS AND eSTIMATeSJudgements and estimates are continually evaluated and are based on historical experience and other factors, including expectations of future events that are believed to be reasonable under the circumstances.The group makes estimates and assumptions concerning the future. The resulting accounting estimates will, by definition, seldom equal the related actual results. The estimates and assumptions that have a significant risk of causing a material adjustment to the carrying amounts of assets and liabilities during the next financial year are discussed below.Useful lives and residual valuesThe estimated useful lives for intangible assets with a finite life, property, plant and equipment and vehicle rental fleet are:Intangible assetsCustomer relationship and trade names and brand names 10 – 20 yearsProject costs, contracts and licences Over the term of the contract or projectSoftware 1 – 3 yearsPatents, trademarks, trade names and brand names, which are considered to be well-established growing brands and product lines for which there is no foreseeable limit to the period in which these assets are expected to generate cash flows, are classified as indefinite useful life assets. The classification of such assets is reviewed annually.Indefinite useful life intangible assets, excluding goodwill, recognised at fair value in business combinations, are expected to generate cash flows indefinitely and the carrying value would only be recovered in the event of disposal of such assets. Accordingly, deferred taxation is raised at the capital gains taxation rate on the fair value of such assets exceeding its taxation base.Property, plant and equipmentBuildings 5 – 80 yearsBus fleet 5 – 10 yearsComputer equipment 2 – 4 yearsLong-haul motor vehicles 5 – 10 yearsMotor vehicles 4 – 10 yearsOffice equipment and furniture 3 – 10 yearsPlant and machinery 3 – 20 yearsVehicle rental fleet Over the period of the buy-back agreement or estimated holding period
notes to the annual fInancIal statements • steInhoff annual report 2009 • 185

35. JUDGeMeNTS AND eSTIMATeS (continued)
The estimated useful lives and residual values are reviewed annually, taking cognisance of the forecasted commercial and economic realities and through benchmarking of accounting treatments in the specific industries where these assets are used.
Consumable biological assetsThe fair value of standing timber which has become marketable, is based on the market price of the estimated recoverable timber volumes, net of harvesting costs. The fair value of younger standing timber is based on the present value of the net cash flows expected to be generated by the plantation at maturity.
Impairment of assetsInvestments, goodwill, property, plant and equipment, investment property and intangible assets that have an indefinite useful life, and intangible assets that are not yet ready for use are assessed annually for impairment.
Deferred taxation assetsDeferred taxation assets are recognised to the extent that it is probable that taxable income will be available in the future against which these can be utilised. Future taxable profits are estimated based on business plans which include estimates and assumptions regarding economic growth, interest, inflation, taxation rates and competitive forces.
Contingent liabilitiesManagement applies its judgement to the fact patterns and advice it receives from its attorneys, advocates and other advisors in assessing if an obligation is probable, more likely than not, or remote. This judgement application is used to determine if the obligation is recognised as a liability or disclosed as a contingent liability.
Valuation of equity compensation benefitsManagement classifies its share-based payment scheme as an equity-settled scheme based on the assessment of its role and that of the employees in the transaction. In applying its judgement, management consulted with external expert advisors in the accounting and share-based payment advisory industry. The critical assumptions as used in the valuation model are detailed in note 24.7.
Post-employment benefit obligationsIn applying its judgement to defined benefit plans, management consulted with external expert advisors in the accounting and post-employment benefit obligation industry. The critical estimates as used in each benefit plan are detailed in note 30.
Consolidation of special-purpose entitiesCertain special-purpose entities established as part of the B-BBEE transactions have been consolidated as part of the group results. The group does not have any significant direct or indirect shareholding in these entities, but the substance of the relationship between the group and these entities was assessed and judgement was made that these are controlled entities.
Buy-back lease commitmentsWhen a buy-back agreement is entered into, a provision is raised in respect of future reconditioning costs that may be incurred before the vehicle is made available for sale. Management based this provision on historical data and past experience.
Provision for bad debts The provision for bad debts was based on a combination of specifically identified doubtful debtors and providing for older debtors.
notes to the annual fInancIal statementsfor the year ended 30 June 2009 (cont inued)
186 • steInhoff annual report 2009 • notes to the annual fInancIal statements

2009 2008 r’000 r’000
36. CASH GeNeRATeD FRoM oPeRATIoNSProfit before taxation 4 208 738 3 801 741Adjusted for:
Depreciation and amortisation 1 020 821 868 421Equalisation of operating leases 11 270 (952)Fair value adjustments of consumable biological assets and decrease due to harvesting (414 831) (194 977)Fair value adjustment of interest rate swaps 35 865 6 081Fair value gains – other (4 563) (75)Finance costs 1 959 277 1 490 821Impairments 11 414 181 895Inventories written down to net realisable value 3 482 –Investment income (959 424) (786 768)Investment reserve and FCTR released to other operating (income)/expense (4 776) 554Insurance income accrued – (32 650)Negative goodwill released to profit or loss on business combination – (8 723)Net loss on sale of intangible asset 4 –Net (profit)/loss on disposal and scrapping of property, plant and equipment, vehicle rental fleet and investment property (55 280) 19 718Profit on disposal of investment (657) –Share of profit of associate companies (6 527) (37 071)Share-based payment expense 66 372 78 947
Cash generated before working capital changes 5 871 185 5 386 962Working capital changes
Decrease in inventories 540 857 43 333Increase in trade and other receivables (1 121 111) (60 367)Decrease in assets held for sale 6 789 9 175Decrease/(increase) in value added taxation receivable 130 294 (71 079)Increase/(decrease) in net foreign currency liabilities 51 398 (6 923)Decrease in non-current and current provisions (284 693) (108 103)Decrease in non-current and current employee benefits (37 308) (48 778)(Decrease)/increase in deferred government grants (532) 6 653(Decrease)/increase in trade and other payables (1 131 200) 249 226(Decrease)/increase in value-added taxation payable (91 543) 84 753
Net changes in working capital (1 937 049) 97 890Cash generated from operations 3 934 136 5 484 852
37. TAxATIoN PAIDTaxation payable at beginning of the year (488 980) (396 346)Current taxation expense per income statement (244 343) (396 476)Taxation (payable)/receivable of subsidiaries (disposed)/acquired 89 259Foreign currency translation differences 32 171 (82 040)Taxation payable at end of the year 391 953 488 980Net taxation paid (309 110) (385 623)
notes to the annual fInancIal statements • steInhoff annual report 2009 • 187
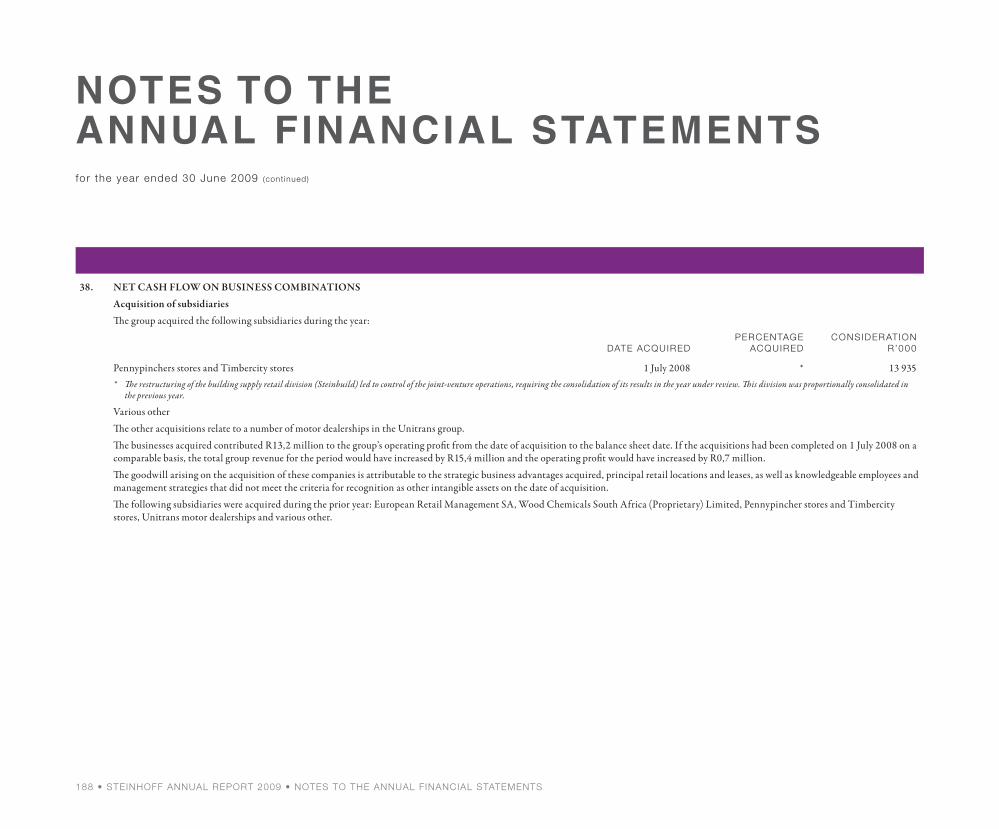
38. NeT CASH FLoW oN BUSINeSS CoMBINATIoNS
Acquisition of subsidiaries
The group acquired the following subsidiaries during the year:
date acquIred percentage
acquIred conSIder atIon
r’000
Pennypinchers stores and Timbercity stores 1 July 2008 * 13 935 * The restructuring of the building supply retail division (Steinbuild) led to control of the joint-venture operations, requiring the consolidation of its results in the year under review. This division was proportionally consolidated in
the previous year.
Various other
The other acquisitions relate to a number of motor dealerships in the Unitrans group.
The businesses acquired contributed R13,2 million to the group’s operating profit from the date of acquisition to the balance sheet date. If the acquisitions had been completed on 1 July 2008 on a comparable basis, the total group revenue for the period would have increased by R15,4 million and the operating profit would have increased by R0,7 million.
The goodwill arising on the acquisition of these companies is attributable to the strategic business advantages acquired, principal retail locations and leases, as well as knowledgeable employees and management strategies that did not meet the criteria for recognition as other intangible assets on the date of acquisition.
The following subsidiaries were acquired during the prior year: European Retail Management SA, Wood Chemicals South Africa (Proprietary) Limited, Pennypincher stores and Timbercity stores, Unitrans motor dealerships and various other.
notes to the annual fInancIal statementsfor the year ended 30 June 2009 (cont inued)
188 • steInhoff annual report 2009 • notes to the annual fInancIal statements

2009 2008
38. NeT CASH FLoW oN BUSINeSS CoMBINATIoNS (continued)
pennypInchers & tImbercIty stores
r’000otHer
r’000totaLr’000
totaLr’000
The fair value of assets and liabilities assumed at date of acquisition was:
Assets
Goodwill 12 098 – 12 098 –
Intangible assets – – – 4 362 684
Property, plant and equipment 25 753 550 26 303 2 164 401
Investments and loans – – – 3 606
Deferred taxation assets – – – 302 456
Inventories 74 117 186 74 303 1 476 153
Trade and other receivables 75 464 – 75 464 782 945
Taxation receivable – – – 259
Cash on hand 7 892 – 7 892 306 930
Other current assets – – – 6 941
Liabilities
Non-current liabilities (26 294) – (26 294) (430 874)
Deferred taxation liabilities – – – (1 552 648)
Trade and other payables and provisions (111 592) – (111 592) (2 804 759)
Employee benefits – – – (444)
Short-term interest-bearing loans and borrowings – – – (364 172)
Value added taxation payable (920) – (920) (1 122)
Bank overdraft (3 538) – (3 538) (2 775)
Other current liabilities (7 192) – (7 192) (2 393)
Minority interests as part of an existing group – – – (16 687)
Minority interests (39 707) – (39 707) (2 170 073)
Total assets and liabilities acquired 6 081 736 6 817 2 060 428
Net goodwill at acquisition 7 854 14 100 21 954 2 470 355
Total consideration 13 935 14 836 28 771 4 530 783
Purchase price paid in cash 13 935 14 836 28 771 3 701 952
Purchase price settled with issue of shares – – – 828 831
Cash and cash equivalents on hand at acquisition (7 892) – (7 892) (306 930)
Shareholders’ loan account (262) – (262) (45)
Purchase price settled with issue of shares – – – (828 831)
Net cash outflow on acquisition of subsidiaries 5 781 14 836 20 617 3 394 977
notes to the annual fInancIal statements • steInhoff annual report 2009 • 189

2009 2008
38. NeT CASH FLoW oN BUSINeSS CoMBINATIoNS (continued)
pennypInchers & tImbercIty stores
r’000otHer
r’000totaLr’000
totaLr’000
The carrying value of identifiable assets and liabilities immediately prior to the acquisition was:
Assets
Goodwill 12 098 – 12 098 1 418 237
Intangible assets – – – 26 644
Property, plant and equipment 25 753 550 26 303 1 409 546
Investments and loans – – – 3 606
Deferred taxation assets – – – 20 143
Inventories 74 117 186 74 303 1 498 124
Trade and other receivables 75 464 – 75 464 782 945
Taxation receivable – – – 259
Cash on hand 7 892 – 7 892 306 930
Other current assets – – – 6 941
Liabilities
Non-current liabilities (26 294) – (26 294) (430 874)
Deferred taxation liabilities – – – (22 868)
Trade and other payables and provisions (111 592) – (111 592) (1 918 958)
Employee benefits – – – (444)
Short-term interest-bearing loans and borrowings – – – (364 172)
Value added taxation payable (920) – (920) (1 122)
Bank overdraft (3 538) – (3 538) (2 775)
Other current liabilities (7 192) – (7 192) (2 393)
Minority interests as part of an existing group – – – (16 687)
Total assets and liabilities acquired 45 788 736 46 524 2 713 082
notes to the annual fInancIal statementsfor the year ended 30 June 2009 (cont inued)
190 • steInhoff annual report 2009 • notes to the annual fInancIal statements

2009 2008 r’000 r’000
39. NeT CASH FLoW oN DISPoSAL oF SUBSIDIARIeS AND BUSINeSSeS
The carrying values of assets and liabilities disposed of at the date of disposal were:
Assets
Property, plant and equipment 209 1 312 176
Deferred taxation assets 1 776 18 649
Inventories 835 –
Trade and other receivables 28 130 931 521
Cash on hand 20 788 14 961
Liabilities
Other reserves – 554
Deferred taxation liabilities – (7 807)
Taxation payable (89) –
Trade and other payables and provisions (36 267) (902 202)
Carrying value of assets and liabilities disposed 15 382 1 367 852
Profit on disposal 657 –
Proceeds on disposal 16 039 1 367 852
Cash on hand at date of disposal (20 788) (14 961)
Net cash (outflow)/inflow on disposal of subsidiaries (4 749) 1 352 891
40. CoSTS oN ISSUe oF SHARe CAPITAL
ordinary shares
Issue expenses paid (71) (337)
Cash received on issue of ordinary shares 10 480 –
10 409 (337)
41. CASH AND CASH eQUIVALeNTS
Cash and cash equivalents include cash on hand and balances with banks. Bank overdrafts are only included where the group has a legal right of offset due to cash management arrangements. Cash and cash equivalents included in the cash flow statement comprise the following balance sheet amounts:
Funds on call and deposit 670 269 050
Bank balances and cash 4 735 527 4 726 181
4 736 197 4 995 231
Included in cash and cash equivalents is an amount of Rnil (2008: R198 million) committed as security for future acquisitions and/or expenses of the group.
An amount of R144,9 million (2008: R202,6 million) is ringfenced for insurance purposes.
notes to the annual fInancIal statements • steInhoff annual report 2009 • 191

2009 2008
42. ReLATeD-PARTY TRANSACTIoNS
Related-party relationships exist between shareholders, subsidiaries, joint-venture companies and associate companies within the group and its company directors and group key management personnel.
These transactions are concluded at arm’s length in the normal course of business and include transactions as a result of the groupwide treasury management of foreign currency movements. All material intergroup transactions are eliminated on consolidation.
42.1 Significant subsidiaries
country of IncorporatIon
ownershIp %
ownershIp %
Steinhoff Investment Holdings Limited South Africa 100 100
Steinhoff Africa Holdings (Proprietary) Limited South Africa 100 100
Steinhoff Möbel Holdings Alpha GmbH Austria 100 100
Phaello Finance Company (Proprietary) Limited South Africa 100 100
Steinhoff Africa Holdings (Proprietary) Limited's significant subsidiaries include:
PG Bison Holdings (Proprietary) Limited South Africa 100 100
Unitrans Holdings (Proprietary) Limited South Africa 100 100
Steinhoff Möbel Holdings Alpha GmbH’s significant subsidiaries (directly and indirectly) include:
Steinhoff Europe AG Austria 100 100
Steinhoff Retail GmbH Austria 100 100
Pat Cornick International BV The Netherlands 100 100
Relyon Group Limited United Kingdom 100 100
Steinhoff Asia Pacific Holdings Proprietary Limited Australia 100 100
Steinhoff Europe AG Switzerland 100 100
Steinhoff Germany GmbH Germany 100 100
Steinhoff UK Beds Limited United Kingdom 100 100
Steinhoff UK Holdings Limited United Kingdom 100 100
Steinhoff UK Retail Limited United Kingdom 100 100
A full list of subsidiaries of the company is available for inspection by members on request at the registered office of the company.
notes to the annual fInancIal statementsfor the year ended 30 June 2009 (cont inued)
192 • steInhoff annual report 2009 • notes to the annual fInancIal statements

2009 2008 2009 2008
42. ReLATeD-PARTY TRANSACTIoNS (continued)42.2 Trading transactions
The following is a summary of transactions with associate companies, joint-venture companies and key management personnel during the year and balances at year-end:ke y management
perSonneLaSSocIate and
JoInt-venture companIes
r’000 r’000 r’000 r’000
Purchases of goods or services from companies where key personnel are directors or hold a direct financial interest 5 474 4 123 – –Goods or services sold to key personnel or companies where key personnel are directors or hold a direct financial interest 655 2 819 – –Leases/loans to key personnel or companies where key personnel are directors or hold a direct financial interest 675 1 157 – –Goods and services purchased from: 228 302 128 427
Amalgamated Appliances Holdings Limited 2 485 4 674KAP International Holdings Limited 573 –Loungefoam (Proprietary) Limited 97 967 19 898Xinergistix Limited 127 277 103 855
Goods and services sold to: 8 102 41 954Buffalo Pocket Spring Company (Proprietary) Limited 1 517 2 559Induna Tippers (Proprietary) Limited 526 1 430Loungefoam (Proprietary) Limited 7 1Pennypinchers and Timbercity stores – 33 641PG Bison Kenya Limited – 4 323Steitex (Proprietary) Limited 936 –Xinergistix Limited 5 116 –
Interest received from: 2 535 381Emergent Office Solutions (Proprietary) Limited 620 –Kronotex South Africa (Proprietary) Limited 1 053 –Steitex (Proprietary) Limited 649 381Roadway Properties (Proprietary) Limited 213 –
Interest paid to:Induna Tippers (Proprietary) Limited 279 259
Administration and management fees received from: 20 547 373Buffalo Pocket Spring Company (Proprietary) Limited 126 120Hemisphere International Property BV 12 671 –Induna Tippers (Proprietary) Limited 6 149 193Loungefoam (Proprietary) Limited 1 537 –Roadway Properties (Proprietary) Limited 4 –Steitex (Proprietary) Limited 60 –Xinergistix Limited – 60
Foreign exchange fees received from: 38 10Emergent Office Solutions (Proprietary) Limited 16 –Loungefoam (Proprietary) Limited 20 8Steitex (Proprietary) Limited 2 2
notes to the annual fInancIal statements • steInhoff annual report 2009 • 193

2009 2008
42. ReLATeD-PARTY TRANSACTIoNS (continued)42.2 Trading transactions (continued)
aSSocIate and JoInt-venture companIes
r’000 r’000
Operating expenses recovered from:Xinergistix Limited – 18
Rental paid to:Hemisphere International Property BV 391 072 –
Rental received from: 297 353Buffalo Pocket Spring Company (Proprietary) Limited 50 91Xinergistix Limited 247 262
Receivables from: 10 328 24 676Buffalo Pocket Spring Company (Proprietary) Limited 130 410Emergent Office Solutions (Proprietary) Limited 7 14 597Induna Tippers (Proprietary) Limited 3 000 –KAP International Holdings Limited 1 –Kronotex South Africa (Proprietary) Limited 6 318 –Loungefoam (Proprietary) Limited 189 898Pennypinchers and Timbercity stores – 6 247PG Bison Kenya Limited – 2 285Steitex (Proprietary) Limited 115 175Xinergistix Limited 568 64
Payables to: 12 530 3 762Amalgamated Appliances Holdings Limited – 212Buffalo Pocket Spring Company (Proprietary) Limited 30 54Induna Tippers (Proprietary) Limited 55 –Loungefoam (Proprietary) Limited 12 445 –Pennypinchers and Timbercity stores – 3 495Steitex (Proprietary) Limited – 1
notes to the annual fInancIal statementsfor the year ended 30 June 2009 (cont inued)
194 • steInhoff annual report 2009 • notes to the annual fInancIal statements

2009 2008
42. ReLATeD-PARTY TRANSACTIoNS (continued)42.2 Trading transactions (continued)
aSSocIate and JoInt-venture companIes
r’000 r’000
Loans due (from)/to: (1 327 828) (699 685)Buffalo Pocket Spring Company (Proprietary) Limited 1 708 1 537Emergent Office Solutions (Proprietary) Limited (3 000) –Hemisphere International Property BV (1 344 825) (709 309)Induna Tippers (Proprietary) Limited 10 000 4 000Loungefoam (Proprietary) Limited – (10)Roadway Properties (Proprietary) Limited 2 777 –Samstar Services (Proprietary) Limited (115) (83)Steitex (Proprietary) Limited 5 627 4 180
42.3 Compensation of key management personnel
Key management personnel are defined as directors of the company and its significant subsidiary companies reflected in note 42.1, as well as top executive management members.
Key management personnel compensation
– Short-term employee benefits 107 843 107 447
– Share-based payments – related expense 22 957 53 622
130 800 161 069
Number of members 32 30
42.4 Directors
Details relating to directors’ emoluments, shareholding in the company and interest of directors and officers are disclosed in note 43.
42.5 Shareholders
The principal shareholders of the company are detailed in the analysis of shareholders in the annual report.Directors’ shareholdings are detailed in note 43.
42.6 Interest of directors and officers in contracts
All directors and officers of the company have, other than described below, confirmed that they had no interest in any contract of significance with the company or any of its subsidiary companies, which could have resulted in a conflict of interest during the year.
During the year under review, contracts were concluded with:
• HoffmanAttorneys(ofwhichSJGroblerisapartner)providedlegalservicestogroupcompaniesandwasreimbursedforexpensestotheamountofapproximatelyR3,9million(2008: R3,0 million).
• PSGCapitalLimitedandassociatecompanies(ofwhichJFMoutonisadirector)(asubsidiaryofPSGGroupLimitedofwhichJFMoutonandMJJoostearedirectors)actedassponsor and advisor to the group, in respect of which fees were paid totalling approximately R0,3 million (2008: R1,1 million).
• PhumelelaGaming&LeisureLimited(ofwhichMJJoosteisadirector)providedmarketingservicestothegrouptotheamountofR1,1million(2008:R0,8million).• SteinhoffAfricaholdspre-emptiverightsinrespectof41,1%(2008:40,0%)ofDaun&CieAG’sinterestinKAPInternationalHoldingsLimited(ofwhichCEDaunisthe
chairman) at 30 June 2009. Mr Daun is also the chairman and controlling shareholder of Daun & Cie AG.• ManagementfeesofR2,5millionforservicesrenderedtoUnitransPassengerwerepaidtoMvelaphandaGroupLimited(ofwhichMsYZCubaisadirector).
All the contracts were concluded at arm’s length in the normal course of business and are no less favourable than those arranged with third parties.
notes to the annual fInancIal statements • steInhoff annual report 2009 • 195

43. ReMUNeRATIoN RePoRT
43.1 Remuneration
executive directors
baSIc foreIgn
remuner a-t Ion ‘000
baSIc r and
remuner a-t Ion
r’000
foreIgn company
contrIbutIon and e xpense allowances
‘000
r and company
contrIbutIon and e xpense allowances
r’000 bonuS
r’000
company dIrectorS’
fees▲
r’000
totaL remuner atIon and
fees ( IncludIng foreIgn amounts
converted to r and for reportIng
purposes )r’000
2009HJK Ferreira* €25 310 – 41 – 99 759SJ Grobler*# €25 315 – 36 – 99 759MJ Jooste €1 102 – – 924 – 594 15 133FJ Nel €75 926 – 228 1 000 594 3 674IM Topping £409 – £59 – – 594 7 365DM van der Merwe €100 2 473 – 443 2 000 594 6 745JHN van der Merwe† €125 3 694 – 342 – 495 6 075
3 069 40 5102008BE Steinhoff■ €643 – – – – 413 7 333MJ Jooste €993 – – 718 – 550 11 958KJ Grové+ – 836 – 185 1 642 229 2 892FJ Nel €60 879 – 219 3 000 550 5 294IM Topping £382 – £59 – – 550 7 014DM van der Merwe €60 2 269 – 431 3 500 550 7 396JHN van der Merwe €642 – – 328 – 550 7 786
3 392 49 673
▲ Directors’ fees were paid with basic remuneration.* The status of HJK Ferreira and SJ Grobler changed on 1 May 2009 from alternate directors to executive directors.# Includes fees and remuneration in respect of professional services rendered.† JHN van der Merwe resigned from the board on 1 May 2009.■ The status of BE Steinhoff changed during the 2008 year from executive director to non-executive director.+ The status of KJ Grové changed during the 2008 year from executive director to alternate director.
notes to the annual fInancIal statementsfor the year ended 30 June 2009 (cont inued)
196 • steInhoff annual report 2009 • notes to the annual fInancIal statements

43. ReMUNeRATIoN RePoRT (continued)43.1 Remuneration (continued)
Alternate directors and officers
baSIc foreIgn
remuner a-t Ion ‘000
baSIc r and
remuner a-t Ion
r’000
foreIgn company
contrIbutIon and e xpense allowances
‘000
r and company
contrIbutIon and e xpense allowances
r’000 bonuS
r’000
company dIrectorS’
fees▲
r’000
totaL remuner atIon and
fees ( IncludIng foreIgn amounts
converted to r and for reportIng
purposes )r’000
2009JNS du Plessis €42 1 902 – – 650 594 3 665HJK Ferreira* €125 1 551 – 204 2 000 495 5 794SJ Grobler#* €125 1 575 – 180 2 000 495 5 794KJ Grové – 1 789 – 857 – 594 3 240A Krüger-Steinhoff@ – – – – – 240 240
2 418 18 7332008JNS du Plessis €42 1 680 – – – 550 2 682HJK Ferreira €100 1 727 – 223 3 500 550 7 076SJ Grobler#5 €110 1 661 – 189 3 500 550 7 084KJ Grové+ – 1 170 – 259 2 299 321 4 049A Krüger-Steinhoff@ – – – – – 220 220
2 191 21 111
▲ Directors’ fees were paid with basic remuneration.* The status of HJK Ferreira and SJ Grobler changed on 1 May 2009 from alternate directors to executive directors.# Includes fees and remuneration in respect of professional services rendered.† JHN van der Merwe resigned from the board on 1 May 2009.■ The status of BE Steinhoff changed during the 2008 year from executive director to non-executive director.+ The status of KJ Grové changed during the 2008 year from executive director to alternate director.@ Non-executive director.5 Prior year amounts have been adjusted to income R858 thousand paid to Hoffman Attorneys.
notes to the annual fInancIal statements • steInhoff annual report 2009 • 197

43. ReMUNeRATIoN RePoRT (continued)43.1 Remuneration (continued)
Non-executive directors
fees as dIrector
baSIcr’000
fees as dIrector
commItteeSr’000
fees for servIces
r’000 totaL
r’000
2009
DE Ackerman 300 265 – 565
DC Brink 300 215 – 515
YZ Cubaº 300 25 – 325
CE Daunº 300 – – 300
D Konar 1 200 – – 1 200
JF Moutonº# 300 25 – 325
FA Sonn 300 96 – 396
BE Steinhoff 300 – 5 257 5 557
3 300 626 5 257 9 183
2008
DE Ackerman 275 242 – 517
DC Brink 138 76 – 214
YZ Cubaº 83 – – 83
CE Daunº 275 – – 275
D Konar 275 308 – 583
JF Moutonº# 275 105 – 380
FA Sonn 275 87 – 362
BE Steinhoff 137 – 2 307 2 444
1 733 818 2 307 4 858
# Includes fees and remuneration in respect of professional services rendered.º Paid to various entities as management fees.
notes to the annual fInancIal statementsfor the year ended 30 June 2009 (cont inued)
198 • steInhoff annual report 2009 • notes to the annual fInancIal statements

43. ReMUNeRATIoN RePoRT (continued)43.1 Remuneration (continued)
2009r’000
2008r’000
Director’s fees and remunerationRemuneration paid by:– Company 3 866 2 634– Subsidiary companies 64 560 73 008
68 426 75 642
43.2 Share rights
executive directors offer date
number of r Ights
aS at 30 June 2008
number of r Ights
( e xercIsed ) /awarded
durIng tHe ye ar
number of r Ights
aS at 30 June 2009
purcHaSe prIce
( cents )
SoLd
date exercIsed/
awarded
marke t prIce
( cents )
HJK Ferreira July 2001 – June 2002 50 000 (50 000) – 528 – 11 November 2008 1 241December 2003 319 909 (319 909) – 0,5 – 1 December 2008 974December 2003 – 305 811 – 0,5 – 1 December 2008 974December 2003 – (305 811) – 0,5 – 1 December 2008 974December 2007• 501 435 – 501 435 0,5 –December 2008 – 408 356 408 356 0,5 – 1 December 2008 974
871 344 38 447 909 791SJ Grobler July 2000 – June 2001 4 160 (4 160) – 540 – 11 November 2008 1 241
July 2001 – June 2002 18 800 (18 800) – 528 – 11 November 2008 & 12 June 2009 1 241 & 1 410December 2003 269 173 (269 173) – 0,5 – 1 December 2008 974December 2003 – 305 811 – 0,5 – 1 December 2008 974December 2003 – (305 811) – 0,5 – 1 December 2008 974December 2007• 501 128 – 501 128 0,5 –December 2008 – 408 356 408 356 0,5 – 1 December 2008 974
793 261 116 223 909 484MJ Jooste July 2000 – June 2001 5 280 (5 280) – 540 – 11 November 2008 1 241
July 2001 – June 2002 14 400 (14 400) – 528 – 11 November 2008 & 12 June 2009 1 241 & 1 410December 2003 1 528 920 (1 528 920) – 0,5 – 1 December 2008 974December 2007• 1 597 922 – 1 597 922 0,5 –December 2008 – 1 306 739 1 306 739 0,5 – 1 December 2008 974
3 146 522 (241 861) 2 904 661FJ Nel July 2000 – June 2001 4 800 (4 800) – 540 – 11 November 2008 1 241
July 2001 – June 2002 12 800 (12 800) – 528 – 11 November 2008 & 12 June 2009 1 241 & 1 410December 2003 313 635 (313 635) – 0,5 – 1 December 2008 974December 2003 – 305 811 – 0,5 – 1 December 2008 974December 2003 – (305 811) – 0,5 – 1 December 2008 974December 2007• 338 951 – 338 951 0,5 –December 2008 – 249 551 249 551 0,5 – 1 December 2008 974
670 186 (81 684) 588 502• Includes rights granted in terms of the 2006 share grant.
notes to the annual fInancIal statements • steInhoff annual report 2009 • 199

43. ReMUNeRATIoN RePoRT (continued)43.2 Share rights (continued)
executive directors offer date
number of r Ights
aS at 30 June 2008
number of r Ights
( e xercIsed ) /awarded
durIng tHe ye ar
number of r Ights
aS at 30 June 2009
purcHaSe prIce
( cents )
SoLd
date exercIsed/
awarded
marke t prIce
( cents )
DM van der Merwe July 2000 – June 2001 5 280 (5 280) – 540 – 11 November 2008 1 241
July 2001 – June 2002 14 400 (14 400) – 528 – 11 November 2008 & 12 June 2009 1 241 & 1 410
December 2003 634 196 (634 196) – 0,5 – 1 December 2008 974
December 2003 – 1 800 248 – 0,5 – 1 December 2008 974
December 2003 – (1 800 248) – 0,5 – 1 December 2008 974
December 2007• 569 106 – 569 106 0,5 –
December 2008 – 430 316 430 316 0,5 – 1 December 2008 974
1 222 982 (223 560) 999 422
IM Topping July 2001 – June 2002 80 000 (80 000) – 528 – 11 November 2008 1 241
December 2003 1 044 700 (1 044 700) – 0,5 – 1 December 2008 974
June 2007 442 494 – 442 494 0,5 –
December 2007 426 442 – 426 442 0,5 –
December 2008 – 598 021 598 021 0,5 – 1 December 2008 974
1 993 636 (526 679) 1 466 957
Total executive directors 8 697 931 (919 114) 7 778 817• Includes rights granted in terms of the 2006 share grant.
notes to the annual fInancIal statementsfor the year ended 30 June 2009 (cont inued)
200 • steInhoff annual report 2009 • notes to the annual fInancIal statements

43. ReMUNeRATIoN RePoRT (continued)43.2 Share rights (continued)
Non-executive directors offer date
number of r Ights
aS at 30 June 2008
number of r Ights
( e xercIsed ) /awarded
durIng tHe ye ar
number of r Ights
aS at 30 June 2009
purcHaSe prIce
( cents )
SoLd
date exercIsed/
awarded
marke t prIce
( cents )
BE Steinhoff July 2000 – June 2001 5 280 (5 280) – 540 – 11 November 2008 1 241
July 2001 – June 2002 14 400 (14 400) – 528 – 11 November 2008 & 12 June 2009 1 241 & 1 410
Total non-executive directors 19 680 (19 680) –
Alternate directors and officers
JNS du Plessis December 2006 208 960 – 208 960 0,5 –
June 2007 189 827 – 189 827 0,5 –
December 2008 – 272 237 272 237 0,5 – 1 December 2008 974
398 787 272 237 671 024
KJ Grové July 2000 – June 2001 5 280 (5 280) – 540 – 11 November 2008 1 241
July 2001 – June 2002 14 400 (14 400) – 528 – 11 November 2008 & 12 June 2009 1 241 & 1 410
July 1999 – June 2000 40 000 – 40 000 1 000 –
July 2000 – June 2001 70 000 – 70 000 1 009 –
July 2001 – June 2002 165 000 – 165 000 910 –
July 2002 – June 2003 165 000 (55 000) 110 000 1 030,5 – Forfeiture
July 2004 – June 2005 210 000 (105 000) 105 000 1 322,5 – Forfeiture
July 2005 – June 2006 225 000 – 225 000 1 550,5 –
November 2006 361 000 (180 500) 180 500 2 100 – Forfeiture
December 2007 216 360 – 216 360 0,5 –
December 2008 – 294 016 294 016 0,5 – 1 December 2008 974
1 472 040 (66 164) 1 405 876
A Krüger-Steinhoff@ July 2000 – June 2001 2 400 (2 400) – 540 – 11 November 2008 1 241
July 2001 – June 2002 19 800 (19 800) – 528 – 11 November 2008 & 12 June 2009 1 241 & 1 410
22 200 (22 200) –
Total alternate directors and officers 1 893 027 183 873 2 076 900
@ Non-executive director.
notes to the annual fInancIal statements • steInhoff annual report 2009 • 201

43. ReMUNeRATIoN RePoRT (continued)43.2 Share rights (continued)
Share right schemeIn terms of the share incentive scheme approved at a general meeting and implemented on and since listing the company in 1998, rights were allocated in terms of a deferred delivery scheme. The deferred delivery date is three years from the offer date, maturing at 20% per annum.
At the annual general meeting on 1 December 2003, a new share incentive scheme was approved and implemented. These rights were allocated at a nominal value of 0,5 cents and will mature in ⅓ (one-third) tranches per annum from the third anniversary of the effective date, provided the following performance criteria have been achieved:
a) A compound growth in headline earnings per share (HEPS) of the company equal to or exceeding the weighted average growth of the companies included in and comprising the INDI 25 Index (INDI 25) over a three-year period from the effective date.
b) The volume-weighted average traded share price of the company over the 30-trading days immediately preceding the date of measurement (the measurement date) to exceed the result of the following formula,[{(a-b)/b}+1] x c, where
a = the INDI 25 at the measurement date
b = the INDI 25 at the effective date
c = the volume-weighted average traded share price of the company for the 30-trading days immediately preceding the effective date.
In the event of the criteria not being satisfied by the third anniversary of the effective date, the rights will be extended to the following years on a cumulative basis, provided however that if both the criteria are not met by the end of the financial year in which the fifth anniversary of the effective date occurs, all rights will lapse and neither the shares (nor any of them) nor any amount will be due to any participant.
The share rights granted in December 2006, June 2007, December 2007 and December 2008 relate to the 2003 scheme described above, but subject to the dates for achievement of hurdles referred to below.
These rights were allocated at a nominal value of 0,5 cents and will mature on the third anniversary of the effective date, provided the following performance criteria have been achieved:
a) A compound growth in HEPS of the company, over the three completed financial years commencing on 1 July 2006, 1 July 2007 and 1 July 2008 respectively, equal to or exceeding the weighted average growth of the companies included in and comprising the INDI 25 over a three-year period from the effective date.
b) The volume-weighted average traded share price of the company over the 30-trading days immediately preceding the measurement date to exceed the result of the following formula:[{(a-b)/b}+1] x c, where the variables have the same meaning as for the December 2003 grant described above.
The rights awarded in December 2003, December 2006, June 2007, December 2007 and December 2008 form part of the share-based payment scheme, and the rights prior to these dates relate to the Steinhoff International Share Trust scheme. For detail on these schemes, refer note 24.
notes to the annual fInancIal statementsfor the year ended 30 June 2009 (cont inued)
202 • steInhoff annual report 2009 • notes to the annual fInancIal statements

43. ReMUNeRATIoN RePoRT (continued)43.3 Interest in share capital
number of shares
executive directors d Irect IntereSt
benefIcIal IndIrect IntereSt
benefIcIal IndIrect IntereSt
non-benefIcIal totaL
2009HJK Ferreira 50 000 4 121 738 – 4 171 738SJ Grobler – 4 813 705 – 4 813 705MJ Jooste – 31 253 415 – 31 253 415FJ Nel 59 413 4 822 523 – 4 881 936IM Topping 1 600 000 – – 1 600 000DM van der Merwe – 6 880 572 – 6 880 572
1 709 413 51 891 953 – 53 601 3662008MJ Jooste – 23 127 750 – 23 127 750FJ Nel 26 698 4 822 625 – 4 849 323IM Topping 1 120 000 – – 1 120 000DM van der Merwe – 4 426 448 – 4 426 448JHN van der Merwe 1 120 2 578 880 – 2 580 000
1 147 818 34 955 703 – 36 103 521Non-executive directors2009DE Ackerman 354 935 – – 354 935DC Brink – 108 960 – 108 960YZ Cuba – – 8 096 800 8 096 800CE Daun – 357 477 – 357 477D Konar 304 015 – – 304 015JF Mouton – 3 500 000 – 3 500 000FA Sonn – 40 000 – 40 000BE Steinhoff 336 446 161 074 985 – 161 411 431
995 396 165 081 422 8 096 800 174 173 6182008DE Ackerman 354 935 – – 354 935DC Brink – 108 960 – 108 960YZ Cuba – – 8 096 800 8 096 800CE Daun – 357 477 – 357 477D Konar 304 015 – – 304 015JF Mouton – 3 000 000 – 3 000 000FA Sonn – 40 000 – 40 000BE Steinhoff 316 766 160 076 117 – 160 392 883
975 716 163 582 554 8 096 800 172 655 070
notes to the annual fInancIal statements • steInhoff annual report 2009 • 203

notes to the annual fInancIal statementsfor the year ended 30 June 2009 (cont inued)
43. ReMUNeRATIoN RePoRT (continued)43.3 Interest in share capital (continued)
number of shares
Alternate directors and officers d Irect IntereSt
benefIcIal IndIrect IntereSt
benefIcIal IndIrect IntereSt
non-benefIcIal totaL
2009
JNS du Plessis – 100 000 – 100 000
KJ Grové – 2 846 200 – 2 846 200
A Krüger-Steinhoff@ 598 100 55 000 – 653 100
598 100 3 001 200 – 3 599 300
2008
JNS du Plessis – 100 000 – 100 000
HJK Ferreira – 4 117 000 – 4 117 000
SJ Grobler (company secretary) – 4 805 354 – 4 805 354
KJ Grové – 2 826 520 – 2 826 520
A Krüger-Steinhoff@ 575 900 55 000 – 630 900
575 900 11 903 874 – 12 479 774
@ Non-executive director.
204 • steInhoff annual report 2009 • notes to the annual fInancIal statements

44. INSURANCe AND INSURANCe RISK MANAGeMeNTThe group through one of its African subsidiaries issues insurance contracts and is thus required to include the disclosures as required by IFRS 4 – Insurance Contracts.The primary insurance activity carried out by the group assumes the risk of loss from persons or organisations that are directly subject to the risk. Such risks relate to motor, accident and health, assets, liability and commercial crime. As such the group is exposed to the uncertainty surrounding the timing and severity of claims under the contract. The group also has exposure to market risk through its investment activities, which are limited to call accounts.The group manages its insurance risk through underwriting limits, approval procedures for transactions that involve new products or that exceed set limits, pricing guidelines, centralised management of reinsurance and monitoring of emerging issues.The group uses several methods to assess and monitor insurance risk exposures both for individual types of risks insured and overall risks. These methods include internal risk measurement models and sensitivity analyses. The theory of probability is applied to the pricing and provisioning for a portfolio of insurance contracts. The principle risk is that the frequency and severity of claims is greater than expected. Insurance events are, by their nature, random, and the actual number and size of events during any one year may vary from those estimated using established statistical techniques.The underwriting strategy is reviewed quarterly, a claims assessment process is undertaken and market trends are evaluated. In addition management reviews certain information monthly which includes premium income and loss ratios by class.The group reinsures a portion of the risk it underwrites in order to control its exposure to losses and protect capital resources. The reinsurer is rated by external rating agencies and the group reviews its reinsurance arrangements periodically. The group obtains board approval in setting the minimum security criteria for acceptable reinsurance and the monitoring of the purchase of reinsurance against those criteria.The following gives an assessment of the group’s main products and the ways in which it manages the associated risks.
Credit protection planProduct featuresShort-term insurance product sold to settle the amount owing which is equal to the aggregate “statutory early settlement figures” in terms of the credit agreement being those that apply when the liability under a credit agreement is settled in a single sum, determined as at the date of death or permanent disability. When temporary disability is encountered by the insured, amounts equal to the monthly instalments due in terms of the credit agreement are paid to the finance house lasting for the duration of the illness or if the insured is retrenched, the deferment of the instalment as well as covering any additional interest accrued during the period of deferment.Management of risksThe main risks associated with this product are HIV/Aids, competitor products, i.e. finance house/manufacturer and affordability.The key risks are managed by excluding pre-existing conditions, with a detailed medical report required before settlement. The risk period is limited to the finance period, which is a maximum of five years. There is a sophisticated claims vetting process and catastrophe reinsurance in place. The catastrophe cover is spread over classes of business and the cover is readily available in the market. There is a continuing monitoring of the market to ensure competitive pricing and benefits and there are agreements in place with the major finance houses in terms of the finance/insurance split.
extra coverProduct featuresShort-term insurance products sold to cover the shortfall encountered between what the insured owes the finance house and the amount the comprehensive insurer pays out when the vehicle is written off or stolen. It is also a violation cover which ensures that the comprehensive cover will be reinstated should the insured inadvertently violate certain policy conditions. There is also a deposit cover component in the event that the vehicle is stolen or written off; a pro rata portion of the lost deposit for the remaining period of the credit agreement will be reimbursed back to the insured. In addition, cover is provided for chips and scratches to the vehicle, as well as protection of the excess due to a comprehensive insurer in the event of a total loss.Management of risksThe main risks associated with this product are high crime rates which in turn mean vehicle theft with high volumes of shortfall and deposit claims and competitor products i.e. finance houses.The key risks are managed by monitoring of trends in the market, measurement against frequency and severity benchmarks and catastrophe reinsurance. There are agreements in place with the major finance houses in terms of the finance/insurance split.
WarrantyProduct featuresShort-term insurance products sold to extend the warranty offered on the purchase of a new vehicle up to an additional two years or 180 000 km. Also on offer is a mechanical breakdown insurance on pre-owned vehicles which covers breakdown of the major mechanical components such as the engine, gearbox, steering and the fuel system.Management of risksThe main risks associated with this product are high claims ratios, manufacturer products and competitor products/incentives.The key risks are managed by an experienced claims vetting process, continuous measurement against benchmarks per dealership and franchise and an ongoing communication with the dealer channel in terms of sales risk profiling and dealer repair costs. There is also an ongoing measurement of dealership sales of own and other products.
notes to the annual fInancIal statements • steInhoff annual report 2009 • 205

notes to the annual fInancIal statementsfor the year ended 30 June 2009 (cont inued)
44. INSURANCe AND INSURANCe RISK MANAGeMeNT (continued)Corporate/CommercialProduct featuresCover is provided for Steinhoff Africa under assets, liabilities and commercial crime policies. This is fully reinsured with a spread of both local and international reinsurers.
Management of risksCovers are placed using independent brokers which are vetted at board level. All risks are reinsured out at 100% with A-rated reinsurers.
Credit riskThe major credit risks arise from outstanding premiums, reinsurers’ balances and investment balances. Management has a credit policy in place and exposure to credit risk is monitored on an ongoing basis and there is no significant concentration of credit risk. Reputable financial institutions are used for investing cash handling purposes. The maximum exposure to credit risk is represented by the carrying value of each financial asset in the balance sheet.
Liquidity riskThe group has to meet daily calls on its cash resources, notably from claims arising on its general insurance contracts. There is a risk that cash will not be available to settle liabilities when due at a reasonable cost. The group manages this risk by setting minimum cash balances on the current account so as to settle these liabilities.
Reinsurance riskThe group cedes insurance risk to limit exposure to underwriting losses under various agreements that cover individual risks, group risks or defined blocks of business on a catastrophe excess basis. These reinsurance agreements spread the risk and minimise the effect of losses. The amount of each risk retained depends on the group’s evaluation of the specific risk, subject in certain circumstances, to maximum limits based on characteristics of coverage. The reinsurer agrees to reimburse the ceded amount in the event the claim is paid. However the group remains liable to its policyholder with respect to ceded insurance if any reinsurer fails to meet its obligations.
Claims developmentThe unpaid claims estimates are current and there are no long outstanding amounts. The estimate is increased or decreased as losses are paid and more information becomes known about the frequency and severity of unpaid claims. The group believes that the estimate of total claims outstanding as at 30 June 2009 is adequate.
Each notified claim is assessed on a separate, case by case basis with due regard to the claims circumstance, information available from loss adjusters and historical evidence of the size of similar claims. Case estimates are reviewed regularly and are updated as and when new information arises.
For all other risks, the cost of outstanding claims and the incurred but not reported (IBNR) provisions are estimated using generally accepted insurance practices. Such methods extrapolate the development of paid and incurred claims, average cost per claim and the ultimate claim numbers for each accident year based on observed development of earlier years and expected loss ratios.
IBNR provisions are initially estimated at a gross level and a separate calculation is carried out to estimate the size of reinsurance recoveries. The method used by the group takes historical data, gross IBNR estimates and the details of the reinsurance programme, to assess the expected size of the reinsurance recoveries.
206 • steInhoff annual report 2009 • notes to the annual fInancIal statements

44. INSURANCe AND INSURANCe RISK MANAGeMeNT (continued)
motorr’000
accIdent & He aLtH
r’000aSSe tS
r’000l IabIl It y
r’000
commercIaL crImer’000
totaLr’000
2009
Premiums
Gross premiums 45 132 2 720 38 679 4 386 1 584 92 501
Unearned premium provision movement (2 323) 16 829 – – – 14 506
Gross earned premiums 42 809 19 549 38 679 4 386 1 584 107 007
Premiums ceded to reinsurers (14 730) (2 513) (38 679) (4 386) (1 584) (61 892)
28 079 17 036 – – – 45 115
Claims incurred net of reinsurance
Net outstanding claims and IBNR opening balance 2 060 818 – – – 2 878
Net claims insured 8 243 3 121 – – – 11 364
Claims paid (8 001) (3 255) – – – (11 256)
Net outstanding claims and IBNR closing balance 2 302 684 – – – 2 986
2008
Premiums
Gross premiums 39 600 71 – – – 39 671
Unearned premium provision movement 21 277 27 280 – – – 48 557
Gross earned premiums 60 877 27 351 – – – 88 228
Premiums ceded to reinsurers (10 963) 18 – – – (10 945)
49 914 27 369 – – – 77 283
Claims incurred net of reinsurance
Net outstanding claims and IBNR opening balance 4 887 3 480 – – – 8 367
Net claims insured 5 961 787 – – – 6 748
Claims paid (8 788) (3 449) – – – (12 237)
Net outstanding claims and IBNR closing balance 2 060 818 – – – 2 878
Contingency reserveIn terms of the Short Term Insurance Act (No 53 of 1998), the group is required to raise a contingency reserve of 10% of the premiums written less approved reinsurances (as defined in the Short Term Insurance Act). The reserve can be utilised only with prior permission of the Registrar of Insurance.
International solvency marginThe international solvency margin represents net assets as a percentage of net premiums written.
notes to the annual fInancIal statements • steInhoff annual report 2009 • 207

notes to the annual fInancIal statementsfor the year ended 30 June 2009 (cont inued)
2009 2008 r’000 r’000
44. INSURANCe AND INSURANCe RISK MANAGeMeNT (continued)Earned premiums, net of reinsurance 45 115 77 283
Claims incurred, net of reinsurance and net operating expenses 25 961 36 424
Cash inflow/(outflow) from operating activities 9 270 (846)
Liabilities
Opening balance 71 964 132 692
Amounts raised 37 894 6 041
Amounts used (7 978) (66 769)
Closing balance 101 880 71 964
Maturity profile:
Within one year 52 423 34 941
Two to five years 49 457 37 023
101 880 71 964
Assets
Opening balance 284 370 293 440
Amounts raised 134 113 35 318
Amounts used (63 539) (44 388)
Closing balance 354 944 284 370
The above assets are neither past due nor impaired.
208 • steInhoff annual report 2009 • notes to the annual fInancIal statements

45. NeW ACCoUNTING PRoNoUNCeMeNTS
At the date of authorisation of these annual financial statements, there are standards and interpretations in issue but not yet effective. These include the following standards and interpretations that have not been early adopted and may have an impact on future financial statements:
effectIve date – annual perIods commencIng on or af ter
IAS 1 Presentation of Financial Statements (revised) 1 January 2009IAS 27 Consolidated and Separate Financial Statements (revised) 1 July 2009IAS 28 Investment in Associates (revised) 1 July 2009IAS 31 Interest in Joint-ventures (revised) 1 July 2009IFRS 2 Share-based Payment – Group cash-settled share-based payment transactions 1 January 2010IFRS 3 Business Combinations (revised) 1 July 2009IFRS 7 Financial Instruments: Disclosure: Improving disclosures about financial instruments 1 January 2009Circular 3/2009 Headline Earnings 1 September 2008Improvement to IFRSs 2008:IFRS 5 Non-current Assets Held for Sale and Discontinued Operations 1 July 2009IAS 16 Property, Plant and Equipment: Sale of assets held for rental 1 January 2009IAS 27 Consolidated and Separate Financial Statements: Measurement of subsidiary held for sale in separate financial statements 1 January 2009Improvement to IFRSs 2009:IFRS 2 Share-based Payment: Scope of IFRS 2 and revised IFRS 3 1 July 2009IAS 38 Intangible Assets: Additional consequential amendments arising from revised IFRS 3 1 July 2009IFRIC 9 Reassessment of Embedded Derivatives: Scope of IFRIC 9 and revised IFRS 3 1 July 2009
45.1 IAS 1 (revised)
In September 2007, the IASB issued IAS 1 (revised) – Presentation of Financial Statements. This revised statement is effective for annual periods beginning on or after 1 January 2009. This statement requires an entity to present all non-owner changes in equity (that is, ‘comprehensive income’) either in one statement of comprehensive income or in two statements (a separate income statement and a statement of comprehensive income). It also requires an entity to present a balance sheet as at the beginning of the earliest comparative period in a complete set of financial statements when the entity applies an accounting policy retrospectively or makes a retrospective restatement. This statement will affect only the disclosure of financial information and will be adopted by the group in the next financial year.
45.2 IAS 27 (revised)
In January 2008, the IASB issued IAS 27 (revised) – Consolidated and Separate Financial Statements (IAS 27). This revised statement is effective for annual periods beginning on or after 1 July 2009. The objective of this statement is to reduce the alternatives in accounting for subsidiaries in consolidated financial statements and in accounting for investments in the separate financial statements of the parent, venturer or investor. The amendments relate primarily to accounting for non-controlling interests and the loss of control of a subsidiary. The statement will be adopted by the group in the next financial year.
45.3 IAS 28 (revised) and IAS 31 (revised)
In January 2008, the IASB issued IAS 28 (revised) – Investments in Associates and IAS 31 (revised) – Interests in Joint-ventures. These revised statements are effective for annual periods beginning on or after 1 July 2009. These statements were both revised to reflect the changes made in IAS 27 and IFRS 3 – Business Combinations (IFRS 3) as discussed in this note. The statements will be adopted by the group in the next financial year.
45.4 IFRS 2 (amended)
On 18 June 2009, the IASB issued amendments to IFRS 2 – Share-based Payment (IFRS 2). These amendments are effective for annual periods beginning on or after 1 January 2010. These amendments clarify the scope of IFRS 2, as well as the accounting for group cash-settled share-based payment transactions in the separate financial statements of an entity receiving the goods or services when another group entity or shareholder has the obligation to settle the award. Guidance in this area previously provided in IFRIC 8 – Scope of IFRS 2 and IFRIC 11 – Group and Treasury Share Transactions has been incorporated into the amended IFRS 2. The group complies to these IFRIC’s and thus the amendments to IFRS 2 should not have a material effect on the group results once adopted.
notes to the annual fInancIal statements • steInhoff annual report 2009 • 209

notes to the annual fInancIal statementsfor the year ended 30 June 2009 (cont inued)
45. NeW ACCoUNTING PRoNoUNCeMeNTS (continued)45.5 IFRS 3 (revised)
In January 2008, the IASB issued a revised IFRS 3. This standard is effective for annual periods beginning on or after 1 July 2009. Among other changes it requires transaction costs to be recognised immediately in profit or loss, fair value gains and losses on existing investments in an acquired company to be recognised in profit or loss on the date of acquisition and adjustments to deferred taxation outside of the hindsight period are recorded under IAS 12 – Income Taxes, as opposed to affecting goodwill. In addition, it requires the recognition of subsequent changes in the fair value of contingent consideration in profit or loss rather than against goodwill. The statement will be adopted by the group in the next financial year.
45.6 IFRS 7 (amended)
On 5 March 2009, the IASB issued amendments to enhance disclosures about fair value measurements of financial instruments and over liquidity risk. This amendment will have no impact on the reported numbers and will only affect disclosures. The entity provided some of the additional disclosures in this year’s financial statements and will provide all disclosures required by this amendment by the next financial year-end.
45.7 Circular 3/2009
Listed companies are required, in terms of JSE listings requirements, to publish a headline earnings figure which is currently determined in accordance with Circular 8/2007 – Headline Earnings. Circular 8/2007 contains various rules on IFRSs which were issued before June 2007. Many amendments to IFRSs have been issued since June 2007 and as a result Circular 3/2009 – Headline Earnings has been issued to revise Circular 8/2007. Circular 3/2009 has amended the rules table of Circular 8/2007 to take into account all amendments to IFRSs issued from June 2007 to April 2009. The group correctly applied the definitions of Circular 8/2007 to statements early adopted, so no restatement would be required.
45.8 Improvement to IFRSs 2008
On 22 May 2008, the IASB issued the Improvement to IFRSs 2008 standard. This standard deals with a number of minor amendments to other standards. The group adopted most of the amendments of this standard. The amendments to IFRS 5 – Non-current Assets Held For Sale and Discontinued Operations and IAS 27 will be adopted with the changes in IFRS 3 (revised) and IAS 27 (revised). The change to IAS 16 – Property, Plant and Equipment will be adopted in the next financial year. None of these amendments are expected to have a significant impact on the group’s results.
45.9 Improvement to IFRSs 2009
On 16 April 2009, the IASB issued the Improvement to IFRSs 2009 standard. The group adopted most of the amendments of this standard. The amendments to IFRS 2, IAS 38 – Intangible Assets and IFRIC 9 – Reassessment of Embedded Derivatives will be adopted by the group with the application of IFRS 3 (revised) in the next financial year. None of these amendments are expected to have a significant impact on the group’s results.
210 • steInhoff annual report 2009 • notes to the annual fInancIal statements

specIal resolutIons passedfor the year ended 30 June 2009
1. 263 Oxford Road (Proprietary) Limited
1959/001962/07• Theregistrationofthesaleoftheimmovableassetinthecompany.
The Special Resolution was approved, and registered on 29 July 2008.
2. Phaello Finance Company (Proprietary) Limited
1965/001780/07• Theregistrationoftheamendmenttotheexistingarticlesofassociation.
The Special Resolution was approved, and registered on 3 September 2008.
3. Steinbuild Holdings (Proprietary) Limited
1995/008188/07• TheregistrationofthechangeofnamefromSteinhoffAfricaRetailHoldings
(Proprietary) Limited to Steinbuild Holdings (Proprietary) Limited.The Special Resolution was approved, and registered on 7 September 2008.
4. Steinbuild Properties (Proprietary) Limited
1996/011622/07• TheregistrationofthechangeofnamefromSteinhoffRetailProperties
(Proprietary) Limited to Steinbuild Properties (Proprietary) Limited.The Special Resolution was approved, and registered on 7 September 2008.
5. Steinhoff Sikhulasonke Investments (Proprietary) Limited
1971/008683/07• TheregistrationofthechangeofnamefromBolaoboleta(Cape)(Proprietary)
Limited to Steinhoff Sikhulasonke Investments (Proprietary) Limited.The Special Resolution was approved, and registered on 20/10/2008.
• Theregistrationoftheconversionofthe4000ordinaryshares,intheauthorisedcapital of the company, into 3 000 ordinary shares of R1.00 each and 1 000 variable rate cumulative redeemable preference shares of R1.00 each.
• Theadoptionofnewarticlesofassociation.The Special Resolutions were approved, and registered on 5 February 2009.
6. Autumn Star Trading 306 (Proprietary) Limited
2004/027632/07• Theamendmenttothememorandumofassociationbythesubstitutionofthe
description of the main business and main object with the following:The business of retail of new and used medium and heavy duty vehicles and sale of ancillary services, parts and after sale service and rental of medium and heavy vehicles.The Special Resolution was approved, and registered on 21 October 2008.
7. Double Ring Investments 233 (Proprietary) Limited
2004/027574/07• TheregistrationofthechangeofnamefromDoubleRingTrading233
(Proprietary) Limited to Double Ring Investments 233 (Proprietary) Limited.• Theamendmenttothememorandumofassociationbythesubstitutionofthe
main business and main object with the following:Acquisition, development and rental of immovable property.The Special Resolutions were approved, and registered on 2 December 2008.
specIal resolutIons passed • steInhoff annual report 2009 • 211

8. Agattu Trading 70 (Proprietary) Limited
2007/028307/07• Theregistrationofthesubdivisionoftheordinarysharesoftheauthorisedand
issued share capital of the company.• Theamendmenttothememorandumofassociationbythesubstitutionofthe
main business and main object with the following:The business of car rentals and purposes ancillary thereto.The Special Resolutions were approved, and registered on 2 December 2008.
9. Steinhoff International Holdings Limited
1998/003951/06• Theregistrationoftheblackeconomicempowermentownershiptransactionin
terms of Section 38(2A)(b) of the Companies Act.• Theauthorisationfortheacquisitionbythecompanyofsharesissuedbyitin
terms of Sections 85(1) and 89 of the Companies Act.The Special Resolutions were approved, and registered on 12 December 2008.
10. Mega Express (Proprietary) Limited
2004/027663/07• Theadoptionofnewarticlesofassociation.
The Special Resolution was approved, and registered on 23 March 2009.• TheregistrationofthechangeofnamefromZamori233(Proprietary)Limitedto
Mega Express (Proprietary) Limited.• Theamendmenttothememorandumofassociationbythesubstitutionofthe
description of the main business and main object with the following:To operate bus feeder and distribution services for the Gautrain and purposes ancillary thereto.The Special Resolutions were approved, and registered on 8 June 2009.
11. Alisa Car Sales (Proprietary) Limited
1997/017428/07• Theadoptionofnewarticlesofassociation.
The Special Resolution was approved, and registered on 14 April 2009.
12. Alisa Finance Corporation (Proprietary) Limited
1997/017682/07• Theadoptionofnewarticlesofassociation.
The Special Resolution was approved, and registered on 14 April 2009.
13. Mpumatrans (Proprietary) Limited
2000/026280/07• Theadoptionofnewarticlesofassociation.
The Special Resolution was approved, and registered on 14 April 2009.
14. Autonation (Proprietary) Limited
2006/020283/07• Theadoptionofnewarticlesofassociation.
The Special Resolution was approved, and registered on 14 April 2009.
15. Unitrans Freight Investments (Proprietary) Limited
2002/010761/07• Theadoptionofnewarticlesofassociation.
The Special Resolution was approved, and registered on 14 April 2009.
16. Unitrans Ocean Logistics (Proprietary) Limited
1999/028370/07• Theadoptionofnewarticlesofassociation.
The Special Resolution was approved, and registered on 14 April 2009.
specIal resolutIons passedfor the year ended 30 June 2009 (cont inued)
212 • steInhoff annual report 2009 • specIal resolutIons passed

17. Bojanala Leasing (Proprietary) Limited
2002/032055/07• Theadoptionofnewarticlesofassociation.
The Special Resolution was approved, and registered on 14 April 2009.
18. Greyhound Property Leasing (Proprietary) Limited
1999/003694/07• Theadoptionofnewarticlesofassociation.
The Special Resolution was approved, and registered on 14 April 2009.
19. A2B Passenger Logistics (Proprietary) Limited
2000/024603/07• Theadoptionofnewarticlesofassociation.
The Special Resolution was approved, and registered on 14 April 2009.
20. Amandla Mega Bus (Proprietary) Limited
2000/026206/07• Theadoptionofnewarticlesofassociation.
The Special Resolution was approved, and registered on 14 April 2009.
21. Unitrans Passenger Training Service (Proprietary) Limited
2004/032104/07• Theadoptionofnewarticlesofassociation.
The Special Resolution was approved, and registered on 14 April 2009.
22. Mega Tourer (Proprietary) Limited
2001/026485/07• Theadoptionofnewarticlesofassociation.
The Special Resolution was approved, and registered on 2 June 2009.
23. Unitrans Express Investment (Proprietary) Limited
2002/010738/07• Theadoptionofnewarticlesofassociation.
The Special Resolution was approved, and registered on 4 June 2009.
24. Unitrans Freight Services (Fuel and Chemical) (Proprietary) Limited
1998/025129/07• Theadoptionofnewarticlesofassociation.
The Special Resolution was approved, and registered on 4 June 2009.
specIal resolutIons passed • steInhoff annual report 2009 • 213

ANALYSIS oF SHAReHoLDING FoR THe YeAR eNDeD 30 JUNe 2009
SHAREHOLDER TYPEPUBLIC DIRECTORS OTHER
number % number % number %
Shareholders in South Africa• Numberofshareholders 6 952 99,75 13 0,19 4 0,06• Numberofshares 862 744 747 86,79 67 352 276 6,78 63 958 798 6,43Shareholders outside of South Africa• Numberofshareholders 582 99,15 4 0,68 1 0,17• Numberofshares 209 551 840 55,83 164 022 008 43,70 1 788 458 0,47Total• Numberofshareholders 7534 99,71 17 0,22 5 0,07• Numberofshares 1 072 296 587 78,30 231 374 284 16,90 65 747 256 4,80
30 JUNE 2009 % 30 JUNE 2008 %According to the share register of the company the following shareholders are registered as holding in excess of 5% of the issued share capital of the company:SCMB Custody account 562 616 546 41,19 545 046 853 40,38Nedcor Bank Nominees Limited 447 283 648 32,75 312 358 051 23,14First National Nominees (Proprietary) Limited 234 872 777 17,20 223 072 512 16,53
1 244 772 971 91,14 1 080 477 416 80,05Save for the above, according to the disclosure in terms of section 140A of the Companies Act, the following shareholders are registered as holding in excess of 5% of the issued share capital of the company, as compiled from the nominee disclosures:RMB Asset Management and funds administered by them 66 267 280 4,84 209 774 798 15,54BS Beteiligungs und Verwaltungs GmbH 161 411 431 11,80 160 392 883 11,88Investec Asset Management 319 763 103 23,35 201 699 813 14,94Public Investments Commissioners 178 438 605 13,03 123 338 651 9,14Old Mutual Asset Managers 57 578 811 4,20 73 001 182 5,41
CLOSING PRICE(RAND PER SHARE)
AVERAGE DAILYTRADING VOLUME
HIgH low number of shares
The following table sets out the high and low closing prices of Steinhoff shares and the average daily trading volume of our shares on a yearly basis for the last ten financial years, as reported by I-Net Bridge (Proprietary) Limited, a South African financial information service:2000 6,75 3,90 772 9882001 7,50 5,80 890 1682002 9,13 6,20 1 471 1252003 8,20 4,55 1 371 3382004 9,05 6,60 2 896 8072005 15,40 7,60 3 186 5782006 24,40 15,30 4 193 2732007 26,90 20,36 4 670 4032008 24,15 15,25 5 389 9472009 18,90 8,96 5 801 708
214 • steInhoff annual report 2009 • analysIs of shareholdIng
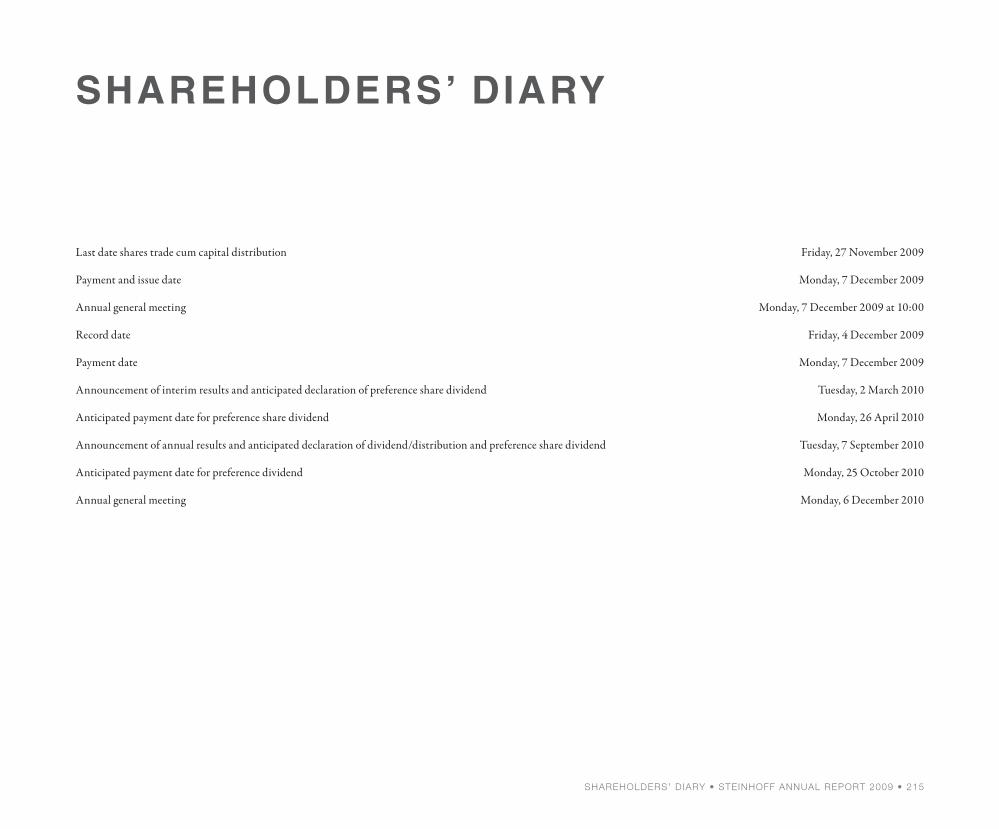
Last date shares trade cum capital distribution Friday, 27 November 2009
Payment and issue date Monday, 7 December 2009
Annual general meeting Monday, 7 December 2009 at 10:00
Record date Friday, 4 December 2009
Payment date Monday, 7 December 2009
Announcement of interim results and anticipated declaration of preference share dividend Tuesday, 2 March 2010
Anticipated payment date for preference share dividend Monday, 26 April 2010
Announcement of annual results and anticipated declaration of dividend/distribution and preference share dividend Tuesday, 7 September 2010
Anticipated payment date for preference dividend Monday, 25 October 2010
Annual general meeting Monday, 6 December 2010
shareholders’ dIary
shareholders’ dIary • steInhoff annual report 2009 • 215

registration number1998/003951/06
registereD office28 Sixth StreetWynbergSandton, 2090(PO Box 1955, Bramley, 2018)
websitehttp://www.steinhoffinternational.com
secretarySJ Grobler28 Sixth StreetWynbergSandton, 2090(PO Box 1955, Bramley, 2018)
auDitorsDeloitte & Touche, Charted Accountants (SA)221 Waterkloof RoadWaterkloof, 0181(PO Box 11007, Hatfield, 0028)
transfer secretariesComputershare Investor Services (Proprietary) Limited(Registration number 2004/003647/07)Ground Floor, 70 Marshall StreetJohannesburg, 2001(PO Box 61051, Marshalltown, 2107)
commercial bankStandard Corporate and Merchant Bank(A division of The Standard Bank of South Africa Limited)(Registration number 1962/000738/06)Ground Floor, 3 Simmonds StreetJohannesburg, 2001(PO Box 61150, Marshalltown, 2107)
In addition, the group has commercial facilities with various other banking and financial institutions worldwide.
sponsorPSG Capital (Proprietary) Limited(Registration number 2002/017362/06)Building 8Woodmead Estate1 Woodmead DriveWoodmead, 2157(PO Box 987, Parklands, 2191)
corporate InformatIon
216 • steInhoff annual report 2009 • corporate InformatIon


![Obesity for medical students.ppt [Read-Only] · Obesity rates could double in n 30 30 years n n n n n n l l l l l l t o o u u u u n l o 50 40 30 20 10 0 % o f p o p u l a t i o n](https://img.dokumen.tips/doc/110x75/5f69c2065ed9c21bae08d305/obesity-for-medical-read-only-obesity-rates-could-double-in-n-30-30-years-n-n.jpg)