Embed Size (px)
Citation preview
© Teachers’ Curriculum Institute New Nation-States from the Old Soviet Empire: Will They Succeed? 1
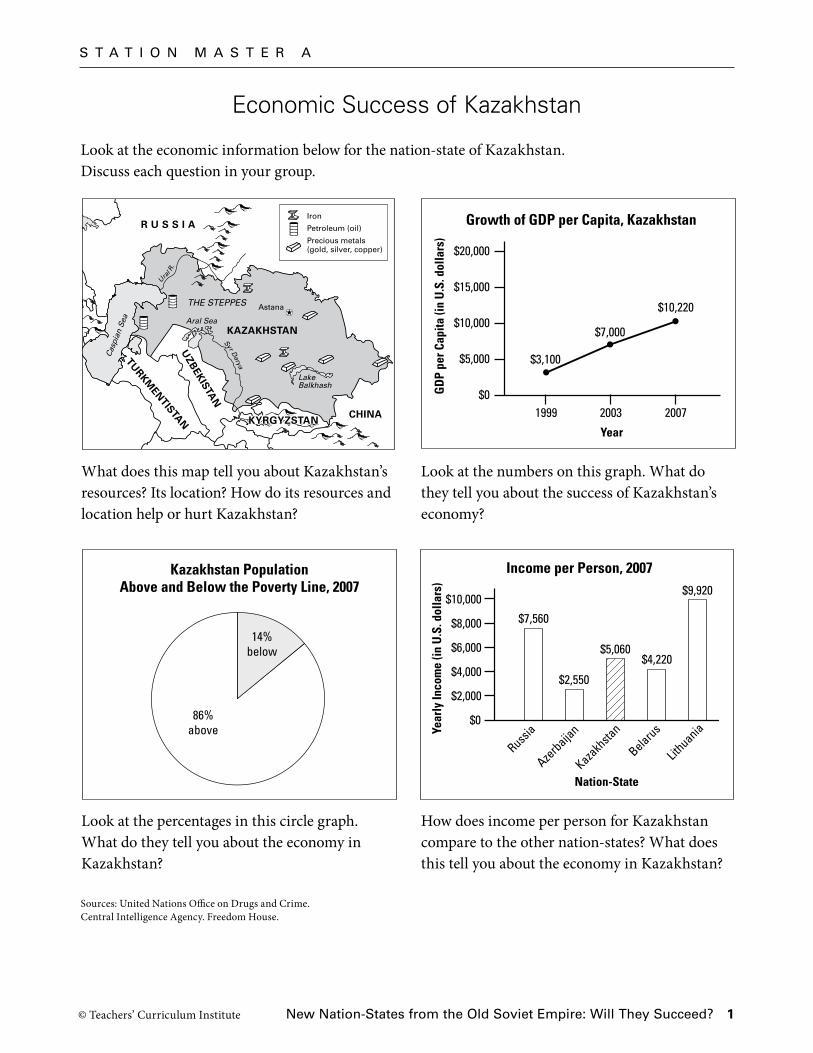
Look at the economic information below for the nation-state of Kazakhstan. Discuss each question in your group.
What does this map tell you about Kazakhstan’s resources? Its location? How do its resources and location help or hurt Kazakhstan?
Look at the numbers on this graph. What do they tell you about the success of Kazakhstan’s economy?
Look at the percentages in this circle graph. What do they tell you about the economy in Kazakhstan?
How does income per person for Kazakhstan compare to the other nation-states? What does this tell you about the economy in Kazakhstan?
KYRGYZSTANKYRGYZSTAN
KAZAKHSTAN
CHINAKYRGYZSTAN
UZBEKISTA
N
TURKM
ENTISTAN
R U S S I A
Cas
pian
Sea
Aral Sea
THE STEPPES
LakeBalkhash
U
ra
l R.
Syr Darya
Astana
Iron
Petroleum (oil)
Precious metals(gold, silver, copper)
TCI5 252 GA_LG_18_SM_A.epsSecond Proof
GA_LG_18_SM_18A-2_rv2.epsB/W2nd Proof4-27-2009
Growth of GDP per Capita, Kazakhstan
GD
P pe
r Cap
ita (i
n U
.S. d
olla
rs)
Year
$3,100
$7,000
1999 2003 2007
$10,220
$20,000
$15,000
$10,000
$5,000
$0
GA_LG_18_SM_18A-3_rv1.epsB/W1st Proof4-13-2009
Kazakhstan PopulationAbove and Below the Poverty Line, 2007
14%below
86%above
GA_LG_18_SM_18A-4_rv1.epsB/W1st Proof4-13-2009
Year
ly In
com
e (in
U.S
. dol
lars
)
Nation-State
Income per Person, 2007
$10,000
$8,000
$6,000
$4,000
$2,000
$0
$7,560
$2,550
$5,060$4,220
$9,920
Russia
Azerbaija
n
Kazakh
stan
Belarus
Lithuania
Sources: United Nations Office on Drugs and Crime. Central Intelligence Agency. Freedom House.
S T A T I O N M A S T E R A
Economic Success of Kazakhstan

© Teachers’ Curriculum Institute New Nation-States from the Old Soviet Empire: Will They Succeed? 2
Look at the political information below for the nation-state of Kazakhstan. Discuss each question in your group.
Look at these circle graphs. What do they tell you about possible ethnic and religious tension in Kazakhstan?
Compare the level of crime in Kazakhstan to the other nation-states. What might this tell you about security in Kazakhstan?
Notice how the numbers change in this table. What might this tell you about quality of life for people in Kazakhstan?
On this scale, 1 represents the highest degree of freedom, and 7 the lowest. Have the rankings for Kazakhstan gone up, gone down, or mostly stayed the same over time? What does this tell you about rights and freedoms in Kazakhstan?
Sources: World Bank. Central Intelligence Agency.
GA_LG_01_18_SM_18b-1_rv1B/W2nd Proof7-6-2005
Ethnic Diversity Religious Diversity
Kazakh,53% Muslim,
47%
Protestant, 2%
Other or noreligion, 7%
RussianOrthodo,x
44%
RussianOrthodox,
44%Russian,
30%Russian,
30%
Ukrainian, 4%
Uzbek, 3%
German, 2%
Uygur, 1%
Other, 7%
GA_LG_18_SM_18B-2_rv2.epsB/W2nd Proof4-27-2009
Reported Crimes
Nation-State
0
5
10
15
20
25
Crim
es p
er 1
,000
Peo
ple
9.2
2.3
22.119.7 20.2
Kazakh
stan
Azerbaija
n
Lithuania
Belarus
Russia
GA_LG_18_SM_18B-3_rv1.epsB/W1st Proof4-13-2009
Life Expectancy and InfantMortality in Kazakhstan
Year
1995
1999
2003
2008
68
63
63
68
40
59
59
27
Life Expectancy(years)
Infant Mortality Rate (deaths per 1,000 births)
GA_LG_18_SM_18B-4_rv1.epsB/W1st Proof4-13-2009
Freedom Index Rating, Kazakhstan
0
1
2
3
4
5
6
76
5
6
5
6
5
Rank
1995 2000 2003
YearPolitical rightsCivil liberties
6
5
2007
S T A T I O N M A S T E R B
Political Success of Kazakhstan

© Teachers’ Curriculum Institute New Nation-States from the Old Soviet Empire: Will They Succeed? 3
Look at the economic information below for the nation-state of Azerbaijan. Discuss each question in your group.
What does this map tell you about Azerbaijan’s resources? Its location? How do its resources and location help or hurt Azerbaijan?
Look at the numbers on this graph. What do they tell you about the success of Azerbaijan’s economy?
Look at the percentages in this circle graph. What do they tell you about the economy in Azerbaijan?
How does income per person for Azerbaijan compare to the other nation-states? What does this tell you about the economy in Azerbaijan?
Sources: United Nations Office on Drugs and Crime. Central Intelligence Agency. Freedom House.
CA
UC
AU
SS
MT
S.
CA
UC
AU
SS
MT
S.
ARMENIAARMENIA
AZERBAIJANAZERBAIJANAZERBAIJAN
AZERBAIJAN
IRAN
ARMENIA
RUSSIA
Ca
sp
i an
Se
a
CA
UC
AS
US
MT
S.
Baku
Petroleum (oil)
Precious metals(gold, silver, copper)
TCI5 253 GA_LG_18_SM_C.epsSecond Proof
GA_LG_18_SM_18C-2_rv1.epsB/W1st Proof4-13-2009
1999 2003 2007
$20,000
$15,000
$10,000
$5,000
$0
Growth of GDP per Capita, Azerbaijan
GD
P pe
r Cap
ita (i
n U
.S. d
olla
rs)
Year
$1,640$3,400
$7,060
GA_LG_18_SM_18C-3_rv1.epsB/W1st Proof4-13-2009
Azerbaijan PopulationAbove and Below the Poverty Line, 2005
24%below
76%above
GA_LG_18_SM_18C-4_rv1.epsB/W1st Proof4-13-2009
Year
ly In
com
e (in
U.S
. dol
lars
)
Nation-State
Income per Person, 2007
$10,000
$8,000
$6,000
$4,000
$2,000
$0
$7,560
$2,550
$5,060$4,220
$9,920
Russia
Azerbaija
n
Kazakh
stan
Belarus
Lithuania
S T A T I O N M A S T E R C
Economic Success of Azerbaijan

© Teachers’ Curriculum Institute New Nation-States from the Old Soviet Empire: Will They Succeed? 4
Look at the political information below for the nation-state of Azerbaijan. Discuss each question in your group.
Look at these circle graphs. What do they tell you about possible ethnic and religious tension in Azerbaijan?
Compare the level of crime in Azerbaijan to the other nation-states. What might this tell you about security in Azerbaijan?
On this scale, 1 represents the highest degree of freedom, and 7 the lowest. Have the rankings for Azerbaijan gone up, gone down, or mostly stayed the same over time? What does this tell you about rights and freedoms in Azerbaijan?
Sources: World Bank. Central Intelligence Agency.
GA_LG_01_18_SM_18d-1_rv1B/W2nd Proof7-6-2005
Ethnic Diversity Religious Diversity
Dagestani, 3%Russian
Orthodox, 3%
Other, 2%
Russian, 3%Armenian
Orthodox, 2%
Other or noreligion, 2%
Armenian, 2%
Azeri, 90% Muslim, 93%
GA_LG_18_SM_18D-2_rv2.epsB/W2nd Proof4-27-2009
Reported Crimes
Nation-State
0
5
10
15
20
25
Crim
es p
er 1
,000
Peo
ple
9.2
2.3
22.119.7 20.2
Kazakh
stan
Azerbaija
n
Lithuania
Belarus
Russia
GA_LG_18_SM_18D-4_rv2.epsB/W2nd Proof4-27-2009
Freedom Index Rating, Azerbaijan
0
1
2
3
4
5
6
76 6 6
5
6
5
Rank
1995 2000 2003
YearPolitical rightsCivil liberties
6
5
2007
GA_LG_18_SM_18D-3_rv1.epsB/W1st Proof4-13-2009
Life Expectancy and Infant Mortality in Azerbaijan
Year
1995
1999
2003
71
63
63
35
83
82
2008 66 56
Life Expectancy(years)
Infant Mortality Rate (deaths per 1,000 births)
S T A T I O N M A S T E R D
Political Success of Azerbaijan
Notice how the numbers in this table change. What might this tell you about quality of life for people in Azerbaijan?

© Teachers’ Curriculum Institute New Nation-States from the Old Soviet Empire: Will They Succeed? 5
Look at the economic information below for the nation-state of Belarus. Discuss each question in your group.
What does this map tell you about Belarus’s resources? Its location? How do its resources and location help or hurt Belarus?
Look at the numbers on this graph. What do they tell you about the success of Belarus’s economy?
Look at the percentages in this circle graph. What do they tell you about the economy in Belarus?
How does income per person for Belarus compare to the other nation-states? What does this tell you about the economy in Belarus?
Sources: United Nations Office on Drugs and Crime. Central Intelligence Agency. Freedom House.
B E L A R U S
LITHUANIA
LATVIA
RUSSIA
UKRAINE
POLAND
Dn
ieper R.
Neman R.
Prypyats R.
Western Dvina R.
Minsk
Coal
Petroleum (oil)
GA_LG_18_SM_18E-2_rv2.epsB/W2nd Proof4-27-2009
Growth of GDP per Capita, Belarus
$6,000$5,200
$10,240
1999 2003 2007
$20,000
$15,000
$10,000
$5,000
$0GD
P pe
r Cap
ita (i
n U
.S. d
olla
rs)
Year
GA_LG_18_SM_18E-3_rv1.epsB/W1st Proof4-13-2009
Belarusian PopulationAbove and Below the Poverty Line, 2003
73%above
27%below
GA_LG_18_SM_18E-4_rv1.epsB/W1st Proof4-13-2009
Year
ly In
com
e (in
U.S
. dol
lars
)
Nation-State
Income per Person, 2007
$10,000
$8,000
$6,000
$4,000
$2,000
$0
$7,560
$2,550
$5,060$4,220
$9,920
Russia
Azerbaija
n
Kazakh
stan
Belarus
Lithuania
S T A T I O N M A S T E R E
Economic Success of Belarus

© Teachers’ Curriculum Institute New Nation-States from the Old Soviet Empire: Will They Succeed? 6
Look at the political information below for the nation-state of Belarus. Discuss each question in your group.
Look at these circle graphs. What do they tell you about possible ethnic and religious tension in Belarus?
Compare the level of crime in Belarus to the other nation-states. What might this tell you about security in Belarus?
On this scale, 1 represents the highest degree of freedom, and 7 the lowest. Have the rankings for Belarus gone up, gone down, or mostly stayed the same over time? What does this tell you about rights and freedoms in Belarus?
Sources: World Bank. Central Intelligence Agency.
GA_LG_01_18_SM_18f-1_rv1B/W2nd Proof7-6-2005
Ethnic Diversity Religious Diversity
Other (including Roman Catholic,Protestant, Jewish, and
Muslim) or no religion, 20%
Russian, 11%
Polish, Ukrainian,and other, 8%
Belarusian, 81%Eastern
Orthodox, 80%
GA_LG_18_SM_18F-2_rv2.epsB/W2nd Proof4-27-2009
Reported Crimes
Nation-State
0
5
10
15
20
25
Crim
es p
er 1
,000
Peo
ple
9.2
2.3
22.119.7 20.2
Kazakh
stan
Azerbaija
n
Lithuania
Belarus
Russia
GA_LG_18_SM_18F-3_rv1.epsB/W1st Proof4-13-2009
Life Expectancy and Infant Mortality in Belarus
Year
1995
1999
2003
71
68
68
19
14
14
2008 70 7
Life Expectancy(years)
Infant Mortality Rate (deaths per 1,000 births)
GA_LG_18_SM_18F-4_rv1.epsB/W1st Proof4-13-2009
Freedom Index Rating, Belarus
0
1
2
3
4
5
6
7
55
6 6 6 6
Rank
1995 2000 2003 2007
YearPolitical rightsCivil liberties
7
6
S T A T I O N M A S T E R F
Political Success of Belarus
Notice how the numbers in this table change. What might this tell you about quality of life for people in Belarus?

© Teachers’ Curriculum Institute New Nation-States from the Old Soviet Empire: Will They Succeed? 7
Look at the economic information below for the nation-state of Lithuania. Discuss each question in your group.
What does this map tell you about Lithuania’s resources and location? How do its resources and location help or hurt Lithuania?
Look at the numbers on this graph. What do they tell you about the success of Lithuania’s economy?
Look at the percentages in this circle graph. What do they tell you about the economy in Lithuania?
How does income per person for Lithuania compare to the other nation-states? What does this tell you about the economy in Lithuania?
Sources: United Nations Office on Drugs and Crime. Central Intelligence Agency. Freedom House.
L I T H U A N I A
B E L A R U S
R U S S I A
L AT V I A
Neman R.
BalticSea
Vilnius
P O L A N D
Petroleum (oil)
TCI5 255 GA_LG_18_SM_G.epsSecond Proof
GA_LG_18_SM_18G-2_rv2.epsB/W2nd Proof4-27-2009
Growth of GDP per Capita, Lithuania
$4,900
$11,200
$16,680
1999 2003 2007
$20,000
$15,000
$10,000
$5,000
$0GD
P pe
r Cap
ita (i
n U
.S. d
olla
rs)
Year
GA_LG_18_SM_18G-3_rv1.epsB/W1st Proof4-13-2009
Lithuanian PopulationAbove and Below the Poverty Line, 2003
4%below
96%above
GA_LG_18_SM_18G-4_rv1.epsB/W1st Proof4-13-2009
Year
ly In
com
e (in
U.S
. dol
lars
)
Nation-State
Income per Person, 2007
$10,000
$8,000
$6,000
$4,000
$2,000
$0
$7,560
$2,550
$5,060$4,220
$9,920
Russia
Azerbaija
n
Kazakh
stan
Belarus
Lithuania
S T A T I O N M A S T E R G
Economic Success of Lithuania

© Teachers’ Curriculum Institute New Nation-States from the Old Soviet Empire: Will They Succeed? 8
Look at the political information below for the nation-state of Lithuania. Discuss each question in your group.
Look at these circle graphs. What do they tell you about possible ethnic and religious tension in Lithuania?
Compare the level of crime in Lithuania to the other nation-states. What might this tell you about security in Lithuania?
On this scale, 1 represents the highest degree of freedom, and 7 the lowest. Have the rankings for Lithuania gone up, gone down, or mostly stayed the same over time? What does this tell you about rights and freedoms in Lithuania?
Sources: World Bank. Central Intelligence Agency.
GA_LG_01_18_SM_18h-1_rv1B/W2nd Proof7-6-2005
Ethnic Diversity Religious Diversity
Belarusian, 2%
Polish, 7%
Russian, 9%
Lithuanian, 80%
Other, 2%
Catholic, 85%
Other or no religion, 15%
GA_LG_18_SM_18H-2_rv2.epsB/W2nd Proof4-27-2009
Reported Crimes
Nation-State
0
5
10
15
20
25
Crim
es p
er 1
,000
Peo
ple
9.2
2.3
22.119.7 20.2
Kazakh
stan
Azerbaija
n
Lithuania
Belarus
Russia
GA_LG_18_SM_18H-3_rv1.epsB/W1st Proof4-13-2009
Life Expectancy and Infant Mortality in Lithuania
Year
1995
1999
2003
71
69
70
17
15
14
2008 75 7
Life Expectancy(years)
Infant Mortality Rate (deaths per 1,000 births)
GA_LG_18_SM_18H-4_rv1.epsB/W1st Proof4-13-2009
Freedom Index Rating, Lithuania
0
1
2
3
4
5
6
7
1
2
1
2
1
2
1 1
Rank
1995 2000 2003 2007
YearPolitical rightsCivil liberties
S T A T I O N M A S T E R H
Political Success of Lithuania
Notice how the numbers in this table change. What might this tell you about quality of life for people in Lithuania?

© Teachers’ Curriculum Institute New Nation-States from the Old Soviet Empire: Will They Succeed? 9
Look at the economic information below for the nation-state of Russia. Discuss each question in your group.
What does this map tell you about Russia’s resources? Its location? How do its resources and location help or hurt Russia?
Look at the numbers on this graph. What do they tell you about the success of Russia’s economy?
Look at the percentages in this circle graph. What do they tell you about the economy in Russia?
How does income per person for Russia compare to the other nation-states? What does this tell you about the economy in Russia?
Sources: United Nations Office on Drugs and Crime. Central Intelligence Agency. Freedom House.
U
ral R.
U
ral R.
SAYAN MTNS SAYAN MTNS
KO
LYM
A M
TNS
KO
LYM
A M
TNS
EST.EST.
BEL.BEL.UK
RA
INE
UK
RA
INE
GEO
.G
EO.
AZER.AZER.
FINLAND
FINLAND
LAT.LAT.
RUSSIA
MONGOLIA
CHINA
KAZAKHSTAN
FINLAND
EST.LAT.
BEL.UK
RA
INE
GEO
.
AZER.
Cas
pian
Sea
LakeBaikalU
ral R.
Volga R. Ob
R.
Yenisey R
.
Lena R.
Ko
lym
a R.
URAL M
TS.
KO
LYM
A M
TS.
SAYAN MTS.
Moscow
Coal
Diamonds
Hydroelectric power
Iron
Natural gas
Petroleum (oil)
Precious metals(gold, silver, copper)
GA_LG_18_SM_18I-2_rv2.epsB/W2nd Proof4-27-2009
Growth of GDP per Capita, Russia
$4,000
$8,900
$13,920
1999 2003 2007
$20,000
$15,000
$10,000
$5,000
$0GD
P pe
r Cap
ita (i
n U
.S. d
olla
rs)
Year
GA_LG_18_SM_18I-3_rv1.epsB/W1st Proof4-13-2009
Russian PopulationAbove and Below the Poverty Line, 2007
84%above
16%below
GA_LG_18_SM_18I-4_rv1.epsB/W1st Proof4-13-2009
Year
ly In
com
e (in
U.S
. dol
lars
)
Nation-State
Income per Person, 2007
$10,000
$8,000
$6,000
$4,000
$2,000
$0
$7,560
$2,550
$5,060$4,220
$9,920
Russia
Azerbaija
n
Kazakh
stan
Belarus
Lithuania
S T A T I O N M A S T E R I
Economic Success of Russia
© Teachers’ Curriculum Institute New Nation-States from the Old Soviet Empire: Will They Succeed? 10
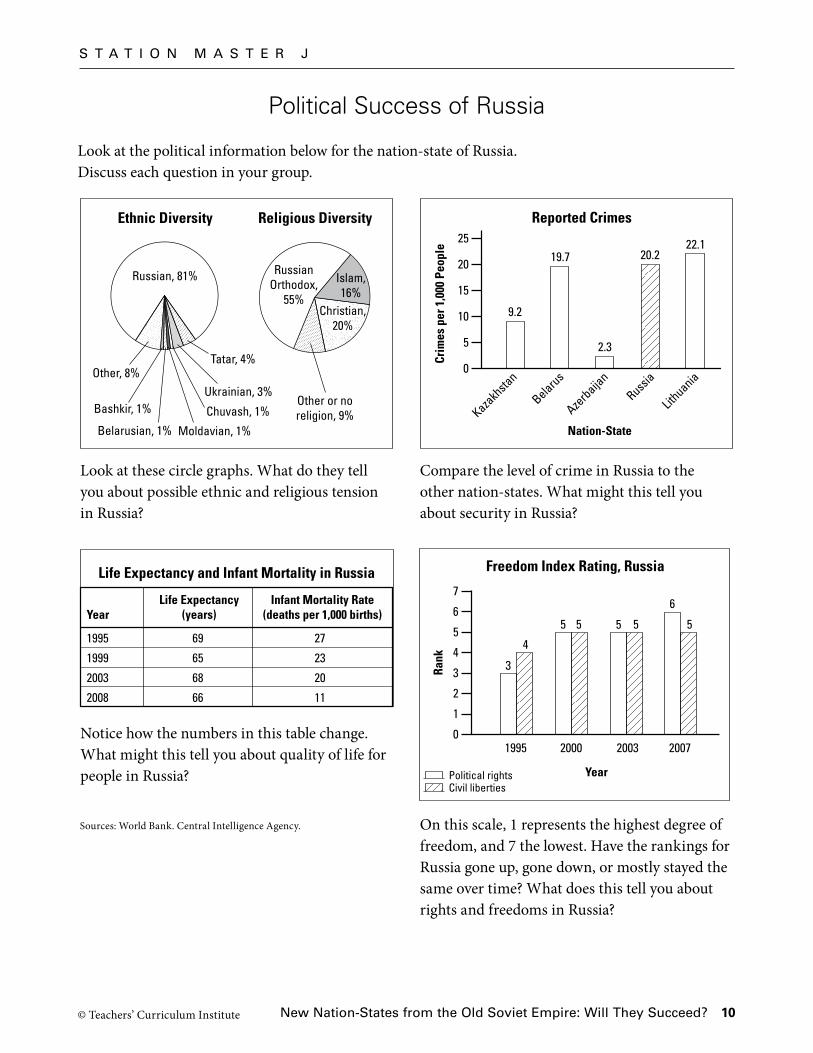
Look at the political information below for the nation-state of Russia. Discuss each question in your group.
Look at these circle graphs. What do they tell you about possible ethnic and religious tension in Russia?
Compare the level of crime in Russia to the other nation-states. What might this tell you about security in Russia?
On this scale, 1 represents the highest degree of freedom, and 7 the lowest. Have the rankings for Russia gone up, gone down, or mostly stayed the same over time? What does this tell you about rights and freedoms in Russia?
Sources: World Bank. Central Intelligence Agency.
Ethnic Diversity Religious Diversity
Bashkir, 1%
Belarusian, 1%
Chuvash, 1%
Moldavian, 1%
Ukrainian, 3%Other, 8%
Other or noreligion, 9%
Russian, 81%
Tatar, 4%
RussianOrthodox,
55%
Islam,16%
Christian20%
Christian,20%
GA_LG_18_SM_18J-2_rv2.epsB/W2nd Proof4-27-2009
Reported Crimes
Nation-State
0
5
10
15
20
25
Crim
es p
er 1
,000
Peo
ple
9.2
2.3
22.119.7 20.2
Kazakh
stan
Azerbaija
n
Lithuania
Belarus
Russia
GA_LG_18_SM_18J-3_rv1.epsB/W1st Proof4-13-2009
Life Expectancy and Infant Mortality in Russia
Year
1995
1999
2003
69
65
68
27
23
20
2008 66 11
Life Expectancy(years)
Infant Mortality Rate(deaths per 1,000 births)
GA_LG_18_SM_18J-4_rv1.epsB/W1st Proof4-13-2009
Freedom Index Rating, Russia
0
1
2
3
4
5
6
7
55
6
5
Rank 3
4
1995 2000 2007
5 5
2003
YearPolitical rightsCivil liberties
S T A T I O N M A S T E R J
Political Success of Russia
Notice how the numbers in this table change. What might this tell you about quality of life for people in Russia?

© Teachers’ Curriculum Institute New Nation-States from the Old Soviet Empire: Will They Succeed? 11
Use the data below to compare one nation-state to another.
Sources: World Bank. Central Intelligence Agency. Freedom House.
GA_LG_18_SM_18K-1_rv1.epsB/W1st Proof4-13-2009
GDP per Capita (in U.S. Dollars), 2007
Country
$50,000
$40,000
$30,000
$20,000
$10,000
$0
$10,220
Kazakh
stan
Azerbaija
n
Lithuania
Belarus
Russia
United States
France
$7,060$10,240
$16,680$13,920
$43,230
$31,460
GA_LG_18_SM_18K-2_rv2.epsB/W2nd Proof4-27-2009
6%
Population Below the Poverty Line
CountryPe
rcen
tage
Bel
ow P
over
ty L
ine
30%25%20%15%10%
5%0%
14%
Kazakh
stan
Azerbaija
n
Lithuania
Belarus
Russia
United States
France
24%27%
4%
16% 12%
GA_LG_18_SM_18K-3_rv1.epsB/W1st Proof4-13-2009
Life Expectancy and Infant Mortality, 2008
Country
Kazakhstan
Azerbaijan
Belarus
Lithuania
Russia
United States
France
68
66
70
75
66
78
81
27
56
7
7
11
6
3
Life Expectancy(years)
Infant Mortality (deaths per 1,000 births)
GA_LG_18_SM_18K-4_rv1.epsB/W1st Proof4-13-2009
Freedom Index Ranking, 2007
65
65
76
1 1
65
1 1 1 1
Rank
CountryPolitical rightsCivil liberties
Kazakh
stan
Azerbaija
n
Lithuania
Belarus
Russia
United States
France
01234567
S T A T I O N M A S T E R K
Economic and Political Comparisons