Embed Size (px)
Citation preview

S-NPP CrIS Full Resolution Sensor Data Record Processing and Evaluations
Yong Chen1*
Yong Han2, Likun Wang1, Denis Tremblay3, Xin Jin4, and Fuzhong Weng2
1ESSIC, University of Maryland, College Park, MD, [email protected] 2NOAA/NESDIS/STAR, College Park, MD 3Science Data Processing Inc., Laurel, MD 4ERT, Laurel, MD
Third Annual CICS-MD Science, November 12-13, 2014

Outlines
Upgraded ADL to generate CrIS full resolution mode Sensor Data Records (SDR) Radiometric accuracy assessment
Difference between observation and forward model simulation Double difference (DD) between CrIS and IASI Simultaneous Nadir Overpass (SNO) between CrIS and IASI
Spectral accuracy assessment Absolute spectral validation Relative spectral validation
Summary
2

CrIS Operational Concept
2,200 km Swath
NWP, EDR Applications
Decode Spacecraft
Data
±50° Cross track
Scans
Ground Station
RDR = Raw Data Record SDR = Sensor Data Record EDR = Environmental Data Record
30 Earth Scenes
RDRs
EDRs
Co-Located ATMS SDRs
Global Temperature, Moisture, Pressure Profiles
CrIS on Suomi NPP
RDRs
Interferograms
Calibrated / Geolocated Spectra
SDRs
CrIS SDR Algorithm
3

4
CrIS Normal Resolution and Full Resolution SDR
Frequency Band Spectral Range (cm-1)
Number of Channel (unapodized)
Spectral Resolution (cm-1)
Effective MPD (cm)
LWIR 650 to 1095 713* (717) 0.625 0.8
MWIR 1210 to 1750 433* (437) 1.25 0.4
865* (869) 0.625 0.8
SWIR 2155 to 2550 159* (163) 2.5 0.2
633* (637) 0.625 0.8
Red: Full resolution
CrIS can be operated in the full spectral resolution (FSR) mode with 0.625 cm-1 for all three bands, total 2211 channels, in addition to normal mode with 1305 channels NOAA will operate CrIS in FSR mode in December 2014 to improve the profile of H2O, and the retrieval of atmospheric greenhouse gases CO, CO2, and CH4
CH4 CO
CO2

Load Data
Pre-process: sort EP, SciCalP & IFGM packets into sequences; truncate full resolution RDRs if needed
IFGM to raw spectra conversion
FCE Handling (currently disabled)
Nonlinearity correction
Lunar intrusion handling
Radiometric Calibration
NEdN Calculation
Post-calibration Filter
Spectral Resampling
Self-apodization Correction
Geolocation Calculation
9 granules
Update ICT, DS & ES sliding windows
Residual ILS Correction
SDR Output I Part
P Part
O Part
Fifth Granule
CMO Build if needed
Quality Flag & Variable Settings
FSR/J1 code change
CMO
CrIS SDR Processing Major Modules
5

CrIS Full Resolution SDR ADL Code The FSR ADL code is based on the IDPS Block 2.0, Mx8.5 Different calibration approaches are implemented in the code in order to study the ringing effect observed in CrIS normal mode SDR and to support to select the best calibration algorithm for J1 Code is modularized and flexible to run different calibration approaches The same source code can be compiled into normal-resolution executable or FSR executable:
Normal-resolution executable
FSR executable
Normal-resolution RDRs or FSR RDRs Normal-resolution SDRs
FSR RDRs FSR SDRs
The FSR ADL code is completed and delivered to CrIS SDR science team members and Raytheon Company to test
Same source code
6

FSR SDR Processing Plan S-NPP CrIS will be switched from the normal spectral resolution mode to the full spectral resolution mode in early December, 2014 IDPS and CLASS will continue producing and archiving normal resolution SDRs NOAA/STAR will routinely process the full resolution data and generate the FSR SDRs with a latency of ~24 hours, beginning on the first day of the CrIS FSR mode operation The data will be available on a STAR FTP site using the upgraded ADL CrIS SDR code Up to date, the FSR mode has been commanded three times in-orbit (02/23/2012, 03/12/2013, and 08/27/2013)
Results show that the SDR from FSR has similar features compared to SDR generated from low resolution RDR
August 27, 2013, before FSR August 27 and 28, 2013, FSR
BT ΔBT BT ΔBT Ch 848, 1377.5 cm-1, water vapor channel
7

8
CrIS Radiometric Assessment Validation of August 27-28, 2013 full spectral resolution data Upgraded ADL code used to generate full spectral resolution SDRs with updated non-linearity coefficients, ILS parameters, and sincq function for Correction Matrix Operator (CMO) for IDPS calibration approach. Assessment approach 1: Biases between CrIS observations and simulations using ECMWF analysis/forecast fields and forward model CRTM (Community Radiative Transfer Model) Assessment approach 2: Double difference between CrIS and IASI on MetOp-a/b (converted to CrIS) using CRTM simulation as a transfer tool Assessment approach 3: SNO difference between CrIS and IASI converted to CrIS CrISIASICrISdiff BTBTBT 2−=
)( CRTMObsBIAS −=
CrISIASICrIS CRTMObsCRTMObsDD 2)()( −−−=
Forward Model Simulation
IASI CrIS SNO
Double Difference
O-B
Three Approaches

Resample IASI to CrIS
CrIS – IASI2CrIS
Resampling error from IASI to CrIS resolution is very small (less than 0.02 K) since IASI spectra cover CrIS spectra for all three bands 9
IASI Observed Spectra
Inverse Fourier transform of the spectra to the interferogram
space
1)De-Apodization with IASI SRF 2)Truncation to CrIS OPD 3)Apodization with CrIS SRF
FFT
Apodization Function
FFT-1
Fourier transform of the products to spectra space, resampling the spectra on CrIS wavenumber basis.

CrIS Nadir FOV-2-FOV Variability (FOR 15 and 16) for Clear Sky over Oceans
allFOVFOV CRTMObsCRTMObsBIASii )()( −−−=
10 FOV-2-FOV variability is small, within ±0.3 K for all the channels
S/C Velocity

11
CrIS and IASI2CrIS NWP Biases: Clear Ocean Scenes
CrIS
IASI2CrIS MetOp-a IASI2CrIS MetOp-b
Good agreement between CrIS observation and simulation using ECMWF Very good agreement between CrIS and IASI Smaller standard deviation for CrIS than IASI in band 3

12
CrIS Nadir Bias for Shortwave ii FOVFOV CRTMObsBIAS )( −=
Good agreement between IASI and CrIS, better than bias with CRTM CO high bias errors due to CO default profile in CRTM CrIS and IASI window channels differ by 0.1 K due to diurnal variation in the SST
CO absorption lines

Double Difference between CrIS and IASI2CrIS
13
CrISIASICrIS CRTMObsCRTMObsDD 2)()( −−−=
Double difference between CrIS and IASI using CRTM simulations as transfer target are within ±0.3 K for most of channels For 4.3 µm CO2 strong absorption region, CrIS is warmer than IASI about 0.3-0.5 K CrIS and IASI window channels differ by 0.1 K due to diurnal variation in the SST

14
SNOs between CrIS and IASI
SNO agreement is very good for band 1. Also good for band 2, but larger BT difference toward the end of band edge Large BT differences in cold channels for band 3
SNO Criteria Time difference:
<= 120 seconds Pixel distance:
<=(12+14)/4.0 km = 6.5 km Zenith angle difference: ABS(cos(a1)/cos(a2)-1) <= 0.01
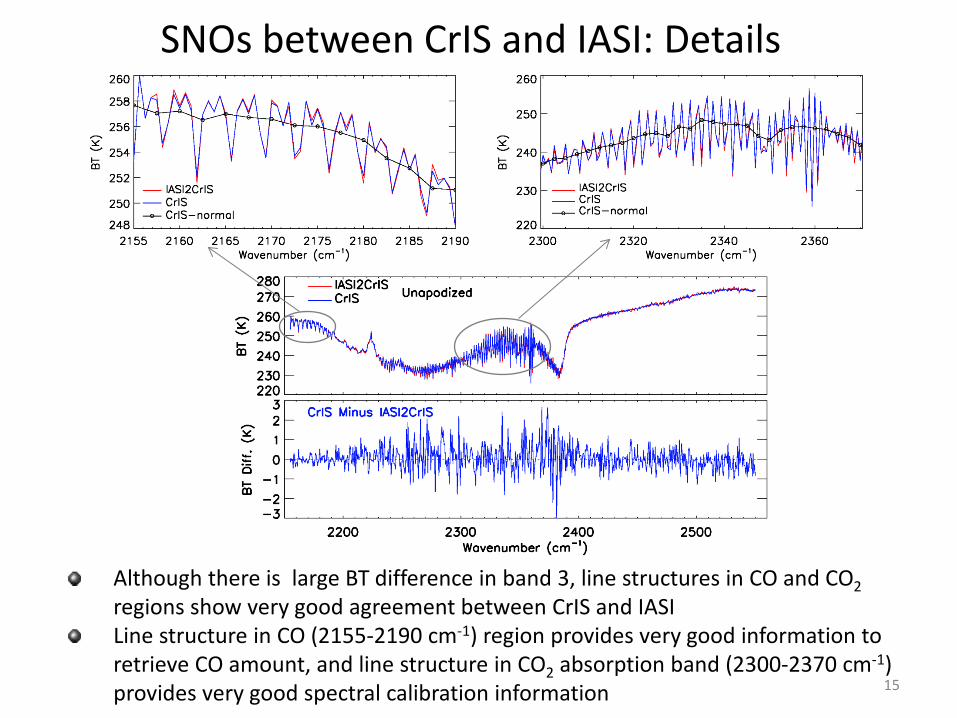
Although there is large BT difference in band 3, line structures in CO and CO2 regions show very good agreement between CrIS and IASI Line structure in CO (2155-2190 cm-1) region provides very good information to retrieve CO amount, and line structure in CO2 absorption band (2300-2370 cm-1) provides very good spectral calibration information 15
SNOs between CrIS and IASI: Details

16
CrIS Spectral Assessment: Cross-Correlation Method Two basic spectral validation methods are used to assess the CrIS SDR spectral accuracy Relative spectral validation, which uses two uniform observations to determine frequency offsets relative to each other Absolute spectral validation, which requires an accurate forward model to simulate the top of atmosphere radiance under clear conditions and correlates the simulation with the observed radiance to find the maximum correlation
,)()(
))((
)1(
))((
1
22,2
21,1
12,21,1
12,21,1
21
21
∑
∑∑
=
==
−−
−−=
−
−−=
n
iii
n
iii
Ss
n
iii
SS
SSSS
SSSS
DDn
SSSSr
.)1()]()[(1
22,21,121
−−−−= ∑=
nSSSSDn
iiiSS
Correlation coefficient between the two spectra: Standard deviation based on the difference of the two spectra: The cross-correlation method is applied to a pair fine grid spectra to get the maximum correlation and minimum standard deviation by shifting one of the spectra in a given shift factor

17
CrIS Spectral Uncertainty LWIR
Absolute cross-correlation method: between observations and CRTM simulations under clear sky over oceans to detect the spectral shift Relative method: observations from FOV 5 to other FOVs Frequency used: 710-760 cm-1 , 1340-1390 cm-1 , and 2310-2370 cm-1 Spectral shift relative to FOV5 are within 1 ppm Absolute spectral shift relative to CRTM within 3 ppm
MWIR
SWIR

The CrIS full resolution SDRs generated from the upgraded ADL were assessed
CrIS full resolution SDR radiometric uncertainty:
FOV-2-FOV radiometric differences are small, within ±0.3 K for all the channels Double difference with IASI are within ±0.3K for most of channels SNO results versus IASI show that agreement is very good for band 1 and band 2, but large BT differences in cold channels for band 3
CrIS full resolution SDR spectral uncertainty: Spectral shift relative to FOV5 are within 1 ppm Absolute spectral shift relative to CRTM simulation are within 3 ppm
Future Work: assessing different calibration approaches which are implemented in ADL to study the ringing effect to choose the best one for J1
Summary
18