Embed Size (px)
Citation preview
SFQM and DoctorKeeping My (Telco) Cloud Afloat
Emma Foley, IntelMaryam Tahhan, Intel
Carlos Gonçalves, NECRyota Mibu, NEC

Outline● Introduction● SFQM● Doctor● Demo● Summary

Components
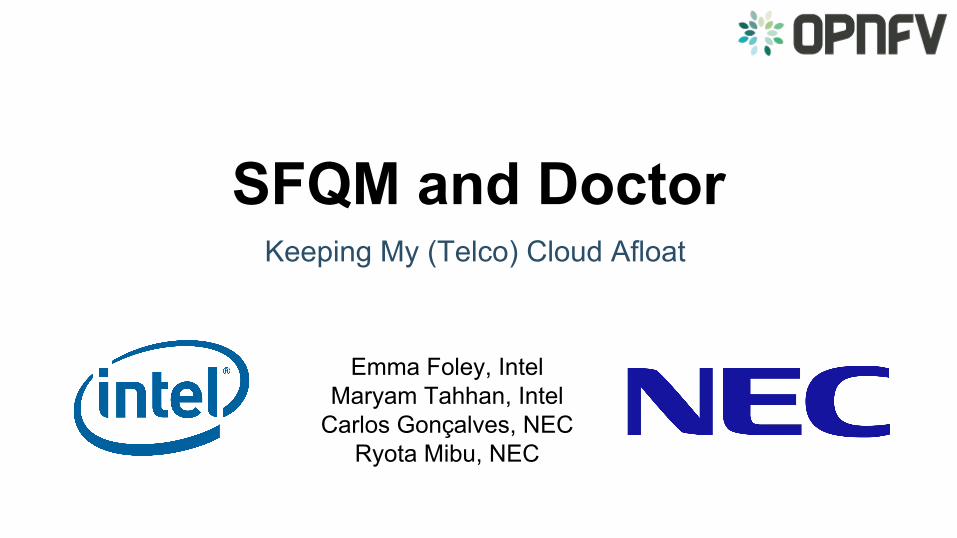
“Data Centres are powering our everyday lives. Organizations lose an average of $138,000 for one hour of
downtime.” [1].
Telco and Enterprise alike are asking how they get and provide Service Assurance, QoS and provide SLA’s on the
platform and services when deploying NFV.
It is vital to monitor systems for malfunctions or misbehaviours that could lead to service disruption and promptly react to these faults/events to minimize service
disruption/downtime.
SFQM Overview
• Develop the utilities and libraries in DPDK to support:
• Measuring Telco Traffic and Performance KPIs. Including: • Packet Delay Variation.• Packet loss.
• Monitoring the performance + status of the DPDK interfaces.• Detecting and reporting violations that can be consumed by
VNFs and higher level fault management systems.
Collectd + OVS Statistics● OVS Events plugin
● OVS Util plugin
● Features:
● Connect / Disconnect, Subscribe for DB table events, Custom requests, DB Echos for livelines …
● Upstreaming at https://github.com/collectd/collectd/pull/1971
Collectd with RAS Statistics● Reliability, Availability and Serviceability features
● Reporting Machine Check Errors
● Hardware errors that are corrected get reported by the HW to SW

Collectd with RDT Statistics● Resource Director Technology
● Per Core:
● Last Level Cache (LLC) Occupancy
● Local Memory Bandwidth
● Remote Memory Bandwidth
● https://github.com/collectd/collectd/pull/1970
Collectd + DPDK Latency Stats• New DPDK library to address issue
• Designed to calculate latency stats and report
• Measures min, avg, max latency and jitter
• Current implementation supports global latency stats
• Request For Comments on DPDK-dev mailing list:
• http://dpdk.org/ml/archives/dev/2016-September/047631.html

Collectd + DPDK Statistics• Dpdkstat
• Collectd plugin : Merged!
• DPDK secondary process
• Monitor DPDK primary application
• Read extended NIC statistics
• Publish statistics to collectd
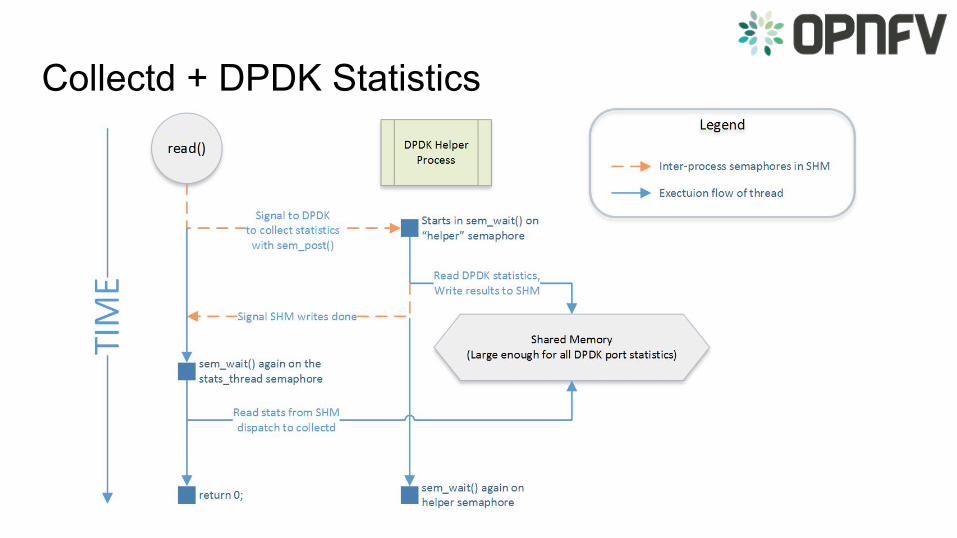
Collectd + DPDK Statistics


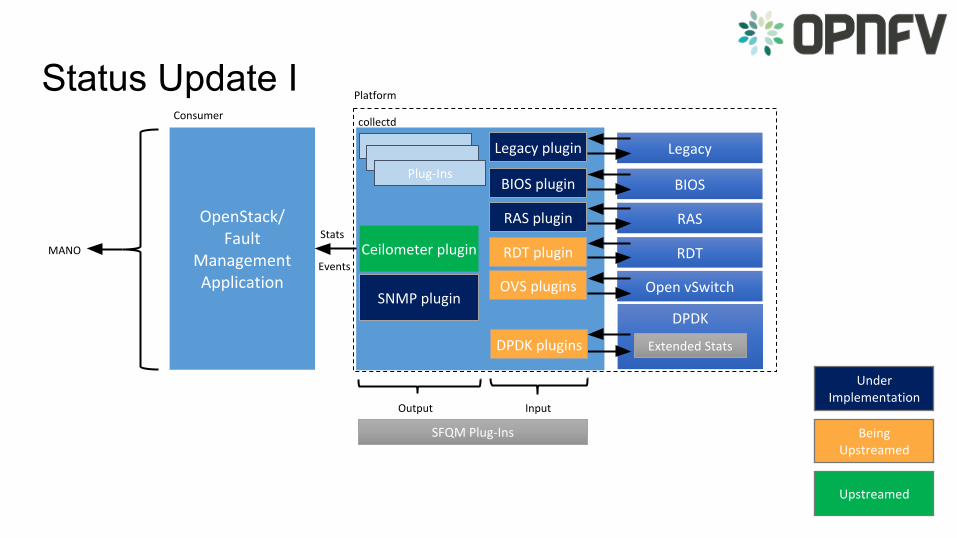
Status Update I
Status Update IITaking advantage of the notification plugin architecture in collectd to post an event (like link status failure or application thread failure) directly to the notification bus for immediate alarming in Aodh.
Performance, scalability and aggregation analysis.
Gnocchi integration
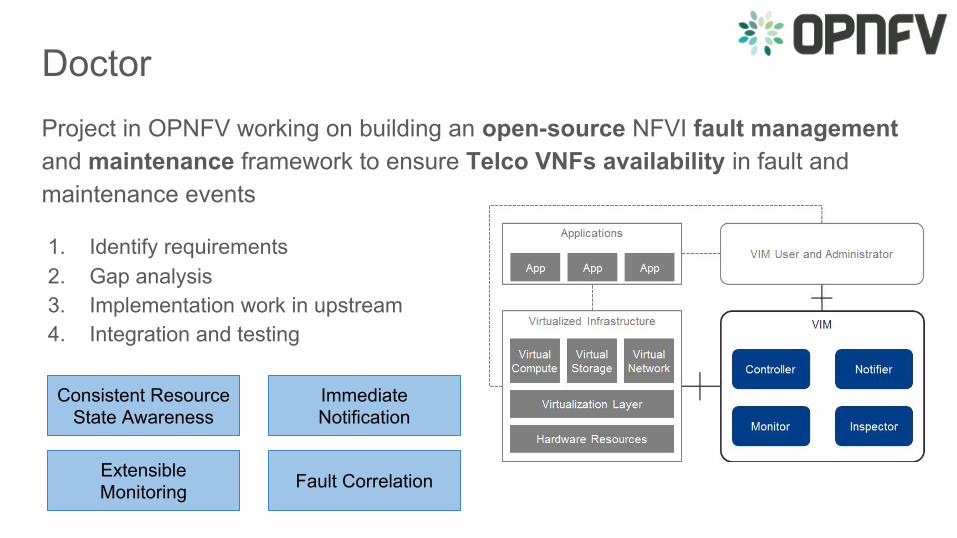
Project in OPNFV working on building an open-source NFVI fault management and maintenance framework to ensure Telco VNFs availability in fault and maintenance events
1. Identify requirements2. Gap analysis3. Implementation work in upstream4. Integration and testing
Consistent Resource State Awareness
Immediate Notification
Fault CorrelationExtensible Monitoring
Doctor
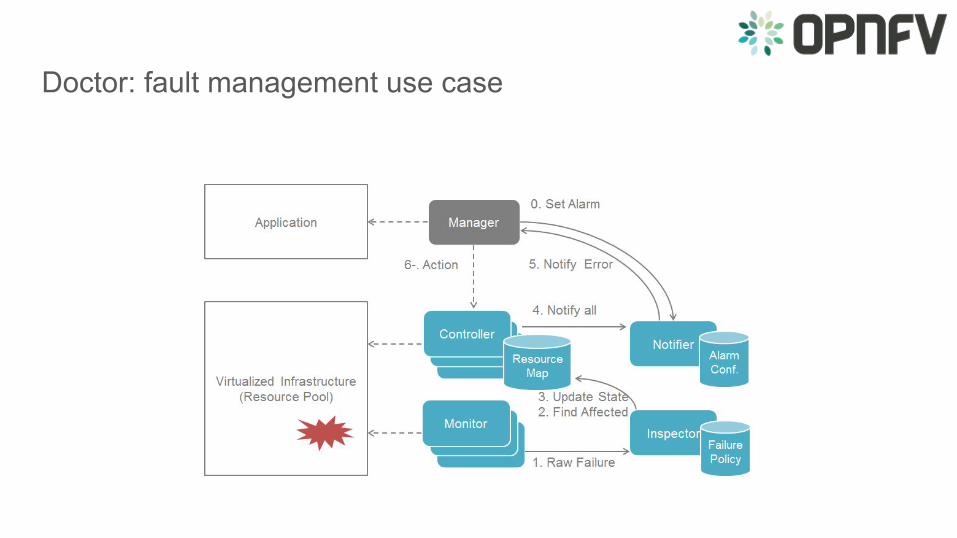
Doctor: fault management use case

Doctor: mapping to the OpenStack ecosystem

Doctor: focus of initial contributions Consistent Resource State Awareness
Immediate Notification

Doctor: focus of initial contributions Immediate Notification
Consistent Resource State Awareness
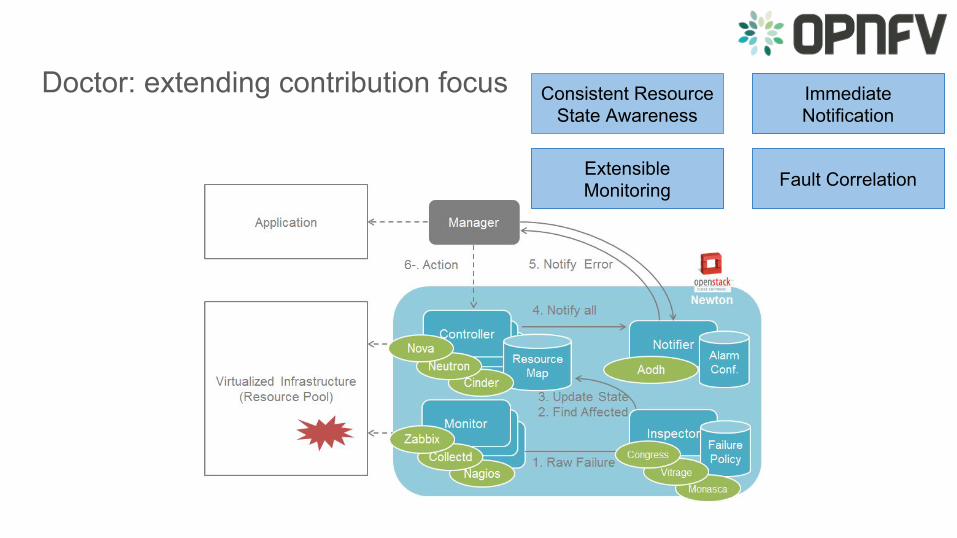
Doctor: extending contribution focus Consistent Resource State Awareness
Immediate Notification
Fault CorrelationExtensible Monitoring
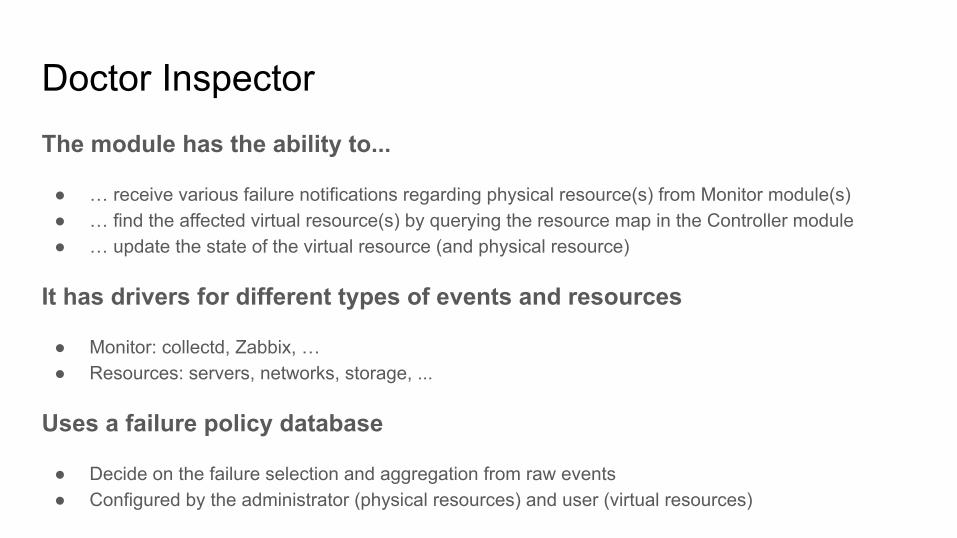
Doctor InspectorThe module has the ability to...
● … receive various failure notifications regarding physical resource(s) from Monitor module(s)● … find the affected virtual resource(s) by querying the resource map in the Controller module● … update the state of the virtual resource (and physical resource)
It has drivers for different types of events and resources
Uses a failure policy database

Why a failure policy database?
“Failure” can be subjective. Depends on● Applications (VNFs)● Back-end technologies used in the deployment● Redundancy of the equipment/components● Operator Policy● Regulation● Topologies of Network / Power-supply
So, “failure” has to be dynamically configurable case by case

Doctor Inspector: OpenStack Congress
● Governance as a Service○ Define and enforce policy for Cloud Services
● Dynamic data collection from OpenStack services● Flexible policy definition for correlation (Datalog)● Well integrated with other OpenStack projects
Policy example
host_down(host) :-
doctor:events(hostname=host, type="compute.host.down", status="down")
execute[nova:services.force_down(host, "nova-compute", "True")] :-
host_down(host)
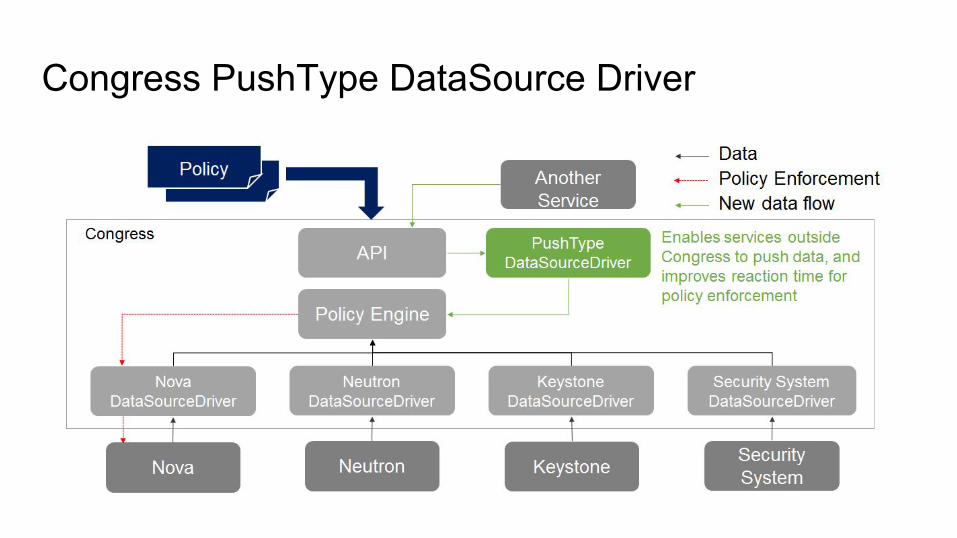
Congress PushType DataSource Driver

Congress Doctor Driver
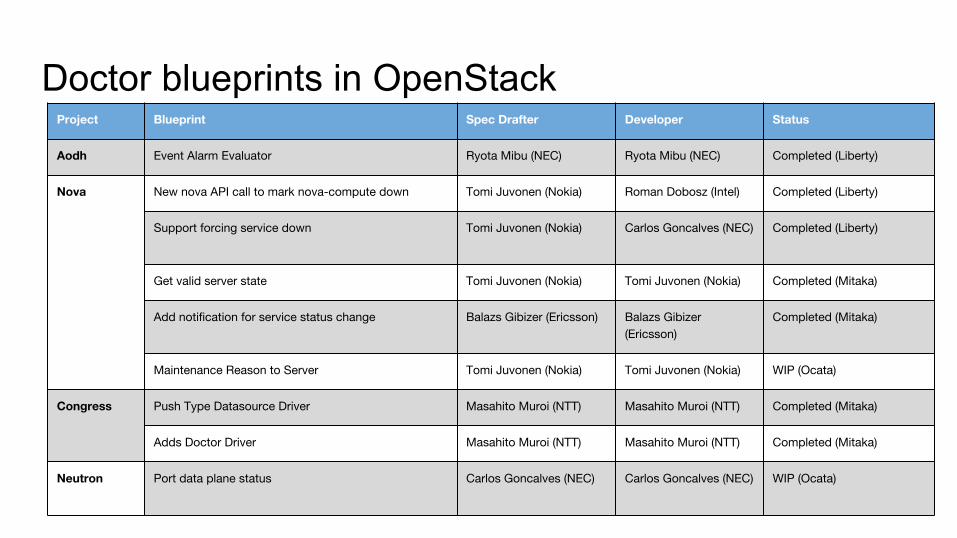
Doctor blueprints in OpenStackProject Blueprint Spec Drafter Developer Status
Aodh Event Alarm Evaluator Ryota Mibu (NEC) Ryota Mibu (NEC) Completed (Liberty)
Nova New nova API call to mark nova-compute down Tomi Juvonen (Nokia) Roman Dobosz (Intel) Completed (Liberty)
Support forcing service down Tomi Juvonen (Nokia) Carlos Goncalves (NEC) Completed (Liberty)
Get valid server state Tomi Juvonen (Nokia) Tomi Juvonen (Nokia) Completed (Mitaka)
Add notification for service status change Balazs Gibizer (Ericsson) Balazs Gibizer (Ericsson)
Completed (Mitaka)
Maintenance Reason to Server Tomi Juvonen (Nokia) Tomi Juvonen (Nokia) WIP (Ocata)
Congress Push Type Datasource Driver Masahito Muroi (NTT) Masahito Muroi (NTT) Completed (Mitaka)
Adds Doctor Driver Masahito Muroi (NTT) Masahito Muroi (NTT) Completed (Mitaka)
Neutron Port data plane status Carlos Goncalves (NEC) Carlos Goncalves (NEC) WIP (Ocata)

SFQM + Doctor
Ceilometer

Demo
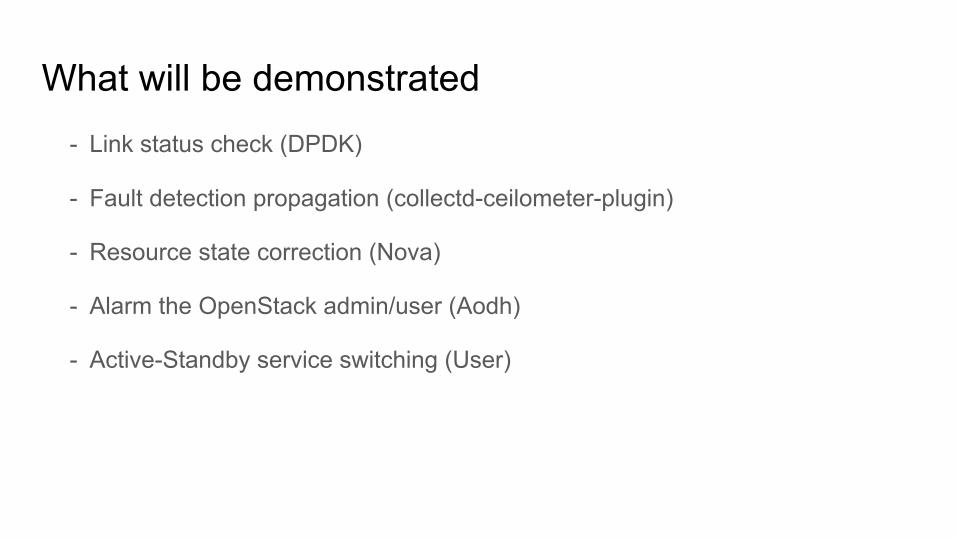
What will be demonstrated- Link status check (DPDK)
- Fault detection propagation (collectd-ceilometer-plugin)
- Resource state correction (Nova)
- Alarm the OpenStack admin/user (Aodh)
- Active-Standby service switching (User)
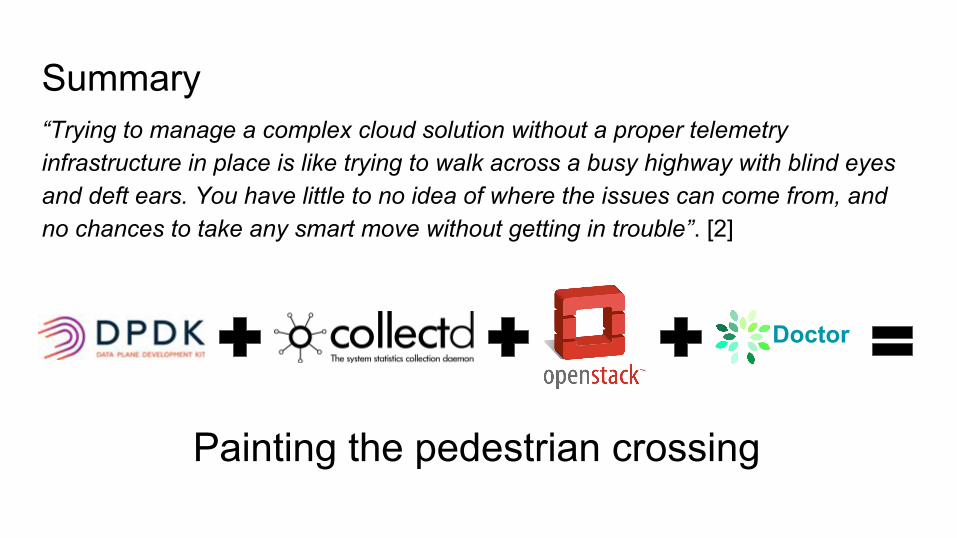
Summary“Trying to manage a complex cloud solution without a proper telemetry infrastructure in place is like trying to walk across a busy highway with blind eyes and deft ears. You have little to no idea of where the issues can come from, and no chances to take any smart move without getting in trouble”. [2]
Doctor
Painting the pedestrian crossing

References
[1] http://www.datacenterknowledge.com/archives/2016/02/11/curb-data-center-downtime-predictive-maintenance/
[2] https://azure.microsoft.com/en-us/blog/cloud-service-fundamentals-telemetry-basics-and-troubleshooting/

Legal notices and disclaimers
Intel technologies’ features and benefits depend on system configuration and may require enabled hardware, software or service activation. Learn more at intel.com, or from the OEM or retailer.
No computer system can be absolutely secure.
Tests document performance of components on a particular test, in specific systems. Differences in hardware, software, or configuration will affect actual performance. Consult other sources of information to evaluate performance as you consider your purchase. For more complete information about performance and benchmark results, visit http://www.intel.com/performance.
Intel, the Intel logo and others are trademarks of Intel Corporation in the U.S. and/or other countries. *Other names and brands may be claimed as the property of others.
© 2016 Intel Corporation.

The Corner Stone
Telemetry is the cornerstone for:
Billing
Benchmarking
Intelligent orchestration
Fault management
Use case example

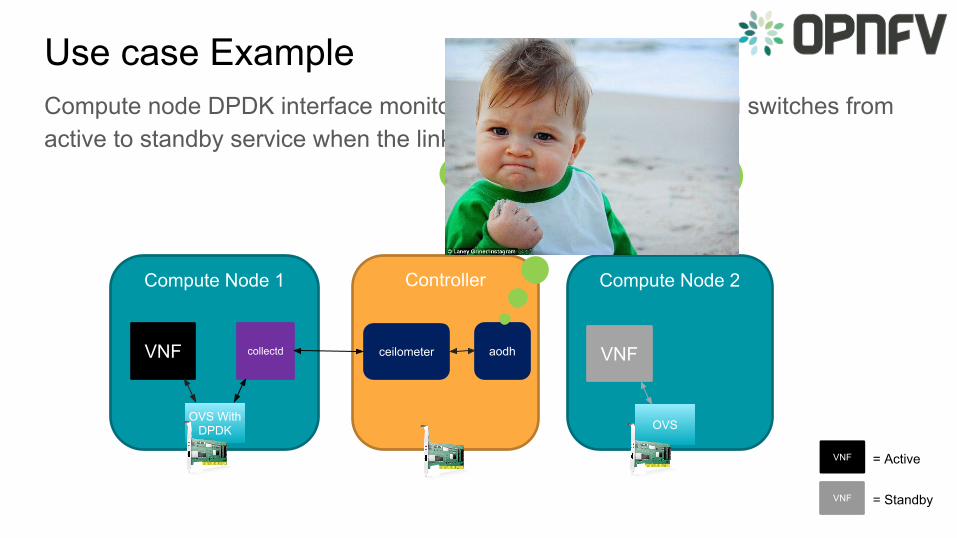
Use case ExampleCompute node DPDK interface monitoring for Host link status and switches from active to standby service when the link goes down.
ControllerCompute Node 1 Compute Node 2
collectd
OVS With DPDK OVS
ceilometer aodhVNF VNF
VNF = Active
VNF = Standby

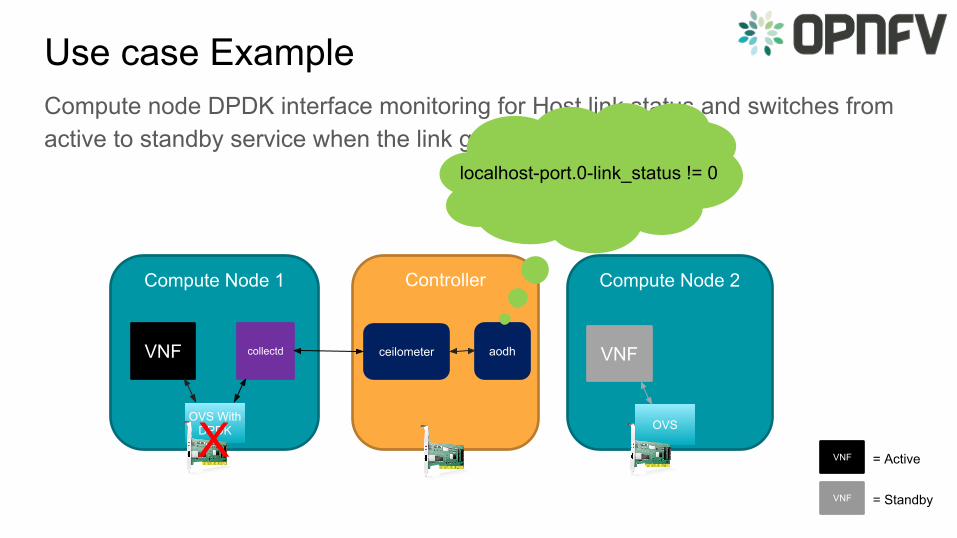
Use case ExampleCompute node DPDK interface monitoring for Host link status and switches from active to standby service when the link goes down.
ControllerCompute Node 1 Compute Node 2
collectd
OVS With DPDK OVS
ceilometer aodhVNF VNF
localhost-port.0-link_status != 0
VNF = Active
VNF = Standby
Use case ExampleCompute node DPDK interface monitoring for Host link status and switches from active to standby service when the link goes down.
ControllerCompute Node 1 Compute Node 2
collectd
OVS With DPDK OVS
ceilometer aodhVNF VNF
localhost-port.0-link_status != 0
VNF = Active
VNF = Standby
Use case ExampleCompute node DPDK interface monitoring for Host link status and switches from active to standby service when the link goes down.
ControllerCompute Node 1 Compute Node 2
collectd
OVS With DPDK OVS
ceilometer aodhVNF VNF
localhost-port.0-link_status != 0
X VNF = Active
VNF = Standby
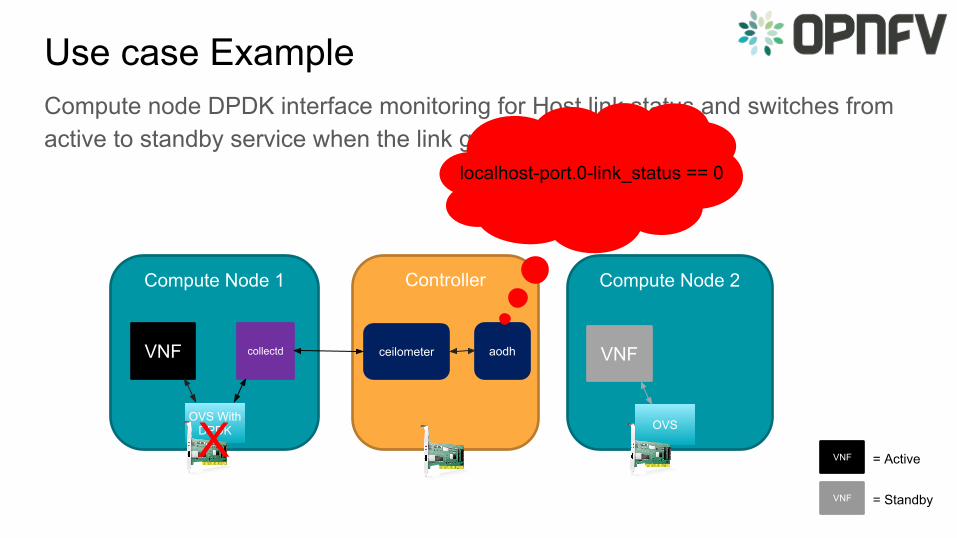
Use case ExampleCompute node DPDK interface monitoring for Host link status and switches from active to standby service when the link goes down.
ControllerCompute Node 1 Compute Node 2
collectd
OVS With DPDK OVS
ceilometer aodhVNF VNF
localhost-port.0-link_status == 0
X VNF = Active
VNF = Standby
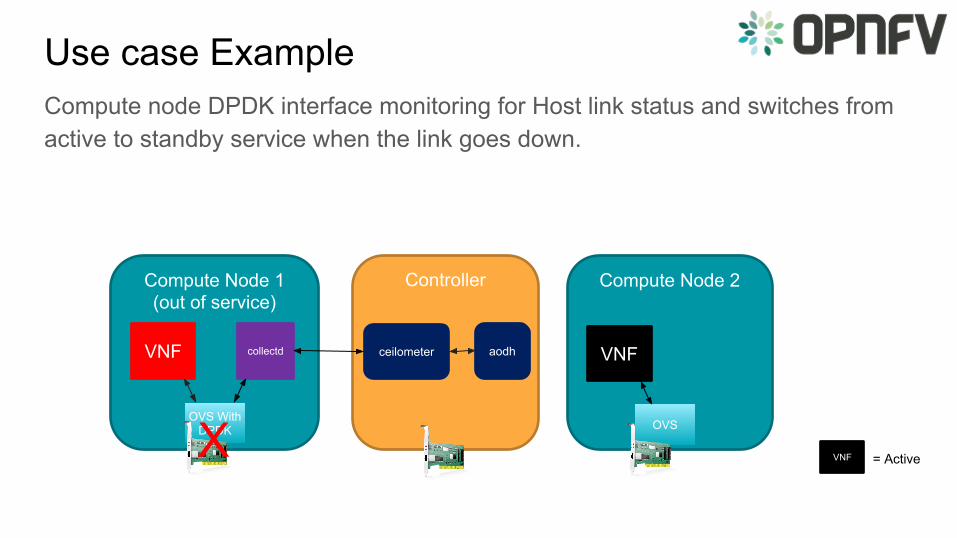
Use case ExampleCompute node DPDK interface monitoring for Host link status and switches from active to standby service when the link goes down.
ControllerCompute Node 1(out of service)
Compute Node 2
collectd
OVS With DPDK OVS
ceilometer aodhVNF VNF
X VNF = Active

Collectd ceilometer plugin
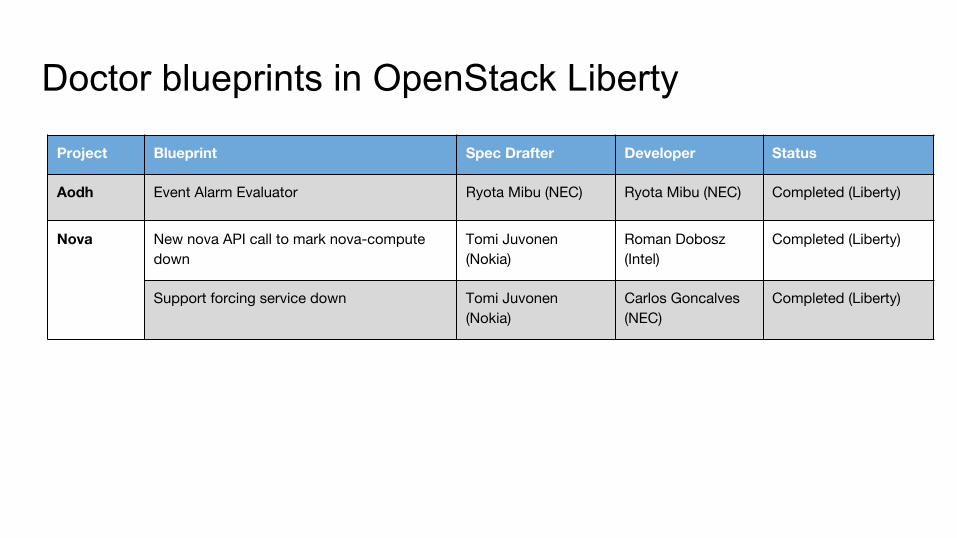
Doctor blueprints in OpenStack Liberty
Project Blueprint Spec Drafter Developer Status
Aodh Event Alarm Evaluator Ryota Mibu (NEC) Ryota Mibu (NEC) Completed (Liberty)
Nova New nova API call to mark nova-compute down
Tomi Juvonen (Nokia)
Roman Dobosz (Intel)
Completed (Liberty)
Support forcing service down Tomi Juvonen (Nokia)
Carlos Goncalves (NEC)
Completed (Liberty)
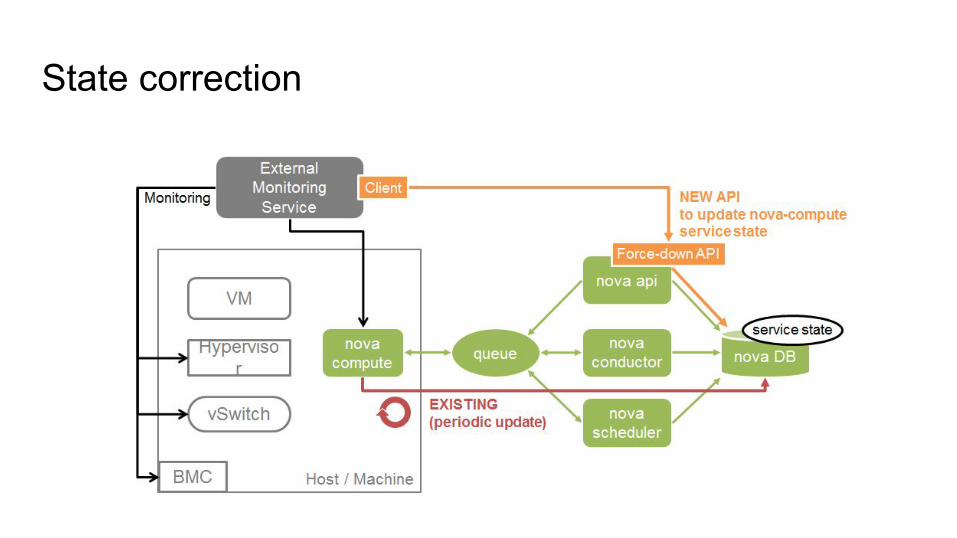
State correction

From project creation to Brahmaputra release

Immediate event alarming
Doctor InspectorThe module has the ability to...
● … receive various failure notifications regarding physical resource(s) from Monitor module(s)● … find the affected virtual resource(s) by querying the resource map in the Controller module● … update the state of the virtual resource (and physical resource)
It has drivers for different types of events and resources
● Monitor: collectd, Zabbix, …● Resources: servers, networks, storage, ...
Uses a failure policy database
● Decide on the failure selection and aggregation from raw events● Configured by the administrator (physical resources) and user (virtual resources)


![Managing Cisco NFVI Securityroot@mgmt1 ~]# cd ~/installer-xxxx [root@mgmt1 installer-xxxx]# ciscovim help reconfigure usage: ... external_lb_vip_cacert LocationofHAProxyCAcertificate](https://img.dokumen.tips/doc/110x75/5af746367f8b9aac248b9ae4/managing-cisco-nfvi-rootmgmt1-cd-installer-xxxx-rootmgmt1-installer-xxxx.jpg)