Embed Size (px)
Citation preview

RYMAN HEALTHCARE HALF YEAR RESULTS30 September 2017
FIRST HALF HIGHLIGHTS
Underlying profit up11.4% to $85.2 million
Reported profit up 8.4%to $202.6 million
Interim dividend lifted to 9.5 cents per share
$5.3 billion of total assets
Fourteen new villages inthe pipeline

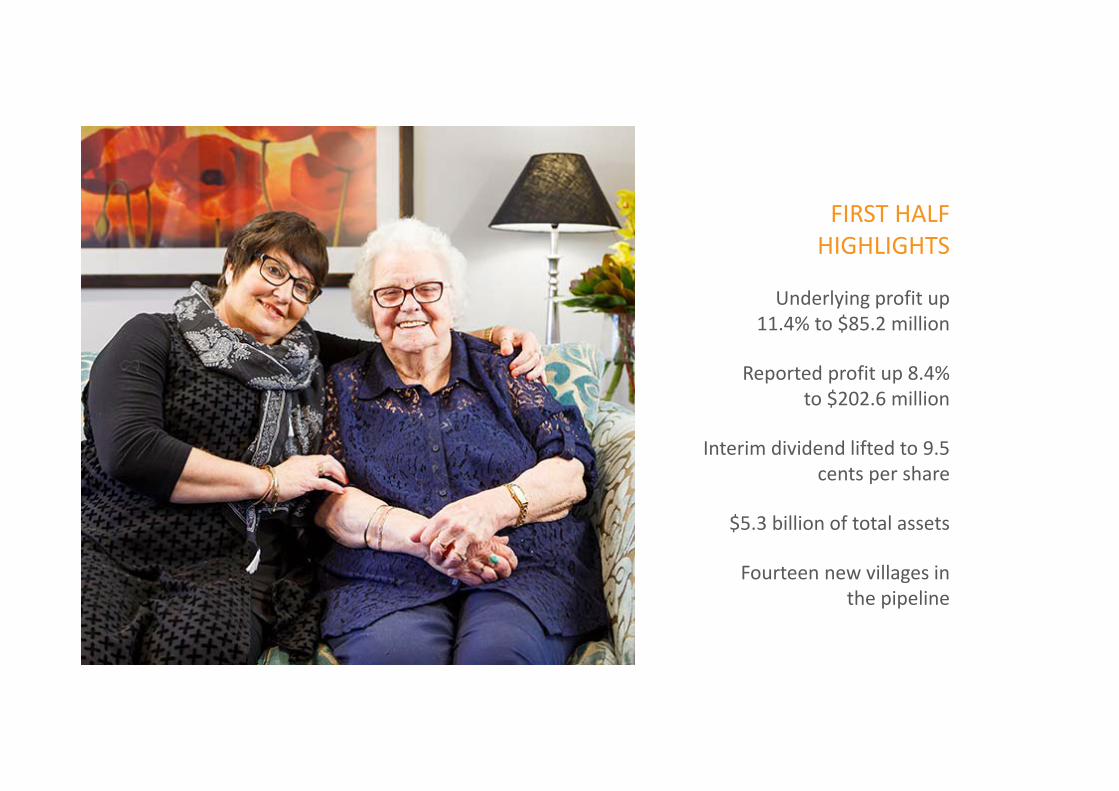
Ryman statistics as at September 2017. Statistics for other providers are as at their latest balance date.
CONTINUUM OF CARE OFFERING
‐ 1,000 2,000 3,000 4,000 5,000 6,000 7,000 8,000 9,000 10,000
Ryman
Metlifecare
Summerset
Arvida
BUPA
Oceania
Care beds and serviced apartments Independent living

STRONG CLINICAL OUTCOMES
50%
31%
13%
23%
36%
25%
38%
0%
10%
20%
30%
40%
50%
60%
Ryman Provider A Provider B Provider C Provider D Provider E Provider F
Percentage of villages with 4 year certificationIncludes aged care providers with 15 or more villages


Delicious new food offerings Ryman Moves

MYRYMAN
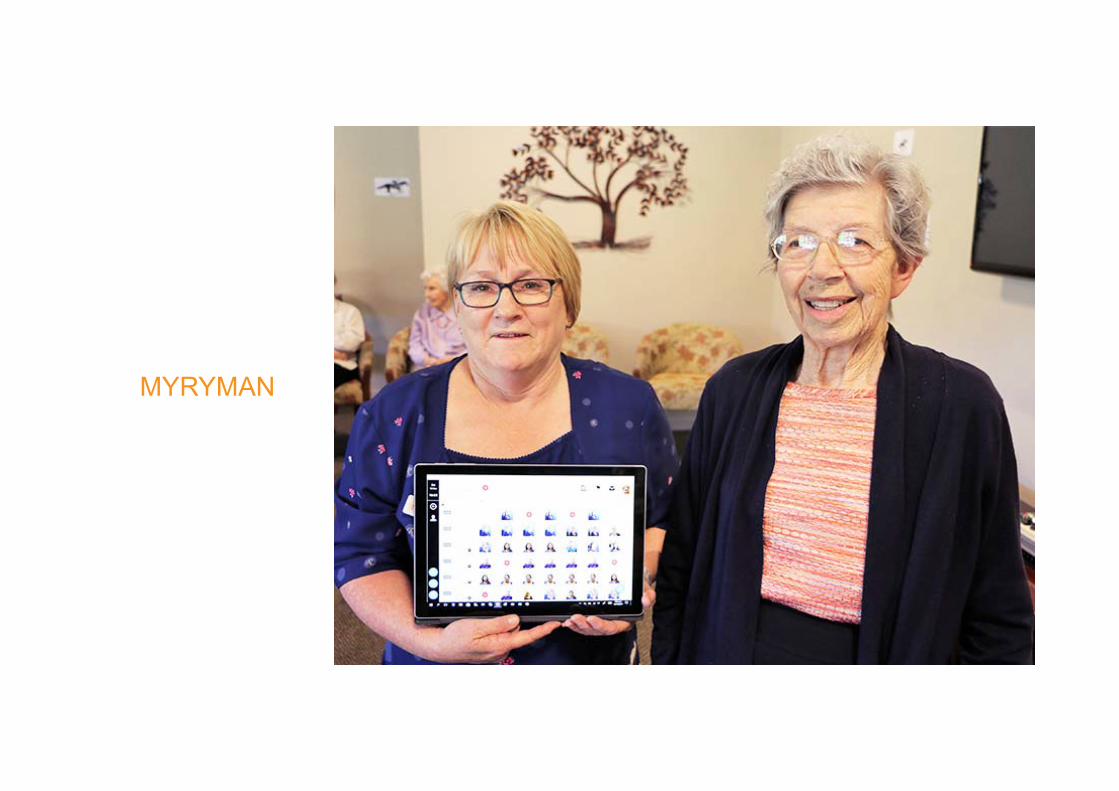
MYRYMAN

MYRYMAN –ROLLOUT COMPLETE BY AUGUST 2018

Chris Beckett and Barbara Reynen‐Rose

LEADERSHIP PROGRAMME
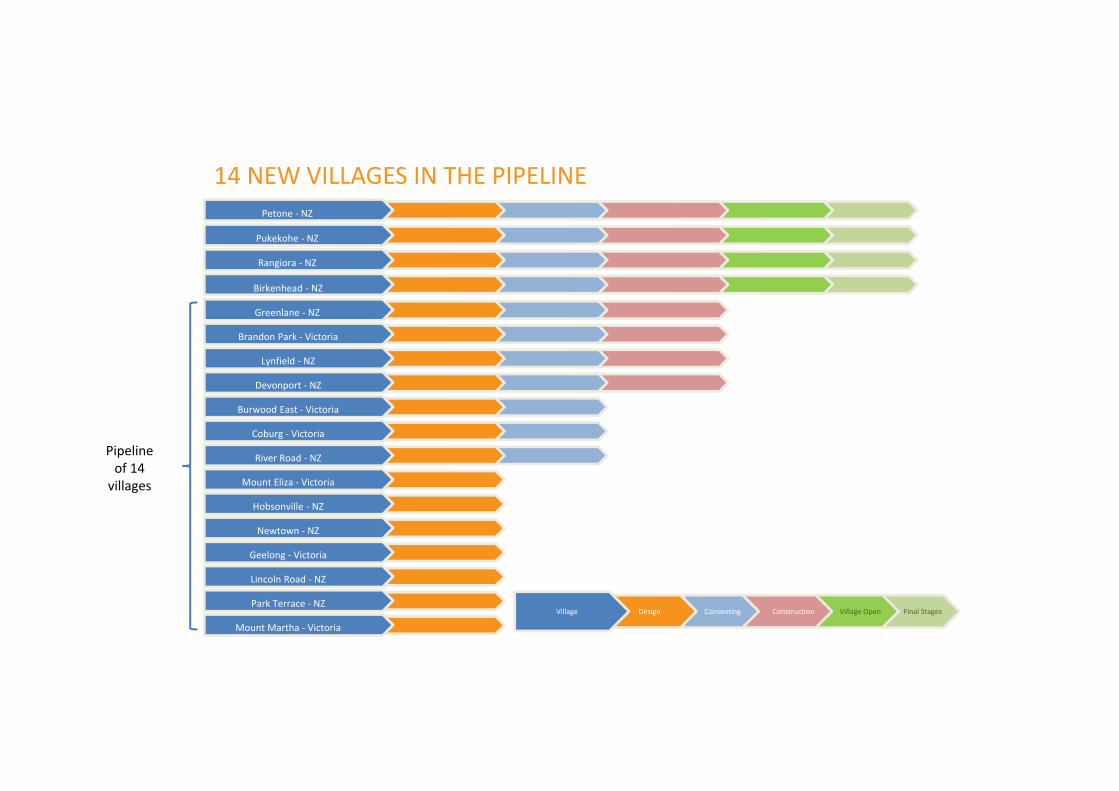
14 NEW VILLAGES IN THE PIPELINE
Pukekohe ‐ NZ
Rangiora ‐ NZ
Birkenhead ‐ NZ
Greenlane ‐ NZ
Petone ‐ NZ
Brandon Park ‐ Victoria
Lynfield ‐ NZ
Devonport ‐ NZ
Burwood East ‐ Victoria
Coburg ‐ Victoria
River Road ‐ NZ
Hobsonville ‐ NZ
Mount Eliza ‐ Victoria
Newtown ‐ NZ
Geelong ‐ Victoria
Lincoln Road ‐ NZ
Park Terrace ‐ NZ
Mount Martha ‐ Victoria
Final StagesVillage OpenConstructionConsentingDesignVillage
Pipeline of 14 villages

BRANDON PARKMelbourne

LYNFIELDAuckland

MT MARTHAVictoria
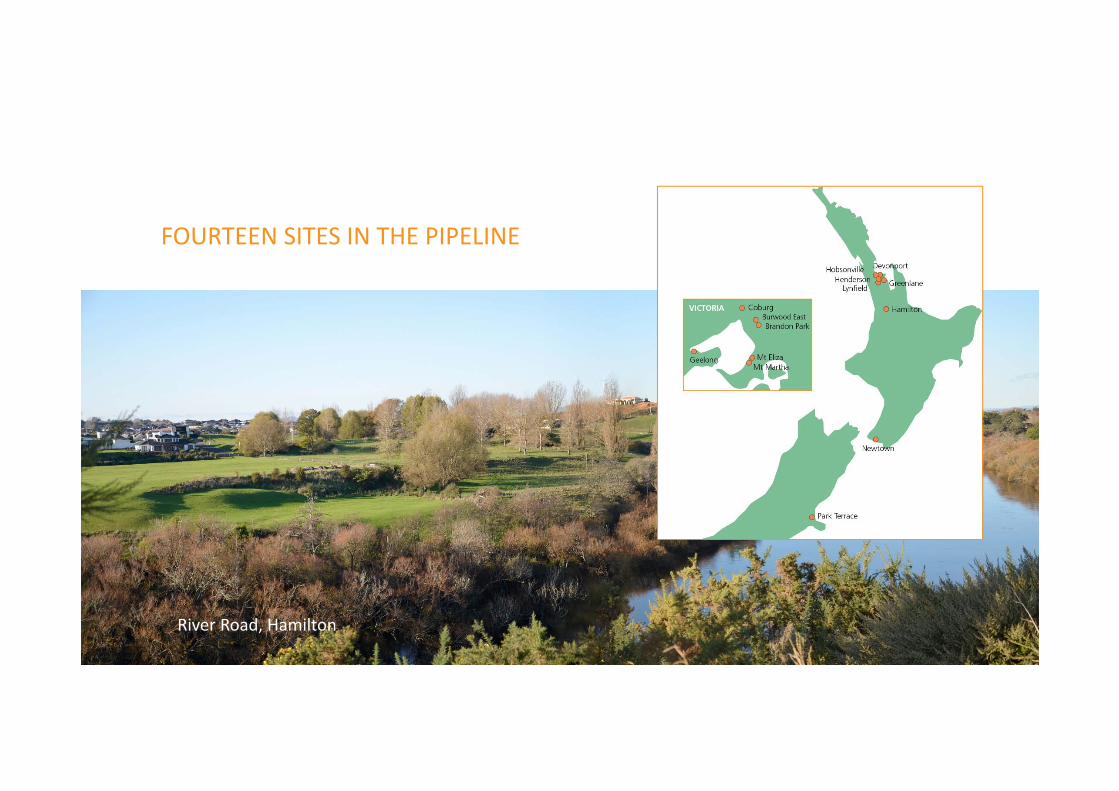
FOURTEEN SITES IN THE PIPELINE
River Road, Hamilton

POPULATION GROWTH 75+
‐
175,000
350,000
525,000
700,000
875,000
1,050,000
1,225,000
1,400,000
0
5,000
10,000
15,000
20,000
25,000
30,000
35,000
40,000
2006‐2011 2011‐2014 2014‐2018 2018‐2023 2023‐2028 2028‐2033 2033‐2038 2038‐2043 2043‐2048
NZ avg annual increase in population aged 75+ Victoria avg annual increase in population aged 75+
NZ total population aged 75+ (RHS) Victoria total population aged 75+ (RHS)

Proud new sponsors of the Coburg Lions

UNDERLYING PROFIT GROWTH
0
50
100
150
200
250
2002 2003 2004 2005 2006 2007 2008 2009 2010 2011 2012 2013 2014 2015 2016 2017 2018
$ Millions
First half Second half Target range
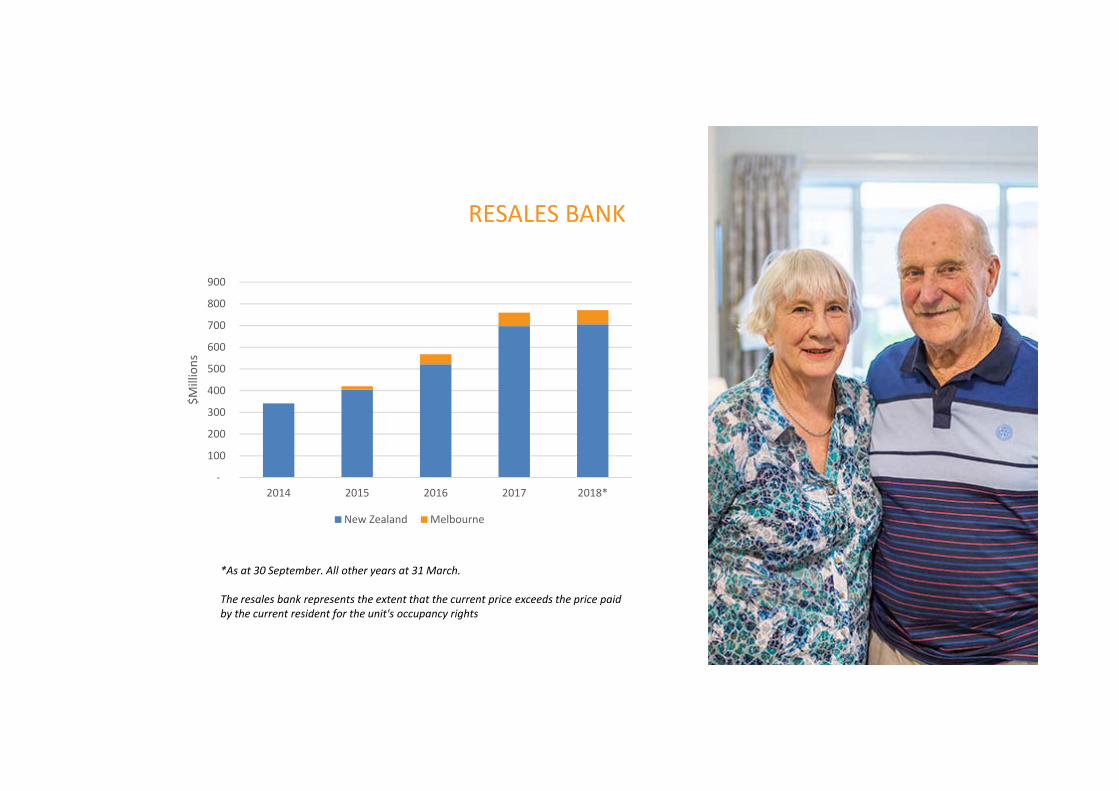
RESALES BANK
*As at 30 September. All other years at 31 March.
The resales bank represents the extent that the current price exceeds the price paid by the current resident for the unit's occupancy rights
‐
100
200
300
400
500
600
700
800
900
2014 2015 2016 2017 2018*
$Millions
New Zealand Melbourne

TOTAL ASSETS
0
1
2
3
4
5
6
Sep 06 Sep 07 Sep 08 Sep 09 Sep 10 Sep 11 Sep 12 Sep 13 Sep 14 Sep 15 Sep 16 Sep 17
$Billions

0%
5%
10%
15%
20%
25%
30%
35%
2012 2013 2014 2015 2016 2017 2018*
Group development margin Margin excluding Bob Scott
DEVELOPMENT MARGIN
*Represents first half only
Target range
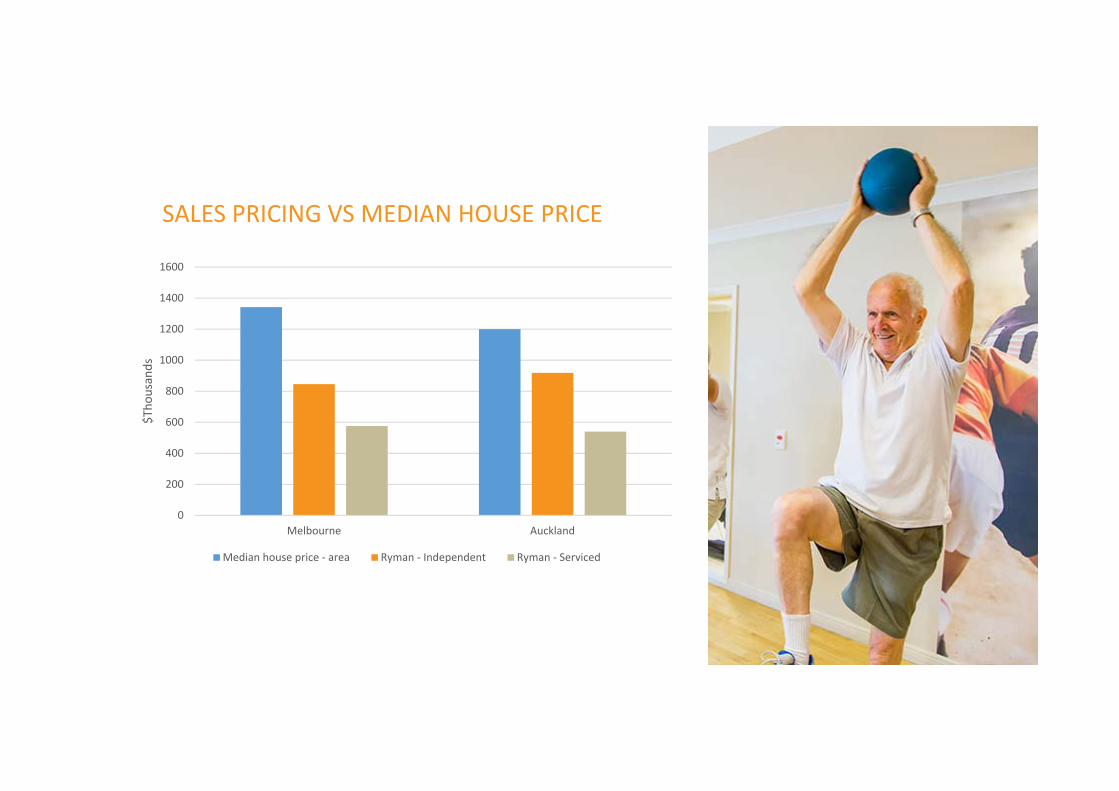
SALES PRICING VS MEDIAN HOUSE PRICE
0
200
400
600
800
1000
1200
1400
1600
Melbourne Auckland
$Tho
usan
ds
Median house price ‐ area Ryman ‐ Independent Ryman ‐ Serviced

CAPITAL PROCEEDS
* Indicative occupancy advances
0
1
2
3
4
5
6
Sep 2012 Sep 2017 Mar 2022 *$ Billion
Gross Occupancy Advances
LONG TERM CAPITAL EFFICIENCY
$25m raised at IPO in 1999
Invested $2.8bn in portfolio since 1999with no fresh capital
Dividends of $630m paid since float
Self‐funded growth
Strong balance sheet

APPENDICES
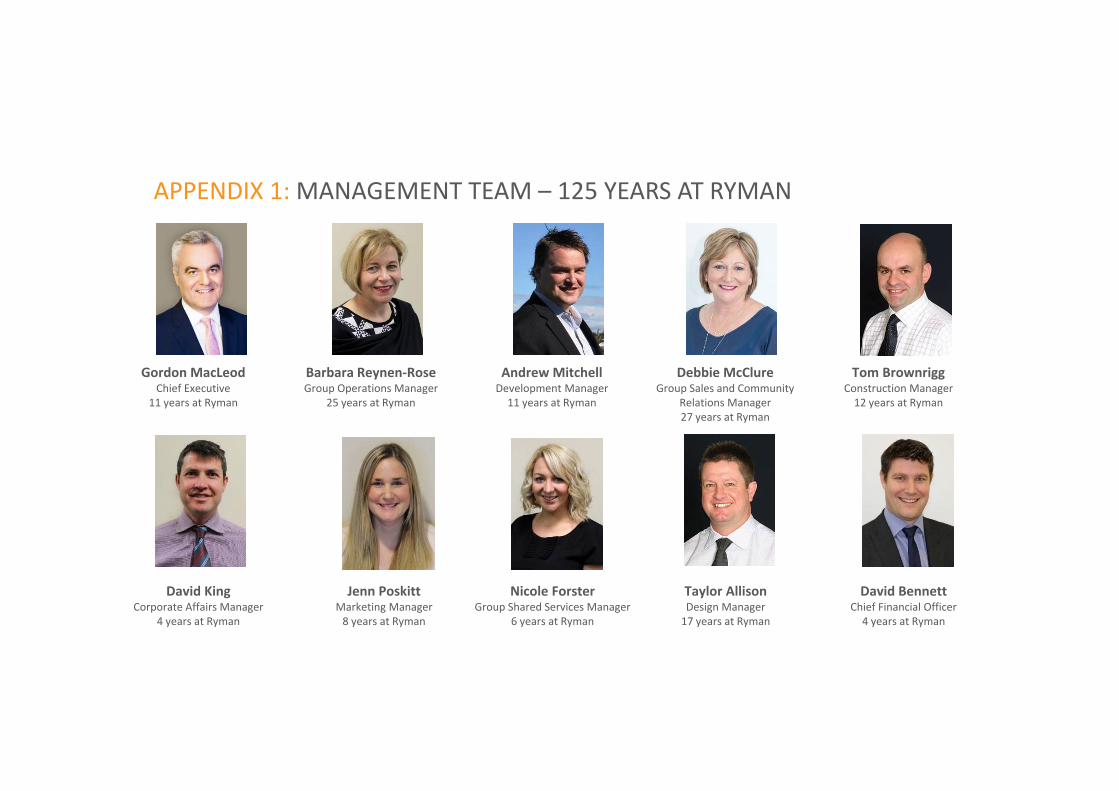
Gordon MacLeodChief Executive
11 years at Ryman
Barbara Reynen‐RoseGroup Operations Manager
25 years at Ryman
Debbie McClureGroup Sales and Community
Relations Manager27 years at Ryman
Jenn PoskittMarketing Manager8 years at Ryman
David KingCorporate Affairs Manager
4 years at Ryman
Andrew MitchellDevelopment Manager
11 years at Ryman
Tom BrownriggConstruction Manager12 years at Ryman
Taylor AllisonDesign Manager17 years at Ryman
Nicole ForsterGroup Shared Services Manager
6 years at Ryman
APPENDIX 1: MANAGEMENT TEAM – 125 YEARS AT RYMAN
David BennettChief Financial Officer
4 years at Ryman

APPENDIX 2: REPORTED PROFIT UP 8.4%
Underlying profit $85.2M
Unrealised revaluations of RV units +$118.3M
Deferred tax expense ‐$0.9M
Reported net profit $202.6M
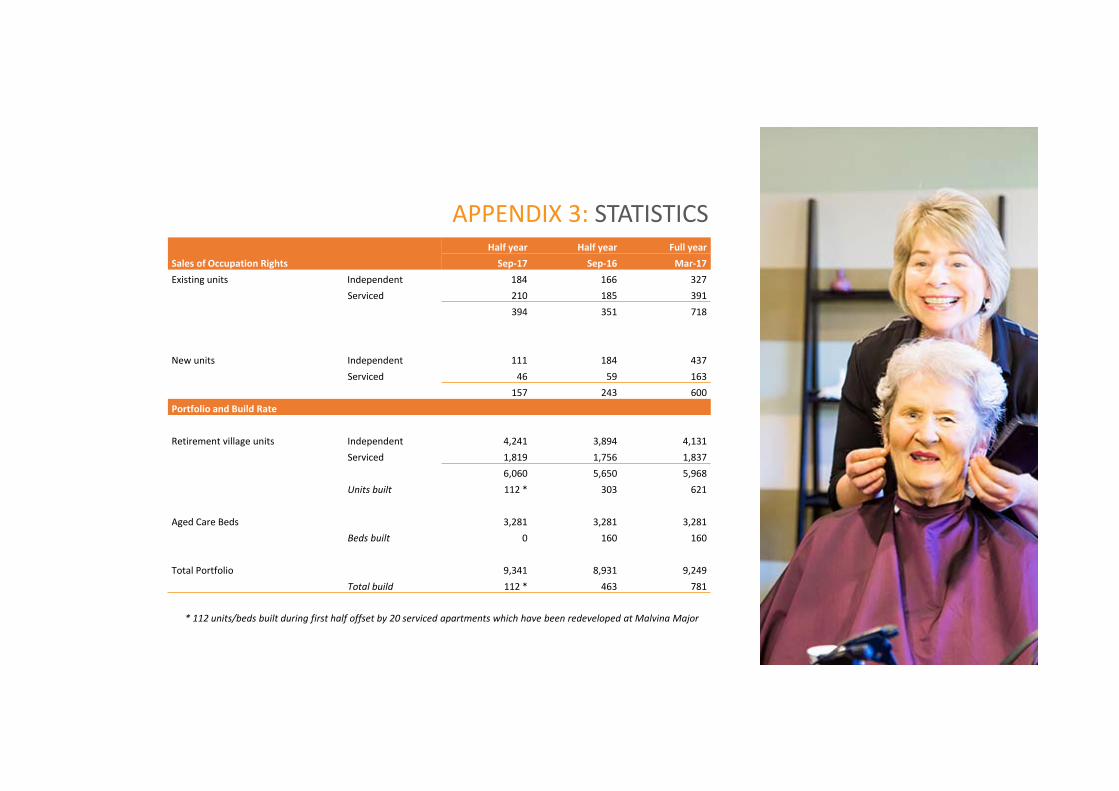
APPENDIX 3: STATISTICS
* 112 units/beds built during first half offset by 20 serviced apartments which have been redeveloped at Malvina Major
Sales of Occupation RightsHalf year Half year Full yearSep‐17 Sep‐16 Mar‐17
Existing units Independent 184 166 327Serviced 210 185 391
394 351 718
New units Independent 111 184 437Serviced 46 59 163
157 243 600Portfolio and Build Rate
Retirement village units Independent 4,241 3,894 4,131Serviced 1,819 1,756 1,837
6,060 5,650 5,968Units built 112 * 303 621
Aged Care Beds 3,281 3,281 3,281Beds built 0 160 160
Total Portfolio 9,341 8,931 9,249Total build 112 * 463 781

APPENDIX 4: MARGINHalf year Half year Full yearSept‐17 Sept‐16 Mar‐17
New Sales $000s $000s $000sReference
Realised Fair Value movement – new RV units (Note 3) 15,612 23,004 62,959Sale of occupation rights – new RV units (Key statistics) 90,520 110,522 263,282Gross development margin % 17% 21% 24%
Resales
Realised Fair Value movement – existing RV units (Note 3) 52,844 34,638 77,286Sale of occupation rights – existing RV units (Key statistics) 201,830 147,102 311,348Gross resales margin % 26% 24% 25%
Possum Bourne, Pukekohe
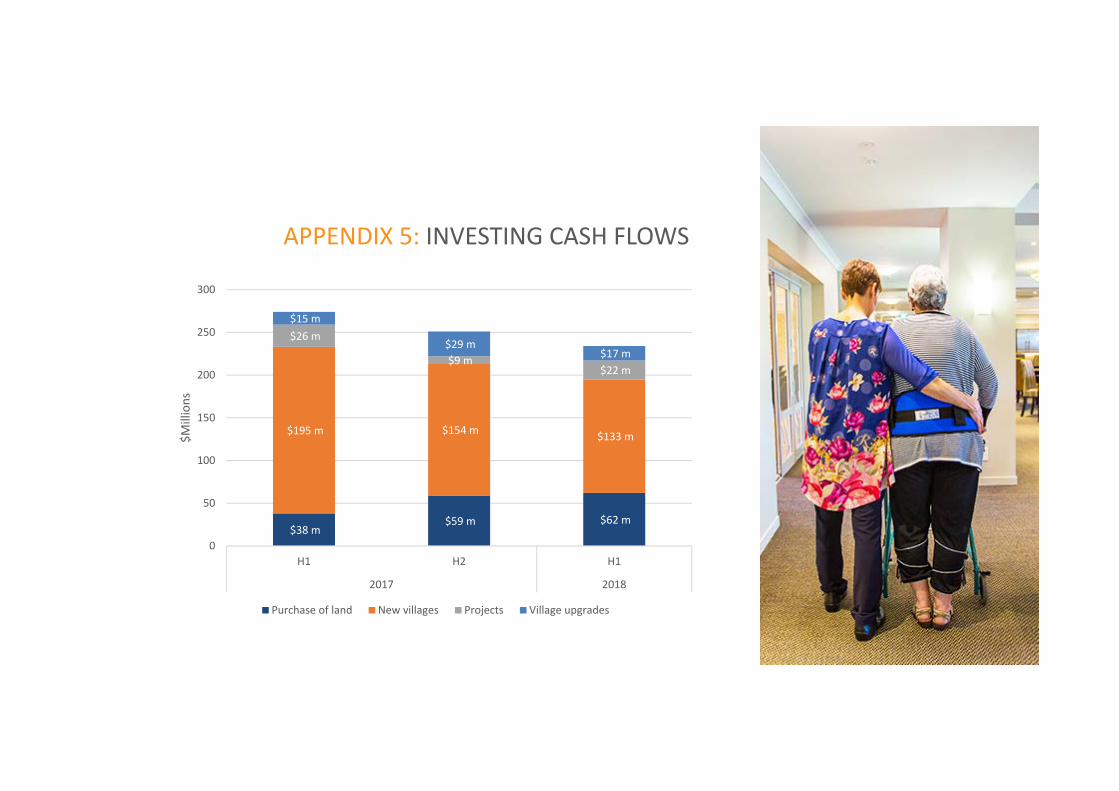
APPENDIX 5: INVESTING CASH FLOWS
$38 m$59 m $62 m
$195 m $154 m $133 m
$26 m
$9 m$22 m
$15 m
$29 m$17 m
0
50
100
150
200
250
300
H1 H2 H1
2017 2018
$Millions
Purchase of land New villages Projects Village upgrades

APPENDIX 6: INVESTMENT PROPERTY SUMMARYCBRE Nominal Unit Price Inflation Assumption by Year Discount
Rateas at 30 September 2017 1 2 3 4 5+
Auckland 1.0% 2.0% 2.4% 3.0% 3.5% 12.50%
Rest of New Zealand 0.9% 1.5% 2.0% 2.8% 3.3% 13.39%
Melbourne 3.6% 3.6% 3.6% 3.8% 3.9% 14.00%
Growth rates and discount rates are the weighted average rates of the individual villages in each region.
Birkenhead, Auckland

APPENDIX 7: OPERATING CASH FLOWS
Half year Half year Full year
Sep‐17 Sep‐16 Mar‐17
Operating cash flow $000’s $000’s $000’s
Resident receipts 129,971 109,348 227,665
Refundable accommodation deposits (net) 1,069 838 572
Development sales 130,324 115,834 246,116
Resales 162,523 141,706 285,476
Total receipts from residents 423,887 367,726 759,829
Interest received 160 302 476
Payments to suppliers and employees ‐132,753 ‐100,634 ‐214,028
Payments to residents ‐109,078 ‐99,924 ‐212,548
Interest paid ‐7,105 ‐6,224 ‐10,930
Net operating cash flow 175,111 161,246 322,799

APPENDIX 8: CAPITAL MANAGEMENT
* Gearing ratio calculated as net debt / net debt plus net equity
As atSept‐17
000’s
As atSept‐16
000’s
As atMar‐17000’s
Net debt 945 703 838 Net equity 1,805 1,463 1,652 Net equity plus debt 2,750 2,166 2,490Gearing ratio * 34% 33% 34%
22%
32%
42%
52%
62%
72%
‐
1,000
2,000
3,000
4,000
5,000
6,000
Sept 15 Mar 16 Sept 16 Mar 17 Sept 17
$ Millions
Total assets and gearing ratio
Net debt Total assets Gearing ratio * ‐
100
200
300
400
500
600
700
800
900
1,000
Debt
$ Millions
Use of Debt
Projects and Head Office
Generators
Other village capex
Village refurbishments andimprovements
New Sale debtors
Development WIP
Undeveloped Land

APPENDIX 9: Resale Stock
As at Sept‐17 As at Sept‐16 As at Mar‐17Total Resales stock 46 47 32Total retirement portfolio 6,060 5,650 5,968 Resale stock available percentage 0.8% 0.8% 0.5%
0.9%
1.4%
1.0%
1.3% 1.4%
1.2%
0.8%
0.5%
0.8%
0.0%
0.2%
0.4%
0.6%
0.8%
1.0%
1.2%
1.4%
1.6%
H1 H2 H1 H2 H1 H2 H1 H2 H1 H2
2014 2015 2016 2017 2018
Available resales stock Average

APPENDIX 10: VALUE OF CONTRACTS NOT BOOKED
‐
50
100
150
200
250
Sept‐15 Mar‐16 Sept‐16 Mar‐17 Sept‐17
$ Millions
Note: Presales are unconditional occupation rights agreements which have been entered by residents but have not been booked as the unit is not yet near complete
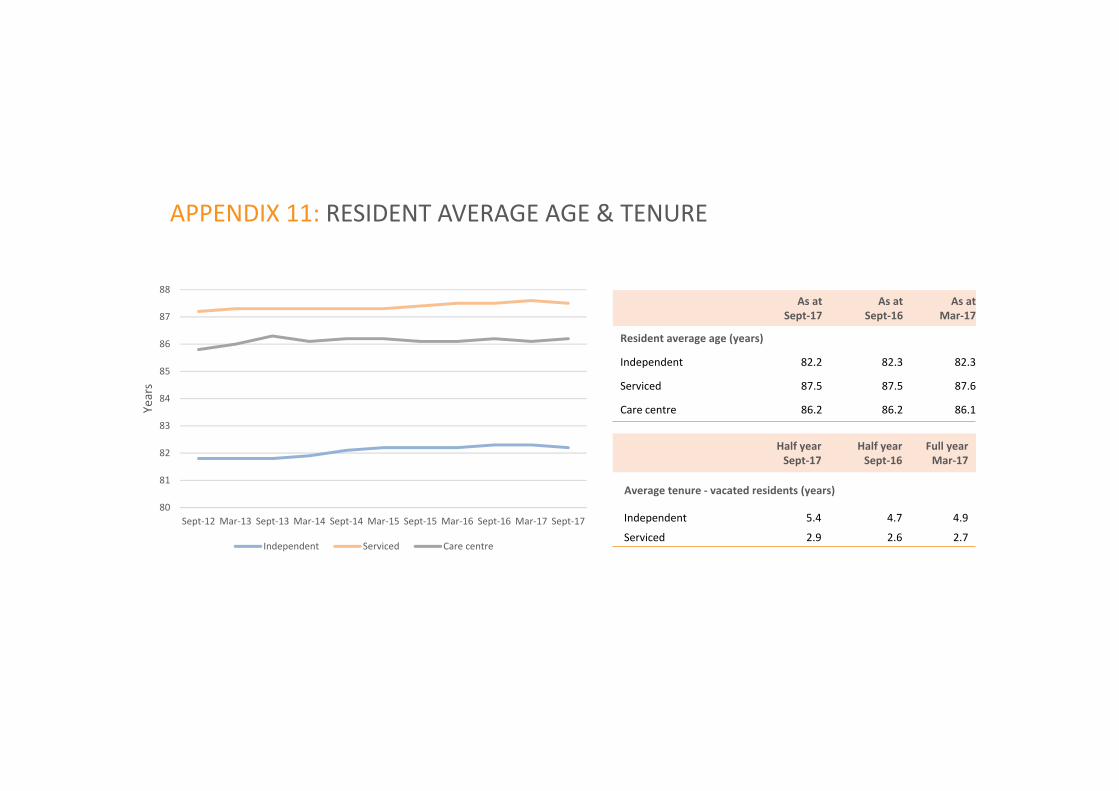
APPENDIX 11: RESIDENT AVERAGE AGE & TENURE
80
81
82
83
84
85
86
87
88
Sept‐12 Mar‐13 Sept‐13 Mar‐14 Sept‐14 Mar‐15 Sept‐15 Mar‐16 Sept‐16 Mar‐17 Sept‐17
Years
Independent Serviced Care centre
As atSept‐17
As atSept‐16
As atMar‐17
Resident average age (years)
Independent 82.2 82.3 82.3
Serviced 87.5 87.5 87.6
Care centre 86.2 86.2 86.1
Half yearSept‐17
Half yearSept‐16
Full yearMar‐17
Average tenure ‐ vacated residents (years)
Independent 5.4 4.7 4.9
Serviced 2.9 2.6 2.7
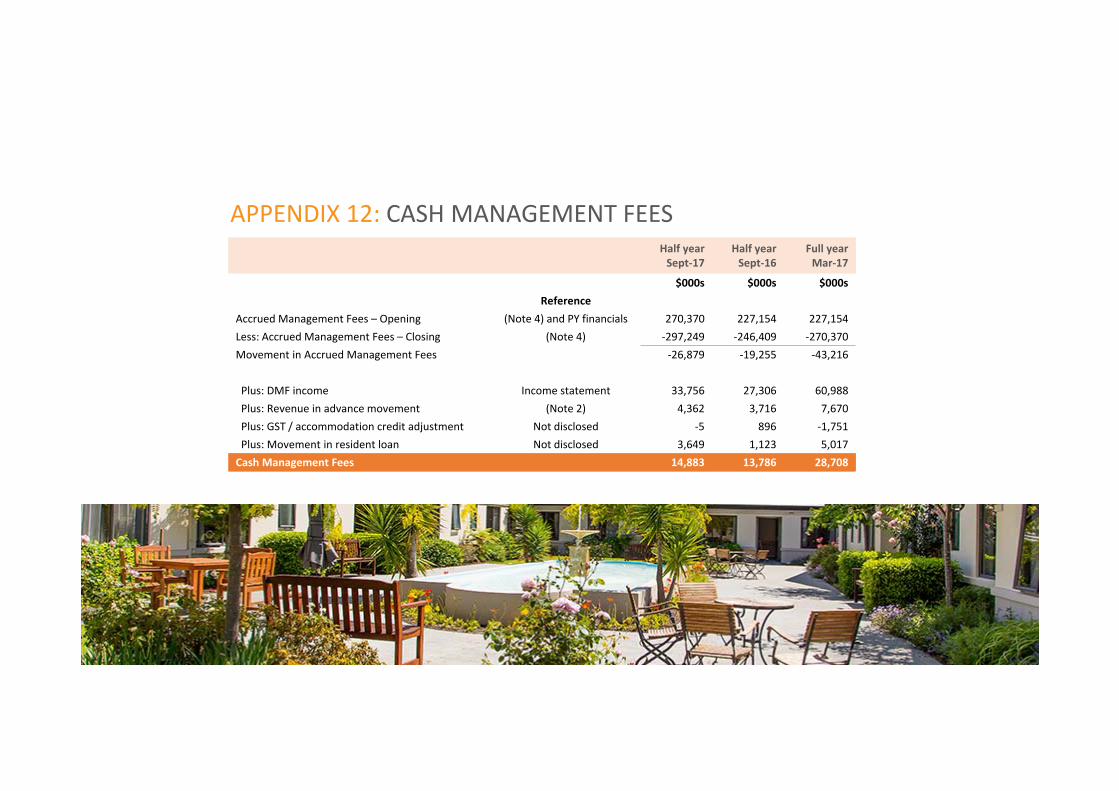
APPENDIX 12: CASH MANAGEMENT FEESHalf yearSept‐17
Half yearSept‐16
Full yearMar‐17
$000s $000s $000sReference
Accrued Management Fees – Opening (Note 4) and PY financials 270,370 227,154 227,154Less: Accrued Management Fees – Closing (Note 4) ‐297,249 ‐246,409 ‐270,370Movement in Accrued Management Fees ‐26,879 ‐19,255 ‐43,216
Plus: DMF income Income statement 33,756 27,306 60,988Plus: Revenue in advance movement (Note 2) 4,362 3,716 7,670Plus: GST / accommodation credit adjustment Not disclosed ‐5 896 ‐1,751Plus: Movement in resident loan Not disclosed 3,649 1,123 5,017Cash Management Fees 14,883 13,786 28,708

APPENDIX 13: LAND BANKHospital Dementia Resthome Serviced Independent Total
NEW ZEALANDExisting SitesJean Sandel New Plymouth ‐ ‐ ‐ ‐ 59 59Kiri Te Kanawa Gisborne ‐ ‐ ‐ ‐ 26 26Bob Scott Lower Hutt ‐ ‐ ‐ ‐ 74 74Bert Sutcliffe Auckland ‐ ‐ ‐ ‐ 151 151Possum Bourne Pukekohe ‐ ‐ ‐ ‐ 29 29Charles Upham Rangiora ‐ ‐ ‐ ‐ 57 57Campbell Road, Greenlane Auckland 40 40 36 82 91 289Total NZ Existing Sites 40 40 36 82 487 685New SitesDevonport Auckland 40 36 36 77 192 381Lynfield Auckland 42 42 40 86 332 542River Road Hamilton 40 40 40 93 248 461Lincoln Road Henderson 40 40 40 80 170 370Hobsonville Auckland 40 40 40 80 250 450Newtown Wellington 28 20 28 46 55 177Park Terrace Christchurch 35 20 16 66 53 190Total NZ New Sites 265 238 240 528 1,300 2,571Total New Zealand Landbank 305 278 276 610 1,787 3,256
AustraliaNew SitesBrandon Park Melbourne 80 39 80 94 328 621Burwood East Melbourne 40 40 40 78 163 361Mount Eliza Melbourne 40 40 40 70 315 505Coburg Melbourne 35 35 36 85 221 412Geelong Victoria 40 40 40 62 88 270Mount Martha Melbourne 28 24 28 56 79 215Total Australian Landbank 263 218 264 445 1,194 2,384Total 568 496 540 1,055 2,981 5,640

APPENDIX 14: ASSET BASEHospital Dementia Resthome Serviced Independent Total
(as at 30 September 2017)Anthony Wilding Christchurch 80 33 35 50 110 308 Bert Sutcliffe Birkenhead 40 40 40 81 106 307 Bob Owens Tauranga 40 40 40 79 218 417 Bob Scott Petone 40 40 34 89 180 383 Bruce McLaren Auckland 41 40 42 74 192 389 Charles Fleming Waikanae 40 40 40 79 201 400 Charles Upham Rangiora 40 40 40 93 205 418 Diana Isaac Christchurch 40 40 40 79 256 455 Edmund Hillary Auckland 114 30 50 60 373 627 Ernest Rutherford Nelson 49 25 20 75 124 293 Essie Summers Christchurch 41 24 30 58 22 175 Evelyn Page Orewa 60 37 20 66 248 431 Frances Hodgkins Dunedin ‐ ‐ 51 32 42 125 Grace Joel Auckland 77 ‐ 20 80 69 246 Greenlane Auckland ‐ ‐ ‐ ‐ 24 24 Hilda Ross Hamilton 68 40 43 51 167 369 Jane Mander Whangarei 60 32 20 71 183 366 Jane Winstone Wanganui 30 ‐ 39 50 54 173 Jean Sandel New Plymouth 39 33 39 62 171 344 Julia Wallace Palmerston North 43 21 20 50 111 245 Kiri Te Kanawa Gisborne 46 15 34 62 79 236 Malvina Major Wellington 90 ‐ 30 39* 117 276 Margaret Stoddart Christchurch ‐ ‐ 41 25 20 86 Ngaio Marsh Christchurch 81 ‐ 30 40 119 270 Possum Bourne Pukekohe 40 40 40 84 230 434 Princess Alexandra Napier 60 24 24 54 70 232 Rita Angus Wellington 49 ‐ 20 50 99 218 Rowena Jackson Invercargill 70 26 61 46 103 306 Shona McFarlane Lower Hutt 59 ‐ 20 50 130 259 Woodcote Christchurch ‐ ‐ 49 7 18 74 Yvette Williams Dunedin 57 30 3 32 ‐ 122 Weary Dunlop Melbourne 30 20 32 51 200 333
Current Units & Beds 1,524 710 1,047 1,819 4,241 9,341
* Enhancements to the serviced apartment offering at Malvina Major has resulted in a 20 unit reduction in the asset base from previously reported.