Embed Size (px)
Citation preview

Unit 1 Test Review

Ryan received the following scores on his last 5 math tests: 85 , 78, 92, 91, 84
What is the range of his scores?
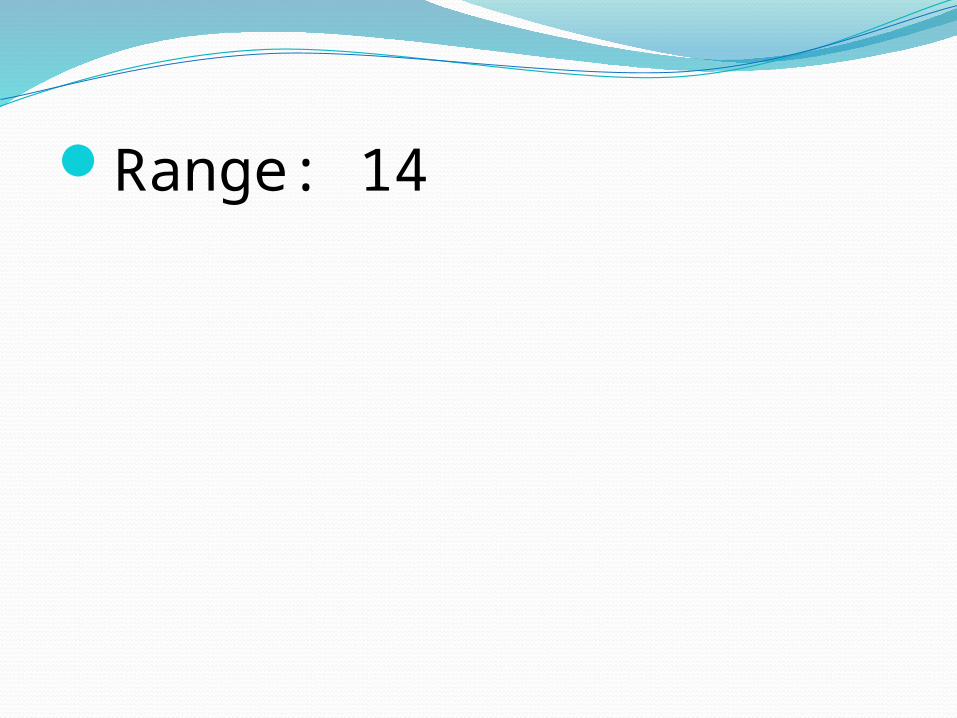
Range: 14

1 2 3 40
6
12
18
24
30
36
0 0 0 0
Janelle's Height
Age in Years
Heig
ht
in I
nch
es
How many inches did Janelle grow between the ages of 1 and 5?

24 inches (2 feet)

Which circle graph best represents the data:Type of Dog Number of Owners
German Sheppard IIII IIII
Golden Retriever IIII
Black Lab III
Poodle II
German Shep-pard
Black Lab
Golden Re-
treiver
Poodle
German Shep-pard
Black Lab
Golden Re-
treiver
Poodle
German Shep-pard
Black Lab
Golden Retreiver
Poodle A. C.
B.

B.
German Shep-pard
Black Lab
Golden Re-
treiver
Poodle
Type of Dog Number of Owners
German Sheppard IIII IIII
Golden Retriever IIII
Black Lab III
Poodle II

Create a stem-and leaf plot for the following grades:
73, 82, 67, 78, 99, 84, 91, 82, 86, 94, 97, 70

Stem Leaves6 7
7 0 3 8
8 2 2 4 6
9 1 4 7 9

Stem Leaves6 7
7 0 3 8
8 2 2 4 6
9 1 4 7 9
Test Grades
1. How many grades were more than 84?
2. How many grades were less than 78?
3. How many grades were at least 91?

1. 52. 33. 4
Stem Leaves6 7
7 0 3 8
8 2 2 4 6
9 1 4 7 9

Football Fundraiser
Create a double bar graph for the data above. -Be sure to
- Title the graph- Label the axes- Provide an appropriate key for the
graph
Month Amount Raised
Expenses
September $ 100 $ 25
October $ 250 $ 75
November $ 200 $ 50
December $ 350 $125

September October November December $0
$50
$100
$150
$200
$250
$300
$350
$400
$450
$500
Football Fundraiser
Amount Raised Expenses
Months
Am
ount
of
Money
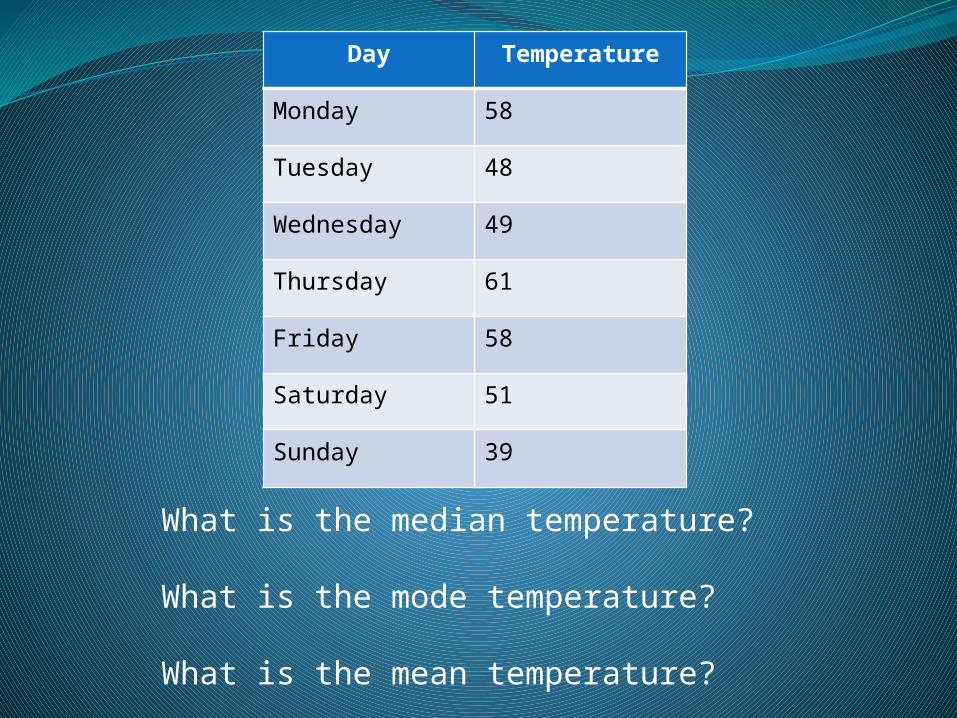
What is the median temperature?
What is the mode temperature?
What is the mean temperature?
Day Temperature
Monday 58
Tuesday 48
Wednesday 49
Thursday 61
Friday 58
Saturday 51
Sunday 39

Median: 51
Mode: 58
Mean: 52
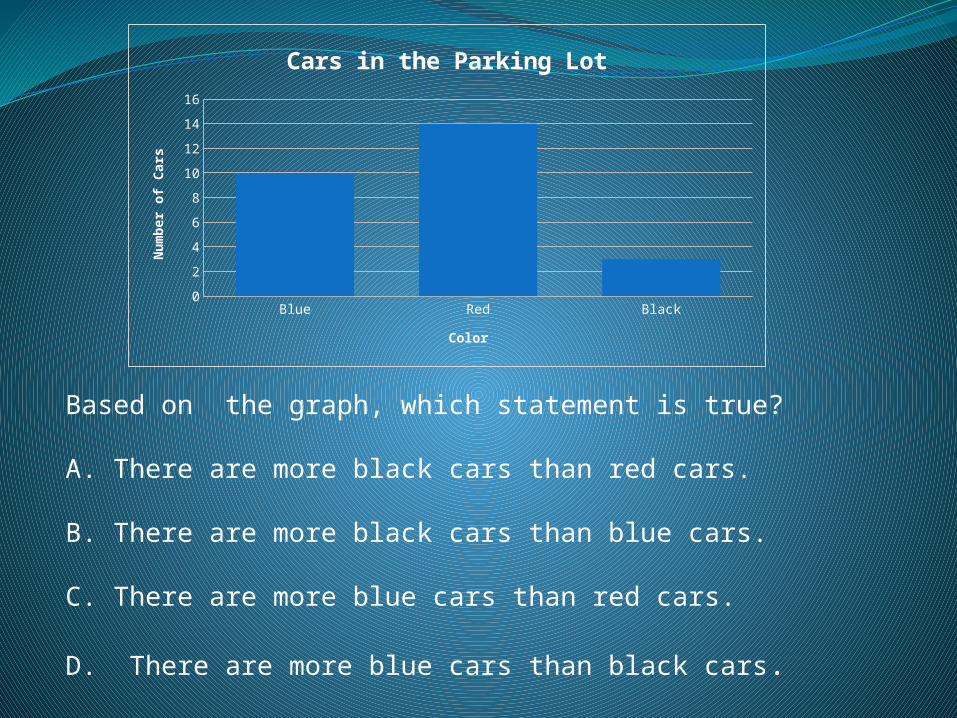
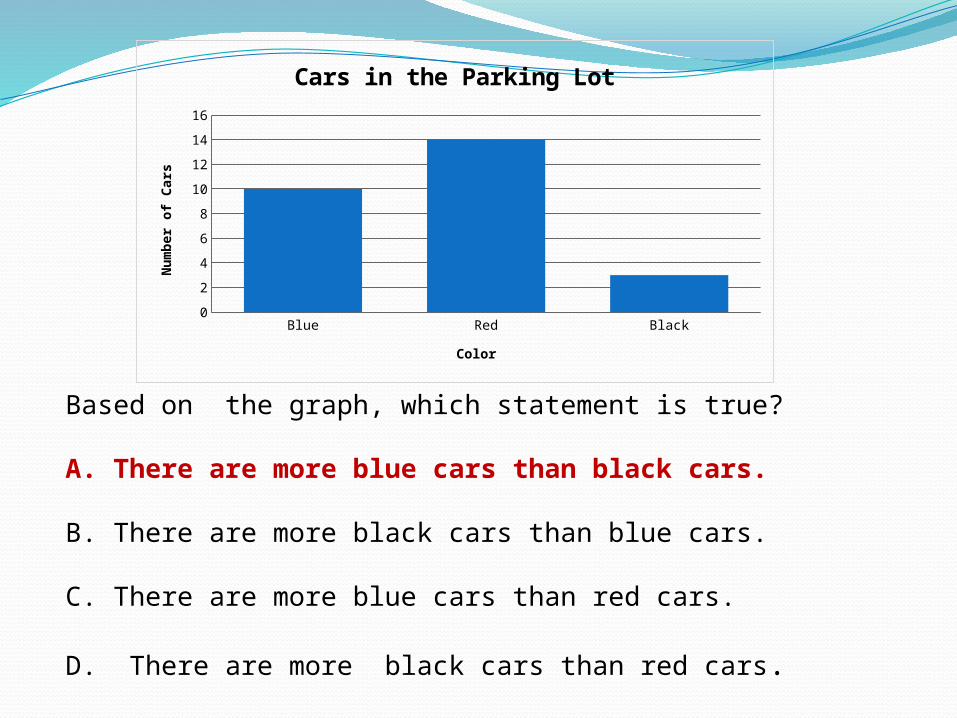
Based on the graph, which statement is true?
A. There are more black cars than red cars.
B. There are more black cars than blue cars.
C. There are more blue cars than red cars.
D. There are more blue cars than black cars.
Blue Red Black0
2
4
6
8
10
12
14
16
Cars in the Parking Lot
Color
Num
ber
of
Cars
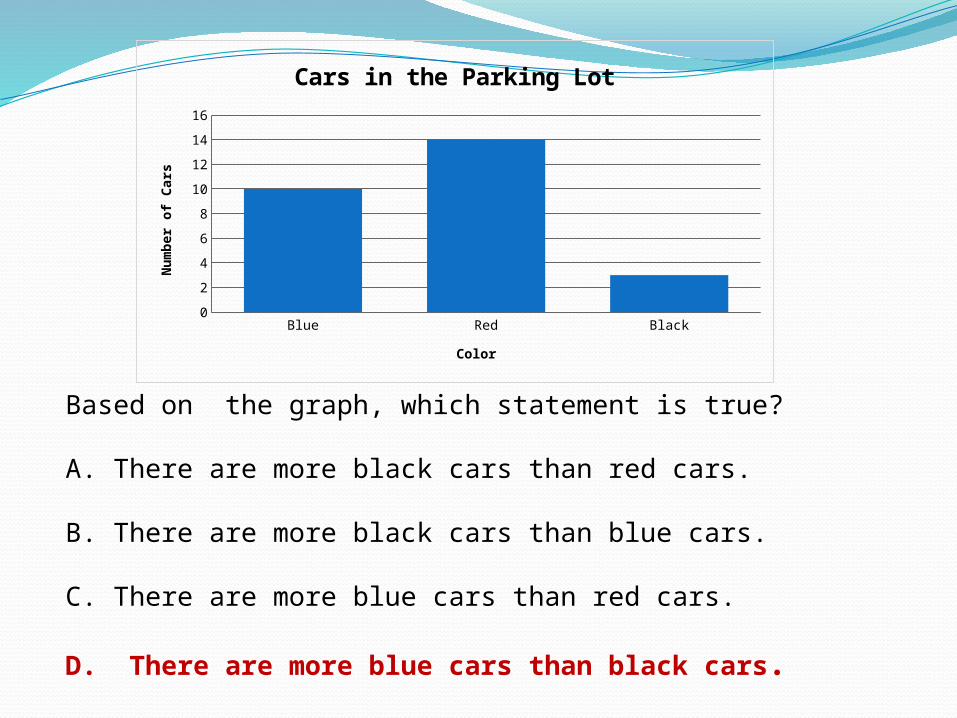

Complete the frequency table. Temperatures:77, 80, 65, 61, 65, 71, 82, 87, 70, 71, 86, 86, 86, 70, 87
Temperature (F) Tally61-65
66-70
71-75
76-80
81-85
86-90

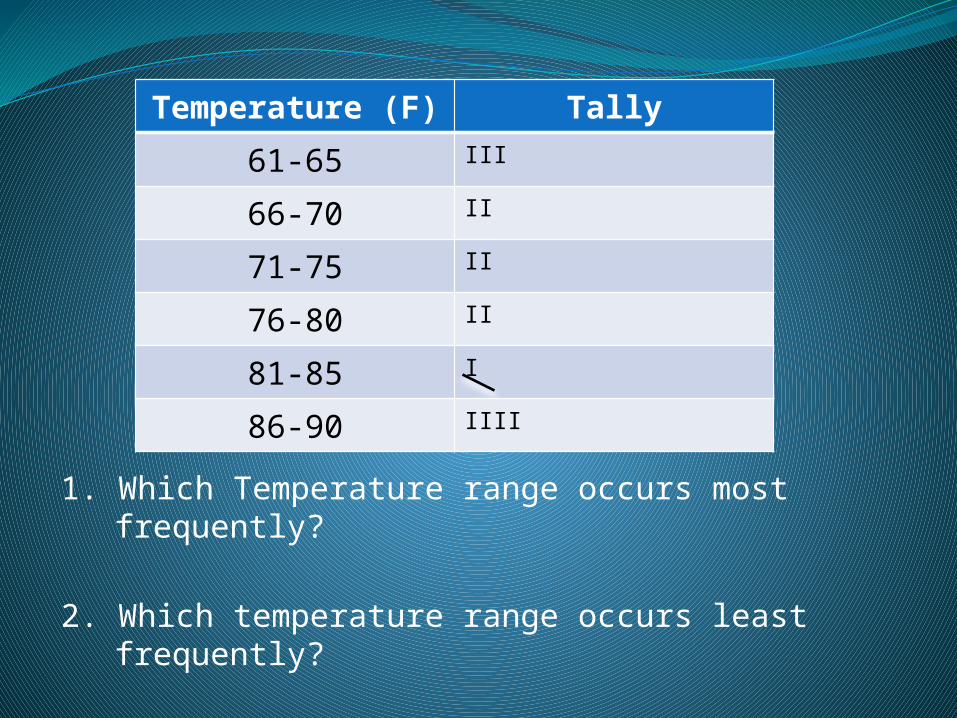
Temperature (F) Tally61-65 III
66-70 II
71-75 II
76-80 II
81-85 I
86-90 IIII
1. Which Temperature range occurs most frequently?
2. Which temperature range occurs least frequently?
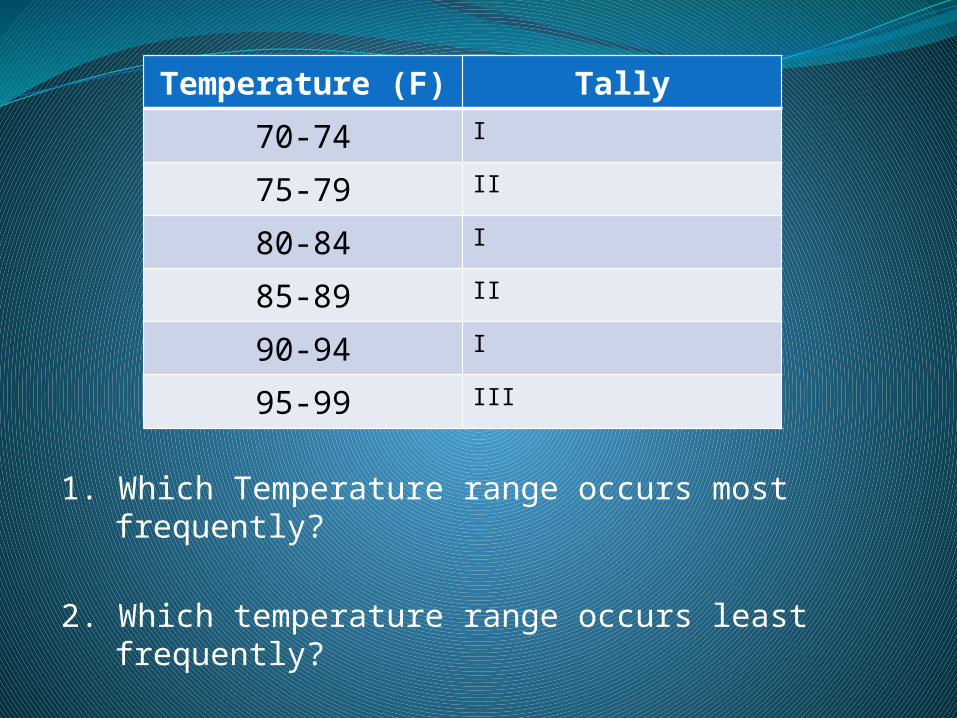
Temperature (F) Tally70-74 I
75-79 II
80-84 I
85-89 II
90-94 I
95-99 III

1. Which Temperature range occurs most frequently?
95-99 degrees F 2. Which temperature range occurs least
frequently? 70- 74, 80-84, and 90-94 degrees F
Temperature (F) Tally70-74 I
75-79 II
80-84 I
85-89 II
90-94 I
95-99 III

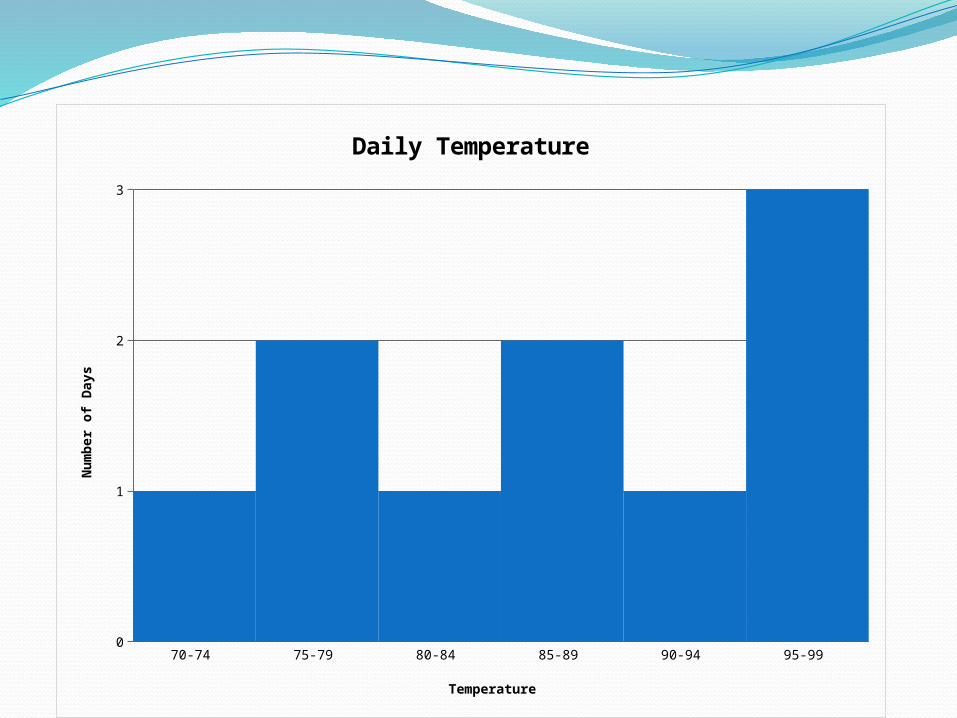
Create a histogram for the data.
Temperature (F) Tally70-74 I
75-79 II
80-84 I
85-89 II
90-94 I
95-99 III
70-74 75-79 80-84 85-89 90-94 95-99 0
1
2
3
Daily Temperature
Temperature
Num
ber
of
Days

The data shows the ages of the first 18 presidents when they took office.57, 61, 57, 57, 58, 57, 61, 54, 64, 51, 49, 64, 50, 48, 65, 52, 56, 46 ________________________________________
Interval: Frequency:
Cumulative Frequency
45-49
50-54
55-59
60-64
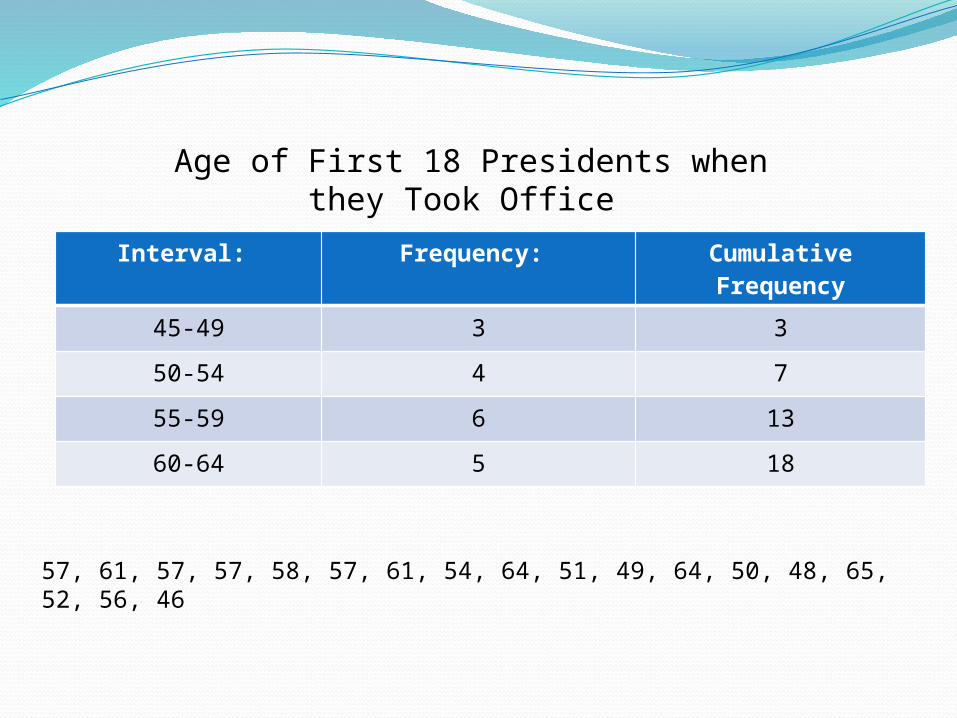
Interval: Frequency:
Cumulative Frequency
45-49 3 3
50-54 4 7
55-59 6 13
60-64 5 18
Age of First 18 Presidents when they Took Office
57, 61, 57, 57, 58, 57, 61, 54, 64, 51, 49, 64, 50, 48, 65, 52, 56, 46

Weight Loss (lbs)
Number of Calories
Eaten in a Week
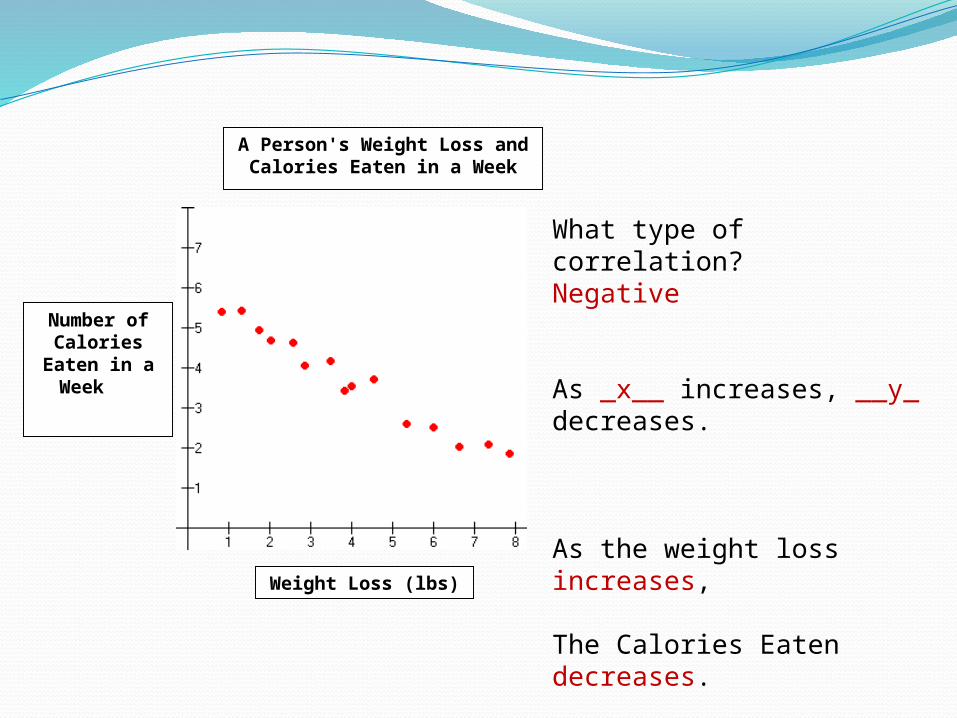
A Person's Weight Loss and Calories Eaten in a Week
What type of correlation?
As ____ increases, ____ decreases.
As the weight loss _____________,
The Calories Eaten ____________.
Weight Loss (lbs)
Number of Calories
Eaten in a Week
A Person's Weight Loss and Calories Eaten in a Week
What type of correlation?Negative
As _x__ increases, __y_ decreases.
As the weight loss increases,
The Calories Eaten decreases.
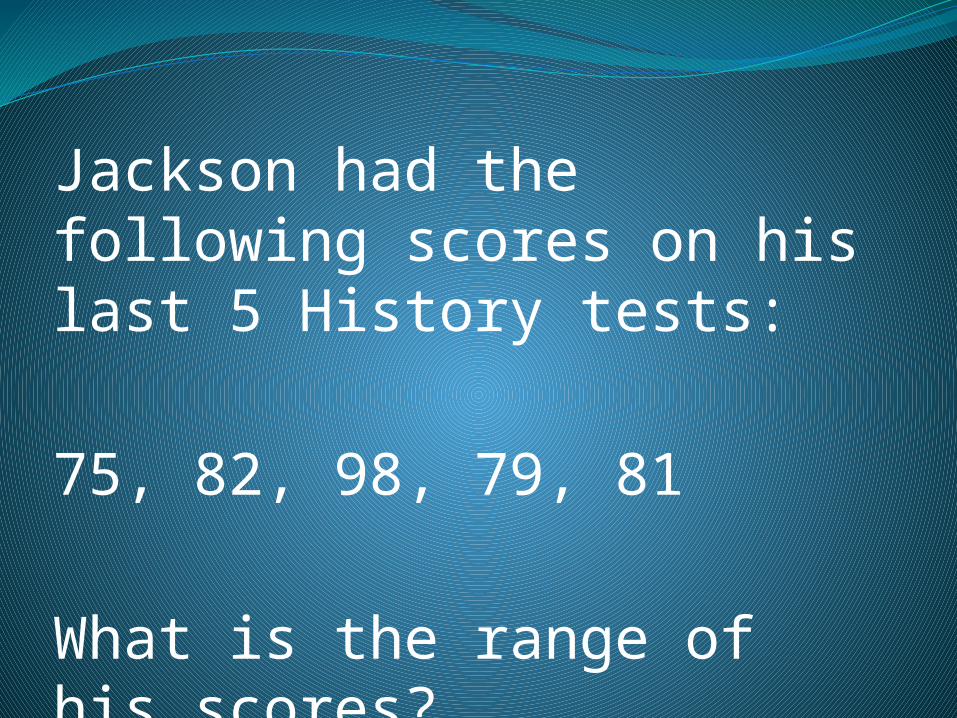
Jackson had the following scores on his last 5 History tests: 75, 82, 98, 79, 81
What is the range of his scores?

Range: 23

1 2 3 40
6
12
18
24
30
36
Janelle's Height
Age in Years
Heig
ht
in I
nch
es
How many inches did Janelle grow between the ages of 2 and 4?

12 inches ( 1 foot)

Which circle graph best represents the data: Pet Number of Owners
Dog IIII IIII
Cat IIII
Bird II
Mouse II
A. C.
B.
Dog
BirdCat
Mouse
Dog
Bird
Cat
Mouse
Dog
Bird
Cat
Mouse

B.
Dog
Bird
Cat
Mouse
Pet Number of Owners
Dog IIII IIII
Cat IIII
Bird II
Mouse II

Create a stem-and leaf plot for the following grades:
72, 81, 64, 76, 98, 82, 91, 82, 86, 94, 97, 70

Stem Leaves6 4
7 0 2 6
8 1 2 2 6
9 1 4 7 8

Test Grades
1. How many grades were more than 84?
2. How many grades were less than 76?
3. How many grades were at least 94?
Stem Leaves6 47 0 2 68 1 2 2 69 1 4 7 8
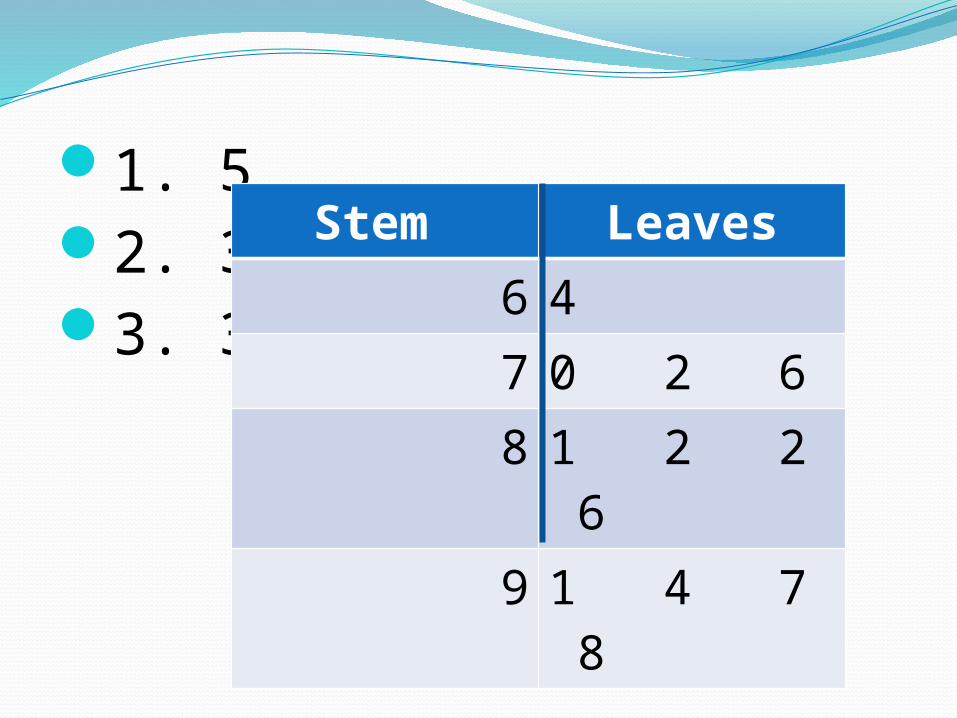
1. 52. 33. 3
Stem Leaves6 47 0 2 68 1 2 2 69 1 4 7 8

Softball Fundraiser
Create a double bar graph for the data above. -Be sure to
- Title the graph- Label the axes- Provide an appropriate key for the
graph
Month Amount Raised
Expenses
September $ 125 $ 50
October $ 275 $ 75
November $ 450 $ 125
December $ 100 $25

September October November December $0
$50
$100
$150
$200
$250
$300
$350
$400
$450
$500
Softball Fundraiser
Amount Raised Expenses
Months
Am
ount
of
Money

What is the median temperature?
What is the mode temperature?
What is the mean temperature?
Day Temperature
Monday 82
Tuesday 76
Wednesday 84
Thursday 82
Friday 92
Saturday 79
Sunday 87

Median: 79
Mode: 82
Mean: 83

Based on the graph, which statement is true?
A. There are more blue cars than black cars.
B. There are more black cars than blue cars.
C. There are more blue cars than red cars.
D. There are more black cars than red cars.
Blue Red Black0
2
4
6
8
10
12
14
16
Cars in the Parking Lot
Color
Num
ber
of
Cars
Blue Red Black0
2
4
6
8
10
12
14
16
Cars in the Parking Lot
Color
Num
ber
of
Cars
Based on the graph, which statement is true?
A. There are more blue cars than black cars.
B. There are more black cars than blue cars.
C. There are more blue cars than red cars.
D. There are more black cars than red cars.
1. Which Temperature range occurs most frequently?
2. Which temperature range occurs least frequently?
Temperature (F) Tally61-65 III
66-70 II
71-75 II
76-80 II
81-85 I
86-90 IIII

Temperature (F) Tally61-65 III
66-70 II
71-75 II
76-80 II
81-85 I
86-90 IIII
1. Which Temperature range occurs most frequently?
86-90 degrees F 2. Which temperature range occurs least
frequently? 81-85 degrees F
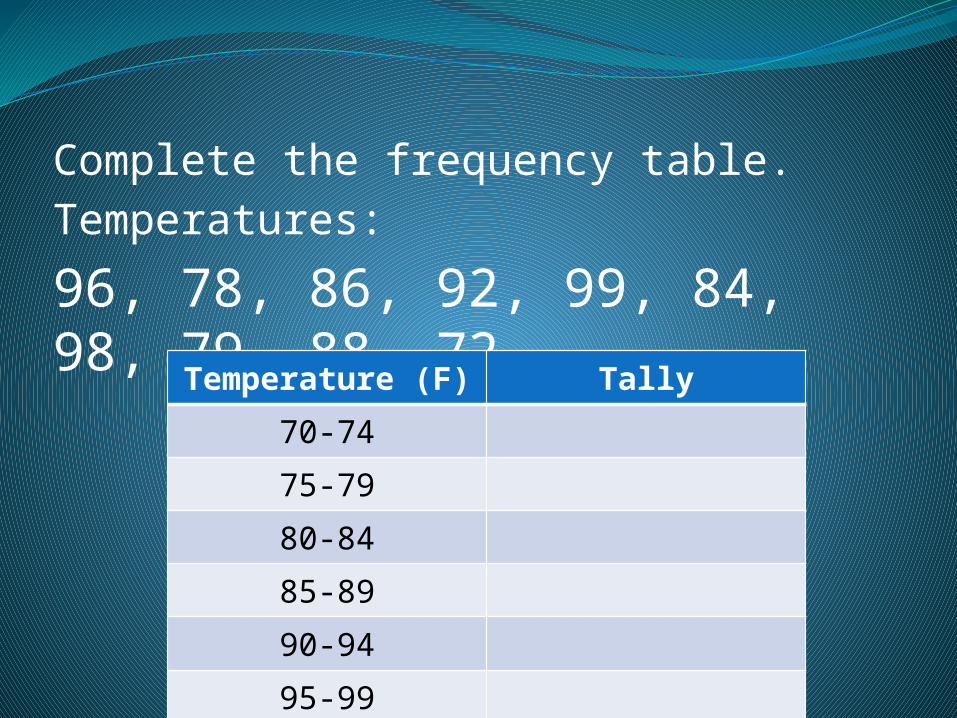
Complete the frequency table. Temperatures:
96, 78, 86, 92, 99, 84, 98, 79, 88, 72Temperature (F) Tally
70-74
75-79
80-84
85-89
90-94
95-99

Temperature (F) Tally70-74 I
75-79 II
80-84 I
85-89 II
90-94 I
95-99 III

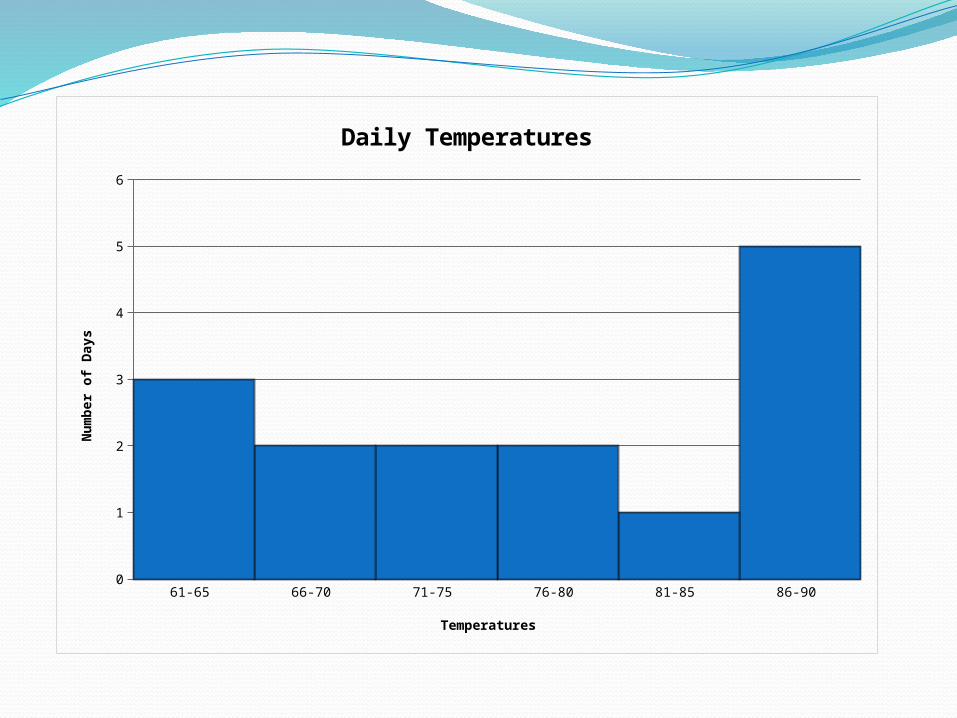
Create a histogram for the data.
Temperature (F) Tally61-65 III
66-70 II
71-75 II
76-80 II
81-85 I
86-90 IIII
61-65 66-70 71-75 76-80 81-85 86-90 0
1
2
3
4
5
6
Daily Temperatures
Temperatures
Num
ber
of
Days
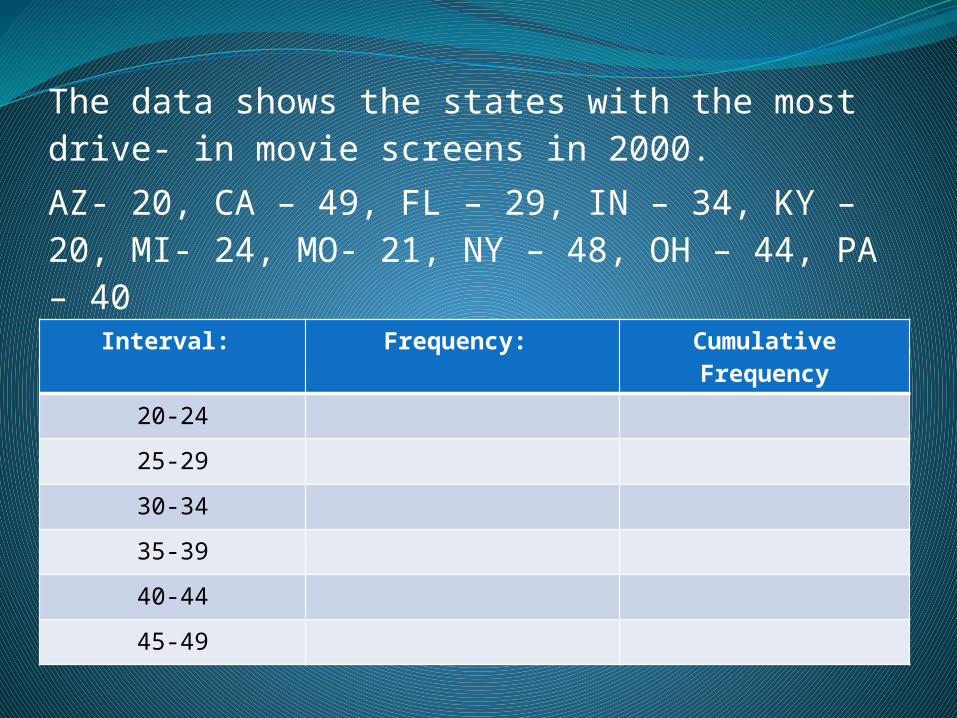
The data shows the states with the most drive- in movie screens in 2000. AZ- 20, CA – 49, FL – 29, IN – 34, KY – 20, MI- 24, MO- 21, NY – 48, OH – 44, PA – 40 ________________________________________
Interval: Frequency:
Cumulative Frequency
20-24
25-29
30-34
35-39
40-44
45-49
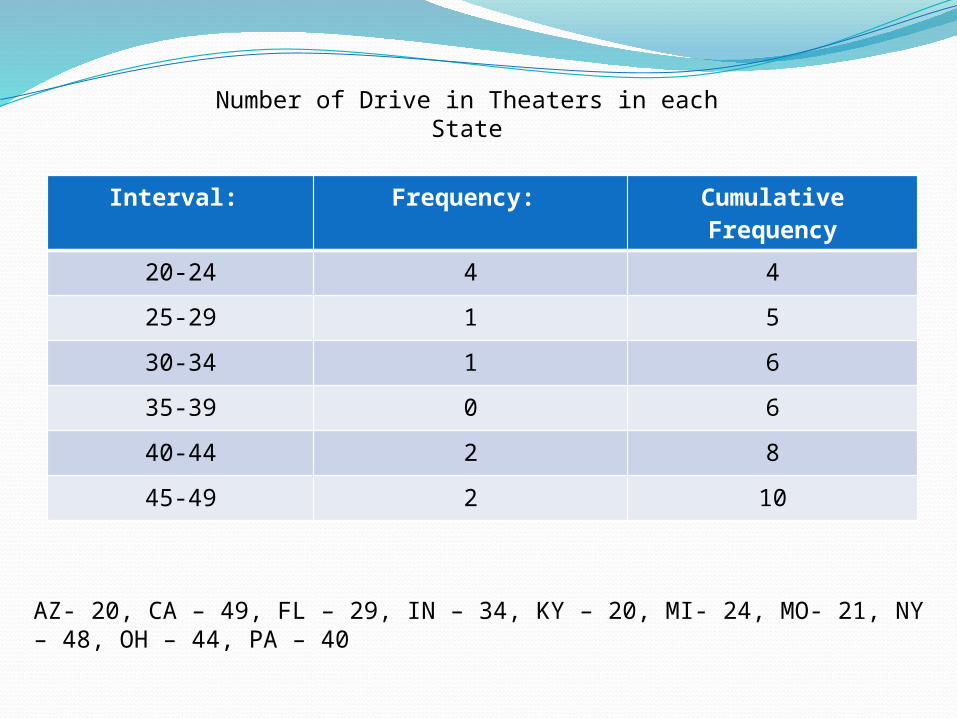
Interval: Frequency:
Cumulative Frequency
20-24 4 4
25-29 1 5
30-34 1 6
35-39 0 6
40-44 2 8
45-49 2 10
AZ- 20, CA – 49, FL – 29, IN – 34, KY – 20, MI- 24, MO- 21, NY – 48, OH – 44, PA – 40
Number of Drive in Theaters in each State

What type of correlation?
As ____ increases, ____ increases.
As the weight loss _____________,
The Calories Eaten ____________.
The Amount of Calories Consumed and Weight Gained
Weight Gained
Amount of Calories
Consumed
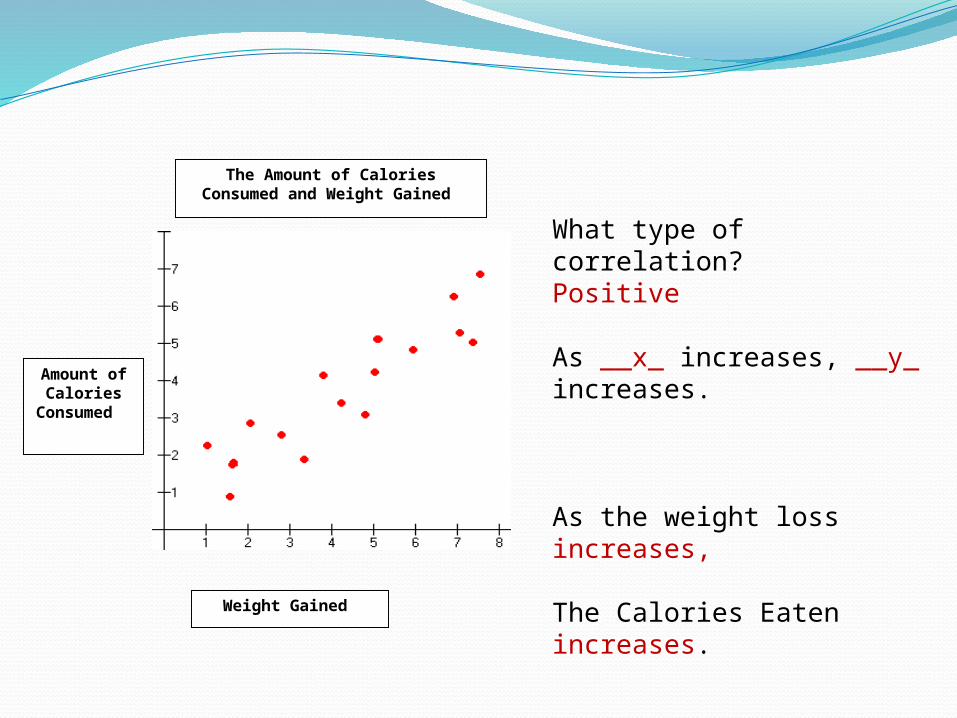
What type of correlation?Positive
As __x_ increases, __y_ increases.
As the weight loss increases,
The Calories Eaten increases.
The Amount of Calories Consumed and Weight Gained
Weight Gained
Amount of Calories
Consumed