Embed Size (px)
Citation preview

Rwanda Handbook of Economic and Social Policy
Editor: Almas Heshmati
January 2018
Volume I
Jönköping International Business School
and University of Rwanda

1
Rwanda Handbook of Economic and Social Policy
Editor: Almas Heshmati
January 2018
Volume I
Jönköping International Business School and University of Rwanda

2

3
Rwanda Handbook of Economic and Social Policy
Editor: Almas Heshmati
Jönköping International Business School, Jönköping University, Jönköping, Sweden
E-mail: [email protected] and
Department of Economics, Sogang University, Seoul, Korea E-mail: [email protected]
January 2018
Volume I

377
Chapter Twelve
Determinants of Livelihood Diversification among
Rwandan Households: The Role of Education, ICT and Urbanization
Aristide Maniriho1 and Pia Nilsson2
1 Corresponding Author,
School of Economics, University of Rwanda, Kigali, Rwanda, Email: [email protected]
2 Jönköping International Business School (JIBS),
Jönköping University, Jönköping, Sweden, Email: [email protected]
Abstract
Rural households in many different contexts have been found to diversify their income sources allowing them to spread their risks and to smoothen consumption. Generating diversified incomes for a majority of the rural poor is an essential component of a successful rural development strategy. This paper identifies the determinants of income diversification among Rwandan households using unique panel data obtained from the Integrated Households Living Conditions Surveys of 2011 and 2014. It applies a binary logit panel model to a representative sample of 3,839 households across Rwanda controlling for latent household specific factors. It also conducts a Hausman test the results of which show that the random effect estimates were more efficient than fixed effect estimates (Chi2=20.73 and Prob>Chi2=0.1891). The results reveal that education, access to ICT and urban areas were among the most important factors that influenced livelihood diversification given that p <0.05. We also found that other measures of household specific factors were important (for example, the age and gender of the household head along with asset endowments). From these results, it is recommended that professional training, internet access through phones and wireless and urbanization should be enhanced so as to enable households to diversify their sources of income and thus improve food security for their family members.
Keywords: Non-farm income, livelihood diversification, random effects logistic regression, Rwanda
JEL Classification Codes: C23; D13; E24; I20; O18;
378
1. Introduction
Agriculture is a well-known and important economic sector in Rwanda. All development strategies in Rwanda recognize agriculture as a leading development sector. Rural households in many different contexts have been found to diversify their income sources allowing them to spread their risks and to smoothen consumption (Ellis, 1998, 2000a, 2000b; Reardon et al., 1992). Generating incomes for a majority of the rural poor is one of the most important reasons that led economists to stress increased agricultural productivity as an essential component of a successful rural development strategy.
In rural areas in developing countries (as also in rich countries) it is common for farmers to work part-time in other activities thereby smoothing out seasonal fluctuations in demand for agricultural labor. This might include market or non-market activities such as bicycle repairs and home construction (Gollin et al., 2012). Further, Barrett et al., (2001) report that income diversification lies at the heart of livelihood strategies in rural Africa.
Appropriate economic policies for pursuing its pace of economic growth and development are of recent interest in Rwanda. Given that non-farm activities have become an important component of livelihood strategies among rural households, farmers in the agriculture sector need to diversify their livelihood sources so as to reach food security for their households. Alternatively, strong interactions between farm and non-farm activities are necessary to leverage rural development. Another problem is the effect of the government’s agricultural policies on poverty alleviation. Policymakers and planners need to know the factors that influence livelihood diversification among rural farmers. It is necessary to state the extent to which rural farmers attempt to cope with risks and uncertainties and achieve food security by adopting off-farm and non-farm activities.
It is expected that the results of this study will be used by decision makers and rural development practitioners when planning for agricultural and rural development. After learning about the main determinants of farmers’ income diversification, this paper will help decision makers know where more efforts are needed to help farmers choose additional economic activities besides on-farm jobs. With regard to researchers and academicians, the results of this study will contribute to knowledge related to agricultural economics in Rwanda.
Further, the results of our study will also help development practitioners and policymakers to learn about which off-farm and non-farm economic activities to pay attention to and the infrastructure that will reduce entry barriers and facilitate easier access to these activities.
The purpose of this study is to analyze the determinants of income diversification among households in Rwanda. It specifically aims to: (1) analyze the effect of education on livelihood diversification, (2) measure the effects of ICT on livelihood diversification, and (3) analyze the effects of the rural urbanization process on livelihood diversification in Rwanda.

379
2. Literature Review
There is vast literature on livelihood diversification, specifically in rural areas in developing countries. Barrett et al., (2001) classified the components of rural household incomes by sector, by function or by space. By sector, they differentiate farm activities from non-farm activities: farm income is gain from production and gathering of unprocessed crops, livestock, fish or forest products from natural resources whereas non-farm income is got from other activities like processing, transport or trading of unprocessed farm, fish and forest products. By function, wage employment is differentiated from self-employment (Fields, 2010): wage employment implies that people sell their labor to employers in exchange for wages or salaries, whereas self-employed people sell their labor to themselves. Finally by space an activity can be classified as local (when it is executed at home) or as migratory (when the activity is away from home).
Abimbola and Oluwakemi (2013) prove that in Africa various studies show that while most rural households are involved in agricultural activities such as livestock, crop or fish production as their main source of livelihood, they also engage in other income generating activities to augment their main source of income. Further, Escobal (2001) highlights that ‘income diversification is the process of switching from low-income crop produce to higher value crops, livestock and non-farm activities.’
This is often necessary in agriculture based peasant economies because of risks such as variability of soil quality, household and crop diseases, price shocks and unpredictable rainfall and other weather related events which lead to low productivity, low output and invariably low income which continually trap people in a vicious cycle of poverty (Awoniyi and Salman, 2011).
According to Ellis (2000a), income diversification is mostly referred to when the range of rural activities outside the farm is expanded and it can be seen as a dynamic adaptation process created through pressures and opportunities. Ellis (1998) also notes that diversification may be deliberate or involuntary and it can be used as a safety net by the rural poor or as a means of accumulation by the rural rich.
The factors underlying the diversification of livelihood sources among rural households are classified into two sets -- push factors and pull factors. Push factors commonly include risks and seasonality (Ellis, 2005). Here diversification is used as a strategy to manage risks due to lack of social insurance and rural poor households use diversification of livelihood sources as a substitute for social insurance (Barrett et al., 2001). Pull factors are opportunities for diversification of income sources (Chamberlin and Jayne, 2012). These factors are associated with factors like commercial agriculture, improved infrastructure, proximity to urban areas and better market access.
An assessment of famers’ income diversification as a factor of food security among small- scale farmers has been of much interest for agricultural researchers. In Ethiopia, Gecho (2016) assessed rural farm households’ income diversification in the Wolaita zone. Primary data was gathered from 300 farm households randomly selected in four districts in the zone. They specified the binary logit model and their results confirmed that sex, farm size, livestock ownership, oxen ownership, education, leadership, annual cash income and market
380
distance were key determinants of farmers’ participation in income diversification. In Nigeria, Adepoju and Oweyole (2014) examined rural livelihood strategies and their effects on income inequalities among households in the Akinyele area of Oyo state. They analyzed primary data collected from 105 respondents selected through a multi-stage random sampling method using descriptive statistics, multinomial logit and the generalized entropy inequality indices. Their findings revealed that age and land ownership had positive effects on farmers’ livelihood strategies whereas household size had negative effects.
In Kenya, Wanyama et al., (2010) analyzed the factors underlying income diversification in maize based farming systems. Their study used primary data collected in 2004 from 1,850 rural households selected through a multi-stage sampling method. They used descriptive statistics, multinomial logit and Tobit models for data analysis. Their study shows that a majority of the farmers grew cash crops that were supplemented with off-farm income generating activities.
Many other researchers have investigated the diversification of farmers’ livelihoods. Birthal et al., (2014) examined farm households’ access to different income-generating activities and their impact on income distribution in India. Their study concluded that agriculture was the dominant source of income but the households earned close to half of their incomes from non-farm activities. Besides, the poor households diversified more towards low-paid, low-return non-farm activities. They identified small landholdings, low agricultural productivity and surplus labor as determinants of farmers’ income diversification even though non-farm income sources were accessible to a small proportion of farm households and had an un-equalizing effect on income distribution.
Beyene and Muche (2010) examined the determinants of household food security among rural households in the Ada Berga district in central Ethiopia. Their study discovered that experience in farming activities, off-farm and non-farm incomes, land and livestock holdings, as well as soil and water conservation practices significantly affected household food security. The results of their study imply that attaining food security in the highlands of Ethiopia required adopting mixed strategies and policies. Mamman et al., (2014) analyzed food security status for livelihood and income diversification in Jigawa state, Nigeria. Eleven livelihood activities including fishing, petty trading, tailoring, carpentry, labor on other farms and agro micro-processing were the major livelihood activities that farming households engaged in to diversify their income sources. The study recommends that farmers should be encouraged to diversify their economic activities to earn more incomes to maintain their food security status so as to be better off.
Ghimire et al., (2014) state that non-farm activities played an important role in determining rural household incomes, consumption expenditure and household food security in Nepal. Using cross-sectional data and a Probit model, their results reveal that household characteristics such as age, gender and education of the household head and family size played a significant role in non-farm work decisions. Households with larger farm sizes were less likely to participate in non-farm work than households with small farms.
Akpan et al., (2016) analyzed poverty and income inequalities and identified the determinants of poverty among rural farm households in Akwa Ibom state, Nigeria. As a

381
result of persistence poverty, there was a sudden upsurge in agricultural livelihood diversification and rural-urban migration resulting in a high rate of urban unemployment. They collected data from 390 rural farm household heads spread across the rural areas of the state. The authors employed a combination of sampling methods to sample cross-sectional data collected from the respondents. The study used descriptive tools and the Tobit regression analysis to analyze the collected information. The income inequality index was 0.4210 for male headed households and 0.4531 for female headed ones. The Tobit model’s estimates revealed that household head’s farming experience, years in a social organization, level of formal education and farm and non-farm incomes were negative drivers of rural poverty in the region, whereas household head’s age, household size, structure of land ownership and gender were positive drivers of poverty among rural farming households.
Awoniyi (2011) examined some of the factors determining the adoption of non-agricultural activities in rural Nigeria. This study concluded that an increase in foreign remittances reduced the incidence, depth and severity of poverty in developing countries. Remittances were considered a source of income which could possibly reduce poverty in the rural sector of the economy. Amanze et al., (2015) analyzed the pattern of income diversification strategies among rural farmers in the Nnewi north local government area in Anambra state. Their study used a multi-stage random sampling technique to select a sample of 90 rural farm households and a pre-tested and well-structured questionnaire to collect data. Descriptive statistics and the binary Tobit likelihood method were used to analyze the data. The results of the Tobit regression analysis showed that the model was well-fit as confirmed by the pseudo R2 of 69 per cent. The sample value of the log likelihood ratio of 45.20 was significant at the 1 per cent level of probability. Constraints on income diversification included high investment costs, low human capital, risk, credit constraints and lack or inadequate expertise.
Prowse (2015) examined the determinants of non-farm income diversification in rural Ethiopia for a four-wave panel of 1,240 households from the Ethiopian Rural Household Survey over the period 1994–2009. The survey makes a conceptual distinction between non-farm and off-farm incomes and uses fixed and random-effects models to control for unobserved characteristics. The results of Prowse’s study show that pull factors were the main determinants of income diversification and reflected a strategy by wealthier households. Ifeanyi-Obi and Matthiews-Njoku (2014) studied socioeconomic determinants of choice of livelihood activities among rural dwellers in southeast Nigeria. The ordinary least squares multiple regression estimates showed that age, years of education and monthly income were the major socioeconomic factors affecting livelihood activities and farming and trading were the main livelihood activities in the study area.
Teshome and Edriss (2013) discuss different factors affecting income diversification and assess patterns of income diversification in the Akaki district in Ethiopia using cross-sectional data from 155 farm households using a structured questionnaire and the Tobit model. Their results indicate that family size, number of extension visits per year and education levels had a positive significant effect on income diversification, whereas age of the household head, land size and average distance from the market had a negative and significant influence on a household’s decision for diversification.

382
Schwarze and Zeller (2005) examined two aspects of income diversification -- diversification as a shift away from agricultural activities and as an increasing mix of income activities -- in the vicinity of the Lore Lindu National Park in Indonesia. They noticed that agricultural activities were the most important source of income for rural households. Using a Tobit model, their results show that access to social capital and crop failures both had a positive impact on the Shannon equitability index, whereas the socioeconomic status and the distance to a road had a negative influence.
Demissie and Legesse (2013) examined the determinants of income diversification among rural households in Ethiopia. Using cross-sectional data and a multinomial logit model, their results show that human capital related variables (gender and age of household head, number of economically active family members, education level of household head and presence of children attending school), livelihood assets (livestock holdings, size of cultivated land), livelihood diversifying strategies (crop based diversification through the number of crops grown and harvested) and infrastructure related variables (proximity to market) influenced participation in non-farm and off-farm employment activities and the level of income in the study area. Idowu et al., (2011) analyzed the determinants of household income diversification and the share of income sources to total household income among rural farm households in southwest Nigeria. They collected data from a random sample of 411 rural farm households selected through a multi-stage sampling technique. They used the Herfindal index and Tobit regressions to analyze the data. Their results indicate that the level of income diversification among rural farm households in southwest Nigeria depicted by the inverse of the Herfindal index was 2.82. Education, experience in any non-farm activity and distance to an urban center were the major determinants of income shares of different sources of non-farm activities while an increase in the size of a household, per capita landholdings and per capita animal wealth significantly increased income diversification of rural farm households. The study recommends providing an enabling environment for enhancing more non-farm self-employed jobs.
Ogbanje et al., (2014) examined off-farm diversification among small-scale farmers in north central Nigeria. They used a multistage sampling technique to select 180 respondents and used the entropy index and multiple regression to analyze the data. Their findings show that the degree of off-farm diversification among small-scale farmers in north central Nigeria was high and that the farmers were neither specialized nor completely diversified. Their results also show that farming as a primary occupation, formal education, off-farm work experience and off-farm work significantly increased the degree of diversification, whereas age, farm size, on-farm work hours, leisure, hours, farm assets’ current value and crop income decreased off-farm diversification. Etim et al., (2009) conducted a study to estimate the determinants of poverty among peri-urban fluted pumpkin producers in Nigeria. Using a two-stage sampling procedure to select a sample of 70 farmers, a questionnaire to collect data and a Tobit regression analysis to estimate the determinants of poverty, their results show that except sex, age and education of household head, all other explanatory variables specified in the model (household size, farming income, farming experience and access to extension services) were significant poverty determinants.

383
Woldernhanna and Oskam (2004) identified the lucrative rural non-farm activities available to farmers in the Tigray region of northern Ethiopia like masonry, carpentry and petty trade. They found that the underlying factors that hindered participation in non-farm activities such as credit constraints and lack of skills may have to be addressed through the provision of credit and technical training for the poor.
Many studies use cross-sectional data while a few also use panel data. Specifically in Rwanda, few researches have been conducted as far as income diversification is concerned. These include Ansoms and McKay’s (2010) study which assesses poverty and livelihood profiles in rural areas and that of Nilsson (2016) whose research targeted rural households and examined their involvement in the non-farm sector and spatial spillovers analyzing data from 2006 and 2009 using a panel econometric analysis to identify the determinants of farm, non-farm and agricultural incomes. Dabalen et al., (2004) analyzed the returns to participation in the nonfarm sector in rural Rwanda and found that this enabled high earnings and that diversified households were less likely to be poor. Households which did not participate in the market had significantly lower consumption levels than households that did.
Whereas some researchers have analyzed the effects of age and education (besides other factors) of the household head on income diversification, our study extends these variables as besides the age of the household head, the ratio of household members aged less than six years, the ratio of household members aged between seven and 16 years and the ratio of household members between 17 and 59 years are included in the analysis. In addition to the education level of the household head, our study also considers the education levels of household members (ratio of household members who have completed different education levels -- primary, secondary, university and professional). In discussing the effects of internet connectivity, our study distinguishes internet access via phones and through wireless and the Local Access Network (LAN).
3. Research Method
3.1 Data sources
The Republic of Rwanda is located in east central Africa. It is the 149th largest country in the world and the fourth smallest in Africa. It is divided into five provinces -- Kigali City, Southern, Western, Northern and Eastern provinces--30 districts and 416 administrative sectors. Administrative sectors are sub-divided into cells which in turn are divided into villages. With a size of 26,338 square kilometers, Rwanda is bordered by the Democratic Republic of the Congo to the west, Uganda to the north, Tanzania to the east and Burundi to the south. It has many hills and mountains at a high altitude where the lowest point is 950 meters above sea level. The population of Rwanda was estimated at 11,689,696 in 2012 with a population density of 415; 83.5 per cent of the population lived in rural areas and 28.6 per cent was headed by females (NISR, 2012). The projected life expectancy at birth is currently 66.6 years. With a labour force participation of 73.6 per cent, a majority of the employed population in Rwanda is self-employed in the agriculture sector (62 per cent), followed by employees (19 per cent). Out of the non-agriculture sectors, those which employ workers
384
are wholesale and retail trade (22 per cent), construction (15 per cent), manufacturing (12 per cent) and households (11 per cent) (NISR, 2012). With the intent of assessing livelihood diversification our study used nationwide data obtained from two surveys of the Integrated Households Living Conditions Survey in Rwanda (EICV, French acronym) during 2011 and 2014 covering 3,839 households.
3.2 Model specification and definitions of study variables
Following Cameron and Trivedi (2005), McManus (2011) and Wooldridge (2013), a binary Probit model was specified and estimated to identify the factors underlying income diversification among households in Rwanda:
(1) jtk
kjtkjt XY
17
10
where, Yjt is the dependent variable (income diversification, yes=1, no=0), Xs are the independent variables, Bs are the coefficients, k the number of independent variables, j represents a household, t is time and v is the stochastic error term. The study variables are described in Table 1.
Insert Table 1 about here.
3.3 Data analysis
The binary logit panel model specified in Equation 1 is estimated using the random-effects binary maximum livelihood (ML) logit technique. The choice of this approach was motivated by the fact that the dependent variable is categorical and the specification captures heterogeneities among respondents and the variables under study when cross-sectional data is analyzed (Wooldridge, 2013) using panel data. The choice of the random effects model was based on the Hausman test (McManus, 2011) whose results showed that the random effects’ estimates were more efficient than fixed effects’ estimates (Chi2=20.73, and Prob>Chi2=0.1891).
4. Determinants of Livelihood Diversification among Households in Rwanda
Following the results from the estimation in Equation 1, it was found that some factors had a positive effect on income diversification, whereas others had a negative effect; some were statistically significant at different significance levels while some others were not. The significant factors that had a positive effect on income diversification were household size, remittances, share of household members who had professional training, access to the internet and the location of the household in an urban area. The age of the household head, female household head, the ownership of the house, the share of household members who were doing primary education, the ratio of household members aged between seven and 16 and the household poverty category had negative effects on income diversification.

385
In different studies, different factors have different effects on livelihood among households. The discussion on the findings of our study also takes into consideration the findings from other studies. The results are summarized in Table 2.
Insert Table 2 about here.
Age of the household head (agehhd): the results of binary random effects panel logit regression show that age had a negative significant effect on livelihood diversification (at a significance level of 1 per cent). This is supported by the results of different studies (see Aababbo and Sawore, 2016; Abimbola and Oluwakemi, 2013; Adepoju and Oyewole, 2014; Agyeman, 2014; Amanze et al., 2015; Fufa, 2015; Ghimire et al., 2014; Lay et al., 2009; Nilsson, 2016; Ogbanje et al., 2014; Teshome and Edriss, 2013). Other authors have found that the age of the household head had a positive effect on livelihood diversification. These include Akpan et al., (2014); Gecho (2016), Irohibe and Agwu (2014); Idowu et al., (2011); Manjur et al., (2014); and Wanyama et al., (2010).
Our study considers all household members. The variables ratio_less6, ratio_btn7_16 and ratio_btn17_59 are used to measure the ratio of household members who are aged less than six years, the ratio of household members who are aged between seven and 16 years and the ratio of household members who are aged between 17 and 59 years respectively. The results of the panel logit regression reveal that ratio_less6 and ratio_btn7_16 had negative effects, whereas ratio_btn17_59 had a positive effect on income diversification. The negative effects of ratio_less6 and ratio_btn7_16 contrast with the findings of Ogbanje et al., (2014) who reported that the number of children in a household was positively correlated with income diversification. As for the positive effects of the ratio_btn17_59, our results are supported by Ogbanje et al., (2014) who show that the number of adult males in a household had a positive effect on income diversification; they also report that the number of adult females had negative effects on income diversification.
Female household head (femalehhd): estimates of binary random effects logistic regression revealed that a female household head was negatively correlated with livelihood diversification. This negative relationship between the gender of the household head and income diversification is supported by the findings of Amanze et al., (2015); Adepoju and Oyewole (2014); Beyene and Muche (2014); Fufa (2015); Gecho (2016); Manjur et al., (2014); Nilsson (2016); Ogbanje et al., (2014); Sarah (2012); Teshome and Edriss (2013). In contrast, some authors report a positive relationship between the gender of the household head and livelihood diversification (Aababbo and Sawore, 2016; Abimbola and Oluwakemi, 2013; Agyeman, 2014; Ghimire et al., 2014; Idowu et al., 2011; Irohibe and Agwu, 2014; Wanyama et al., 2010).
Household size (HHsize): the results of econometric estimations show that household size had positive effects on livelihood diversification among households. Different authors support this relationship (for example, Akpan et al., 2016; Adpoju and Oyewole, 2014; Beyene and Muche, 2010; Ghimire et al., 2014; Idowu et al. 2011; Sarah, 2012; Teshome and Edriss, 2013) whereas some others reveal a negative relationship (see Abimbola and Oluwakemi, 2013; Ahmed, 2012; Amanze et al., 2015; Irohibe and Agwu, 2014; Nilsson, 2016).

386
House size (SizeHouse): this variable measures the number of rooms in a house occupied by the household. The econometric estimates of a binary panel logit model show that house size was positively correlated with livelihood diversification among households in Rwanda.
House occupation of the owner (owner_occup_house): this variable was used for measuring the effects of the house occupancy status (if the house is occupied by the owner) on livelihood diversification. The results show that the owner_occup_house had negative effects on livelihood diversification. These results are supported by Idowu et al., (2011).
Education (share_primary, share_secondary, share_higher, share_higher): whereas this variable measures the formal and/or informal education level of the household head, it is included for all household members in our study. Four variables were used to measure the education levels of household members. The variable share-primary was used to measure the ratio of household members who had completed primary education; share_secondary was used to measure the ratio of household members who had completed secondary education; share_higher was used for measuring the ratio of household members who had completed university studies; and share_other was used for measuring the ratio of household members who had completed education levels other than primary, secondary or university (technical education, professional training, etc.). The estimates of the binary random effects panel logit regression reveal that share_primary, share_higher and share_other were positively correlated with livelihood diversification among households. See Figure 1 and 2. More specifically, the results reveal that professional training was a very important determinant of income diversification and thus a source of food security among households in Rwanda. Different authors in different areas support these results (for example, Aababbo and Sawore, 2016; Agyeman, 2014; Ahmed, 2012; Amanze et al., 2015; Birthal, 2014; Gecho, 2016; Ghimire et al., 2014; Irohibe and Agwu, 2014; Idowu et al., 2011; Lay et al., 2009; Nilsson, 2016; Ogbanje et al., 2014; Wanyama et al., 2010). Some researchers have reported negative effects of education on livelihood diversification (see Adepoju and Oyewole, 2014; Akpan et al., 2014; Beyene and Mucche, 2014; Fufa, 2015; Manjur et al., 2014). Specifically, Abimbola and Oluwakemi (2013) did not include all household members in their analysis but considered different education levels of the household head. They report that secondary education was positively correlated with income diversification, whereas primary and tertiary levels of education were negatively correlated with income diversification among households. Further, Fufa (2015) reported positive effects of non-farm training on income diversification.
Insert Figure 1 about here
Insert Figure 2 about here
Internet connection (internet_phone, internet other): our study measures the effects of internet connections via phones (internet_phone) and internet connections through other connectivity facilities (wireless, LAN) separately. The econometric estimations show that both internet_phone and internet_other had positive effects on livelihood diversification. However, these results are in contrast to those in Akpan et al., (2014).
Urbanization (urban): this variable is a measure of the urbanization process undertaken by the Government of Rwanda through group settlements, modern infrastructure, rural

387
electrification and enhancement of secondary cities other than Kigali (Huye, Muhanga, Musanze, Nyagatare Rubavu and Rusizi), among others. The results of the effects of urbanization reveal that it had positive effects on livelihood diversification. These results are supported by Idowu et al.’s (2011) research.
Poverty status (Poor): we also estimated the effects of poverty status on livelihood diversification. Our results show that poverty status was negatively correlated with income diversification among households in Rwanda. These results are supported by Awoniyi and Salman’s (2011) findings.
Credit (credit): this is a measure of total household credit. The results of an econometric estimation show that credit was positively correlated with income diversification among households in Rwanda. The same results were found by Nilsson (2016), Fufa (2015), Beyene and Muche (2014), Ogbanje et al., (2014), Irohibe and Agwu (2014) and Birthal (2014) when farm credit was considered and Gecho (2016) and Idowu et al., (2011). In contrast, some authors have found a negative correlation between credit and income diversification (see for example, Agyeman, 2014; Ahmed, 2012; Amanze et al., 2015; Ghimire et al., 2014; Sarah, 2012; Teshome and Edriss, 2013). Birthal (2014) also found a negative effect of credit on income diversification when he considered non-farm credit specifically.
At the significance level of 0.05, the results show that the most statistically significant determinants included education, ICT, urban areas and specific characteristics of households (age of the household head, ratio of household members aged below six, ratio of household members aged between seven and 16 and occupation status of the house). Consequently, it was found that: (1) education level, specifically the share of household members who had attended other education such as professional training had a positively strong effect on livelihood diversification, (2) ICT, particularly internet access through mobile phones, was positively correlated with income diversification, and (3) the undertaken rural urbanization process had a significantly positive effect on livelihood diversification in Rwanda.
5. Conclusion and Recommendations
Agriculture is the main source of livelihood among households in Rwanda. In many different contexts, rural households have been obliged to diversify their income sources allowing them to spread their risks and smoothen consumption. Income diversification mostly refers to a situation when the range of rural activities outside the farm is expanded and can be seen as a dynamic adaptation process created through pressures and opportunities.
Theory specifies that factors underlying the diversification of livelihood sources among rural households are classified into two sets -- push factors and pull factors. Push factors commonly include risks and seasonality. In our study diversification was used as a strategy to manage risks due to lack of social insurance when rural poor households substituted social insurance with diversification of livelihood sources. Pull factors are opportunities for diversification of income sources. These factors are associated with commercial agriculture, improved infrastructure, proximity to urban areas and better market access.

388
Our study aimed to analyze the determinants of income diversification among households in Rwanda. It obtained data from two surveys of the Integrated Households Living Conditions Survey in Rwanda (EICV, French acronym) during 2011 and 2014 from 3,839 households for analysis. A binary panel logit model was specified and the maximum likelihood method was used to estimate the coefficients.
Our results show that some factors had positive effects on income diversification, whereas others had negative effects; some were statistically significant at different significance levels while some others were not. The significant factors that had a positive effect on income diversification were household size, the share of household members who had professional training, access to internet connections and the location of a household in an urban area. The age of the household head, female household head, occupying own house, the share of household members with primary education, the ratio of household members aged between seven and 16 and the household poverty category had a negative effect on income diversification. At a significance level of 0.05, the results show that the most significant factors for income diversification included education, access to ICT and urban areas.
Therefore, it is recommended that professional training, internet access through phones and wireless and urbanization should be enhanced so as to enable households to diversify their sources of income and thus improve food security for their family members.
Acknowledgements
The authors are grateful for the financial support from the SIDA-UR Programme (Swedish International Development Cooperation Agency and the University of Rwanda Programme). They would also like to convey their thanks to anonymous referees for their meaningful and constructive comments and suggestions on the paper.
References
Aababbo, Y. E. and A.M. Sawore (2016), Assessing determinant factors of income diversification among rural farm households in Ethiopia: the case of Leemo and Anileemo Districts, Hadiya Zone, South Nation Nationalities People Region. International Journal of Science and Research, 5(12): 100-110.
Abimbola, A. O. and O.A. Oluwakemi (2013), Livelihood diversification and welfare of rural households in Ondo State, Nigeria. Journal of Development and Agricultural Economics, 5(12): 482-489.
Adepoju, A. O. and O.O. Oyewole (2014), Rural livelihood diversification and income inequality in local government area Akinyele, Ibadan, Oyo state, Nigeria. Journal of Agricultural Sciences, 59 (2): 175-186.
Agyeman, B. A. S. (2014), Determinants of income diversification of farm households in Western Region of Ghana. Quarterly Journal of International Agriculture, 53(1): 55-72.

389
Akpan, S. B., E.J. Udoh, and I.V. Patrick (2016), Sustaining Small Scale Farming: Evidence of Poverty and income Disparity among Rural Farming Households in South-South Region of Nigeria. International Electronic Scientific Journal, 9 (14): 9-23.
Amanze, J. O., C.I. Ezeh, and M.O. Okoronkwo (2015), Pattern of Income Diversification Strategies among Rural Farmers in Nnewi North Local Government Area of Anambra State. Journal of Economics and Sustainable Development, 6(5): 109-116.
Ansoms, A. and A. McKay (2010), A quantitative analysis of poverty and livelihood profiles: The case of rural Rwanda. Food Policy 35: 584-598.
Aweyomi, T. T. (2011), Rural Non-Farm Incomes and Poverty Reduction in Nigeria. AERC Research Paper 224. Nairobi: African Economic Research Consortium.
Awoniyi, A. O. and K.K. Salman (2011), Non-farm Income Diversification and Welfare Status of Rural Households in South West Zone of Nigeria. In a conference on Agricultural productivity and food security in Africa, Addis Ababa, November, pp. 1-3.
Barret, C. B., T. Reardon, and P. Webb (2001), Non-agricultural income diversification and household livelihood strategies in rural Africa: concepts, dynamics and policy implications. Food Policy, 26(4): 315-331.
Beyene, F. and M. Muche (2010). Determinants of food security among rural households of central Ethiopia: An empirical analysis. Q. J. Int. Agric., 49, 299-318.
Birthal, P. S., D.S. Negia, A.K. Jhab, and D. Singh (2014), Income Sources of Farm Households in India: Determinants, Distributional Consequences and Policy Implications. Agricultural Economics Research Review, 27 (1): 37-48.
Cameron, A. C. and P.K. Trivedi (2005), Microeconometrics: Methods and Applications. Cambridge: Cambridge University Press.
Chamberlin, J., T.S. Jayne, and D. Headey (2014). Scarcity amid Abundance? Reassessing the potential for cropland expansion in Africa, Food Policy, 48 (2014), 10.1016/j.foodpol.2014.05.002
Dabalen, A., S. Paternestro, and G. Pierre (2004), The returns to participation in the nonfarm sector in rural Rwanda. World Bank Research Working Papers, 1(1): 1-33.
Demissie, A. and B. Legesse (2013), Determinants of income diversification among rural households: The case of smallholder farmers in Fedis district, Eastern hararghe zone, Ethiopia. Journal of Development and Agricultural Economics, 5(3): 120-128.
Ellis, F. (1998), Household strategies and rural livelihood diversification. Journal of Development Studies, 35(1): 1–38.
Ellis, F. (2000a), Rural livelihoods and diversity in developing countries. Oxford: Oxford University Press.
Ellis, F. (2000b), The determinants of rural livelihood diversification in developing countries. Journal of Agricultural Economics, 51 (2): 282-302.

390
Ellis, F. (2005), Small-farms, livelihood diversification and rural-urban transitions: strategic issues in Sub-Saharan Africa. A paper prepared for the Research Workshop on ‘The Future of Small Farms.’ Withersdane Conference Centre, Wye, Kent, UK, 26-29 June.
Escobal, J. (2001), Determination of Non-farm income diversification in rural Peru. World Development, 29 (3): 497-508.
Etim, N. A., G.E. Edet, and B.B. Esu (2009), Determinants of poverty among peri-urban Telferia Occidentalis farmers in Uyo, Nigeria. J. Agric. Soc. Sci., 5: 49–51.
Fields, G. S. (2010), Labour market analysis for developing countries. Available at http://digitalcommons.ilr.cornell.edu/workingpapers/157/ (Accessed on 17 September 2016.
Fufa, M. (2015), Factors responsible for income diversification among rural households in Agafa District, Bale Zone, Oromia National Regional State, Ethiopia. MSc thesis, Department of Rural Development and Agricultural Extension, School of Graduate Studies, Haramaya University, Haramaya, Ethiopia.
Gecho, Y. (2016), Rural Farm Households’ Income Diversification: The Case of Wolaita Zone, Southern Ethiopia. International Journal of Sustainable Development Research, 2 (2): 6-17.
Ghimire, R. W.-C. Huang and R.B. Shrestha (2014). Factors affecting nonfarm income diversification among rural farm households in central Nepal. International Journal of Agricultural Management and Development, 4 (2), 123-132.
Gollin, D., D. Lagakos, and M.E. Waugh (2012), The Agricultural Productivity Gap in Developing Countries. Accessed on July 30, 2017 at: file:///C:/Users/Heshmati/Downloads/TheAgriculturalProductivityGapInDev_preview.pdf
Idowu, A. O., J.O.J. Aihonsu, O.O. Olubanjo, and A.M. Shittu (2011), Determinants of income diversification amongst rural farm households in Southwest Nigeria. Economics and Finance Review, 1(5): 31-43.
Ifeanyi-Obi, C. C. and E.C. Matthews-Njoku (2014), Socio-Economic Factors Affecting Choice Of Livelihood Activities Among Rural Dwellers In Southeast Nigeria. IOSR Journal of Agriculture and Veterinary Science, 7 (4): 52-56.
Irohibe, I. J. and A.E. Agwu (2014), Assessment of food security situation among farming households in rural areas of Kano State, Nigeria. Journal of Central European Agriculture, 15(1): 94-107.
Lay, J., U. Narlock, and T.O. Mahmoud (2009), Shocks, structure change, and the patterns of income diversification in Burkina Faso. African Development Review, 21(1): 36-58.
Mamman, B.Y., A. H.I Wudi, and M. Halliru (2014), Socioeconomic Factors and Income Diversification Affecting Food Security Status of Farming Households in Jigawa

391
State, Nigeria. Proceedings of the 1st International Conference on Drylands, Kano, 8-12 December.
Manjur, K., H. Amare, G.H. Mariam, and L. Tekle (2014), Livelihood diversification strategies among men and women rural households: evidence from two watersheds of Northern Ethiopia. Journal of Agricultural Economics and Development, 3(2): 17-25.
McManus, P. A. (2011), Introduction to Regression Models for Panel Data Analysis. Indiana University, Workshop in Methods, 7 October.
Nilsson, P. (2016), Spatial spillovers and households involvement in the nonfarm sector: evidence from rural Rwanda. Eastern Research Paper in Economics and Finance EARP-EF No. 2016:05. Jönköping International Business School (JIBS).
National Institute of Statistics of Rwanda (NISR), Ministry of Finance and Economic Planning (MINECOFIN) Rwanda (2012), Rwanda Fourth Population and Housing Census. Thematic Report: Labour force participation.
Ogbanje, C. E., A.N.D. Sonny, S. A. N. D. Chidebelu, and N. J. Nweze (2014), Off-Farm Diversification among Small-Scale Farmers in North Central Nigeria. Journal of Economics and Sustainable Development, 5(13): 136-144.
Prowse, M. (2015), The Determinants of Non-Farm Income Diversification in Rural Ethiopia. Journal of Poverty Alleviation and International Development, 6(1): 109-130.
Reardon, T., C. Delgado, and P. Matlon (1992), Determinants and effects of income diversification amongst farm households in Burkina Faso. The Journal of Development Studies, 28(2): 264-296.
Sarah, A. (2012), Determinants of Rural Household Income Diversification in Senegal and Kenya. Sweden: Lund University.
Schwarze, S. and M. Zeller (2005), Income diversification of rural households in Central Sulawesi, Indonesia. Quarterly Journal of International Agriculture, 44(1): 61-73.
Teshome, B. and A.K. Edriss (2013), Determinants and Patterns of Income Diversification among Smallholder Farmers in Akaki District, Ethiopia. Journal of Research in Economics and International Finance (JREIF), 2(4): 68-78.
Wanyama, M., L.O. Mose, M. Odendo, J.O. Okuro, G. Owuor, and L. Mohammed (2010), Determinants of income diversification strategies amongst rural households in maize based farming systems of Kenya. African Journal of Food Science, 4(12): 754-763.
Woldenhanna, T. and A. Oskam (2001), Income diversification and entry barriers: evidence from the Tigray region of northern Ethiopia. Food Policy, 26(4) : 351-365.
Wooldridge, J. M. (2013), Introductory Econometrics: A Modern Approach (5th ed.). South-Western: Cengage Learning.

392
Table 1: Definitions, measurement and summary statistics of study variables Variables Definition Mean (Std.
Dev.) 2010 Mean (Std. Dev.) 2014
Nonfarm_logit Income sources (Diversification=1; Otherwise=0)
0.1736705 (0.2812472)
0.1959421 (0.1959421)
agehh Age of the HH Head (years) 44.2974 (15.72515)
44.73945 (15.96274)
femalehhd Sex of the household head (Female = 1 Male = 0)
0.2765625 (0.4474147)
0.2652423 (0.4415772)
HHsize Mean household size 4.786979 (2.246168)
4.621157 (2.221515)
SizeHouse Number of rooms of the house occupied by HH 3.807292 (1.385306)
3.594059 (1.278435)
owner_occup_house
Occupancy status (by the owner=1, otherwise=0)
0.8057292 (0.3957414)
0.7576863 (0.4285948)
share_primary Share of HH members who completed primary 0.0127491 (0.0603102)
0.1754168 (0.220211)
share_secondary
Share of HH members who completed secondary
0.017219 (0.0709232)
0.0535875 (0.1386137)
share_higher Share of HH members who completed higher edu
0.0001042 (0.0045644)
0.0111295 (0.0718008)
share_other Share of HH members who completed other edu 0.0133399 (0.0646364)
0.0578534 (0.1600854)
ratio_less6 Share of HH members aged less than 6 0.1954119 (0.1783858)
0.171721 (0.1809986)
ratio_btn7_16 Share of HH members between 7 and 16 years 0.2136411 (0.2038594)
0.2094548 (0.2073315)
ratio_btn17_59
Share of HH members between 17 and 59 years 0.5232459 (0.2448195)
0.5486774 (0.25384)
internet_phone
HH has internet access through mobile 0.05000 (0.2180017)
0.1130797 (0.3167728)
internet_other HH has internet access through LAN, wireless 0.0145833 (0.1199089)
0.0328296 (0.1782368)
credit Total credit of the household in FRW 292686.8 (3754966)
324832.1 (2421470)
Poor Poverty status (Poor=1, Otherwise=0) 0.1864583 (0.3895776)
0.1083898 (0.3109531)
urban Urbanization (Urban=1, Otherwise=0) 0.3053674 (0.3053674)
0.2813966 (0.4497977)
Source: Authors’ calculations from EICV 3 and 4 data.

393
Table 2: Random Effects Logistic Regression estimates and Random Effects ML regression estimates of livelihood diversification
Variables Random effects logistic regression estimates
Random Effects ML regression estimates
agehhd -0.0203029*** -0.0015751***
femalehhd -0.2179306 -0.0432825*** lnHHsize -0.7560621*** -0.0954197*** lnSizeHouse 0.2040365 -0.0109612 owner_occup_house -0.8892044*** -0.1217525*** share_primary 0.1409671 0.0201557 share_secondary -1.163167*** -0.128185*** share_higher 1.082503 0.3082335*** share_other 1.807745*** 0.346362*** ratio_less6 -3.147527*** -0.262995*** ratio_btn7_16 -2.984682*** 0.1672226*** ratio_btn17_59 0.4700391 0.1251007***
internet_phone 0.40818080** 0.0611698*** internet_other 0.4450081 0.0977653*** loan access 6.79e-08*** 7.51e-09*** Poverty status -0.1883487 0.0088813 urban 1.007354*** 0.0867764***
Constant 0.3183861 0.4278653*** /lnsg2u -1.44147 Wald Chi2(18) / LR Chi2(18) 343.75 1480.56 Prob (> Chi2) 0.0000 0.0000 sigma_u 0.4863947 0.553636 rho 0.0670873 0.2838152 Observations 3839 3839
Note: *** significant at 1%; **: significant at 5%; and * significant at 10%. Source: Authors’ estimations from EICV 3 and 4 data.

394
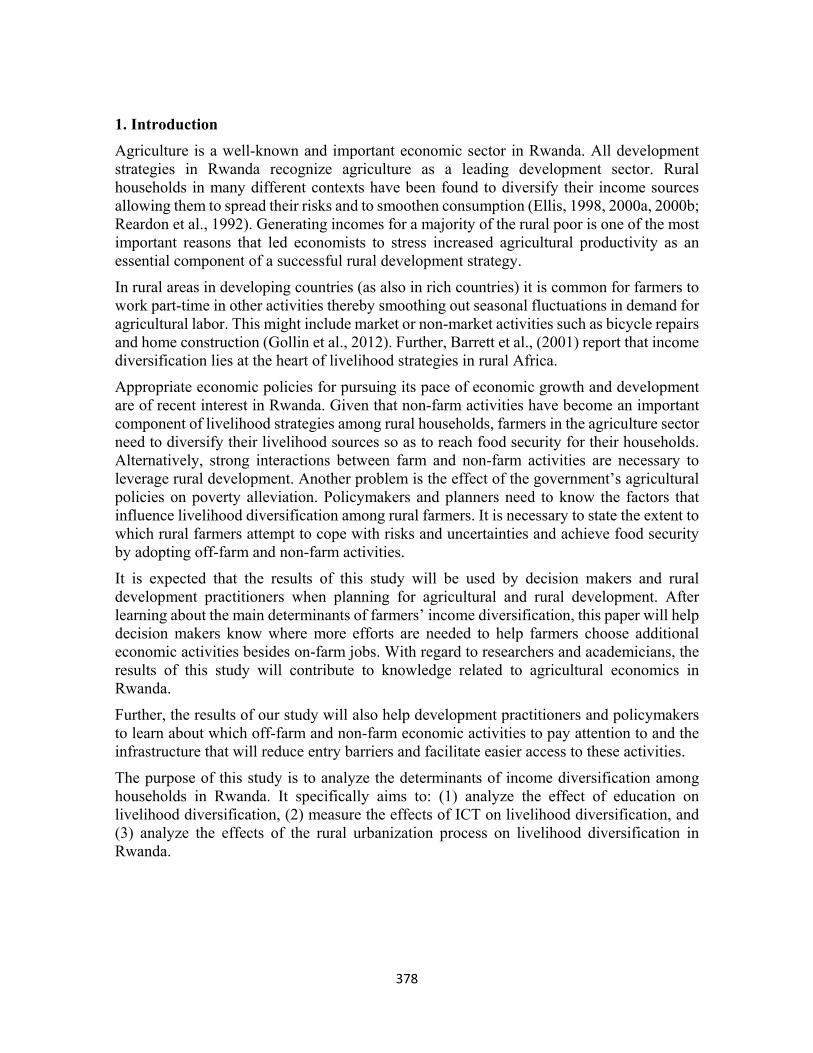
Figure 1. Differences in the level of non-farm income calculated at the district level (measured in quintiles) Note: The darker shaded districts are those that experienced growth in non-farm income over the period 2010 to 2014 while the lighter ones experienced a decrease. Source: Authors’ estimations based on EICV3 and EICV4 survey data.

395
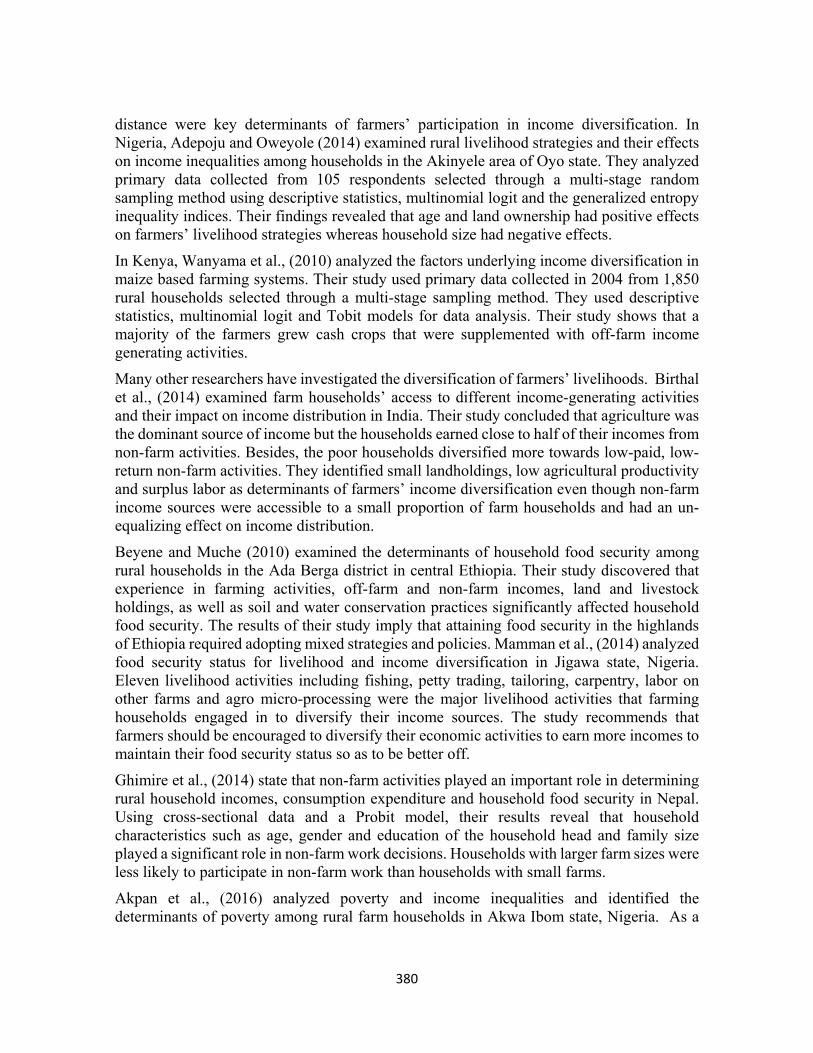
Figure 2. Differences in the share of non-farm income calculated at the district level (measured in quintiles) Note: The darker shaded districts are those that experienced growth in the share of non-farm income over the period 2010 to 2014 and the lighter shaded are those that experienced a decrease. Source: Authors’ estimations based on EICV3 and EICV4 survey data.