Embed Size (px)
Citation preview
RUSSIA > EQUITY RESEARCH > INFRASTRUCTURE
JULY 15, 2014
1
Copyright © 2003-2014. Gazprombank (Open Joint-Stock Company)
Research Department
INDUSTRY REPORT Mikhail Ganelin
+7 (495) 983 18 00 (ext. 5 45 83)
Sergey Vasin +7 (495) 983 18 00 (ext. 5 45 08)
Russian infrastructure A big ship sails far
The expansion of infrastructure is an imperative for the long-term
economic growth of any country, but securing sources of funding remains
a complex challenge. In this report, we analyze key global infrastructure
expansion trends as well as ways and means to fund infrastructure rollout
projects in various countries. Our main focus is on Russian
transportation, which accounts for 80% of all infrastructure investment in
the country.
Assuming that the global economy grows at 3.3% per year, GDP will
double by 2035. The main contributors to growth include a rise in the global
population (+20% by 2035) and urbanization (the urban population is expected
to increase by 40%), while rapid growth of household income will lead to
accelerated growth of international trade and tourism. Under this scenario,
global air passenger traffic will double as soon as 2020, air freight will triple, and
container shipments will quadruple. In addition, the throughput capacity of most
existing transport channels between Asia and Europe is capable of raising
cargo turnover on average by another 50%. This increment would clearly be
insufficient in case of faster than expected expansion in the coming decades.
The minimum need for infrastructure investment to support economic
growth is 3.5% of GDP, or $57 trln until 2030 ($3.2 trln per year). However,
there is a 20-40% shortfall in infrastructure funding in most countries. State
investments in infrastructure total about 65%, but their ability to ramp up funding
will be limited going forward due to high debt and budget deficits. The role of
private investors, who contribute 35% of infrastructure investment, is
conspicuously on the rise. The governments of various countries are working
out incentives for investors in an effort to strike a reasonable balance between
risk and rewards from infrastructure projects.
In Russia, the rate of infrastructure investment averages 3.6-4.2% of GDP,
or roughly in line with the global average. By 2020, infrastructure investment
will reach $650 bln ($90 bln per year on average). These funds will suffice for
moderate expansion of infrastructure and gradual improvement of its quality, but
not in the event of accelerated expansion. Large projects, such as construction
of infrastructure for the Sochi Winter Olympic Games, will give way to other no
less massive projects, such as construction of the Power of Siberia and South
Stream pipelines, expansion of the Baikal-Amur Mainline and Trans-Siberian
railways, construction of toll roads under concession terms, and the possibility
of deploying the Moscow-Kazan High-Speed Railway with the participation of
private investors. According to our estimates, $25-40 bln of private investments
will be needed until 2020. The bulk of transport infrastructure investment will be
directed to road construction (45%), while rail transport will take 20% (including
the Moscow-Kazan High-Speed Railway and subway facilities), pipeline
transport should account for 30%, while ports and airports will comprise the
remaining 5%.

RUSSIA > EQUITY RESEARCH > INFRASTRUCTURE
JULY 15, 2014
2
CONTENTS
Expansion of global infrastructure: exponential investment growth on the way ......................... 3
World poised for higher infrastructure demand ............................................................................................................................................ 4
Infrastructure investment needs seen at least 60% higher by 2030 .................................................................................................... 5
Sources of infrastructure funding — will resources suffice? .................................................................................................................... 6
Special infrastructure bourse could be established in Japan .................................................................................................................... 8
Examples of investment tools used in various countries for infrastructure projects .................................................................. 11
Current status of Russia’s infrastructure needs ..................................................................................... 18
Russia’s transport infrastructure: rapid growth or concurrent expansion? .................................................................................... 20
Plan of development for transport infrastructure until 2020 ................................................................................................................ 22
How will Russian infrastructure be funded and where will the resources come from? ............................................................. 25
Moscow — largest investor in transport infrastructure ........................................................................................................................... 25
Russian roads: fighting ‘disaster’ brings noticeable results .................................................................................................................... 28
Avtodor: road concessions promise high yields ........................................................................................................................................... 31
Glavnaya Doroga Consortium: first completed PPP project in the road construction field ...................................................... 34
Key market players: competition tightens after the Olympics ............................................................................................................... 35
Railway infrastructure: removing bottlenecks and building high-speed lines ............................................................................... 35
Higher investment in railway infrastructure is unavoidable .................................................................................................................. 37
Airports: a tasty morsel for investors ................................................................................................................................................................ 40
Seaports: state and business working in tandem ......................................................................................................................................... 44
Public-private ventures for the expansion of port infrastructure ........................................................................................................ 45
Pipeline infrastructure: Russia’s raw material artery ................................................................................................................................ 46
Other infrastructure segments ..................................................................................................................... 48
Power grid complex ................................................................................................................................................................................................... 48
Telecommunications ................................................................................................................................................................................................. 49
Public utilities ............................................................................................................................................................................................................... 50
Appendix ............................................................................................................................................................... 51
Largest construction companies in Russia: main players and trends ................................................................................................. 51

RUSSIA > EQUITY RESEARCH > INFRASTRUCTURE
JULY 15, 2014
3
EXPANSION OF GLOBAL INFRASTRUCTURE: EXPONENTIAL INVESTMENT GROWTH ON THE WAY
According to OECD forecasts, global GDP is set to grow at an annual pace of
3.3% per year and double by 2035, amounting to $145 trln. China will overtake the
US within the next few years in terms of GDP, calculated as purchasing power parity
(PPP), and become the world’s largest economy, with GDP surging 2.5-fold by 2030
compared to 2013. The GDP of India, the world’s third-largest economy, will triple by
2030 in terms of PPP, while Russia’s GDP will double during this period, moving from
sixth to fifth place among the world’s biggest economies. By comparison, the US
economy is expected to increase by just 40% over this period, while Europe will
expand by 30%. The main factors underpinning growth will be a rise in the population
(+19% by 2030) to 8.3 bln, urbanization (the urban population is set increase by 40%
by 2030; while its proportion will grow from 52% to 58%), faster growth of household
income, as well as further expansion of international trade and tourism.
Given the above pace of growth, the load on infrastructure in most countries is
set to grow exponentially over the next decade, and its timely development will
become the hallmark of steady growth of the global economy. According to
estimates by OECD experts, if global GDP doubles by 2035, the volume of passenger
traffic during the same period will increase by 2.5-fold, air freight will triple, and
container shipments will quadruple. Meanwhile, the throughput capacity of existing
transport channels between Asia and Europe could push up cargo turnover by 50% on
average, while the effect would wear off within 6-8 years. Given that the design,
construction and expansion of large infrastructure facilities will take years, decisions
concerning the ways and means to finance them should be made in the near future.
Size of GDP vs. country’s position in PPP ranking, $ trln Global GDP growth vs. transport sector indicators
Source: PWC, IMF Source: OECD
1
2
3 4 5 6 7
2
1
3
4 7
5 6
0
5
10
15
20
25
30
35
US CHINA INDIA JAPAN GERMANY RUSSIA BRAZIL
2013 2030
0
100
200
300
400
500
2010 2012 2014 2016 2018 2020 2022 2024 2026 2028 2030
GLOBAL GDP PASSENGER TURNOVER CARGO TURNOVER CONTAINER CARGO TURNOVER

RUSSIA > EQUITY RESEARCH > INFRASTRUCTURE
JULY 15, 2014
4
Population growth will be accompanied be an increasing share of urban population, bln people
GDP per capita growth
Source: United Nations Source: US Department of Agriculture
Increasing infrastructure investments — a tested and tried way to stimulate
economic growth. Higher infrastructure investments create new jobs in the short term,
stimulate economic growth in the medium term, and lower the transport costs of
companies while improving the standard of living of households in the long term.
According to estimates by McKinsey, an additional 1% of GDP investment in infrastructure
will create 3.4 mln new jobs in India, 1.5 mln in the US and 1.3 mln in Brazil. Given the
similarity of economic indicators between Brazil and Russia, the number of jobs that would
be created in Russia would also match, i.e. 1.7% of the entire economically active
population of the country. According to estimates by the Economy Ministry, aggregate
investment in Russia’s transportation infrastructure yields about 0.3% of GDP growth. In
addition, a 10% decline in aggregate transportation costs for all types of goods would add
0.12% to GDP, according to estimates by the Center for Strategic Research. Furthermore,
high-quality transportation infrastructure raises the mobility of households, who would be
capable of moving with greater ease between areas of cities and regions, for a number of
reasons, including the search for employment. This would improve the structure of the
labor market, lead to overall growth in household income and ultimately stimulate demand,
which is one of the key factors of economic expansion.
World poised for higher infrastructure demand
The biggest passenger plane in the world, the Airbus 380, which is capable of flying
over 800 passengers, executed its maiden voyage in 2007. This was the response of
the European aircraft corporation to conspicuous growth in demand in the field of air
transport and tourism.
In 2012, China commissioned the largest hydroelectric generation facility in the world,
Three Gorges on the Yangtze River with capacity of 22.5 GW, which is 1.5 times
more than the previous world leader, Brazil’s Itaipu hydroelectric power plant. Total
investments exceeded $26 bln. When the facility was under design, the HPP was
expected to provide 10% of China’s power needs. However, during the 20 years it
took to build the plant, power consumption rose at a mind-boggling pace, and the
HPP is currently capable of generating less than 2% of the country’s power.
By 2017, the largest airport in the world, with a six-runway hub, will be built in Istanbul.
The facility will be capable of handling a passenger flow of 150 mln (by comparison, the
biggest airport in the world, currently located in Atlanta, is capable of handling 90 mln
passengers per year). Turkish authorities are convinced that the new airport will become a
major hub connecting East and West, Africa and Europe. The total amount of investments
in the project, to be implemented on concession terms, is about $30 bln.
3.3 3.3 3.3 3.4 3.4 3.4 3.3
3.2 3.6 3.6 3.9 4.3 4.6 5.0
0.0
1.0
2.0
3.0
4.0
5.0
6.0
7.0
8.0
9.0
2000 2005 2010 2015 2020 2025 2030
RURAL URBAN
0
50
100
150
200
250
300
2014
2015
2016
2017
2018
2019
2020
2021
2022
2023
2024
2025
2026
2027
2028
2029
2030
WORLD US BRAZIL EUROPE
RUSSIA CHINA INDIA TURKEY

RUSSIA > EQUITY RESEARCH > INFRASTRUCTURE
JULY 15, 2014
5
The 684 km Moscow-St. Petersburg Toll Road, with a maximum speed limit of 150 km
per hour, is to be built by 2018. The total cost of the road is $10 bln, to be funded
through concession agreements with private investors. The need for such a highway
has arisen due to a significant increase in freight turnover between the country’s two
largest cities.
The Nicaragua Canal could be built by 2019 between the Caribbean Sea and the
Pacific Ocean, with the facility routed through the territory of Nicaragua. It aims to
provide an alternative to the Panama Canal, the throughput of which has reached
maximum capacity. In 2013, the government of Nicaragua outsourced the
concession project to Hong Kong-based HKND Group for 50 years. Construction of
the canal is expected to get under way around end 2014. The cost of the project is
roughly $40 bln, and aside from the canal, the plan is to build two seaports, an
airport and an oil pipeline.
Infrastructure investment needs seen at least 60% higher by 2030
According to estimates by McKinsey Global Institute, the minimum need for
infrastructure investments stands at $57-67 trln from 2013 through 2030
(averaging $3.4 trln per year). This estimate is based on the historical volume of
investments in infrastructure over the past 18 years at 3.5-3.8% of GDP. However,
these forecasts fail to take into account faster than anticipated growth of household
income and accelerated development of infrastructure in countries where infrastructure
is traditionally underfinanced (for example, in Brazil and Russia). Taking into account
these factors, infrastructure needs could easily exceed 5% of global GDP ($80 trln),
meaning that investment would essentially double compared to the previous period.
In the opinion of McKinsey, the aggregate stock of infrastructure assets should
amount to an average 70% of GDP in order for it to be maintained in proper
condition. The countries where this percentage is lower (e.g. Brazil, Russia, India and
even the US) should ramp up infrastructure investments at a rapid pace, while those
above that baseline (Japan, China and Germany) have the opportunity to reduce the
volume of investments in the coming years.
Estimated value of infrastructure assets in various countries as a % of GDP, 2012
Investments in infrastructure in various countries: % of GDP (1992-2011) and investment need until 2030
Source: McKinsey Source: McKinsey
16%
57%
58%
61%
64%
71%
76%
179%
0% 50% 100% 150% 200%
BRAZIL
UK
INDIA
RUSSIA
US
GERMANY
CHINA
JAPAN
6.9%
6.4%
4.9%
4.0%
3.6%
3.1%
2.6%
4.7%
8.5%
1.5%
3.4%
2.6%
2.6%
5.0%
0% 2% 4% 6% 8% 10%
INDIA
CHINA
BRAZIL
RUSSIA
US
EU
JAPAN
1992-2011 2013-2030

RUSSIA > EQUITY RESEARCH > INFRASTRUCTURE
JULY 15, 2014
6
In Russia, the stock of infrastructure assets relative to GDP (61%), while less than
the recommended GDP threshold, is still roughly in line with the baseline asset-
to-GDP ratio of 70%, but is quite close to such countries as the US (64%) and the
UK (57%). This is due to the fact that all types of infrastructure are to be found in
Russia: highways and railroads, airports, ports, pipelines, power grids (including
nuclear), and water supply. Notably, there are not very many countries in the world
possessing such diversified infrastructure. A case in point is Brazil, which has excellent
highways but hardly any railroads, while many countries have no nuclear power and
only a few have such a developed pipeline system. A number of problems in the US, the
UK and many other developed nations are due to extensive infrastructure depreciation,
as many facilities were built around the middle of the 20th century and therefore are in
need of modernization.
Global breakdown of investments in infrastructure
Source: World Bank
Sources of infrastructure funding — will resources suffice?
There will not be enough funds for full-fledged infrastructure development in all
countries around the world. According to various estimates, the lack of funding in a
number of countries reaches 20-40% of their needs. Thus, worldwide infrastructure
investment in 2014 should amount to about $2.6 trln (3.6% of global GDP), whereas we
assume that no more than $2.1 trln will actually be invested.
Investments in infrastructure broken down by regions
Source: Gazprombank estimates
29%
8%
1%
4% 21%
20%
17%
MOTORWAYS
RAILROADS
SEAPORTS
AIRPORTS
ENERGY
WATER SUPPLY
TELECOMMUNICATIONS
42%
19%
7%
13%
15%
17%
3%
5%
5%
12%
2% 2%
CHINA
JAPAN
INDIA
NORTH AMERICA
EUROPE
RUSSIA
NEAR EAST
LATIN AMERICA
OTHER ASIA
AFRICA
AUSTRALIA AND OCEANIA

RUSSIA > EQUITY RESEARCH > INFRASTRUCTURE
JULY 15, 2014
7
Breakdown of infrastructure investments by sources of funding
FUNDING SOURCES AMOUNT OF INVESTMENTS IN 2014, $ BLN SHARE
State budgets and funds 1,350 65.4%
Bank loans 160 7.7%
Loans extended by international financial organizations 25 1.2%
Share capital of infrastructure companies 40 1.9%
Own funds of infrastructure companies 125 6.0%
Corporate bonds 365 17.7%
Total 2,060 100%
Source: Gazprombank estimates
The key onus for infrastructure investment falls to the government, which
accounts for over 65%. First of all, this is due to the fact that a significant part of
infrastructure performs a social function and does not involve generation of revenue (for
example, the construction of city roads or water supply systems), and for this reason
such projects are of no interest to private investors. In the second place, many
infrastructure facilities are still unable to generate high enough returns to interest private
investors, so for this reason the state is forced to step in (for example, building airport
runways, port dredging operations, or construction of railroads with low freight-traffic
density). According to our estimates, budget-funded infrastructure will amount to some
$1.4 trln in 2014, and it will be traditionally sourced from tax receipts, excise duties or
sovereign wealth funds. That said, we do not expect to see any substantial increase in
budget spending on infrastructure in the coming years, since debt and budget deficits
are forcing governments to curb spending, including infrastructure outlays.
State debt to GDP ratio, %, 2012
Source: IMF
Private investments as equity and debt financing account for about 35% of all
infrastructure investment. In 2014, the volume of private investment in
infrastructure will amount to about $700 bln, of which 30% ($164 bln) will be raised
from infrastructure company profit and equity placements from these companies
among portfolio investors, while the other 70% comes from bond issues and bank
loans, including those issued by international financial institutions, such as the
World Bank, EBRD, Asian Development Bank, etc.
0 50 100 150 200 250
RUSSIA
CHILE
CHINA
TURKEY
THAILAND
INDIA
BRAZIL
SPAIN
CANADA
FRANCE
UK
US
ITALY
GREECE
JAPAN

RUSSIA > EQUITY RESEARCH > INFRASTRUCTURE
JULY 15, 2014
8
Equity financing. Equity financing accounts for less than 2% of aggregate
infrastructure investment, although investors’ interest in infrastructure projects is
growing from year to year. The number of ad hoc infrastructure funds investing in
the shares of infrastructure companies has risen in recent years from zero to over
700. While in 2004, infrastructure funds took in about $2.4 bln, this figure shot up to
$40 bln by 2013. The return on investment in infrastructure facilities by such funds
falls within the range of 10-16%, according to data from Pregin research agency.
Special infrastructure bourse could be established in Japan
Japan Exchange Group, which runs the Tokyo Stock Exchange, intends to set up a
new stock exchange as part of the Tokyo exchange that would specialize in
infrastructure investment. This bourse should be up and running by 2015. The
securities of infrastructure companies and funds are expected to be listed on this
venue. Infrastructure funds are often closed, raising money mainly from a limited
number of institutional investors. By listing on the new market, they will be able to
raise money from a larger pool of investors, including individuals, who are likely to
treat them as an alternative to real estate investment trusts.
The idea of setting up this bourse is regarded as a major challenge given the
Japanese government’s goal of reducing infrastructure spending. Japanese
airports (Kansai International Airport and Sendai Airport) have already shown
interest in this exchange. Moreover, a large number of projects aimed at deploying
alternative sources of energy are being worked out in Japan. These projects
require private investments and it would be extremely important for them to see this
infrastructure bourse get off the ground. It should also not be ruled out that
companies and funds from neighboring Asian countries would also be interested in
making placements on this bourse.
Breakdown by types of investment funds Volume of funds attracted by infrastructure funds, $ bln
Source: Preqin Source Preqin
Bank loans. According to Infrastructure Journal, bank loans account for nearly
$160 bln per annum. The annual dynamic of loan facilities provision to
infrastructure companies is hard to track, though commercial banks have recently
been reluctant to provide loans for projects with long payback periods. After the
2008 financial crisis, the average cost of borrowing for infrastructure objects,
especially those based in emerging countries, grew 1-2 pps. The requirement
regarding the borrowed to own funds ratio rose to 70:30 vs. a pre-crisis 90:10 in
order to mitigate lending risks. This caused an increase of the weighted-average
cost of capital for an infrastructure project. We do not rule out that the cost of
borrowing will continue to grow further due to an increasing number of riskier
infrastructure startups in emerging countries.
2%
43%
42%
13%
INFRASTRUCTURE FUNDS DIRECT INVESTMENT FUNDS
HEDGE FUNDS REAL ESTATE FUND
2.4 5.2
17.9
34.3
24.7
10.7
32
24.3
29.7
40.7
0
5
10
15
20
25
30
35
40
45
2004 2005 2006 2007 2008 2009 2010 2011 2012 2013

RUSSIA > EQUITY RESEARCH > INFRASTRUCTURE
JULY 15, 2014
9
Corporate bonds. Debt financing via corporate bond issuance accounts for about
18% of total investment in infrastructure. According to Bloomberg, the overall
volume of bonds issued by companies in infrastructure sectors (energy, telecoms,
construction) in 2013 stood at $365 bln, of which 25% occurred in the US,
approximately 25% in Europe and 15% in China. The bulk of placements are
concentrated in the energy (50%) and telecommunications (25%) sectors. The
volume of placements in infrastructure sectors has recently soared, which seems
attributable to a tightening of lending requirements by commercial banks for long-
term infrastructure projects, on the one hand, and the rollout of the QE program in
the US that caused a decrease in the cost of public borrowing. We believe the key
investors in infrastructure bonds are pension and hedge funds as well as
commercial banks.
Volume of corporate bonds issued in infrastructure sectors, $ bln Pension savings as % of GDP, 2012
Source: Bloomberg, Gazprombank Source: OECD
Numerous countries have been recently been striving to arrange public-private
partnerships (PPP) in infrastructure development. As a result, the overall volume of
private investment under the PPP scheme has almost quadrupled over the past 10
years, to $180 bln in 2012. That said, the share of PPP in overall infrastructure
investment stands at a modest 8%. Furthermore, the global financial crisis of 2008
halted this growth due to the aforementioned reasons: a reduction of state spending on
infrastructure and a tightening of lending requirements by commercial banks. At the
same time, the noticeable growth of investment on the part of infrastructure funds
pertains to the most attractive projects that can well do without state support.
0.0
50.0
100.0
150.0
200.0
250.0
300.0
350.0
400.0
2004 2005 2006 2007 2008 2009 2010 2011 2012 2013 0% 50% 100% 150% 200%
INDIA
CHINA
INDONESIA
RUSSIA
TURKEY
KOREA
THAILAND
GERMANY
NORWAY
PORTUGAL
SWEDEN
BRAZIL
PERU
JAPAN
HONG KONG
DENMARK
CHILE
CANADA
US
AUSTRALIA
UK
SWITZERLAND
NETHERLANDS
RUSSIA > EQUITY RESEARCH > INFRASTRUCTURE
JULY 15, 2014
10
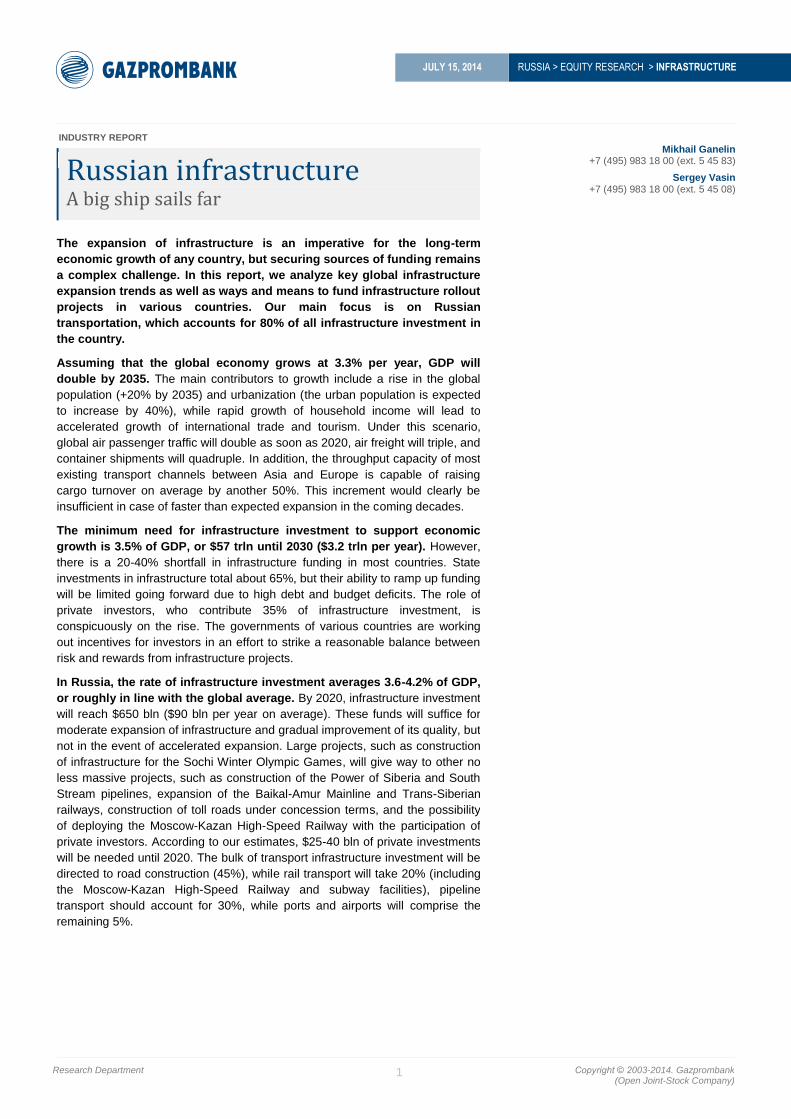
Dynamic of private investment in infrastructure under PPP schemes, 2008–12, $ bln
Breakdown of investment in infrastructure under PPP schemes, 2008-12
Source: World Bank Source: World Bank
The key issue on the short-term agenda to be resolved in order to scale up
investment in the sector is finding a reasonable risk-return ratio for infrastructure
projects. Investment risks related to infrastructure projects used to be quite high, while
their potential returns were modest, thus limiting interest among private investors.
Various states are currently offering financing tools to private investors in order to
mitigate risks related to investing in infrastructure. In particular, governments are
providing guarantees of minimum traffic for investment in transportation, protection for
private investment against inflation, and guarantees of minimum payments to investors
upon completion of construction. Ahead of the 2014 St. Petersburg International
Economic Forum, Ernst & Young conducted a survey regarding the investment
attractiveness of Russia’s infrastructure. The survey revealed that 68% of respondents
cited insufficient guarantees of ROIC as a key obstacle in attracting private investment
in infrastructure. The private sector is ready to invest in Russian infrastructure, although
it expects government assistance in reaching a required rate of return (at least for the
first projects), for instance, through the ‘availability payment’ mechanism.
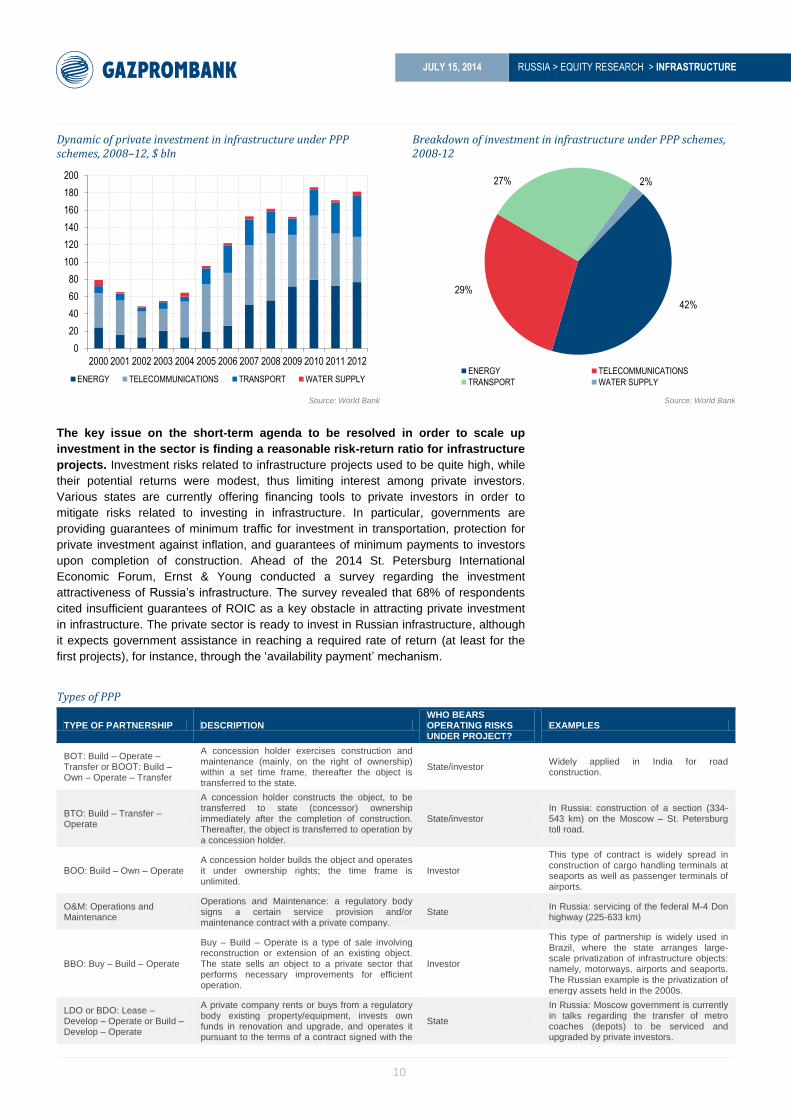
Types of PPP
TYPE OF PARTNERSHIP DESCRIPTION WHO BEARS OPERATING RISKS UNDER PROJECT?
EXAMPLES
BOT: Build – Operate –Transfer or ВООТ: Build – Own – Operate – Transfer
A concession holder exercises construction and maintenance (mainly, on the right of ownership) within a set time frame, thereafter the object is transferred to the state.
State/investor Widely applied in India for road construction.
BTO: Build – Transfer – Operate
A concession holder constructs the object, to be transferred to state (concessor) ownership immediately after the completion of construction. Thereafter, the object is transferred to operation by a concession holder.
State/investor In Russia: construction of a section (334-543 km) on the Moscow – St. Petersburg toll road.
ВОО: Build – Own – Operate A concession holder builds the object and operates it under ownership rights; the time frame is unlimited.
Investor
This type of contract is widely spread in construction of cargo handling terminals at seaports as well as passenger terminals of airports.
O&M: Operations and Maintenance
Operations and Maintenance: a regulatory body signs a certain service provision and/or maintenance contract with a private company.
State In Russia: servicing of the federal М-4 Don highway (225-633 km)
BBO: Buy – Build – Operate
Buy – Build – Operate is a type of sale involving reconstruction or extension of an existing object. The state sells an object to a private sector that performs necessary improvements for efficient operation.
Investor
This type of partnership is widely used in Brazil, where the state arranges large-scale privatization of infrastructure objects: namely, motorways, airports and seaports. The Russian example is the privatization of energy assets held in the 2000s.
LDO or BDO: Lease –Develop – Operate or Build –Develop – Operate
A private company rents or buys from a regulatory body existing property/equipment, invests own funds in renovation and upgrade, and operates it pursuant to the terms of a contract signed with the
State
In Russia: Moscow government is currently in talks regarding the transfer of metro coaches (depots) to be serviced and upgraded by private investors.
0
20
40
60
80
100
120
140
160
180
200
2000 2001 2002 2003 2004 2005 2006 2007 2008 2009 2010 2011 2012
ENERGY TELECOMMUNICATIONS TRANSPORT WATER SUPPLY
42%
29%
27% 2%
ENERGY TELECOMMUNICATIONS
TRANSPORT WATER SUPPLY
RUSSIA > EQUITY RESEARCH > INFRASTRUCTURE
JULY 15, 2014
11
TYPE OF PARTNERSHIP DESCRIPTION WHO BEARS OPERATING RISKS UNDER PROJECT?
EXAMPLES
regulatory body.
Turnkey Turnkey construction. State Conventional building contracts.
DB: Design – Build A private company is in charge of design and construction under the project.
DBO: Design – Build – Operate
A single contract is signed for design, construction and operation.
Source: Gazprombank
Examples of investment tools used in various countries for infrastructure projects
China
China is the world’s largest investor in infrastructure, with the volume of investment over
the past 20 years averaging 8.5% of GDP. The bulk of investment is earmarked for motor
and railroad construction, as well as energy development. According to McKinsey, the cost
of Chinese infrastructure assets stands at 76% of GDP, exceeding the lowest
recommended threshold of 70%. It appears that in the coming years there will be a
shrinkage of investment in infrastructure to 6-7% of GDP, although it will remain at the
highest level globally at nearly $400 bln per annum, or 15% of the world total. Chinese
state banks, including China Development Bank, play the key role in financing Chinese
infrastructure, with the latter accounting for around half of local investment in infrastructure.
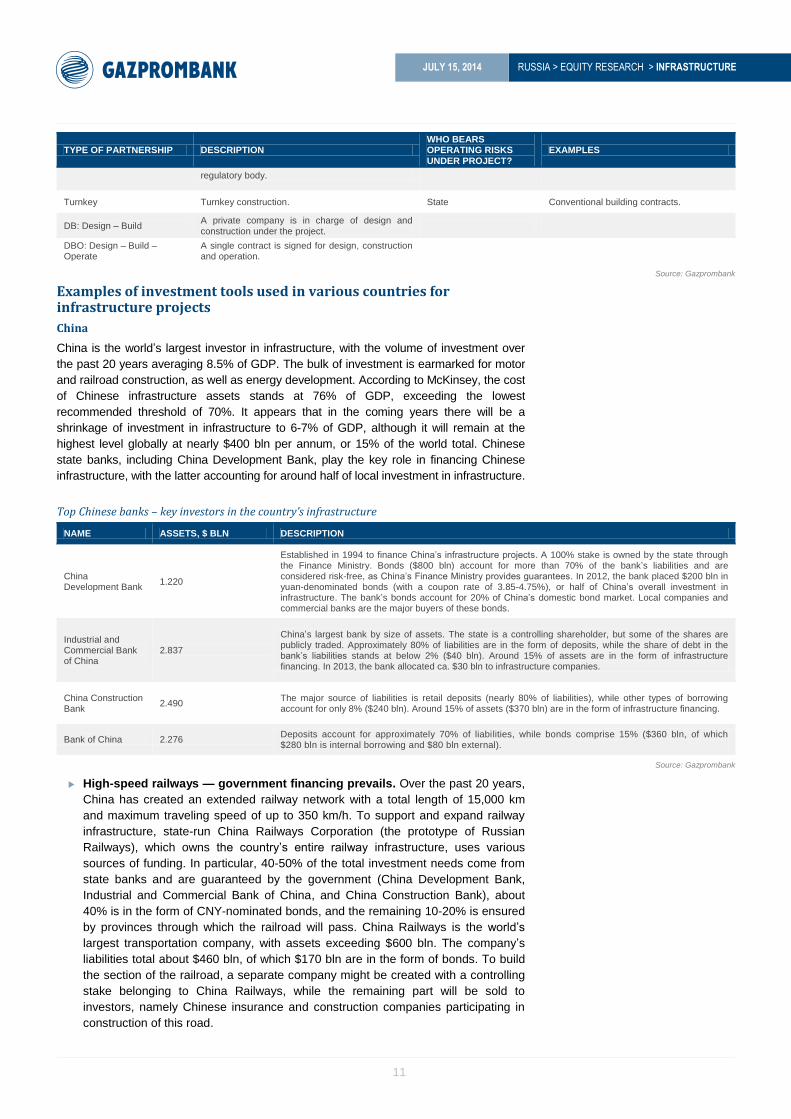
Top Chinese banks – key investors in the country’s infrastructure
NAME ASSETS, $ BLN DESCRIPTION
China Development Bank
1.220
Established in 1994 to finance China’s infrastructure projects. A 100% stake is owned by the state through the Finance Ministry. Bonds ($800 bln) account for more than 70% of the bank’s liabilities and are considered risk-free, as China’s Finance Ministry provides guarantees. In 2012, the bank placed $200 bln in yuan-denominated bonds (with a coupon rate of 3.85-4.75%), or half of China’s overall investment in infrastructure. The bank’s bonds account for 20% of China’s domestic bond market. Local companies and commercial banks are the major buyers of these bonds.
Industrial and Commercial Bank of China
2.837
China’s largest bank by size of assets. The state is a controlling shareholder, but some of the shares are publicly traded. Approximately 80% of liabilities are in the form of deposits, while the share of debt in the bank’s liabilities stands at below 2% ($40 bln). Around 15% of assets are in the form of infrastructure financing. In 2013, the bank allocated ca. $30 bln to infrastructure companies.
China Construction Bank
2.490 The major source of liabilities is retail deposits (nearly 80% of liabilities), while other types of borrowing account for only 8% ($240 bln). Around 15% of assets ($370 bln) are in the form of infrastructure financing.
Bank of China 2.276 Deposits account for approximately 70% of liabilities, while bonds comprise 15% ($360 bln, of which $280 bln is internal borrowing and $80 bln external).
Source: Gazprombank
High-speed railways — government financing prevails. Over the past 20 years,
China has created an extended railway network with a total length of 15,000 km
and maximum traveling speed of up to 350 km/h. To support and expand railway
infrastructure, state-run China Railways Corporation (the prototype of Russian
Railways), which owns the country’s entire railway infrastructure, uses various
sources of funding. In particular, 40-50% of the total investment needs come from
state banks and are guaranteed by the government (China Development Bank,
Industrial and Commercial Bank of China, and China Construction Bank), about
40% is in the form of CNY-nominated bonds, and the remaining 10-20% is ensured
by provinces through which the railroad will pass. China Railways is the world’s
largest transportation company, with assets exceeding $600 bln. The company’s
liabilities total about $460 bln, of which $170 bln are in the form of bonds. To build
the section of the railroad, a separate company might be created with a controlling
stake belonging to China Railways, while the remaining part will be sold to
investors, namely Chinese insurance and construction companies participating in
construction of this road.

RUSSIA > EQUITY RESEARCH > INFRASTRUCTURE
JULY 15, 2014
12
According to an infrastructure report prepared by Ernst & Young, from 1997 to
2007 China conducted a six-stage campaign to increase train travelling speed. As
a result, construction of tunnels and bridges allowed for more declivity, the turning
radius was reduced and continuous welded rails were laid. In 1997, the total length
of high-speed tracks, where trains could pick up speed over 160 km/h, stood at
752 km. By 2007, their length was increased to 14,000 km. Following extended
discussion among experts on which type of high-speed train to choose – traditional
or maglev – in 2006 the PRC’s State Council chose the former (HSR). The next
stage was the development of the high-speed train series CRH (China Railway
High Speed), which ensured a further increase in travelling speed. In 2004, the
Railways Ministry announced a tender to supply 200 high-speed trains that could
conduct transportation services at a speed of over 200 km/h. Applications were
filed by such large companies as Alstom (France), Siemens (Germany),
Bombardier Transportation (Germany), and consortium of Japanese investors
headed by Kawasaki. As a result of the tender, contracts were signed with Alstom,
Bombardier and Kawasaki, while Siemens was not among the winners, as it
refused to lower the price for the trains and technology transfer. The following year,
Siemens reduced the price, which allowed it to win the tender to supply 60 trains to
conduct transportation service at a speed of 300 km/h. Each foreign manufacturer
adapted the supplied high-speed train to China’s unified standards. Train assembly
was performed either jointly or with the assistance of Chinese manufacturers.
Thanks to technological cooperation, Chinese engineers were able to design their
own high-speed trains, based on trains made by foreign manufacturers. Chinese
trains carry passengers from Beijing to Shanghai (1,463 km) in less than six hours,
i.e. twice as fast compared with previous-generation trains. High-speed trains also
allowed an increase in carrying traffic, resulting in higher capacity for the railway
transportation system. As high-speed trains used the same tracks as freight trains,
the only way to further increase the speed and capacity was to build high-speed
lines for passenger trains. Recently, China launched a campaign to build dedicated
high-speed tracks for passenger transportation.
Toll roads — private financing prevails. China embarked on active construction
of toll roads in the early 1990s. The total length of toll roads currently approaches
100,000 km, linking all provinces and major cities in China. Total investment
exceeded $260 bln ($2.6 mln/km). China's State Council and the Transport Ministry
approve projects and construction standards, while their implementation and
financing is performed by the administrations of involved provinces. Originally the
provinces financed up to 90% of road construction from their budgets and through
loans. Once construction is completed, the toll road is incorporated into the capital
of a new company, the shares of which are placed on an equity exchange among
international investors. Administrations spend the received money to build a new
road. Thus, currently about 45% of road construction funds are self-raised, namely
through the sale of shares via IPOs and cash flow from existing toll roads. The
remaining 40% of the investment is still provided by provinces (through loans) and
only 15% comes from the federal budget. Currently more than 15 such companies
with a total market capitalization of $53 bln ($115 bln inclusive of debt) are trading
on the Hong Kong Stock Exchange. Their distinguishing features are high margins
(EBITDA margins of 40-60%) and solid dividends. The average P/E multiple of
these companies for 2014 stands at around 10.0x, which is close to the average of
Hong Kong’s Hang Seng Index.

RUSSIA > EQUITY RESEARCH > INFRASTRUCTURE
JULY 15, 2014
13
China’s publicly-traded companies – owners of toll roads
COMPANY TICKER MCAP, $ MLN. EV, $ MLN FREE FLOAT
CHINA COMMUNICATIONS CONSTRUCTION 1800 HK 10,361 25,246 100.0%
CHINA RAILWAY CONSTRUCTION 1186 HK 9,227 18,826 90.9%
CHINA RAILWAY GROUP 390 HK 9,181 30,711 90.9%
JIANGSU EXPRESS 177 HK 4,698 5,296 100.0%
ZHEJIANG EXPRESSWAY 576 HK 3,941 3,827 100.0%
SHANDONG HI-SPEED 600350 CH 2,277 4,338 12.7%
SHANGHAI TUNNEL ENGINEERING 600820 CH 2,142 4,415 35.5%
SHENZHEN INTL HOLDINGS 152 HK 2,090 4,541 47.4%
HOPEWELL HIGHWAY INFRASTRUCTURE 737 HK 1,474 1,470 29.2%
SICHUAN ROAD&BRIDGE 600039 CH 1,373 3,599 49.3%
SICHUAN EXPRESSWAY 107 HK 1,255 2,419 98.9%
SHENZHEN EXPRESSWAY 600548 CH 1,163 2,710 14.9%
JIANGXI GANYUE EXPRESSWAY 600269 CH 1,045 2,058 46.2%
ANHUI EXPRESSWAY 995 HK 1,037 1,490 95.0%
FUJIAN EXPRESSWAY DEVELOPMENT 600033 CH 932 2,427 44.7%
YUEXIU TRANSPORT INFRASTRUCTURE 1052 HK 850 2,028 100.0%
Total
53,047 115,400
Source: Bloomberg
China’s high-speed railroads financing breakdown China’s toll roads financing breakdown
Source: World Bank Source: World Bank
India
Over the past 20 years, India’s investment in infrastructure has averaged 5% of GDP,
which was insufficient given the country’s average annual GDP growth rate of 7%.
Under the new five-year development plan (2013-17) the Indian government has
decided to double the amount of investment vs. the previous plan to $1 trln, or $200 bln
annually (10% of GDP). The bulk of investment will focus on transportation (35%),
utilities (34%) and telecommunications (17%). This is the most ambitious plan to
stimulate the economy among developing countries, although it is unlikely to be fully
implemented due to a shortage in funding of about $300 bln. The Indian government
plans to provide 53% of the required investment, 25% of which will be covered from the
state budget ($250 bln), 11% will come from extra-budgetary sources, and 17% through
public borrowings. The remaining 47% is comprised of private investment, including
40%
40%
10%
STATE BANKS BONDS REGIONAL BUDGETS
15%
40%
45%
STATE BUDGET BORROWINGS INTERNAL FINANCING (IPO, CASH FLOW)

RUSSIA > EQUITY RESEARCH > INFRASTRUCTURE
JULY 15, 2014
14
15% from investors’ own funds and 35% through borrowing. However, so far the
confirmed size of private investment amounts to ca. $300 bln.
China has offered India financial support and is prepared to invest the $300 bln shortfall
in the country’s infrastructure. China is apparently interested in engaging its construction
companies, equipment and materials. However, the Indian government is in no hurry to
accept the proposal, as a number of infrastructure sectors are considered strategic
(telecommunications, utilities) and do not allow Chinese capital.
Sources of funding implied by the plan (2012-17) Confirmed non-budgetary sources of funding (2012-17)
Source: Deloitte Source: Deloitte
Potential non-budgetary sources of funding for Indian infrastructure under the five-year
development plan until 2017 include the following:
Commercial banks. They could invest about $120 bln over the next five years,
accounting for 12% of the total investment required and 42% of all currently
available private investment.
Non-bank financial institutions ($64 bln; 22%). India has many specialized non-
bank financial corporations, targeting infrastructure investment. They are India
Infrastructure Finance Corporation (IIFCL), National Highways Authority of India,
Rural Electrification of India, Power Finance Corporation (PFC), and Indian Railway
Finance Corporation.
Insurance companies ($1 bln; 3%). Insurance companies that are not involved with
life insurance business are obliged to invest no less than 15% of their assets in
Indian infrastructure.
Key infrastructural financial organizations in India
COMPANY DESCRIPTION CAPITAL STRUCTURE
India Infrastructure Finance Company Limited (IIFCL)
A state-owned corporation established in 2006 to support infrastructure projects. The company participates in infrastructure projects as a co-investor, offering direct financing or providing guarantees to improve the credit quality of infrastructure bonds. The company also takes part in implementation of over 200 projects with a total value of $77 bln.
The company’s assets stand at $5.8 bln. The total value of bond placements amounts to $4.9 bln with a coupon of 8.0-8.9%. In 2013, the company issued loans and guarantees in the amount of $1.9 bln. The company’s bonds are not state-backed, although its ratings are at the sovereign level.
National Highways Authority of India (NHAI)
Government agency for road construction and management.
The state budget is the main source of financing for the agency. At the same time, the regulator has a small number of public loans totaling $2.5 bln carrying 7.4-8.3% coupon rates.
Power Finance Corporation State-run corporation that was specially created in order to attract investments to India’s electric power generation sector.
The Indian government owns 73% of the company’s shares, while free float accounts for the remainder. The company’s MCap stands at $4 bln. The overall number of loans (mainly public) stands at $24 bln with coupon rates ranging from 8.0-9.7%.
Rural Electrification Corporation Limited
State-run corporation specially created to attract investments into India’s power grid assets.
The Indian government holds 65% of the company’s shares with the remainder in free float. The company’s MCap stands at $5.5 bln. Public loans
24.8%
10.6%
16.5%
14.8%
33.3%
STATE BUDGET
NON-BUDGETARY FUNDS
PRIVATE INVESTMENTS
GOVERNMENT BONDS
INVESTORS' OWN FUNDS
42% 22%
8%
3%
25% COMMERCIAL BANKS
NONCOMMERCIAL FINANCIAL INSTITUTIONS
EXTERNAL BORROWINGS
INSURANCE COMPANIES
EQUITY FINANCING

RUSSIA > EQUITY RESEARCH > INFRASTRUCTURE
JULY 15, 2014
15
COMPANY DESCRIPTION CAPITAL STRUCTURE
taken out by the company total $18.7 with coupon rates ranging from 8.0-9.7%.
Indian Railway Finance Corporation
Indian Railways’ 100%-owned subsidiary. The company attracts cash from the market to finance the purchases of equipment for subsequent lease to the parent company.
The company’s total assets stand at $12 bln, of which $11 bln are in the form of public offerings.
Infrastructure Development Finance Company
The company was established in 1997 as a government agency for financing various infrastructure sectors. Sometime after that, the company turned into a joint-stock company and offered its shares on the stock exchange.
The company’s total assets amount to $12 bln. The government owns 17% of the company’s shares, while international investors hold the remainder.
Indian Leasing and Financial Services
The company was established in 1987 by the central bank of India and a number of other state bodies. Later, Life Insurance Corporation of India, ORIX Corporation (Japan), and Abu Dhabi Investment Authority also became the company’s shareholders. The company attracts investment in India’s infrastructure facilities. It also builds and manages highways, energy facilities, ports, city infrastructure, and water delivery systems.
Total investments stand at around $25 bln. The major shareholders are Life Insurance Corporation of India (25.34%), ORIX Corporation (23.00%), Abu Dhabi Investment Authority (11.09%), Central Bank of India (8.34%), State Bank of India (6.98%), and ILFS Employees' Welfare Trust (13.65%).
Source: Gazprombank estimates
In addition, the offerings of infrastructure bonds, the incomes from which are not taxed
(tax-free bonds), are widespread in India. The government sets an annual limitation on
such offerings. For example, the government allowed non-banking financial corporations
to issue only $9.2 bln in tax-free bonds in 2014; while private investors were allowed to
issue about $5.0 bln. Moreover, the government sets tax holidays for infrastructure
companies for a period of up to 10 years.
Total ivestments in India, $ bln Investment structure in India
Source: IBEF Source: IBEF
Railways. India has the world’s fourth-longest railway network. Daily passenger
traffic via this network amounts to 30 mln people (vs. about 3 mln passengers
travelling via Russian Railways’ network per day). In 2013, Indian trains carried
about 1.0 bln tonnes of cargoes (vs. 1.2 bln tonnes in Russia). State-run Indian
Railways owns the entire railway infrastructure. The new government development
plan for 2013-17 envisages that investments in railway infrastructure will increase
by 2.5 times to $100 bln. However, investments for 2014 are planned at $12 bln,
which is comparable with Russian Railways’ capex. About 40% of the company’s
investment is financed by the state budget, 30-35% is allocated from company’s
net income and borrowing, and the remaining 25-30% is attracted from additional
sources, including around $1 bln from private investors. Indian Railways includes a
special investment unit called Indian Railway Finance Corporation, which focuses
on attracting private investment. The unit’s assets amount to $12 bln. The
investment company mainly uses the attracted funds to finance the purchases of
locomotives and rail cars, which are subsequently leased out to its parent company
Indian Railways. In early 2014, the company placed several bond tranches
denominated in Indian rupees totaling about $5 bln. The maturity of the bonds was
set at 10-15 years and the coupon rates ranged from 8.2-8.6%. That said, these
0
10
20
30
40
50
60
2009 2010 2011 2012 2013 2014 2015 2016 2017
HIGHWAYS RAILWAYS
0.0%
1.0%
2.0%
3.0%
4.0%
5.0%
6.0%
7.0%
8.0%
9.0%
0%
10%
20%
30%
40%
50%
60%
70%
80%
90%
100%
2007 2008 2009 2010 2011 2012
PRIVATE PUBLIC % OF GDP
RUSSIA > EQUITY RESEARCH > INFRASTRUCTURE
JULY 15, 2014
16
bonds were not subject to income tax. In addition, the Indian government is
allowing an increasing number of private investors to take part in projects for the
construction of railway infrastructure facilities, i. e. depots, storage facilities, railway
stations, and even special separate rail lines approaching ports in order to speed
up the elimination of existing bottlenecks. Construction of the Western and Eastern
railway corridors with a total length of 3,300 km is now one of the main
infrastructure projects in India. The implementation of this project is to be
completed in 2017, and should increase cargo turnover throughout the country.
Total investments in the project amount to $16.7 bln.
Highways. India has the world’s second-largest highway network (4.7 mln km).
More than 60% of cargoes are carried throughout the country via highways. The
development of a highway network is one of the top priority tasks of the Indian
government. Under the public private partnership, over 50% of private
investments are allocated for highway construction. The bulk of investments are
conducted under the “build-operate-transfer” principle, which envisages a private
investor (or consortium of investors) building a road and using it for 20-30 years,
with the investor eventually returning the road to the government. The Indian
government supports investors by allocating special grants for road construction
(up to 40% of the project value). The Indian government also awards
infrastructure projects with 100% tax holidays over the first five years and 30%
holidays for the following 30 years.
Brazil
The Brazilian experience of attracting private investment to the infrastructure sector is
quite interesting, although it still cannot be recognized as very successful. Since the
mid-1990s, the country’s authorities have demonstrated their commitment to mass
privatization and concession of infrastructure facilities. As a rule, an investor that is
ready either to pay the maximum price for an asset, or to set the minimum tariff for use
of the infrastructure, is selected as the winner in the privatization of roads, airport and
postal terminals. However, Brazil’s infrastructure sector is still poorly developed. The
country was ranked 114th out of 148 countries rated by the Global Competitiveness
Index (GCI), and total investment in Brazilian infrastructure does not exceed 1.5% of
GDP. The main problem involves the high political and economic risks and quite low
returns on investment (ca. 6%). The country suffers from complex and lengthy
bureaucratic procedures, which considerably impede the implementation of
infrastructure projects and decrease returns on private investment.
Projects involving the construction and management of highways and railways offer low
returns on investment. However, investment in airport and seaport infrastructure
remains quite attractive. For example, the Singapore port operator Changi and Brazilian
construction company Odebrecht recently offered $8.2 bln on the tender to get the
airport in Sao Paulo in concession, which is four times the initial price of the tender.
In contrast to China and India, Brazil suffers from a lack of government bodies that
support and attract investment in the infrastructure sector. The Brazilian Development
Bank is the only such organization with assets exceeding $300 bln. However, the
efficiency of the bank’s efforts to develop the country’s infrastructure sector is unclear,
as the bank also supports other branches of the economy, i. e. social, education, and
healthcare sectors, small businesses, environmental projects, etc. Each year, the bank
invests $80-90 bln in the Brazilian economy, of which 35-40% is comprised of
investment in infrastructure projects.
A few years ago, in an effort to attract more private investment to the infrastructure
sector, the Brazilian government set the terms for an offering of special infrastructure
bonds, which must meet the following criteria:
The funds raised via the bond offering must be only used to finance the company’s
investment program;

RUSSIA > EQUITY RESEARCH > INFRASTRUCTURE
JULY 15, 2014
17
The minimum maturity is four years;
The bonds carry a fixed coupons or coupons linked to inflation rates;
The bonds can be redeemed ahead of schedule no earlier than two years after the
bond issuance;
Proceeds from the bonds are not subject to tax (earlier the income tax stood at
6%).
The Brazilian government expects that the bonds will generate up to 10-20% of total
investment in the infrastructure sector. However, Brazilian companies still unwillingly
use infrastructure bond offerings as a low-cost way to attract investment, since such
borrowings remain expensive. Only a few companies have thus far placed infrastructure
bonds with inflation-linked coupons ranging between 9.5-14.0%.
US
According to the American Society of Civil Engineers (ASCE), US demand for
investment in economic infrastructure amounts to about $3 trln for the period through
2020, or more than $400 bln annually. However, because of efforts to reduce the
country’s budget deficit, the planned investment (both public and private) in the
infrastructure sector turned out to be far below the real needs standing at $1.8 trln
through 2020, or around $220 bln annually (less than 2% of GDP). The decrease in
investment in US’ infrastructure is a matter of great concern in that country. Some
experts believe that capital that was earlier withdrawn from the country could become an
additional source of investment in US infrastructure. Lawmakers have suggested
exempting capital returned to the country from taxes, while obliging to invest these funds
in US infrastructure bonds.
The bulk of investment will be shared between two infrastructure segments – highways
(61%) and energy (36%).
Highways. Road construction and reconstruction is financed through the Highway
Trust Fund, mainly replenished with proceeds from fuel excises at a level of 18.3
cents/gallon. The fund’s annual income stands at around $45 bln, but these
proceeds fail to cover its expenses. The major issue is that given the flat level of
inflation, excises have not been raised for the past 20 years, while the growing
number of cars has been accompanied by diminishing fuel consumption, which has
a negative impact on the fund’s financials. Each state is entitled to set its own fuel
levy in order to arrange financing of regional roads. Alaska has the lowest size of
26.4 cents, while New York enjoys the highest rate of 69.6 cents. US fuel levies
average 48.8 cents, or 13.3% of the average retail price of a gallon of gasoline.
Railways. The particularity of the US railway infrastructure is that the segment is
wholly owned by private railway operators, who mainly focus on cargo
transportation (53% of total turnover throughout the country), while passenger
transport accounts for a minimal share.
RUSSIA > EQUITY RESEARCH > INFRASTRUCTURE
JULY 15, 2014
18
CURRENT STATUS OF RUSSIA’S INFRASTRUCTURE NEEDS
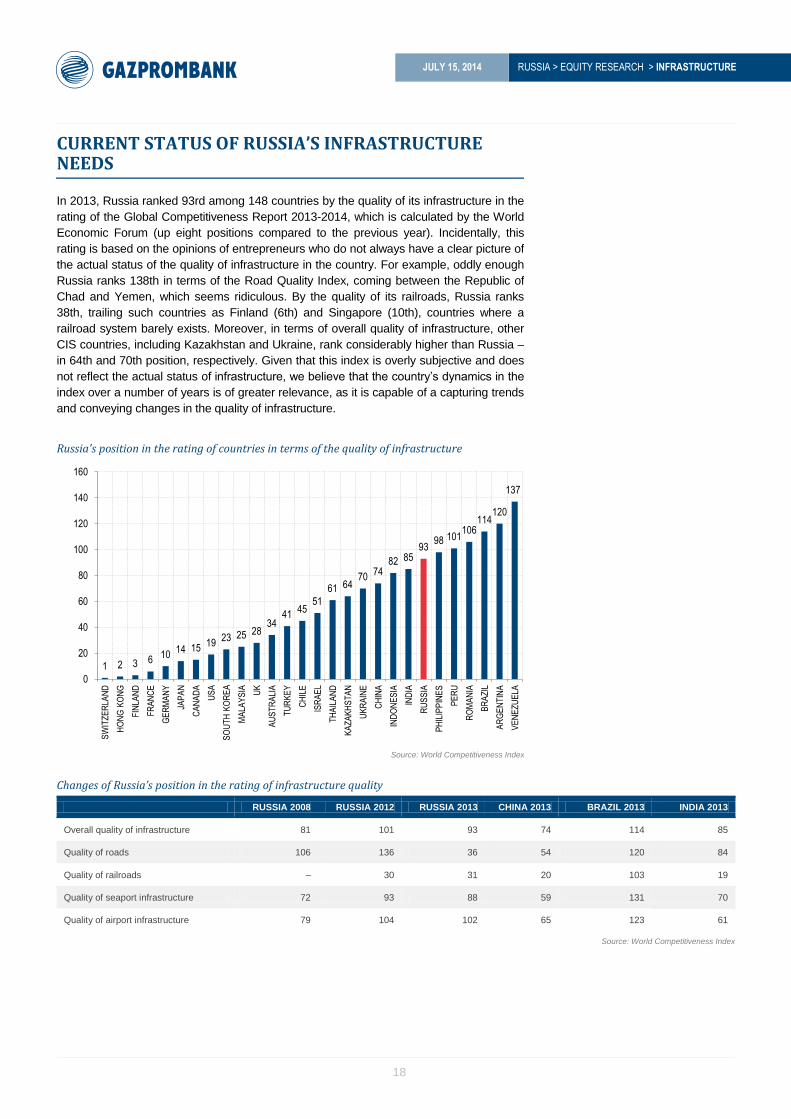
In 2013, Russia ranked 93rd among 148 countries by the quality of its infrastructure in the
rating of the Global Competitiveness Report 2013-2014, which is calculated by the World
Economic Forum (up eight positions compared to the previous year). Incidentally, this
rating is based on the opinions of entrepreneurs who do not always have a clear picture of
the actual status of the quality of infrastructure in the country. For example, oddly enough
Russia ranks 138th in terms of the Road Quality Index, coming between the Republic of
Chad and Yemen, which seems ridiculous. By the quality of its railroads, Russia ranks
38th, trailing such countries as Finland (6th) and Singapore (10th), countries where a
railroad system barely exists. Moreover, in terms of overall quality of infrastructure, other
CIS countries, including Kazakhstan and Ukraine, rank considerably higher than Russia –
in 64th and 70th position, respectively. Given that this index is overly subjective and does
not reflect the actual status of infrastructure, we believe that the country’s dynamics in the
index over a number of years is of greater relevance, as it is capable of a capturing trends
and conveying changes in the quality of infrastructure.
Russia's position in the rating of countries in terms of the quality of infrastructure
Source: World Competitiveness Index
Changes of Russia’s position in the rating of infrastructure quality
RUSSIA 2008 RUSSIA 2012 RUSSIA 2013 CHINA 2013 BRAZIL 2013 INDIA 2013
Overall quality of infrastructure 81 101 93 74 114 85
Quality of roads 106 136 36 54 120 84
Quality of railroads – 30 31 20 103 19
Quality of seaport infrastructure 72 93 88 59 131 70
Quality of airport infrastructure 79 104 102 65 123 61
Source: World Competitiveness Index
1 2 3 6 10
14 15 19
23 25 28 34
41 45
51
61 64 70
74 82 85
93 98 101
106 114
120
137
0
20
40
60
80
100
120
140
160
SW
ITZ
ER
LAN
D
HO
NG
KO
NG
FIN
LAN
D
FR
AN
CE
GE
RM
AN
Y
JAP
AN
CA
NA
DA
US
A
SO
UT
H K
OR
EA
MA
LAY
SIA
UK
AU
ST
RA
LIA
TU
RK
EY
CH
ILE
ISR
AE
L
TH
AIL
AN
D
KA
ZA
KH
ST
AN
UK
RA
INE
CH
INA
IND
ON
ES
IA
IND
IA
RU
SS
IA
PH
ILIP
PIN
ES
PE
RU
RO
MA
NIA
BR
AZ
IL
AR
GE
NT
INA
VE
NE
ZU
ELA

RUSSIA > EQUITY RESEARCH > INFRASTRUCTURE
JULY 15, 2014
19
Russia’s infrastructure investment needs total at least 4% of GDP. Large-scale
investments are required in virtually all infrastructure segments, including highways and
railroads, power grids, water supply, telecommunications, ports and airports. According
to estimates by McKinsey, Russia spent an average 3.4% of GDP on infrastructure from
1999 through 2011. This figure is broadly in line with our own estimates. By comparison,
global infrastructure investments during this period averaged 3.8% of GDP (3.1% in
developed countries and 5.5% in developing countries). However, going forward the
volume of investments would have to be raised to at least 4% of GDP in order to
maintain domestic infrastructure in good shape and secure its harmonious expansion in
line with GDP growth. Thus, assuming that average annual GDP grows by 2.5% until
2030, the total need for infrastructure investments in Russia during this period would be
RUB 60 trln ($1.7 trln), or about $100 bln per year.
Planned infrastructure spending in Russia will be about 3.6-4.2% of GDP until
2020. In order to assess the magnitude of planned infrastructure investment in Russia,
we analyze a large number of federal target programs spearheaded by the RF
government, Russia’s transport strategy until 2030, federal spending and regional
infrastructure budgets, as well as the investment programs of natural monopolies
(Gazprom, Transneft, Russian Railways), and of companies that invest in infrastructure
(mainly in power engineering and telecommunications). On the basis of these
documents and our calculations, about 3.6-4.2% of GDP will be spent on infrastructure
projects or RUB 3.2-3.6 trln per annum ($90-100 bln), roughly on par with investments
by large developed countries. Infrastructure investments will reach RUB 22.5 trln, or
about 2.2% of global infrastructure investments by 2020. These resources should suffice
for moderate expansion of domestic infrastructure (including highways and railroads), to
raise its quality and efficiency, but would not be enough for accelerated expansion
compared to Russian economic growth. For this reason, many infrastructure restrictions
will remain in place in the country.
A distinguishing feature of investments in the Russian economy is the large proportion
of spending on construction and servicing of pipeline transport. The main investors here
are Gazprom and Transneft, which will sink at least RUB 800 bln per year into
infrastructure by 2020. The structure of Russia’s infrastructure spending, as is the case
in most countries around the world, is dominated by investments in transportation
infrastructure (55%), mostly for the expansion of highways (45%), whereas pipeline
transport investments come second with a proportion of 25%. The other 20% includes
investments in telecommunications, power grids (investments in generating assets are
not classifiable as infrastructural according to our classification) and public utilities
(mainly water supply; housing maintenance and repair are also not regarded as
infrastructure investments).
The RF president and government are aware of the importance of raising
infrastructure investments, since this is one of the key factors stimulating
economic growth in the country. Specifically, the president tasked the government
with expanding infrastructure in a number of areas over the coming decade, as follows:
Double the construction of federal highways from 2013 through 2022 compared
with 2003-12.
Expand the total length of federal highways compliant with statutory requirements
and transport operating standards to 44,000 km (83% of total infrastructure).
Increase the aggregate cargo handling capacity of Russian seaports by 302 mln
tonnes (port capacity currently stands at 800 mln tonnes).
RUSSIA > EQUITY RESEARCH > INFRASTRUCTURE
JULY 15, 2014
20
Estimated key directions of investments in Russia’s economic infrastructure (less VAT), RUB bln
2010 2011 2012 2013 2014E 2015E 2016E 2017E 2018E 2019E 2020E
Transport (less pipes) 820 993 1,390 1,572 1,346 1,576 1,912 2,037 1,894 1,775 1,760
% of total 39% 37% 52% 55% 49% 51% 55% 56% 56% 56% 58%
Pipes 689 991 632 657 764 869 861 887 848 752 671
% of total 33% 37% 24% 23% 28% 28% 25% 25% 25% 24% 22%
Power grid system* 235 311 283 279 275 265 270 268 214 207 202
% of total 11% 12% 11% 10% 10% 9% 8% 7% 6% 7% 7%
Telecommunications 322 381 355 335 348 342 350 349 342 351 358
% of total 15% 14% 13% 12% 13% 11% 10% 10% 10% 11% 12%
Public utilities** 18 19 27 32 40 54 59 74 58 62 66
% of total 1% 1% 1% 1% 1% 2% 2% 2% 2% 2% 2%
Total 2,083 2,696 2,687 2,875 2,774 3,106 3,453 3,615 3,356 3,147 3,057
As % of GDP*** 4.5% 4.8% 4.3% 4.3% 3.9% 4.1% 4.2% 4.0% 3.4% 3.0% 2.8%
Source: Gazprombank
* we do not include power generating assets in infrastructural investments
** we consider mainly investments in water supply, but not in house repairs
*** declining investments to GDP ratio after 2018 is attributable to completion of large-scale infrastructural pipelines, although we do not exclude the likelihood of emergence of new projects
Russia’s transport infrastructure: rapid growth or concurrent expansion?
The vast expanse of Russian territory clearly reveals the need of households and
companies for advanced and reliable transport infrastructure. The country’s total
territory is equal to 17 mln km2, with the maximum length from West to East reaching
about 10,000 km (by comparison, Canada, the world’s second-biggest country, is about
half as big). By virtue of the large distances and export orientation of the Russian
economy, the proportion of transportation expense in the cost of production of some
companies can reach 30%, which means that having an efficient transport system
makes these companies competitive on the global market. In terms of the Logistic
Performance Index, Russia ranks 94th among 155 countries. This index is tracked by
the World Bank, which factors in the quality of transportation infrastructure, customs
procedures, ease of delivering consumer goods, and a number of other criteria. The
mobility rate of Russia is also considerably lower than in developed countries, and this is
a key factor in the expansion of employment and tourism, growth in income and
spending, and, consequently, the overall economic development of the country.

RUSSIA > EQUITY RESEARCH > INFRASTRUCTURE
JULY 15, 2014
21
Logistics performance index, 2013 Population mobility index
Source: World Bank Source: Gazprombank
Transportation costs of Russian companies are higher than in developed
countries. In the USSR, there was a powerful transport infrastructure, which, until
recently, was more or less capable of meeting the needs of Russia’s rapidly growing
economy. However, traffic handling capacity in the most developed areas has peaked in
recent years and is essentially no longer capable of coping with growing demand. This
situation has given rise to massive traffic jams (average speed on downtown Moscow
roads is 20 kph, compared to 40 kph in large European cities); it has also created
bottlenecks on railroads and reduced the speed of rolling stock (average speed of
freight trains decreased by 12% to 300 km per day in 2013).
Dynamic of Russia's cargo turnover, bln t/km Growth index of infrastructure indicators
Source: State Statistics Service Source: State Statistics Service, Gazprombank estimates
The rate of investments in development of Russia’s transport infrastructure is
already close to that of developed economies, about 3% of GDP. These funds are
sufficient for moderate expansion, but are insufficient for qualitative
improvement. Countries with developed infrastructure spend an average 2.5-3.0% of
GDP per year on maintenance and development, in line with World Bank
recommendations. According to our estimates, Russia also spends about 3% of GDP,
including investments in pipeline transport. Net of that item (only highways and
railroads, airports and ports), the proportion of GDP spending has reached 2.3% in
recent years, although it was less than 1% in the mid-2000s. There is no point in
comparing Russia with China or India, where spending on transport infrastructure is
considerably higher, as these countries frequently create infrastructure from scratch,
whereas Russia went through this phase during industrialization in the 20th century.
1 2 3 4 5 9 10 13 16 24 28
35 42
50 54 65
71
88 90 99
125 135
149
0
20
40
60
80
100
120
140
160
GE
RM
AN
Y
NE
TH
ER
LAN
DS
BE
LGIU
M
UK
SIN
GA
PO
RE
US
A
JAP
AN
FR
AN
CE
AU
ST
RA
LIA
FIN
LAN
D
CH
INA
TH
AIL
AN
D
CH
ILE
ME
XIC
O
IND
IA
BR
AZ
IL
PE
RU
KA
ZA
KH
ST
AN
RU
SS
IA
BE
LAR
US
AZ
ER
BA
IJA
N
MO
NG
OLI
A
KY
RG
YZ
ST
AN
0.5 0.4
2 2.2 2.9
4
0.27
1.4 1.6
0.5 0.4
0.3
0.8
0.32
0
1
2
3
4
5
6
ITA
LY
FR
AN
CE
US
EU
UK
TU
RK
EY
RU
SS
IA
INTERNATIONAL FLIGHTS PER 1 PERSON DOMESTIC FLIGHTS PER 1 PERSON
0
1,000
2,000
3,000
4,000
5,000
6,000
7,000
1970
1980
1991
1993
1995
1997
1999
2001
2003
2005
2007
2009
2011
2013
BY CARS BY INTERNAL WATER TRANSPORT
BY AIR TRANSPORT BY RAILROAD
0
50
100
150
200
250
2000 2001 2002 2003 2004 2005 2006 2007 2008 2009 2010 2011 2012 2013
CARGO TURNOVER PRIVATE CARS PER 1,000 PEOPLE FEDERAL ROADS RAILWAYS PIPES

RUSSIA > EQUITY RESEARCH > INFRASTRUCTURE
JULY 15, 2014
22
Investments in transport infrastructure, % of GDP
Source: McKinsey, Gazprombank
* including pipeline transport
** excluding pipeline transport
Plan of development for transport infrastructure until 2020
Russia has a large number of detailed federal and regional special-purpose programs
devoted to the development of transportation infrastructure. These programs provide
detailed overviews of infrastructure projects and deployment costs, but no reference is
made to clear-cut sources of funding. Furthermore, these programs incorporate a
plethora of expenses unrelated to infrastructure issues (for example, passenger air
traffic subsidies, purchase of locomotives, and rolling stock for the railroad industry, as
well as construction of vessels). As a result, programs are often revised and
underfinanced. Nonetheless, they make it possible to analyze the dynamics of industry
development, pinpoint key investment areas, determine their overall trends, and assess
the priorities and status of large projects. The above programs can be summed up as
follows:
Federal Special-Purpose Program Upgrade of the Transport System of Russia 2010-
2020
Transport Strategy until 2030
Federal Budget Spending for 2014 and Subsequent Years
Regional Budgets Spending for 2014 and Subsequent Years, Including Moscow and
St. Petersburg
Investment Programs of Natural Monopolies: Russian Railways, Gazprom, Transneft
and State Company Russian Highways (Avtodor)
In order to assess the size and dynamics of the transport infrastructure market, we
made a number of adjustments to these programs by excluding all expenditures that are
not directly related to infrastructure (for example, subsidization of passenger air travel),
and adjusted them for VAT (18%). We also adjusted some programs downward, since
none of them has been 100% executed. The average implementation rate of federal
programs is 85-90%, while the fulfillment of regional programs is even worse. According
to our estimates, investments in transport infrastructure, not including pipeline transport,
have nearly doubled since 2010 and totaled about RUB 1.5 trln (net of VAT) in 2013.
The table below highlights the main growth factors.
2.3% 2.6% 2.8% 2.9% 3.0% 3.0%
3.3% 3.3% 3.4% 3.7%
6.0%
8.0%
0.0%
1.0%
2.0%
3.0%
4.0%
5.0%
6.0%
7.0%
8.0%
9.0%
RU
SS
IA**
JAP
AN
GE
RM
AN
Y
FR
AN
CE
US
A
RU
SS
IA*
UK
SW
ED
EN
CA
NA
DA
AU
ST
RA
LIA
IND
IA
CH
INA
RUSSIA > EQUITY RESEARCH > INFRASTRUCTURE
JULY 15, 2014
23
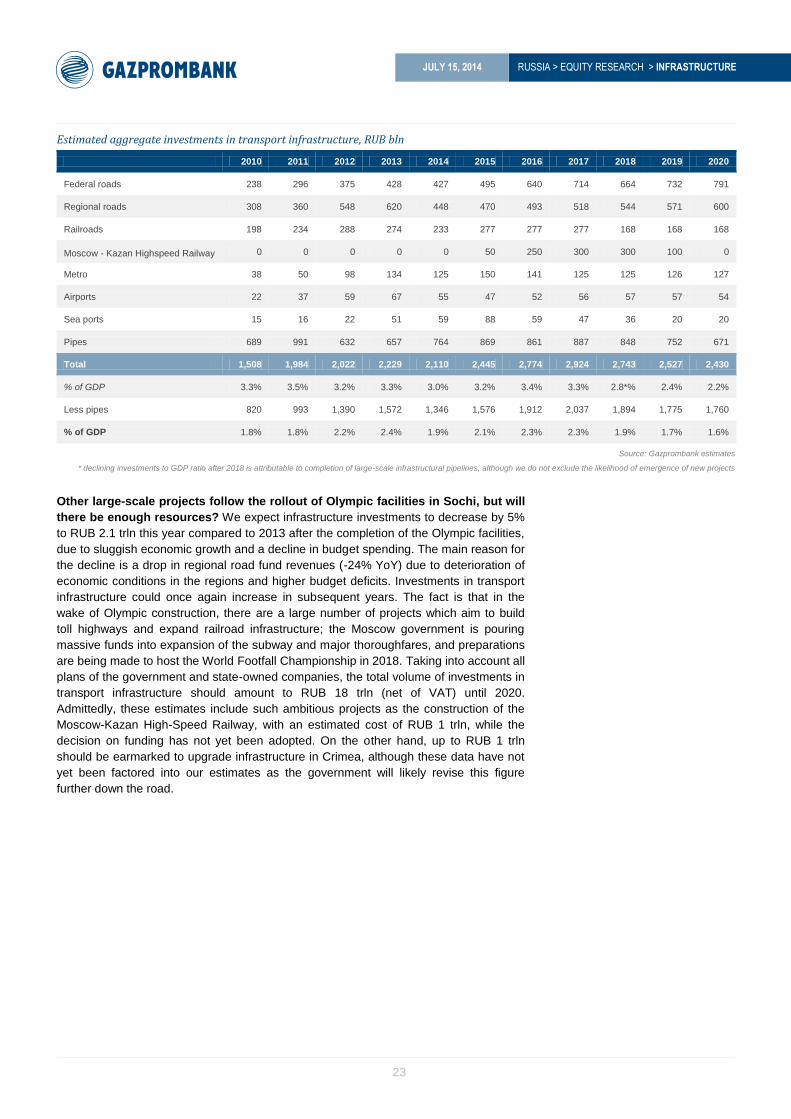
Estimated aggregate investments in transport infrastructure, RUB bln
2010 2011 2012 2013 2014 2015 2016 2017 2018 2019 2020
Federal roads 238 296 375 428 427 495 640 714 664 732 791
Regional roads 308 360 548 620 448 470 493 518 544 571 600
Railroads 198 234 288 274 233 277 277 277 168 168 168
Moscow - Kazan Highspeed Railway 0 0 0 0 0 50 250 300 300 100 0
Metro 38 50 98 134 125 150 141 125 125 126 127
Airports 22 37 59 67 55 47 52 56 57 57 54
Sea ports 15 16 22 51 59 88 59 47 36 20 20
Pipes 689 991 632 657 764 869 861 887 848 752 671
Total 1,508 1,984 2,022 2,229 2,110 2,445 2,774 2,924 2,743 2,527 2,430
% of GDP 3.3% 3.5% 3.2% 3.3% 3.0% 3.2% 3.4% 3.3% 2.8*% 2.4% 2.2%
Less pipes 820 993 1,390 1,572 1,346 1,576 1,912 2,037 1,894 1,775 1,760
% of GDP 1.8% 1.8% 2.2% 2.4% 1.9% 2.1% 2.3% 2.3% 1.9% 1.7% 1.6%
Source: Gazprombank estimates
* declining investments to GDP ratio after 2018 is attributable to completion of large-scale infrastructural pipelines, although we do not exclude the likelihood of emergence of new projects
Other large-scale projects follow the rollout of Olympic facilities in Sochi, but will
there be enough resources? We expect infrastructure investments to decrease by 5%
to RUB 2.1 trln this year compared to 2013 after the completion of the Olympic facilities,
due to sluggish economic growth and a decline in budget spending. The main reason for
the decline is a drop in regional road fund revenues (-24% YoY) due to deterioration of
economic conditions in the regions and higher budget deficits. Investments in transport
infrastructure could once again increase in subsequent years. The fact is that in the
wake of Olympic construction, there are a large number of projects which aim to build
toll highways and expand railroad infrastructure; the Moscow government is pouring
massive funds into expansion of the subway and major thoroughfares, and preparations
are being made to host the World Footfall Championship in 2018. Taking into account all
plans of the government and state-owned companies, the total volume of investments in
transport infrastructure should amount to RUB 18 trln (net of VAT) until 2020.
Admittedly, these estimates include such ambitious projects as the construction of the
Moscow-Kazan High-Speed Railway, with an estimated cost of RUB 1 trln, while the
decision on funding has not yet been adopted. On the other hand, up to RUB 1 trln
should be earmarked to upgrade infrastructure in Crimea, although these data have not
yet been factored into our estimates as the government will likely revise this figure
further down the road.

RUSSIA > EQUITY RESEARCH > INFRASTRUCTURE
JULY 15, 2014
24
Aggregate investments in transport infrastructure, RUB bln (less VAT)
Source: Gazprombank estimates
Breakdown of investments in transportation, 2014-20
Source: Gazprombank estimates
Conservative and negative development scenarios are feasible for the transport
infrastructure market. There are not many sources that can be used to boost
infrastructure, so as a conservative scenario, we assume that the volume of investments
will remain unchanged at the level of 2012-13. After completion of the Olympic facilities,
the government and investors plan simply to reallocate part of the free cash flow toward
new facilities. A negative scenario could materialize in case of substantial deterioration
in macroeconomic conditions and a decline in budgetary revenues. This scenario could
pan out if there is a sharp decline in oil prices, say to $80/bbl or less. In such cases,
infrastructure expenses are the first to be cut (mainly to support social spending) and
the reduction could be as much as 25-30%. The same thing happened during the
economic downturn in 2009.
238 296 375 428 427 495 640 714 664 732 791 308 360
548 620
448 470 493
518 544 571 600
198 234
288 274
233 277
277 277 168
168 168
0 0
0 0
0 50
250 300
300 100 0
38
50
98 134
125 150
141 125
125 126 127
689
991
632 657
764
869
861 887
848 752 671
0.0%
0.5%
1.0%
1.5%
2.0%
2.5%
3.0%
3.5%
4.0%
0
500
1,000
1,500
2,000
2,500
3,000
3,500
2010 2011 2012 2013 2014 2015 2016 2017 2018 2019 2020
FEDERAL ROADS REGIONAL ROADS RAILROADS MOSCOW - KAZAN HIGHSPEED RAILWAY METRO AIRPORTS SEA PORTS PIPES % OF GDP
25%
20%
9% 6%
5%
2%
2%
31%
FEDERAL ROADS
REGIONAL ROADS
RAILROADS
MOSCOW - KAZAN HIGHSPEED RAILWAY
METRO
AIRPORTS
SEA PORTS
PIPES

RUSSIA > EQUITY RESEARCH > INFRASTRUCTURE
JULY 15, 2014
25
How will Russian infrastructure be funded and where will the resources come from?
There are quite a few sources of funding available for infrastructure programs, but they
will all experience difficulties in expanding their revenue base over the next few years.
The sources are as follows:
Federal budget
National Wealth Fund (NWF)
Regional budgets
In-house resources and funds borrowed by natural monopolies (Gazprom, Transneft,
Russian Railways) to implement investment programs
Budgetary resources, in-house resources and funds borrowed by state company
Avtodor
Pension funds
Private investors
Federal and regional budgets
Federal and regional funds account for over half of all transport infrastructure
expenditures until 2020. Federal budget spending goes toward the repair of federal
roads, regional subsidies for maintenance of regional roads, construction and
reconstruction of airport and port infrastructure (mainly runways, mooring berths and
to conduct dredging operations, i.e. areas where private investments are not
admissible). Regional budget spending is allocated toward construction and
reconstruction of regional and municipal roads and the development of public
transport, such as subways. Specifically, in 2013, consolidated budget spending on
roads (road funds) amounted to RUB 1.24 trln. We expect road fund expenditures to
decrease by 6% vs. 2013 to RUB 1.16 trln in 2014. In our opinion, actual road fund
revenues will be even lower, by at least 10% due to a decline in the revenue base of
regional budgets.
Moscow — largest investor in transport infrastructure
Moscow’s transport infrastructure is regarded as one of the most overloaded among
the world’s largest cities. About 20% of its inhabitants spend three hours or more on
the road per day, while the average speed of vehicle traffic flow does not exceed 20
km/h, or half as fast as in European cities. In 2010, municipal authorities launched
large-scale reconstruction of highways, the subway, and the ring railroad. In 2014,
municipal and federal budget spending will amount to about RUB 400 bln, or 30% of
all expenses in Russia on transport infrastructure (not including pipelines) and
Moscow’s Gross Regional Product (GRP). The government of Moscow expects to
invest over RUB 3 trln in infrastructure until 2020. The key large-scale project
involves expanding the Moscow Subway, which, at a total cost estimated at over
RUB 1.4 trln, will expand the total length of lines by 50% to 460 km, including the
deployment of 72 new stations. Investments also include 70% renewal of rolling stock
(to be funded on public-private partnership (PPP) terms. Another RUB 1.4 trln is
slated for investment in the expansion of the road network. This amount will be used
to build new roads (78 km) and reconstruct existing roads (400 km). The program
calls for construction of the Kutuzovsky Prospekt Northern Relief Road by raising
RUB 40 bln in private investments. Consequently, the transportation environment in
the city should improve significantly. The program is to be funded from the municipal
budget by tapping loans, selling property, and using the proceeds from excise duties
and taxes. Part of the funds will be appropriated from the federal budget.

RUSSIA > EQUITY RESEARCH > INFRASTRUCTURE
JULY 15, 2014
26
Source of spending for transport infrastructure Breakdown of Moscow spending on transport infrastructure, 2014-20
Source: Gazprombank estimates Source: Moscow government
National Wealth Fund
The National Wealth Fund (NWF) could potentially spend up to 60% of its
resources (RUB 1.7 trln) on infrastructure projects. To stimulate economic growth,
the Russian government passed a resolution to use part of the NWF resources that
were formed through additional oil export revenues, for infrastructure investments. In
addition, 40% of NWF resources could be invested in any investment infrastructure
projects or deposited in Vnesheconombank, which also funds infrastructure projects.
Another 20% could be allocated for projects with the participation of the Russian
Private Investment Fund (RPIF) or Rosatom, that would each be assigned 10%, or up
to RUB 290 bln. In addition, part of these resources (RUB 474 bln) has also been
deposited in Vnesheconombank. So far, the allocation of RUB 300 bln from the fund
has been preliminarily approved for the implementation of two large infrastructure
projects: expansion of the Trans-Siberian Railroad and the Baikal-Amur Mainline as
well as the Central Ring Road in the suburbs of Moscow.
Meanwhile, another RUB 150 bln project targeting construction of the Moscow-Kazan
High-Speed Railway has been postponed. Perhaps funds will be channeled into
upgrade of the transport infrastructure in Crimea, including a bridge across the Kerch
Strait, with an estimated cost of RUB 200 bln. The Economy Ministry also plans to tap
NWF resources in such projects as expansion of the Moscow Aviation Hub,
development of the Elegest coal field, construction of the Elegest-Kyzyl-Kuragino
railroad, construction of smart power grids, expansion of the Baikal-Amur Mainline and
Trans-Siberian Railroad, and construction of the Khankhikivi-1 NPP in Finland.
State monopolies: Russian Railways, Gazprom, Transneft and Avtodor
These companies will account for about 40% of all investments in transport
infrastructure in 2014-20. The bulk of these funds will be expenditures incurred by
Gazprom and Transneft for pipeline construction. According to the investment programs
of both monopolies, their infrastructure outlays can be expected to rise in the coming
years, due to the construction of South Stream and Power of Siberia. On the other hand,
the government insists that the monopolies cut their expenses and freeze their tariffs,
which means that some investment programs could be reduced in comparison with the
previous years.
Pension funds
In many countries, pension funds act as the main source of funding for long-term
infrastructure projects. However, these resources are still quite small in Russia given
that the Pension Fund is running a deficit, so their further accretion would appear to be
dubious. As of end 2013, the cumulative component of the Pension Insurance Fund (at
the disposal of a state management company and private management companies)
32% 30% 28% 29% 32% 37% 41%
22% 21% 19% 18% 20%
23% 25% 2% 2% 10% 12% 14%
7% 3%
44% 42% 38% 37% 34% 33% 31%
0%
20%
40%
60%
80%
100%
120%
2014 2015 2016 2017 2018 2019 2020
FEDERAL BUDGET REGIONAL BUDGETS
NATIONAL WEALTH FUND PRIVATE INVESTORS
NATURAL MONOPOLIES
1,408; 44%
1,445; 45%
357; 11%
METRO
STREETS AND ROADS
RAILROADS
RUB 3,210 BLN
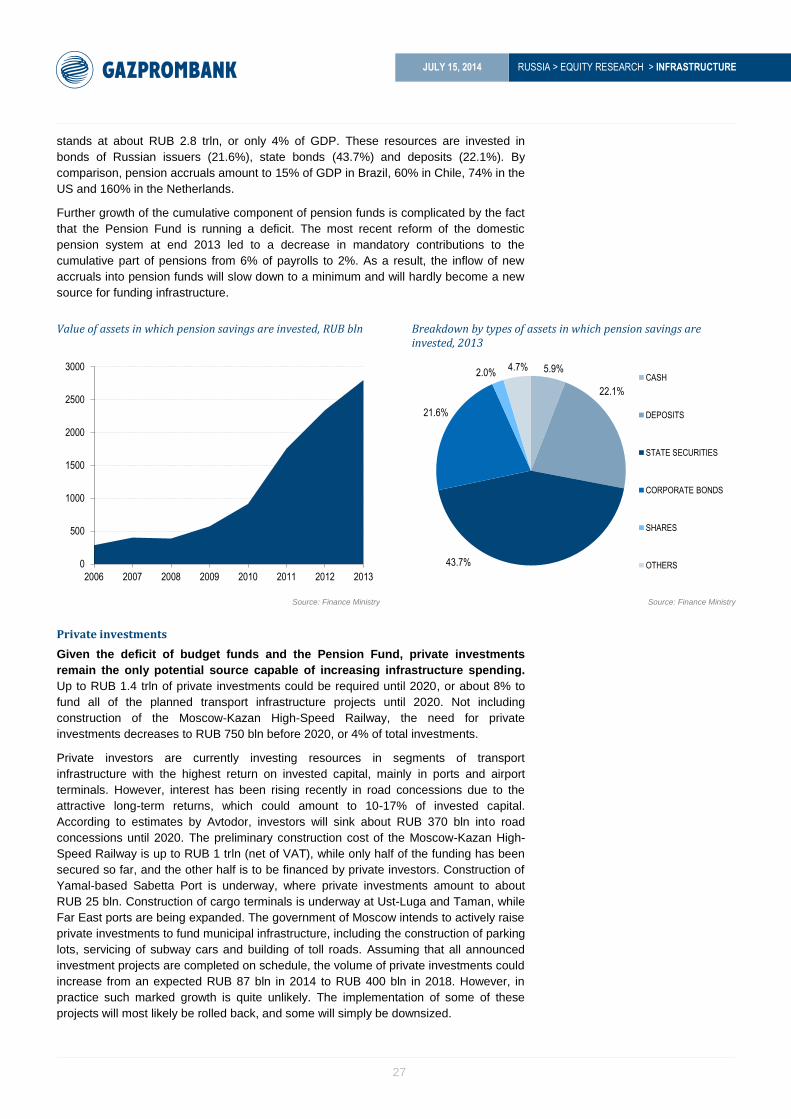
RUSSIA > EQUITY RESEARCH > INFRASTRUCTURE
JULY 15, 2014
27
stands at about RUB 2.8 trln, or only 4% of GDP. These resources are invested in
bonds of Russian issuers (21.6%), state bonds (43.7%) and deposits (22.1%). By
comparison, pension accruals amount to 15% of GDP in Brazil, 60% in Chile, 74% in the
US and 160% in the Netherlands.
Further growth of the cumulative component of pension funds is complicated by the fact
that the Pension Fund is running a deficit. The most recent reform of the domestic
pension system at end 2013 led to a decrease in mandatory contributions to the
cumulative part of pensions from 6% of payrolls to 2%. As a result, the inflow of new
accruals into pension funds will slow down to a minimum and will hardly become a new
source for funding infrastructure.
Value of assets in which pension savings are invested, RUB bln Breakdown by types of assets in which pension savings are
invested, 2013
Source: Finance Ministry Source: Finance Ministry
Private investments
Given the deficit of budget funds and the Pension Fund, private investments
remain the only potential source capable of increasing infrastructure spending.
Up to RUB 1.4 trln of private investments could be required until 2020, or about 8% to
fund all of the planned transport infrastructure projects until 2020. Not including
construction of the Moscow-Kazan High-Speed Railway, the need for private
investments decreases to RUB 750 bln before 2020, or 4% of total investments.
Private investors are currently investing resources in segments of transport
infrastructure with the highest return on invested capital, mainly in ports and airport
terminals. However, interest has been rising recently in road concessions due to the
attractive long-term returns, which could amount to 10-17% of invested capital.
According to estimates by Avtodor, investors will sink about RUB 370 bln into road
concessions until 2020. The preliminary construction cost of the Moscow-Kazan High-
Speed Railway is up to RUB 1 trln (net of VAT), while only half of the funding has been
secured so far, and the other half is to be financed by private investors. Construction of
Yamal-based Sabetta Port is underway, where private investments amount to about
RUB 25 bln. Construction of cargo terminals is underway at Ust-Luga and Taman, while
Far East ports are being expanded. The government of Moscow intends to actively raise
private investments to fund municipal infrastructure, including the construction of parking
lots, servicing of subway cars and building of toll roads. Assuming that all announced
investment projects are completed on schedule, the volume of private investments could
increase from an expected RUB 87 bln in 2014 to RUB 400 bln in 2018. However, in
practice such marked growth is quite unlikely. The implementation of some of these
projects will most likely be rolled back, and some will simply be downsized.
0
500
1000
1500
2000
2500
3000
2006 2007 2008 2009 2010 2011 2012 2013
5.9%
22.1%
43.7%
21.6%
2.0% 4.7%
CASH
DEPOSITS
STATE SECURITIES
CORPORATE BONDS
SHARES
OTHERS

RUSSIA > EQUITY RESEARCH > INFRASTRUCTURE
JULY 15, 2014
28
Estimated need for private invwestments to finance transport infrastructure, RUB bln
Source: Gazprombank estimates
Degree of attractiveness of infrastructure objects for investors
SECTOR INVESTMENT ATTRACTIVENESS
COMMENTARY
Port infrastructure (containers and grain terminals)
High Investment in expansion of port infrastructure, in particular the construction of containers and grain terminals, is the most attractive, in our view. The payback period for such projects may be 5-7 years, assuming the territory is prepared for terminals construction.
Airport passenger terminals
High
Passenger terminals of large airports with passenger flow of at least 1 mln per year are attractive. Essentially, these comprise commercial real estate that concentrates a large number of passengers with high income levels, which allows the setting of high rental rates. Moreover, airports in Russia occupy a virtual monopoly position in a given region.
Road concessions Medium Investment in road infrastructure through concessions is considered more risky than in port or airport terminals. They require closer cooperation with the government and are more dependent on changes in the macroeconomic environment.
Port terminals (commodities)
Medium Most commodity port terminals in Russia are owned by large commodity companies that aim to control the entire transportation chain and their transportation expenses.
Railroad concessions Low In Russia, private investors do not invest directly in railroad infrastructure, but global practice shows that the attractiveness of investment in railroad concessions is relatively low due to excessive capex and a long payback period.
Source: Gazprombank estimates
Russian roads: fighting ‘disaster’ brings noticeable results
Over 50% of total investments in transport infrastructure is comprised of road
construction and maintenance. After decades of underfunding in road construction,
the situation is gradually improving. Road funds have been restored, they are receiving
higher state budget funding, and fuel excise taxes are being hiked, but the most
important is the evolving public-private partnership (PPP) in road concession
agreements, which is becoming more attractive for investors with each year. Thus, for
instance, unlike previously when 1-2 local contractors participated in tenders for
sections of the Moscow – St. Petersburg toll road, now 3-4 companies are participating
in new tenders for construction of other sections of the road. Bridge construction over
the Lena River was contested by two consortia with the support of foreign construction
companies (China Construction Corporation and Vinci).
We refer to the consolidated federal budget, which provides data on the size of federal and
regional road funds. Since 2010 they have more than doubled to reach RUB 1.2 trln in
2013, accounting for nearly 2% of GDP. This is substantially lower than China’s spending
on road construction, but much higher than the developed markets’ level of less than 1%
of GDP. By our estimates based on forecasts of the federal special-purpose program
‘Development of the Russian transportation system until 2020’, investments in road
construction and reconstruction in 2014-20 may total around RUB 8.4 trln (adjusted for
18% VAT and 90% performance of the target).
70
239
376 380
237
87 70 70
114
151 155
102 87
70
0
50
100
150
200
250
300
350
400
2014 2015 2016 2017 2018 2019 2020
INCLUDING CONSTRUCTION OF MOSCOW - KAZAN HIGHSPEED RAILWAY
EXCLUDING CONSTRUCTION OF MOSCOW - KAZAN HIGHSPEED RAILWAY

RUSSIA > EQUITY RESEARCH > INFRASTRUCTURE
JULY 15, 2014
29
Road funds, RUB bln
Source: Finance Ministry, consolidated state budget for 2010–13
In 2014 a 100% normative funding of federal road repair and maintenance will be
launched, also via introduction of charges for heavy haul vehicles. Russia has a
three-level road network including federal, regional and municipal roads. The total length
of federal roads is 51,000 km, or only 5% of the overall network (1.1 mln km), however
these are precisely the key routes for cargoes and support liaison between regions. The
government’s primary goal is deep reconstruction and adjustment of these roads to
normative levels. We anticipate that total investments in federal road reconstruction will
reach nearly RUB 430 bln in 2014 and stand at around RUB 800 bln by 2020. According
to the federal special-purpose program outlook, road construction volumes will grow
from 566 km this year to 1,345 km in 2020. Federal road financing comes from the
federal road fund, which accumulates federal budget funds as well as 28% of fuel excise
tax proceeds. A potential decline in budget income caused by a drop in oil prices could
hinder the government’s plans. As a rule, budget funding of infrastructure objects would
be the first to get cut in this case.
One of the additional sources of federal road funding will be the introduction of charges
for the passage of heavy-haul vehicles (total weight of over 12 tonnes) along federal
roads. The underlying idea is that heavy trucks cause the most severe damage to roads,
and therefore they are required to offset repair costs. The charge is expected to stand at
RUB 3.5/km and will be adjusted for inflation annually. This will facilitate the
accumulation of over RUB 100 bln annually in the federal road fund. The project was
initially expected to kick off in 2014, but was later rescheduled for 2017, as the
controlling and levying mechanisms are still pending. There were numerous
postponements of the tender date to develop digital controlling and levying systems, but
it will likely finally be determined this year.
Target indicators of Russia’s motor roads
TAREGET INDICATORS OF RUSSIA’S ROADS DEVELOPMENTS
2010 2011 2012 2013 2014 2015 2016 2017 2018 2019 2020
Length of federal roads, compliant with normative requirements, km
19,545 19,755 21,098 23,225 26,923 31,561 36,505 41,501 44,085 45,362 46,040
Share of length of federal roads, compliant with normative requirements, %
39% 39% 42% 46% 53% 62% 71% 79% 83% 85% 85%
Construction and reconstruction of roads of federal importance, km
411.9 309.6 355.2 451.5 566.2 652.5 734.2 1159.5 1296.7 1199.1 1344.8
Source: Federal special-purpose program
281 349 442 504 508
364
425
646
731 554
98%
93%
91%
96% 96%
89%
86%
83% 84% 84%
75%
80%
85%
90%
95%
100%
0
200
400
600
800
1000
1200
1400
2010 2011 2012 2013 2014E
REGIONAL ROAD FUNDS
FEDERAL ROAD FUND
PERFORMANCE OF FEDERAL ROAD FUND TARGET, %
PERFORMANCE OF REGIONAL ROAD FUNDS TARGET, %

RUSSIA > EQUITY RESEARCH > INFRASTRUCTURE
JULY 15, 2014
30
Reconstruction of regional roads: money is expected from fuel excise tax hike,
but will it actually happen? The total length of regional roads is about 450,000 km,
while their quality differs strikingly depending on the region. Regional roads are financed
from regional road funds accumulating transport tax gains, the lion’s share of fuel excise
tax gains (72%), as well as federal budget subsidies. The government has approved a
fuel excise hike schedule until 2016 with a breakdown into various fuel types that is
expected to lead to an increase in road funds. An excise hike, however, will cause
gasoline price to increase on average by RUB 1-3 for end consumers, which might
trigger public disapproval. The problem might be exacerbated in case of ruble
devaluation and an oil price increase leading to more expensive gasoline, even if an
excise hike does not occur. Moreover, the government intends to conduct a tax
maneuver in the oil and gas sector, which will change the road funds funding pattern via
fuel excises. In 2013, proceeds from regional road funds were planned at RUB 867 bln
(+12% YoY), while the actual figure missed the target by 16%, standing at RUB 731 bln.
The consolidated budget for 2014 specifies a 24% decline in regional road funds
proceeds (to RUB 658 bln) amid a serious deterioration of the regional economy, a
reduction of budgetary earnings as well as the need to allocate fuel excise proceeds to
other projects. Notably, the share of excises in the price of 1 liter of gasoline in Russia
does not exceed 17% vs. almost 50% in Western Europe.
Fuel excise dynamic, RUB/tonne
Source: Gazprombank
0
2,000
4,000
6,000
8,000
10,000
12,000
14,000
LOWER THAN CLASS 3 CLASS 3 GASOLINE CLASS 4 GASOLINE CLASS 5 GASOLINE CLASS 5 DIESEL
SINCE JAN 1,2012 SINCE JUL 1, 2012 SINCE JAN 1,2013
SINCE JUL 1, 2013 SINCE JAN 1,2014 SINCE JAN 1,2015

RUSSIA > EQUITY RESEARCH > INFRASTRUCTURE
JULY 15, 2014
31
Avtodor: road concessions promise high yields
Federal Road Agency Avtodor will raise over RUB 300 bln in private
investments via road concessions until 2020. In 2009, the government founded
the state corporation Avtodor, which focuses on forming the backbone high-speed
federal road network and solicitation of private investors. Avtodor assumed control
over three existing federal roads: М-4 Don (Moscow – Novorossiysk), М-1 (Moscow
– Russia-Belarus border) and М-3 (Moscow – Russia-Ukraine border) with a total
length of 2,500 km. The corporation is currently engaged in large-scale
reconstruction of these roads, leading to an increase of the speed limit on some
sections from 90 km/h to 150 km/h. At the same time, some previously toll -free
sections have become toll-ways (where a toll-free alternative is feasible). The
average fee on these sections approaches RUB 1.5-2.0/km for passenger cars,
which is cheaper than in Europe. Avtodor is also responsible for the construction of
new high-speed toll-roads: Moscow – St. Petersburg (total length of 670 km) and
the Central Ring Road of Moscow Region (total length of 521 km). Both
constructions should be finalized before the 2018 FIFA World Cup, which basically
guarantees priority financing vs. other transport sector projects. The overall
construction cost exceeds RUB 600 bln. Both roads should substantially raise the
transportation efficiency of Russia’s central part while also contributing to the
development of transportation corridors.
Existing and prospective roads managed by Avtodor
Source: Avtodor
UFA
TULAKIROV
TVER
STAVROPOL
ARKHANGELSK
KURGAN
OREL
PSKOV
MURMANSK
VOLOGDA
KOSTROMA
PETROZAVODSK
NOVOROSSIYSK
SYKTYVKAR
VELIKY NOVGOROD
VORONEZH
SARATOV
IZHEVSK
YAROSLAVL
MOSCOW
ST. PETERSBURG
MAKHACHKALA
ORENBURG
RYAZAN
PENZA
LIPETSK
PERM
CHELYABINSK
ROSTOV-ON-DON
VOLGOGRAD
OMSK
ASTRAKHANELISTA
BELGOROD
1 М-1 BELARUS
2 М-3 UKRAINE
3 М-4 DON
4 М-11 MOSCOW —ST. PETERSBURG
Central Ring Road of the Moscow Region
5
2
3
4
Roads and high-speed highways
transferred into trust management
of Avtodor
Roads and high-speed highways
under construction transferred into
trust management of Avtodor
Perspective roads and high-speed
highways to be launched by 2030
5SMOLENSK
1
BRYANSK
KALUGA
KRASNODAR
VLADIMIR
ULYANOVSK
NIZHNY
NOVGOROD
KAZAN
SAMARA TYUMEN
YEKATERINBURG
TAMBOV
POPULATION DENSITY
UKRAINE
BELARUS
KAZAKHSTAN
0-10K PEOPLE.
60+K PEOPLE.
40-50K PEOPLE.
20-30K PEOPLE
10-20K PEOPLE.
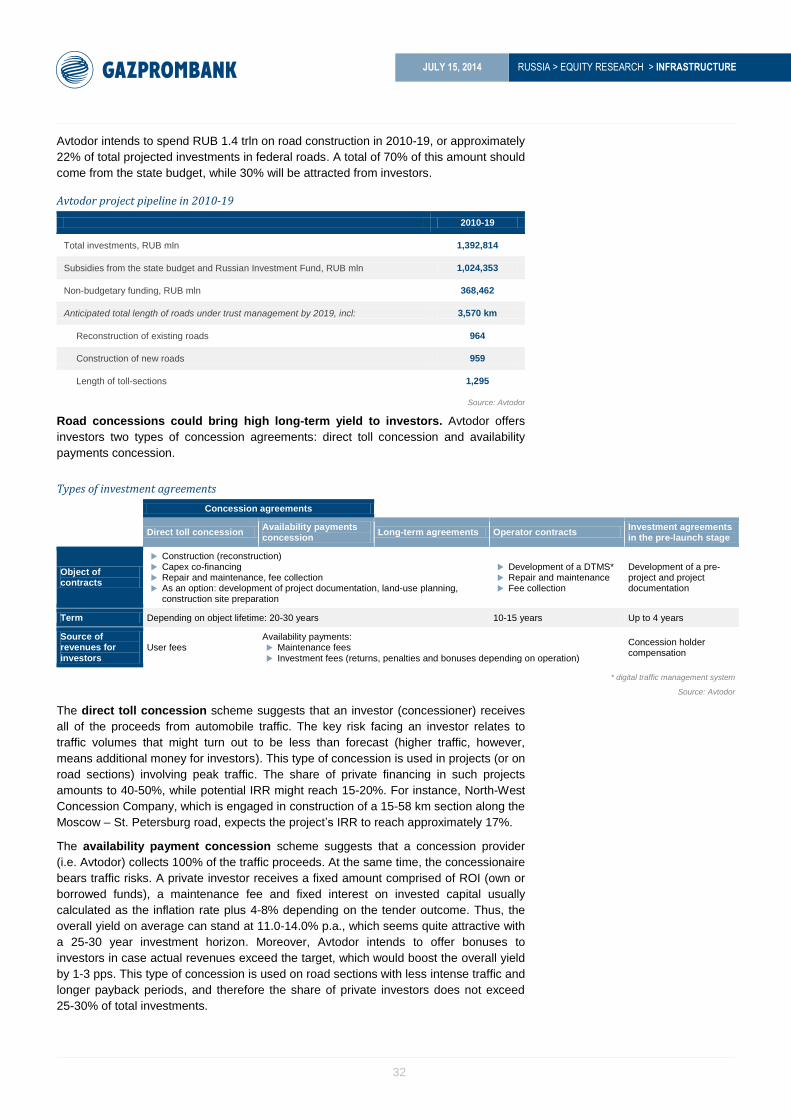
RUSSIA > EQUITY RESEARCH > INFRASTRUCTURE
JULY 15, 2014
32
Avtodor intends to spend RUB 1.4 trln on road construction in 2010-19, or approximately
22% of total projected investments in federal roads. A total of 70% of this amount should
come from the state budget, while 30% will be attracted from investors.
Avtodor project pipeline in 2010-19
2010-19
Total investments, RUB mln 1,392,814
Subsidies from the state budget and Russian Investment Fund, RUB mln 1,024,353
Non-budgetary funding, RUB mln 368,462
Anticipated total length of roads under trust management by 2019, incl: 3,570 km
Reconstruction of existing roads 964
Construction of new roads 959
Length of toll-sections 1,295
Source: Avtodor
Road concessions could bring high long-term yield to investors. Avtodor offers
investors two types of concession agreements: direct toll concession and availability
payments concession.
Types of investment agreements
Concession agreements
Direct toll concession Availability payments concession
Long-term agreements Operator contracts Investment agreements in the pre-launch stage
Object of contracts
Construction (reconstruction) Capex co-financing Repair and maintenance, fee collection As an option: development of project documentation, land-use planning,
construction site preparation
Development of a DTMS* Repair and maintenance Fee collection
Development of a pre-project and project documentation
Term Depending on object lifetime: 20-30 years 10-15 years Up to 4 years
Source of revenues for investors
User fees Availability payments: Maintenance fees Investment fees (returns, penalties and bonuses depending on operation)
Concession holder compensation
* digital traffic management system
Source: Avtodor
The direct toll concession scheme suggests that an investor (concessioner) receives
all of the proceeds from automobile traffic. The key risk facing an investor relates to
traffic volumes that might turn out to be less than forecast (higher traffic, however,
means additional money for investors). This type of concession is used in projects (or on
road sections) involving peak traffic. The share of private financing in such projects
amounts to 40-50%, while potential IRR might reach 15-20%. For instance, North-West
Concession Company, which is engaged in construction of a 15-58 km section along the
Moscow – St. Petersburg road, expects the project’s IRR to reach approximately 17%.
The availability payment concession scheme suggests that a concession provider
(i.e. Avtodor) collects 100% of the traffic proceeds. At the same time, the concessionaire
bears traffic risks. A private investor receives a fixed amount comprised of ROI (own or
borrowed funds), a maintenance fee and fixed interest on invested capital usually
calculated as the inflation rate plus 4-8% depending on the tender outcome. Thus, the
overall yield on average can stand at 11.0-14.0% p.a., which seems quite attractive with
a 25-30 year investment horizon. Moreover, Avtodor intends to offer bonuses to
investors in case actual revenues exceed the target, which would boost the overall yield
by 1-3 pps. This type of concession is used on road sections with less intense traffic and
longer payback periods, and therefore the share of private investors does not exceed
25-30% of total investments.

RUSSIA > EQUITY RESEARCH > INFRASTRUCTURE
JULY 15, 2014
33
Investor payout scheme
Direct toll Availability payments
Source: Avtodor Source: Avtodor
There are other types of investment agreements with Avtodor available, but these are
mostly service contracts and suggest smaller-scale investments as opposed to
concessions.
Avtodor has already launched several PPP projects. The first such project – a new exit
from the Federal Highway M-1 (Belarus Highway) Moscow-Minsk to the Moscow Ring
Road with a length of 18.5 km – was completed in late 2013. Four out of five sections of
the Moscow – St. Petersburg toll-way and one section of the Central Ring Road of
Moscow region are currently under construction. Respective operator contracts have
been signed with investors for servicing of the М-4 Don road.
Current PPP projects in road construction
PROJECT NAME LENGTH, KM
TRAFFIC, ‘000 CARS PER DAY
TOTAL INVESTMENTS, RUB BLN
SHARE OF PRIVATE INVESTMENTS
CONSTRUCTION PERIOD
CONTRACT TYPE
CONCESSION TERM, YEARS
PRIVATE INVESTORS
М-1 Belarus (Odintsovo bypass)
18.5 N/A ~23.7 100% 2010-13 Direct toll 99
Glavnaya Doroga Consortium: AM Lider, Brisa, FCC Construction, Alpine Bau, Stroytransgazconsulting
Moscow – St. Petersburg (15-58 km)
43 77 56 60% 2011-14 Direct toll 26
North West Concession Company: Mostotrest and Vinci JV
Moscow – St. Petersburg (258-334 km)
72 12-15 60 10% 2012-15 Availability payments
22 Mostotrest
Moscow – St. Petersburg (334-543 km)
217 15-2 159 10% 2014-18 Availability payments
26 Mostotrest
Moscow – St. Petersburg (543-684 km)
139 22-26 83 30% 2015-17 Availability payments
27
Two Capital Cities Highway Consortium: VTB Capital, Vinci
M-4 Don (517-544 km) 29 8.4-9 17.4 11% 2014-16
Long-term investment
contract
23
Mostotrest
Western High-Speed Diameter, central section
12 N/A ~100 50% 2013-13 Direct toll 30
Northern capital city highway consortium: VTB Capital, Gazprombank,
OPERATION STAGE(MAINTENANCE — REPAIR — OVERHAUL)
CONCESSIONAIRE
Investors(shareholders)
Financing banks
TOLL ROAD
PROCEEDS
LOAN
REPAYMENTROI
OPERATION STAGE(MAINTENANCE — REPAIR — OVERHAUL)
CONCESSIONAIRE
Investors(shareholders)
Financing banks
TOLL ROAD
PROCEEDS
LOAN
REPAYMENTROI
AVTODOR
OPERATION CHARGES

RUSSIA > EQUITY RESEARCH > INFRASTRUCTURE
JULY 15, 2014
34
PROJECT NAME LENGTH, KM
TRAFFIC, ‘000 CARS PER DAY
TOTAL INVESTMENTS, RUB BLN
SHARE OF PRIVATE INVESTMENTS
CONSTRUCTION PERIOD
CONTRACT TYPE
CONCESSION TERM, YEARS
PRIVATE INVESTORS
Astaldi, Ictas Insaat, VEB, EBRD
Central Ring Road (1st stage)
49.5 33-39 64.8 10% 2014-18
Long-term investment
contract
23
Stroytransgazconsulting
Bridge over the Lena river
21 N/A 54.9 - 2014-21 15
Transport concessions consortium (Sakha): VTB Capital, Stroyproekt, Bamstroymekhanizatsiya, Construction company Most
Source: Gazprombank
In 2014-15 Avtodor intends to arrange around 10 tenders with a total value of more than
RUB 700 bln and attract around RUB 200 bln in private investments. Therefore, there
will be an increasing need to finance these projects with the help of infrastructure bonds
and bank loans.
Currently planned PPP projects in road construction field
NAME OF SITE LENGTH, KM (TOLL SECTION)
TYPE OF PPP TENDER PERIOD
CONSTRUCTION PERIOD
TOTAL CAPEX SHARE OF PRIVATE CAPITAL
ESTIMATED TRAFFIC, ‘000 CARS PER DAY
CONCESSION PERIOD, YEARS
M-1 Belarus 33-456 km
347 Availability payments 2014 2014-25 197 35% 23-38 30
M-4 Don 21-225 km
151 Owner-operator contract (О&M)
2014 2014-15 7.6 45% 20-37 10
M-4 Don 633-715 km
84 Availability payments 2014-15 2015-17 33 25% 13-15 25-30
M-4 Don 1,091-1,319 km
207 Owner-operator contract
2014 2014-15 14 50% 12-18 20-30
Moscow-St. Petersburg 58-149 km
90 Concessionary agreement (direct toll)
2014 2015-17 64.7 40% 20-23 30
Bridge over Kerch straight
5 n/a 2015-16 2016-20 200 n/a n/a n/a
New exit to Moscow Ring Road from M-7 Volga (bypass around Balashikha and Noginsk)
69 Concessionary agreement
2015-16 2017-20 60.7 48% 95-110 30
Central Ring Road (3rd start-up facility)
105 Availability payments To be confirmed 72.8 35% 30-40 30
Central Ring Road (4th start-up facility)
97 Availability payments 2015-17 68.9 35% 30-40 30
Total 1,361 706.3
Source: Avtodor Russian Highways
Glavnaya Doroga Consortium: first completed PPP project in the road construction field
The end of 2013 saw the completion of the first PPP project to build a bypass road
around Odintsovo in Moscow Region (exit to the Moscow Ring Road from the federal
highway M-1 Belarus Moscow-Minsk) with a length of 18.5 km. The Glavnaya Doroga
International Consortium includes AM Leader (with a 50% share), Brisa (10%), FCC
Construction (15%), Alpine Bau (15%) and Stroygazconsulting (10%). The total
volume of investment stood at about RUB 23.7 bln. The project was financed through
bank loans and infrastructure bonds, with Gazprombank acting as a financial
consultant for the project.

RUSSIA > EQUITY RESEARCH > INFRASTRUCTURE
JULY 15, 2014
35
Key market players: competition tightens after the Olympics
A road concession is a complex and capital-intensive project that requires profound
technical knowledge and long-term financial resources. Therefore, winning a tender
requires the formation of a consortium of investors, usually comprising representatives
of financial institutions, Russian construction companies, and foreign construction and/or
consulting companies, which possess international expertise in managing toll roads. The
key players on the Russian road concession market include:
Financial institutions: Gazprombank, Sberbank, VTB Capital.
Russian construction companies: Mostotrest, Stroygazconsulting, SK Most.
Foreign construction companies: Vinci (Road Moscow–St. Petersburg), Alpine
Bau/FCC Construction/Brisa (exit to the Moscow Ring Road from the federal
highway M-1 Belarus Moscow–Minsk), Astaldi/Ictas Insaat (Western High-Speed
Diameter).
The completion of the Olympic facilities frees up significant construction resources that will
be involved in the building of new roads. For instance, such companies as Scientific
Production Association Mostovik, Crocus and Stroygazconsulting have expressed interest in
road construction, despite their historically marginal exposure to the sector.
Railway infrastructure: removing bottlenecks and building high-speed lines
Railway infrastructure accounts for 85% of total cargo turnover in Russia (net of
pipeline transportation). Russia ranks third in terms of rail lines length amounting to
86,000 km, after the US (250,000 km) and China (97,000 km). The cargo turnover
breakdown is dominated by coal, oil and products, construction materials and iron ore.
For large industrial enterprises, especially exporters, efficient operation of the railway
infrastructure is crucial in making decisions to boost production. However, a
considerable lack of funding in the railway infrastructure segment coupled with an
increased number of freight cars on the network lead to so-called bottlenecks – road
sections with limited traffic capabilities. This, in turn, will result in an extended idle period
for rail cars and prevent timely cargo pick-up, exerting an extremely negative impact on
the overall cargo turnover of the Russian railway network.
Length of railway lines Cargo turnover breakdown, by type of transportation
Source: World Bank, Gazprombank estimates Source: Russian Railways
53.41
23.73
4.99 6.90
19.46
5.84 3.50 9.00
0.00
10.00
20.00
30.00
40.00
50.00
60.00
0.0
50.0
100.0
150.0
200.0
250.0
EU
US
RU
SS
IA
CH
INA
IND
IA
CA
NA
DA
BR
AZ
IL
AR
GE
NT
INA
LENGHTH OF RAILWAY LINES, '000 KM
DENSITY OF RAILWAY LINES, KM PER 1,000 KM
17%
21%
31%
53%
53%
85%
77%
31%
29%
40%
33%
9%
6%
48%
40%
7%
14%
6%
0% 20% 40% 60% 80% 100%
EU
CHINA
BRAZIL
US
INDIA
RUSSIA
BY RAIL BY ROAD BY SEA

RUSSIA > EQUITY RESEARCH > INFRASTRUCTURE
JULY 15, 2014
36
Rail cargo volume breakdown, 2013 Average level of transportation component in the price of rail cargo
Source: Russian Railways Source: Russian Railways
Major rail cargo traffic routes
Source: Russian Railways
Railway infrastructure is not coping with growth in cargo turnover and is thus
contributing to the economic slowdown. The total length of bottlenecks stood at
8,100 km (9.4% of the total length of the railway network) in 2013 and is increasing by
500 km per year. The bottlenecks largely occur at approaches to sea ports, in Kuzbass
(where a major volume of coal is mined) and sections of the Trans-Siberian Railroad
and Baikal-Amur Mainline. According to Center for Strategic Research Foundation
estimates, should a lack of funding occur, the length of the bottlenecks in 2015 could
reach 14,500 km (17% of the total rail network) and 19,200 km (22%) in 2020. The
major negative outcome of such bottlenecks would involve more frequent failures of
outbound transportation, with warehousing volumes reaching 100-200 mln tonnes.
These estimates are based on the country’s economic development outlook, the
production dynamic of select industries, and Russian Railways’ ability to handle the
additional cargo volumes. “The amount of investment needed to remove the bottlenecks
29%
23% 16%
10%
22%
COAL OIL AND PRODUCTS
CONSTRUCTION MATERIALS IRON ORE
OTHER CARGO
34%
29%
19% 17% 15% 15%
13% 10% 9% 8% 7% 6%
0%
5%
10%
15%
20%
25%
30%
35%
40%
ST
EA
M C
OA
L
TIM
BE
R
CO
CK
ING
CO
AL
CR
UD
E O
IL
IRO
N O
RE
CE
ME
NT
FU
EL
OIL
NIT
RO
GE
N F
ER
TIL
IZE
RS
GR
AIN
PIG
IRO
N
DIE
SE
L F
UE
L
ALU
MIN
UM
MOSCOW
MURMANSK
VANINO
NAKHODKA
VOSTOCHNIY
VLADIVOSTOK
VYSOTSK
PRIMORSKUST-LUGA
NOVORSSIYSK
TUAPSE
ROSTOV-ON-DON
KALININGRAD
Coal
Oil
Iron ore
Ferrous metals
Grain
KUZNETSK COAL BASIN (KUZBASS)
FIELDS IN EAST SIBERIA
PECHORA BASIN
DEPOSITS IN THE URALS
DONETSAK COAL BASIN
KURSK MAGNETIC ANOMALY
WESTERN SIBERIA OIL AND GAS BEARING PROVINCE
VOLGA-URAL OIL AND GAS BEARING PROVINCE
METALLURGICAL PLANTS IN KUZBASS
METALLURGICAL PLANTS IN THE NORTH WEST
METALLURGICAL PLANTS IN THE CENTRAL PART
METALLURGICAL PLANTS IN THE URALS
ST. PETERSBURG
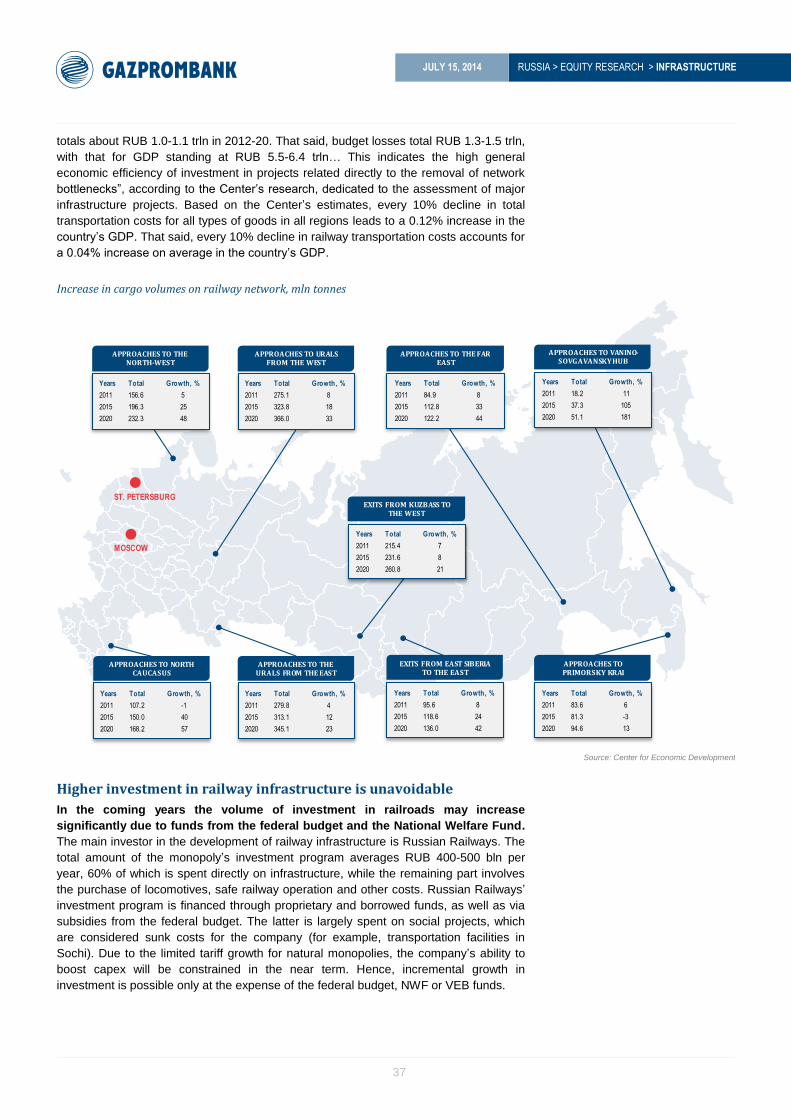
RUSSIA > EQUITY RESEARCH > INFRASTRUCTURE
JULY 15, 2014
37
totals about RUB 1.0-1.1 trln in 2012-20. That said, budget losses total RUB 1.3-1.5 trln,
with that for GDP standing at RUB 5.5-6.4 trln… This indicates the high general
economic efficiency of investment in projects related directly to the removal of network
bottlenecks”, according to the Center’s research, dedicated to the assessment of major
infrastructure projects. Based on the Center’s estimates, every 10% decline in total
transportation costs for all types of goods in all regions leads to a 0.12% increase in the
country’s GDP. That said, every 10% decline in railway transportation costs accounts for
a 0.04% increase on average in the country’s GDP.
Increase in cargo volumes on railway network, mln tonnes
Source: Center for Economic Development
Higher investment in railway infrastructure is unavoidable
In the coming years the volume of investment in railroads may increase
significantly due to funds from the federal budget and the National Welfare Fund.
The main investor in the development of railway infrastructure is Russian Railways. The
total amount of the monopoly’s investment program averages RUB 400-500 bln per
year, 60% of which is spent directly on infrastructure, while the remaining part involves
the purchase of locomotives, safe railway operation and other costs. Russian Railways’
investment program is financed through proprietary and borrowed funds, as well as via
subsidies from the federal budget. The latter is largely spent on social projects, which
are considered sunk costs for the company (for example, transportation facilities in
Sochi). Due to the limited tariff growth for natural monopolies, the company’s ability to
boost capex will be constrained in the near term. Hence, incremental growth in
investment is possible only at the expense of the federal budget, NWF or VEB funds.
MOSCOW
ST. PETERSBURG
Years Total Growth, %
2011 83.6 6
2015 81.3 -3
2020 94.6 13
APPROACHES TO PRIMORSKY KRAI
Years Total Growth, %
2011 95.6 8
2015 118.6 24
2020 136.0 42
EXITS FROM EAST SIBERIA TO THE EAST
Years Total Growth, %
2011 279.8 4
2015 313.1 12
2020 345.1 23
APPROACHES TO THE URALS FROM THE EAST
Years Total Growth, %
2011 107.2 -1
2015 150.0 40
2020 168.2 57
APPROACHES TO NORTH CAUCASUS
APPROACHES TO VANINO-SOVGAVANSKYHUB
Years Total Growth, %
2011 84.9 8
2015 112.8 33
2020 122.2 44
APPROACHES TO THE FAR EAST
Years Total Growth, %
2011 215.4 7
2015 231.6 8
2020 260.8 21
EXITS FROM KUZBASS TO THE WEST
Years Total Growth, %
2011 156.6 5
2015 196.3 25
2020 232.3 48
APPROACHES TO THE NORTH-WEST
Years Total Growth, %
2011 18.2 11
2015 37.3 105
2020 51.1 181
Years Total Growth, %
2011 275.1 8
2015 323.8 18
2020 366.0 33
APPROACHES TO URALS FROM THE WEST

RUSSIA > EQUITY RESEARCH > INFRASTRUCTURE
JULY 15, 2014
38
Russian Railways’ investment program, RUB bln
Source: Russian Railways, Gazprombank estimates
Sources of funding for Russian Railways’ investment program
Source: Russian Railways
Expansion of the Baikal-Amur Mainline and the Trans-Siberian Railroad (Eastern
Polygon) — the fight against bottlenecks has begun. The Russian government has
decided to tackle the removal of bottlenecks along the railway network. The draft law to
upgrade the Trans-Siberian Railroad and Baikal-Amur Mainline by 2018 has been
approved, which should facilitate an increase in rail capacity by 55 mln tonnes to 271
mln tonnes. The total cost of the project amounts to RUB 560 bln, which Russian
Railways will not be able to compensate through existing tariffs (as the main type of
cargo delivered via railroad is low-tariff coal), hence the project will be partly financed
using funds from the federal budget (RUB 110 bln) and the National Welfare Fund (RUB
150 bln). Project implementation will allow coal companies to significantly boost coal
transportation volumes from Kuzbass to Far East ports and for further export to Asian
markets. In 2013, about 120 mln tonnes of coal was exported to Asia, meaning that
once the infrastructure modernization is completed, this amount might increase by 30%.
However, such companies as Deloitte, Ernst & Young and PricewaterhouseCoopers,
which perform the technological and pricing audit of the project, are cautious regarding
197 230 273 226
143 142 137 137 137 164 214
50 66
76 119 101
101 101 101
101 101
101
100 200
250
200 50
0
200
400
600
800
2010 2011 2012 2013E 2014E 2015E 2016E 2017E 2018E 2019E 2020E
CONSTRUCTION OF MOSCOW-KAZAN HIGH-SPEED LINE SAFE RAILWAY OPERATION
OTHER PROJECTS ROLLING STOCK RENOVATION
RECONSTRUCTION OF MOSCOW RAILWAY HUB RECONSTRUCTION OF BAM AND TRANSSIB
INFRASTRUCTURE DEVELOPMENT
21% 24%
4%
27%
25%
2% 10%
28%
18% 15% 21%
25%
68%
55% 52% 50% 38%
0%
10%
20%
30%
40%
50%
60%
70%
80%
90%
100%
2010 2011 2012 2013 2014E
OWN CASH FLOW
CONTRIBUTION TO SHARE CAPITAL FROM THE BUDGET
PROCEEDS FROM SALE OF SHARES OF SUBSIDIARIES
MARKET BORROWINGS
INFRASTRUCTURE BONDS
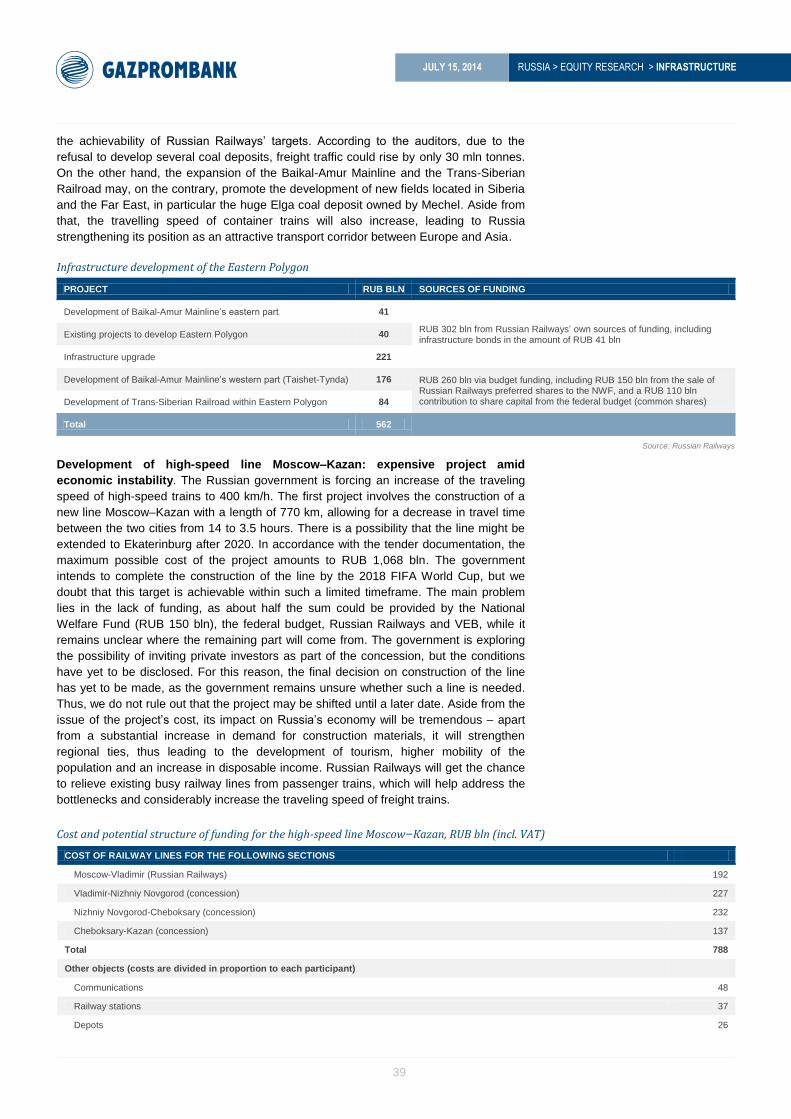
RUSSIA > EQUITY RESEARCH > INFRASTRUCTURE
JULY 15, 2014
39
the achievability of Russian Railways’ targets. According to the auditors, due to the
refusal to develop several coal deposits, freight traffic could rise by only 30 mln tonnes.
On the other hand, the expansion of the Baikal-Amur Mainline and the Trans-Siberian
Railroad may, on the contrary, promote the development of new fields located in Siberia
and the Far East, in particular the huge Elga coal deposit owned by Mechel. Aside from
that, the travelling speed of container trains will also increase, leading to Russia
strengthening its position as an attractive transport corridor between Europe and Asia.
Infrastructure development of the Eastern Polygon
PROJECT RUB BLN SOURCES OF FUNDING
Development of Baikal-Amur Mainline’s eastern part 41
RUB 302 bln from Russian Railways’ own sources of funding, including infrastructure bonds in the amount of RUB 41 bln
Existing projects to develop Eastern Polygon 40
Infrastructure upgrade 221
Development of Baikal-Amur Mainline’s western part (Taishet-Tynda) 176 RUB 260 bln via budget funding, including RUB 150 bln from the sale of Russian Railways preferred shares to the NWF, and a RUB 110 bln contribution to share capital from the federal budget (common shares) Development of Trans-Siberian Railroad within Eastern Polygon 84
Total 562
Source: Russian Railways
Development of high-speed line Moscow–Kazan: expensive project amid
economic instability. The Russian government is forcing an increase of the traveling
speed of high-speed trains to 400 km/h. The first project involves the construction of a
new line Moscow–Kazan with a length of 770 km, allowing for a decrease in travel time
between the two cities from 14 to 3.5 hours. There is a possibility that the line might be
extended to Ekaterinburg after 2020. In accordance with the tender documentation, the
maximum possible cost of the project amounts to RUB 1,068 bln. The government
intends to complete the construction of the line by the 2018 FIFA World Cup, but we
doubt that this target is achievable within such a limited timeframe. The main problem
lies in the lack of funding, as about half the sum could be provided by the National
Welfare Fund (RUB 150 bln), the federal budget, Russian Railways and VEB, while it
remains unclear where the remaining part will come from. The government is exploring
the possibility of inviting private investors as part of the concession, but the conditions
have yet to be disclosed. For this reason, the final decision on construction of the line
has yet to be made, as the government remains unsure whether such a line is needed.
Thus, we do not rule out that the project may be shifted until a later date. Aside from the
issue of the project’s cost, its impact on Russia’s economy will be tremendous – apart
from a substantial increase in demand for construction materials, it will strengthen
regional ties, thus leading to the development of tourism, higher mobility of the
population and an increase in disposable income. Russian Railways will get the chance
to relieve existing busy railway lines from passenger trains, which will help address the
bottlenecks and considerably increase the traveling speed of freight trains.
Cost and potential structure of funding for the high-speed line Moscow–Kazan, RUB bln (incl. VAT)
COST OF RAILWAY LINES FOR THE FOLLOWING SECTIONS
Moscow-Vladimir (Russian Railways) 192
Vladimir-Nizhniy Novgorod (concession) 227
Nizhniy Novgorod-Cheboksary (concession) 232
Cheboksary-Kazan (concession) 137
Total 788
Other objects (costs are divided in proportion to each participant)
Communications 48
Railway stations 37
Depots 26

RUSSIA > EQUITY RESEARCH > INFRASTRUCTURE
JULY 15, 2014
40
COST OF RAILWAY LINES FOR THE FOLLOWING SECTIONS
Rolling stock 50
Utility systems 67
Road construction 54
Total 282
GRAND TOTAL 1,068
Sources of funding
Russian Railways facilities 384
National Welfare Fund 150
Federal budget 64
Russian Railways own funds 31
Issuance of infrastructure bonds using VEB pension funds 139
Concession participants 684
Own funds 43
Government-backed infrastructure bonds 100
Loans 225
Irrecoverable subsidies (yet unidentified source) 317
Total 1,068
Source: Interfax
Operating and projected lines of high-speed passenger service
Source: Russian Railways
Airports: a tasty morsel for investors
The number of airports in Russia declined by about five-fold to 300 after the
collapse of the Soviet Union due to a lack of funding and shrinking number of
passengers in the regions. However, by the mid-2000s, air transportation began to
recover rapidly. Average annual growth reached 14% in 2010, one of the highest rates
in the world due to a boom in tourism and the fact that some passengers switched from
traveling by trains to planes. Passenger traffic rose 18% to record 142 mln in 2013, a
number that is significantly higher than in 1991, while the bulk of traffic was routed
through the Moscow Aviation Hub (MAH), which is running at nearly maximum capacity.
Meanwhile, virtually no large regional hubs have arisen so far in Russia.
Rapid transit (up to 200 km/h) using existing railway lines
High-speed service (up to 400 km/h) using new railway lines
Terminal stations
Travelling time3 hrs 45 min
30.07.2010 Route launch date
HELSINKI
ST. PETERSBURG
BOLOGOYE TVER
VLADIMIR NIZHNY NOVGOROD KAZAN EKATERINBURG
CHELYABINSKSMOLENSKKRASNOYEMINSK
Future construction
3 hrs 45 min
17.12.2009
3 hrs 55 min
30.07.2010
2 hrs 30 min 2017
Until 2030
Ca. 4-5 hrs2018
SARATOV OMSK NOVOSIBIRSK
SUZEMKA BRYANSKKYIV
2015
YAROSLAVL
SOCHI
MOSCOW
ADLER
15-17 hrs Until February 2014
ROSTOV-ON-DON KHARKIV BELGOROD KURSK TULA
2014 Intermediate stations

RUSSIA > EQUITY RESEARCH > INFRASTRUCTURE
JULY 15, 2014
41
Number of airports in Russia Number of passengers at airports, mln
Source: Association of CIS Airports, Gazprombank estimates Source: Association of CIS Airports
The Moscow Aviation Hub (Sheremetyevo, Domodedovo and Vnukovo airports)
accounts for over 50% of passenger traffic. Traffic picked up by 17% to 75 mln
passengers in 2013. Over 70% of all flights are routed through Moscow due to weak
demand for air transportation in the regions. For this reason, MAH infrastructure is
steadily on the rise. In times of peak traffic, which occurs on holidays and during the
summer, airports are unable to cope with the traffic flow, as a result of which aircraft
spend extra time in the air, which means extra expenses, while terminals are
overcrowded with passengers. Experts acknowledge that without large-scale investment
in the construction of new runways, expansion of terminals and upgrade of air traffic
systems, the handling capacity of the MAH could peak, capping further growth among
aviation companies. For example, even now the country’s second-biggest airline,
Transaero, is forced to fly through all three Moscow airports, since the capacity of its
core airport Domodedovo is temporarily exhausted.
Russia's largest airports, mln passengers Breakdown of passenger traffic, 2013
Source: companies Source: Association of CIS Airports, Gazprombank estimates
About RUB 380 bln (net of VAT) has been allocated for the development of airport
infrastructure until 2020 according to targets set forth in the Federal Special-
Purpose Program Development of the Transportation System of Russia and our
estimates. The largest projects include construction of terminals and third runways at
Sheremetyevo and Domodedovo airports. The scope of funding for regional airports has
been significantly expanded. Under the above-mentioned program, investments are
expected to peak in 2013 (RUB 79 bln), although most projects are running behind
schedule. For example, the construction of the third runway at Sheremetyevo got under
1450
13
02
1169
10
11
876
849
756
639
579
533
496
451
423
411
393
383
351
330
329
332
315
304
297
1 19 33 43 54 58 63 67 68 69 70 70 70 70 70 69 69 69 69 70 70 70 70
0
400
800
1,200
1,600
1991
1992
1993
1994
1995
1996
1997
1998
1999
2000
2001
2002
2003
2004
2005
2006
2007
2008
2009
2010
2011
2012
2013
TOTAL NUMBER OF AIRPORTS INCL. INTERNATIONAL
98
42 41 38 36 36 39 43 48
54 57 63
75 82
76
94
106
120
142
10%
20%
30%
40%
50%
60%
0
30
60
90
120
150
1991
1996
1997
1998
1999
2000
2001
2002
2003
2004
2005
2006
2007
2008
2009
2010
2011
2012
2013
MAH REGIONAL AIRPORTS SHARE OF MAH, %
0.0
5.0
10.0
15.0
20.0
25.0
30.0
35.0
DO
MO
DE
DO
VO
SH
ER
EM
ET
YE
VO
PU
LKO
VO
VN
UK
OV
O
KO
LTS
OV
O
TO
LMA
CH
EV
O
PA
SH
KO
VS
KY
SO
CH
I
UF
A
KU
RU
MO
CH
2010 2011 2012 2013
53% 10%
3%
3%
4%
27%
MOSCOW ST PETERSBURG EKATERINBURG
NOVOROSSIYSK SOUTH OF RUSSIA OTHER
134 MLN PASSENGERS

RUSSIA > EQUITY RESEARCH > INFRASTRUCTURE
JULY 15, 2014
42
way quite recently, while at Domodedovo negotiations between the state and the airport
owners are in progress, and the project was supposed to start several years ago. Thus,
the investment targets shown in the special-purpose program have been rolled back to
2014-15. Furthermore, we expect funding for airport infrastructure to be expanded
substantially in some regions ahead of the World Football Championship, which Russia
will host in 2018.
Volume of investments in upgrade of airport infrastructure, RUB bln (incl. VAT)
Largest airport reconstruction projects, 2010-20, RUB bln (incl. VAT)
Source: FSPP, Gazprombank estimates Source: FSPP
Large airports are attractive investment targets, while it is much more challenging
for small regional airports to bring in private capital. Airport infrastructure can be
broken down into four key components:
Runways and landing strips. By law, such facilities can only be owned by the
state, and for this reason, the latter is entitled to invest in their construction and
reconstruction. However, in practice airport owners are willing to invest in runways
on concession terms due to the shortage of financial resources and foot-dragging on
the part of the state. The government is generally amendable to this idea in
exchange for large investments in the industry and is currently in the process of
working out the relevant procedures. In all likelihood, a pilot project will be launched
at Domodedovo airport.
Airport terminals are part of the airport (legal entity) owned by a private investor
(for example, Domodedovo, Koltsovo, and Tomachevo airports) or the state
(Sheremetyevo, Kazan airports). Investments in the upgrade and expansion of
terminal facilities with heavy passenger traffic are extremely attractive to investors,
since they offer high returns on investment. Terminals are commercial real estate
with a concentration of people with a high level of income with a low level of
competition. At the same time, such projects tend to be quite capital-intensive. For
example, construction of the new terminal in Pulkovo Airport and renovation of the
old facility will cost over EUR 1 bln and is being carried out as part of a PPP.
Fueling complexes are usually located in each large airport. Historically, they are
part of the airport, but most of them are eventually bought out by oil companies, for
which fueling is an important sales outlet for petroleum products.
Other infrastructure facilities. These include parking, aircraft sheds, repair shops
and food production plants. They also usually belong to private investors – airport
owners.
26
44
70
79
64
56 61
67 67 67 64
13 18
35 40
30
16 15
7 5 5
0
10
20
30
40
50
60
70
80
90
2010
2011
2012
2013
2014
E
2015
E
2016
E
2017
E
2018
E
2019
E
2020
E
TOTAL INCL. MAH
13
18
19
20
22
24
26
29
31
52
105
0 50 100 150
KHRABROVO (KALININGRAD)
KURUMOCH (SAMARA)
NOVIY (KHABAROVSK)
TOLMACHEVO …
IRKUTSK
KOLTSOVO (EKATERINBURG)
YAKUTSK
VNUKOVO
UZHNIY (ROSTOV-ON DON)
DOMODEDOVO
SHEREMETYEVO

RUSSIA > EQUITY RESEARCH > INFRASTRUCTURE
JULY 15, 2014
43
Main investors in Russian airports
INVESTORS/SHAREHOLDERS AIRPORTS PASSENGER TRAFFIC, 2013 COMMENTS
State airports
Sheremetyevo (state stake 83.4%)
29.3 Aeroflot and VEB are minority shareholders.
Airports of Kazan, Ufa, Mineralnye Vody, Perm
Regional airports are gradually being privatized.
East Line Group Domodedovo 30.8
The largest airport in Russia. The facility is currently overloaded but there are plans to expand the handling capacity of its terminals over the next few years. The company planned to hold an IPO in 2011 but then called it off.
Vnukovo-Invest Vnukovo 11.2 The main shareholders of Vnukovo are Vitaly Vantsev and Lev Kvetnoi.
Gates of Northern Capital
VTB Capital, Fraport
Pulkovo (St. Petersburg)
12.9
The first concession-based airport project. A consortium of international investors headed by VTB Capital, Fraport, the EBRD and others won a tender to manage the airport until 2039. The project provides for construction of a new terminal (completed) and reconstruction of the old one at a cost of EUR 1.1 bln.
Novaport
Roman Trotsenko (50%), Meridian Capital (50%)
Tolmachevo (Novosibirsk)
3.7 There is a struggle between Tolmachevo and Koltsovo over the title of Siberia’s main airport hub.
Chelyabinsk 1.2
Volgograd 0.6
Astrakhan 0.3
Tomsk 0.4
Barnaul 0.4
Airports of the South
Bazel-aero (50%)
Sochi 2.4 In 2011, Bazel-aero sold a 50% stake to Sberbank and the operator of Singapore’s Changi airport for $320 mln.
Changi (30%) Pashkovsky (Krasnodar)
2.2
Sberbank (20%)
Gelenjik 0.2
Anapa 0.6
Airports of the regions
Renova (100%)
Koltsovo (Ekaterinburg)
4.3
Kurumoch (Samara) 2.2
Rostov-on-Don 1.9
Strigino (Nizhny Novgorod)
0.9
Source: Gazprombank estimates

RUSSIA > EQUITY RESEARCH > INFRASTRUCTURE
JULY 15, 2014
44
Seaports: state and business working in tandem
Unlike other transportation infrastructure, most Russian ports meet advanced
requirements and run at an average 70% of total capacity. All in all, 63 seaports
operate in Russia with a total handling capacity of 846 mln tonnes of cargo per year. In
2013, their aggregate cargo turnover reached 580 mln tonnes (+3.9% YoY), which
implies an average utilization rate of about 70%. In the turnover structure, export cargo
(mainly crude oil, petroleum products and coal) accounts for about 80%, which
highlights the commodity-driven basis of the Russian economy. Russian ports handle
100% of all domestic grain exports, 80% of all crude oil and petroleum products and
60% of coal. Imports account for 8% of cargo turnover, mainly via trucks and containers
carrying equipment, consumer goods and auto parts. The rest is classifiable as transit
goods and coastal shipping.
Cargo turnover in Russian ports, mln tonnes 10 largest Russian ports
Source: RF Association of Commercial Seaports, Gazprombank estimates Source: Gazprombank, Transport Ministry
*The port’s capacities will rise to 150 mln t by 2020.
Breakdown of cargo turnover in Russian ports Cargo turnover in Russian ports, 2013
Source: RF Association of Commercial Seaports Source: RF Association of Commercial Seaports
Railroad approaches to ports are the main limitation on rapid expansion of port
infrastructure. Their handling capacity is insufficient to meet demands from cargo
shippers. As a result, periodical backlogs of cargo shipments form at the approaches of
ports in the south and Far East. Furthermore, despite the fact that Russian Railways has
invested large amounts in de-bottlenecking areas around ports, the situation could
improve considerably only after the Baikal-Amur Mainline and Trans-Siberian Railway
are refurbished in 2018. Coal companies have the potential to increase coal exports to
Asia, but it remains untapped due to railroad congestion.
549 591
630 699
731 761 791
829 845
407 421 451 455
496 526 535 566 589
60%
62%
64%
66%
68%
70%
72%
74%
76%
0
100
200
300
400
500
600
700
800
900
2005 2006 2007 2008 2009 2010 2011 2012 2013
CAPACITIES, MLN TONNES CARGO TURNOVER, MLN TONNES
UTILIZATION RATE, %
-4.1%
-14.7%
33.9%
0.3%
13.6%
32.7%
17.0%
8.3% -0.6% -0.5%
-20.0%
-10.0%
0.0%
10.0%
20.0%
30.0%
40.0%
020406080
100120140160
NO
VO
RO
SS
IYS
K
PR
IMO
RS
K
US
T-L
UG
A*
BIG
PO
RT
ST
. P
ET
ER
SB
UR
G
VO
ST
OC
HN
Y
MU
RM
AN
SK
VA
NIN
O
NA
KH
OD
KA
TU
AP
SE
PR
IGO
RO
DN
OE
CAPACITIES, MLN TONNES CARGO TURNOVER IN 2013, MLN TONNES YOY CHANGE
78% 8%
8%
6%
EXPORT IMPORT TRANSIT CABOTAGE
589 MLN T
35%
21%
17%
8%
4%
3%
2%
1% 1%
8%
OIL PETROCHEMICALS COAL
CONTAINERS IRON GRAIN
FERTILIZERS ORE TIMBER
OTHER
589 MLN T
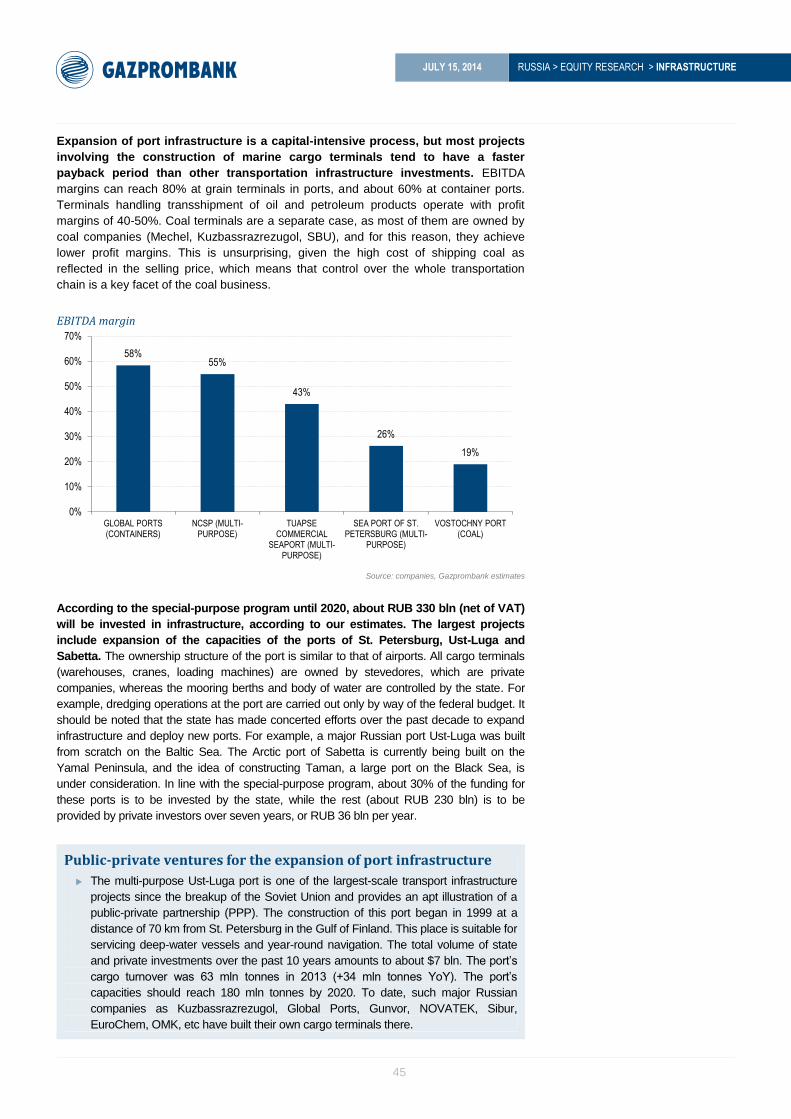
RUSSIA > EQUITY RESEARCH > INFRASTRUCTURE
JULY 15, 2014
45
Expansion of port infrastructure is a capital-intensive process, but most projects
involving the construction of marine cargo terminals tend to have a faster
payback period than other transportation infrastructure investments. EBITDA
margins can reach 80% at grain terminals in ports, and about 60% at container ports.
Terminals handling transshipment of oil and petroleum products operate with profit
margins of 40-50%. Coal terminals are a separate case, as most of them are owned by
coal companies (Mechel, Kuzbassrazrezugol, SBU), and for this reason, they achieve
lower profit margins. This is unsurprising, given the high cost of shipping coal as
reflected in the selling price, which means that control over the whole transportation
chain is a key facet of the coal business.
EBITDA margin
Source: companies, Gazprombank estimates
According to the special-purpose program until 2020, about RUB 330 bln (net of VAT)
will be invested in infrastructure, according to our estimates. The largest projects
include expansion of the capacities of the ports of St. Petersburg, Ust-Luga and
Sabetta. The ownership structure of the port is similar to that of airports. All cargo terminals
(warehouses, cranes, loading machines) are owned by stevedores, which are private
companies, whereas the mooring berths and body of water are controlled by the state. For
example, dredging operations at the port are carried out only by way of the federal budget. It
should be noted that the state has made concerted efforts over the past decade to expand
infrastructure and deploy new ports. For example, a major Russian port Ust-Luga was built
from scratch on the Baltic Sea. The Arctic port of Sabetta is currently being built on the
Yamal Peninsula, and the idea of constructing Taman, a large port on the Black Sea, is
under consideration. In line with the special-purpose program, about 30% of the funding for
these ports is to be invested by the state, while the rest (about RUB 230 bln) is to be
provided by private investors over seven years, or RUB 36 bln per year.
Public-private ventures for the expansion of port infrastructure
The multi-purpose Ust-Luga port is one of the largest-scale transport infrastructure
projects since the breakup of the Soviet Union and provides an apt illustration of a
public-private partnership (PPP). The construction of this port began in 1999 at a
distance of 70 km from St. Petersburg in the Gulf of Finland. This place is suitable for
servicing deep-water vessels and year-round navigation. The total volume of state
and private investments over the past 10 years amounts to about $7 bln. The port’s
cargo turnover was 63 mln tonnes in 2013 (+34 mln tonnes YoY). The port’s
capacities should reach 180 mln tonnes by 2020. To date, such major Russian
companies as Kuzbassrazrezugol, Global Ports, Gunvor, NOVATEK, Sibur,
EuroChem, OMK, etc have built their own cargo terminals there.
58% 55%
43%
26%
19%
0%
10%
20%
30%
40%
50%
60%
70%
GLOBAL PORTS (CONTAINERS)
NCSP (MULTI-PURPOSE)
TUAPSE COMMERCIAL
SEAPORT (MULTI-PURPOSE)
SEA PORT OF ST. PETERSBURG (MULTI-
PURPOSE)
VOSTOCHNY PORT (COAL)

RUSSIA > EQUITY RESEARCH > INFRASTRUCTURE
JULY 15, 2014
46
In 2012, the construction of Sabetta, a new Arctic port, got underway in Yamal.
This is the key facility of the Yamal LNG infrastructure project, which is being
developed by NOVATEK, Total and CNPC, including the deployment of
capacities for the production, storage and shipping of liquefied natural gas on
the basis of the Yuzhno-Tamkeyskoye field, the resource base. The total cost of
construction for the port infrastructure is RUB 73.2 bln (and could possible rise
by another RUB 10-20 bln), of which 65% is state funding and the rest comes
from private investors. The project is slated for completion by 2017.
Development of the Taman Port on the Black Sea. The government is working
on a project to expand the capacities of this port in order to attract cargo traffic
(coal, fertilizers, ore), part of which is currently routed through Ukrainian ports.
Negotiations are in progress with private investors (including Global Ports, UCL
Ports, SUEK and Metalloinvest) who are prepared to erect their own cargo
terminals there. If the project gets the go-ahead, the port’s capacities could
reach 70 mln tonnes by 2020 and 100 mln tonnes by 2030. The total volume of
planned investments is over RUB 200 bln.
Major transport infrastructure expansion projects
MAJOR PROJECTS
TOTAL, RUB BLN, 2010-20
1 Construction and reconstruction of infrastructure facilities of seaport of St. Petersburg 83
2 Construction of seaport facilities in the village of Sabetta on the Yamal Peninsula, including the creation of a maritime approach canal in Ob Bay
73
3 Construction and reconstruction of infrastructure facilities in Ust-Luga Port 65
4 Construction of a deep-water port in Baltiisk (Primorskaya Bay), Kaliningrad region 63
5 Construction and reconstruction of infrastructure facilities in Vanino Port 54
6 Construction of bulk cargo terminals in Taman Seaport (off-budget sources) 25
7 Construction and reconstruction of infrastructure facilities in Olya Port, Astrakhan region 20
8 Construction and reconstruction of infrastructure facilities in Arkhangelsk Port 14
9 Construction of coal terminal, Sakhalin region 13
10 Construction of LNG transshipment terminal in Teriberk, Murmansk region 12
Total 421
Source: Federal Special-Purpose Program Development of the Transportation System of Russia
Pipeline infrastructure: Russia’s raw material artery
The vast expanses of Russia and its rich hydrocarbon resources give rise to the
need for construction and maintenance of the world’s largest oil and gas
transport (pipeline) infrastructure. The pipeline system accounts for 45% of Russia’s
aggregate cargo turnover, with a total length of 230,000 km, including 175,000 km of
high and low-pressure gas pipelines and 55,000 km of oil pipelines. About 30,000 km
(15%) of pipeline has been added to the system over the past 15 years.
Gazprom and Transneft are the largest investors in pipeline infrastructure. With
the launch of the East Siberia – Pacific Ocean (ESPO) oil pipeline the peak of
construction of the line has already been passed and Transneft’s main investments are
related to maintenance of the existing networks. Meanwhile, Gazprom continues to
actively build and roll out its gas pipeline system. According to our estimates, the total
volume of investments in Russia’s pipeline system will reach RUB 5.5 trln by 2020, or
about 30% of all transport infrastructure investments. Roughly 80% of investments will
be made by Gazprom, while Transneft and oil companies will contribute the other 20%.

RUSSIA > EQUITY RESEARCH > INFRASTRUCTURE
JULY 15, 2014
47
Breakdown of investments in pipeline infrastructure by main market players, RUB bln
Source: Gazprombank estimates
Gazprom accounts for about 80% of investments in the pipeline system.
According to the company’s investment program, over $345 bln could be spent during
2013-20. In line with our estimates, investments in pipeline infrastructure could reach
about $152 bln (RUB 5.2 trln). The gas monopoly’s largest pipeline projects are South
Stream, Power of Siberia and Bovanenkovo–Ukhta.
Transneft’s investment program for 2014-2018 amounts to RUB 458 bln. The bulk
of investments should be allocated for projects in Siberia and the Far East, including
Zapolyarye-Purpe and Kuyumba-Taishet oil pipelines. There are also plans to expand
the ESPO in order to export oil up to 50 mln tonnes of oil per year to China. We have
added another RUB 170 bln to Transneft’s investment program, an amount that the
company could spend on expanding the ESPO oil pipeline from 50 to 80 mln tonnes
by 2020. These investments are not part of the company’s current investment
program and have yet to be approved, although a government recommendation has
been made. Only about 30% of Transneft’s capital investments come from the
company’s own sources, while the rest is borrowed funds, including those obtained
through partnerships with oil companies.
408
741
523 496 526
700 720 767 770
682 608
225
210
109 161 189
136 95 87 78
70
61 633
950
632 657
715
836 815 854 849
752
669
0
100
200
300
400
500
600
700
800
900
1,000
2010 2011 2012 2013E 2014E 2015E 2016E 2017E 2018E 2019E 2020E
TRANSNEFT GAZPROM
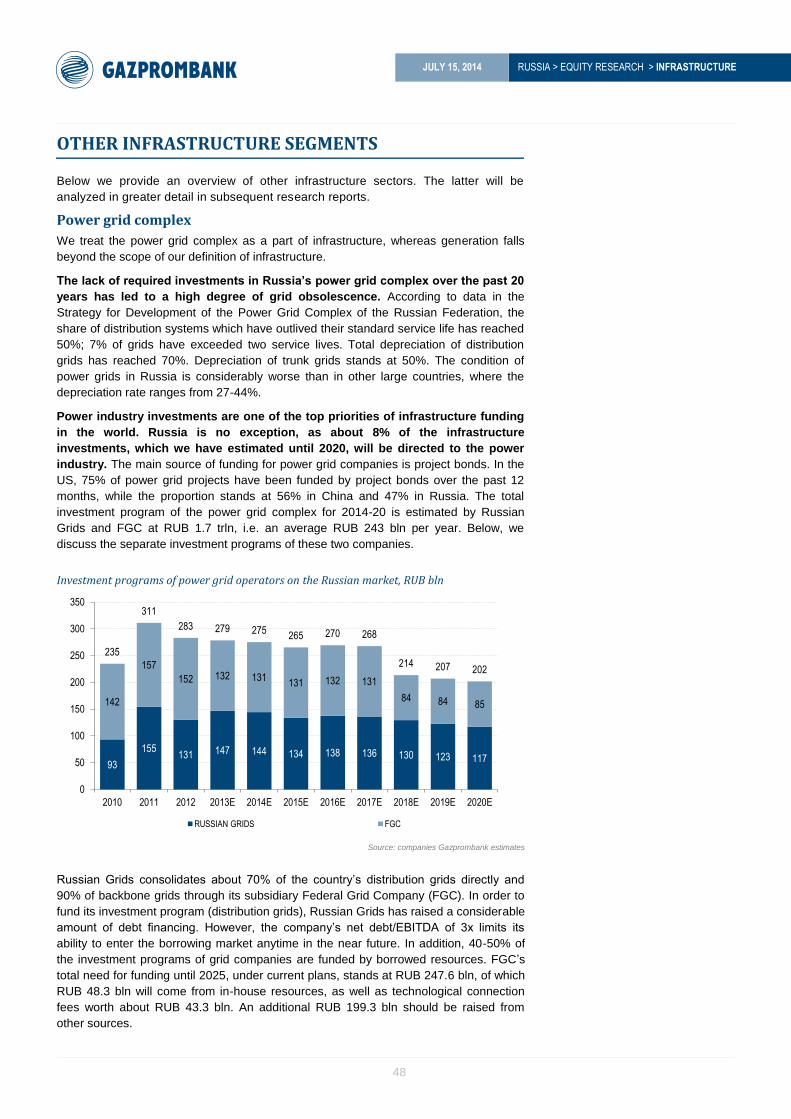
RUSSIA > EQUITY RESEARCH > INFRASTRUCTURE
JULY 15, 2014
48
OTHER INFRASTRUCTURE SEGMENTS
Below we provide an overview of other infrastructure sectors. The latter will be
analyzed in greater detail in subsequent research reports.
Power grid complex
We treat the power grid complex as a part of infrastructure, whereas generation falls
beyond the scope of our definition of infrastructure.
The lack of required investments in Russia’s power grid complex over the past 20
years has led to a high degree of grid obsolescence. According to data in the
Strategy for Development of the Power Grid Complex of the Russian Federation, the
share of distribution systems which have outlived their standard service life has reached
50%; 7% of grids have exceeded two service lives. Total depreciation of distribution
grids has reached 70%. Depreciation of trunk grids stands at 50%. The condition of
power grids in Russia is considerably worse than in other large countries, where the
depreciation rate ranges from 27-44%.
Power industry investments are one of the top priorities of infrastructure funding
in the world. Russia is no exception, as about 8% of the infrastructure
investments, which we have estimated until 2020, will be directed to the power
industry. The main source of funding for power grid companies is project bonds. In the
US, 75% of power grid projects have been funded by project bonds over the past 12
months, while the proportion stands at 56% in China and 47% in Russia. The total
investment program of the power grid complex for 2014-20 is estimated by Russian
Grids and FGC at RUB 1.7 trln, i.e. an average RUB 243 bln per year. Below, we
discuss the separate investment programs of these two companies.
Investment programs of power grid operators on the Russian market, RUB bln
Source: companies Gazprombank estimates
Russian Grids consolidates about 70% of the country’s distribution grids directly and
90% of backbone grids through its subsidiary Federal Grid Company (FGC). In order to
fund its investment program (distribution grids), Russian Grids has raised a considerable
amount of debt financing. However, the company’s net debt/EBITDA of 3x limits its
ability to enter the borrowing market anytime in the near future. In addition, 40-50% of
the investment programs of grid companies are funded by borrowed resources. FGC’s
total need for funding until 2025, under current plans, stands at RUB 247.6 bln, of which
RUB 48.3 bln will come from in-house resources, as well as technological connection
fees worth about RUB 43.3 bln. An additional RUB 199.3 bln should be raised from
other sources.
93
155 131 147 144 134 138 136 130 123 117
142
157
152 132 131 131 132 131
84 84 85
235
311
283 279 275 265 270 268
214 207 202
0
50
100
150
200
250
300
350
2010 2011 2012 2013E 2014E 2015E 2016E 2017E 2018E 2019E 2020E
RUSSIAN GRIDS FGC

RUSSIA > EQUITY RESEARCH > INFRASTRUCTURE
JULY 15, 2014
49
Telecommunications
Investments in telecommunications infrastructure are viewed as a priority in
many countries and the state contributes funding in many cases. This sector of
the Russian economy was deregulated back in the 1990s, as a result of which most
infrastructure projects were completed in 1998-2008, when trunk fiber optic cables
were laid, and mobile voice networks were rolled out. Mobile networks were
upgraded to 3G in large cities in 2007-12, while a spate of fiber optic networks were
deployed by large operators as an alternative to Rostelecom. The joint annual
volume of capex in the industry by the Big Three operators and Rostelecom is
projected to average RUB 296 bln per year in 2014-20, amounting to just 2% of the
total volume of infrastructure investments, with most of the funding expected to
come from in-house resources.
Large outlays by operators over the next 7-10 years are related to the
construction of 4G (LTE) mobile networks. According to the requirements of 4G
licenses issued to the Big Three and Rostelecom, operators are to invest at least
RUB 15 bln per year during 2013-19 in the rollout of LTE networks. Thus, the total
amount of the program will reach at least RUB 420 bln. The project is to be funded
mainly using in-house resources.
The telecommunications sector is high-tech. Industry equipment becomes obsolete
and needs to be replaced or updated every 5-7 years. For this reason, operators are
forced to make capital-intensive investments equal to about 14-16% of revenues for
network maintenance in a competitive environment. OECD research shows that 10%
broadband internet penetration adds 1.5% to a country’s GDP.
Elimination of the digital divide by the deployment of advanced fixed-line
telephony networks in sparsely populated areas is another large project that will
require additional resources to be raised due to the long payback period.
Rostelecom will likely act as the operator for this project, with total investments from
2014-17 estimated at RUB 65 bln. The project will probably be funded by the company’s
operating cash flow, although the government is currently exploring whether
compensation can be tapped from the Universal Service Fund, to which all operators
make contributions (1.2% of their annual revenues).
Investment programs of telecom operators on the Russian market, RUB bln
*2010-20 data – Gazprombank estimates Source: companies, Gazprombank estimates
26% 31% 32% 27% 26% 26% 27% 26% 25% 26% 26%
25% 19% 25%
24% 26% 25% 24% 24% 23% 23% 23%
20% 19% 13% 18% 18% 17% 18% 18% 19% 18% 19%
13% 15% 14% 17% 16% 17% 17% 17% 17% 17% 17%
17% 15% 16% 14% 14% 15% 15% 15% 16% 16% 16%
322
381 355
335 348 342 350 349 342 351 358
-10
40
90
140
190
240
290
340
390
-10%
10%
30%
50%
70%
90%
110%
130%
150%
2010 2011 2012 2013E 2014E 2015E 2016E 2017E 2018E 2019E 2020E
ROSTELECOM MTS MEGAFON VIMPELCOM OTHER* CAPEX, RUB BLN

RUSSIA > EQUITY RESEARCH > INFRASTRUCTURE
JULY 15, 2014
50
Public utilities
The depreciation rate of Russia’s public utilities complex has reached about 60%,
and total investment needs amount to RUB 1.5 trln. Total losses in heat networks
reach 30% due to the obsolescence of utility facilities, while leaks and undocumented
water discharge during transportation in water supply systems amounts to 60% of the
total amount entering the network in a number of cities.
The mechanism for federal special-purpose programs (FSPP) provides for only partial
funding of the required amounts from budgets, which means that the sector has a
severe need for private borrowed funds. The total amount of funding via FSPPs is
estimated at RUB 509.7 bln (net of VAT) in 2010-20, including RUB 265.9 bln from off-
budget sources.
FSPPs for investment in the Russian public utilities sector, RUB bln
Source: FSPP
Latest data on depreciation rate of key facilities in public utility infrastructure (2009)
Source: State Statistics Service
17.6 19.4
26.7
32.4
39.7
54.1
59.5
73.9
57.9 62.2
66.3
0
10
20
30
40
50
60
70
80
2010 2011 2012 2013E 2014E 2015E 2016E 2017E 2018E 2019E 2020E
54%
55%
57%
58%
60%
63%
63%
65%
0% 10% 20% 30% 40% 50% 60% 70%
DISPOSAL FACILITIES
BOILERS
PUMPING STATIONS
POWER GRIDS
TOTAL DEPRECIATION
SEWAGE
HEAT NETWORKS
WATER PIPES

RUSSIA > EQUITY RESEARCH > INFRASTRUCTURE
JULY 15, 2014
51
APPENDIX
Based on the above analysis and in light of international experience in attracting
investment to infrastructure, we provide a list of recommendations and alternative
means of attracting additional investment.
The creation of a specialized exchange or section of an exchange, where
infrastructure funds and companies can place their securities. This measure would
expand the investor base, including the attraction of individual investors.
The establishment of normative requirements for insurance and pension funds to
invest a certain share of funds in infrastructure securities.
Capital amnesties, which have been introduced in offshore zones, in exchange for
their owners’ commitment to invest in national infrastructure securities.
The introduction of tax breaks for infrastructure projects, including the use of
infrastructure bonds, freed from tax payments on coupon income, a reduced profit
tax or the provision of long-term tax holidays.
More active increases of fuel excises.
More active participation of regions in infrastructure development. The attraction of
regions to infrastructure investment through the issue of bonds and bank loans. In
China and the US, regions account for a large share of financing of transportation
infrastructure. Among Russian regions, the most advanced in this area is the city of
St. Petersburg, which financed the construction of the Ring Highway and the
Western High-Speed Diameter via the attraction of private investors.
More active attraction of foreign construction companies for participation in tenders
to construct infrastructure objects in order to reduce their cost.
Largest construction companies in Russia: main players and trends
Thousands of construction companies operate in Russia, but only around 30 can be
considered large players with revenues of more than RUB 10 bln. In turn, no more than
10 of these companies can be considered general federal contractors in the sphere of
transportation infrastructure, while the others have a limited presence in separate
regions, fulfill their work via subcontractors and specialize in only one type of activity. In
the coming years, we believe the following trends will be observed in Russia’s
infrastructure construction market:
Increase in the size of a contract’s value. Government tenders can offer
construction contracts in the amount of up to RUB 100 bln, which include not only
construction, but also servicing of a project over the course of 15-30 years following
its completion. Such contract volumes can be granted only to large players that
possess significant material and financial resources.
Tightening of competition. The completion of infrastructure in Sochi led to the
freeing of a large amount of construction resources, which will now participate in
new tenders along with those companies that already traditionally take part. For
example, Crocus Group is considering the possibility of participating in the
construction of toll highways, even though previously it had not been involved in
transportation construction. As a result, the value of a contract will decline along
with the profitability of the contractor.
The creation of an international consortium for participation in concession
projects. A large infrastructure project within the framework of the State-Private
Partnership requires the participation of a large financial institution, Russian
construction contractors and international consultants. Several groups are already
being formed, with the participation of the largest Russian banks (Gazprombank,
Sberbank and VTB), which will dominate the concession market.

RUSSIA > EQUITY RESEARCH > INFRASTRUCTURE
JULY 15, 2014
52
Entry to capital markets (equities, infrastructure bonds) with the aim of
attracting financing for concession projects. In conditions of a deficit of state
resources, the capital markets will be the only alternative for the attraction of funds.
We expect a significant increase in the number of infrastructure bonds in the
coming years.
A possible increase in the number of foreign players on the Russian market.
Currently such companies find it difficult to enter the Russian market due to the
significant differences in construction standards and the distance of projects from
technical bases. However, the government is considering the possibility of
harmonizing Russian construction standards with those of Europe. Foreign
construction companies are currently mainly participating in the construction of
airport and port infrastructure.
Largest construction companies in the sphere of transportation infrastructure
COMPANY SECTOR SHAREHOLDERS REVENUES, RUB MLN
PARTICIPATION IN LARGE INFRASTRUCTURE PROJECTS
Stroygazconsulting Construction of pipelines, roads, metro
Ziyad Manasir, Ruslan Baisarov
387,885
Bovanenkovskoye and Zapolyarnoye fields, gas pipelines Sakhalin-Khabarovsk-Vladivostok, Bovanenkovo-Ukhta, Ukhta-Torzhok, oil pipeline East Siberia – Pacific Ocean (ESPO), coastal segment of sea gas pipeline Nord Stream, compressor station Portovaya, Federal Highway Kolyma, new entry to Moscow Ring Road from Federal Highway M-1 “Belarus” Moscow-Minsk, and others.
Stroygazmontazh Construction of pipelines
Arkady Rotenberg 324,698 Gas pipelines Bovanenkovo-Ukhta, Sakhalin-Khabarovsk-Vladivostok, Gryazovets-Vyborg, Pochinki-Gryazovets and other others. Construction of main pumping station.
Mostotrest Universal contractor Arkady Rotenberg, N-Trans Group, NPF Blagosostoyanie
123,705 Construction of parts of the Moscow-St. Petersburg track, roads and overpasses in Moscow and Moscow region.
RZDstroy Construction of railroads
Russian Railways 92,000 Russian Railways’ largest contractor for construction and reconstruction of railroad infrastructure.
Mezhregiontrubo-provodstroy
Construction of pipelines
n/a 55,607 Construction of gas pipeline Bovanenkovo-Ukhta, improvement of Kirinsk gas condensate field, construction of Sabetta port.
SK Most Universal contractor Management, Gennady Timchenko
45,634 Construction of transportation infrastructure in Sochi, Moscow-St. Petersburg track, Sabetta port.
Mosinzhproject Construction of metro, roads
Moscow government 44,656 Fulfills the functions of general contractor for construction of new stations of the Moscow metro.
Transyuzhstroy Construction of railroads
Anatoly Antipov (65%), Alexander Shevelev (15%).
38,871
Development of throughput capacity of the railroad infrastructure of the Baikal-Amur Railroad (BAM), complex development of the Novorossiisk transport node, reconstruction and development of the Small Ring of the Moscow railroad.
NPO Mostovik Universal contractor Management 32,671
Design and construction of the world’s largest suspension bridge on Russky island through the East Bosphorous Strait in the city of Vladivostok; design and construction of 2014 Olympics facilities in Sochi (large ice hockey arena with 12,000 capacity, bobsleigh track, transport infrastructure objects); design and construction of the Butovskaya line of the Moscow metro; construction of bridge through Irtysh in the north of Omsk region; construction of the Omsk metro.
Podvodtrubo-provodstroy
Construction of pipelines
n/a 21,830 n/a
DSK Avtoban Construction of roads
Alexey Andreev 21,189 Reconstruction of the M-7 “Volga”, M-8 “Kholmogory” and M-4 “Don” highways. Construction of transport interchanges.
Metrostroy Construction of metro
Management, government of St. Petersburg
19,560 Construction of the metro in St. Petersburg.
Svarachno-Montazhny Trest
Construction of pipelines
Management 19,287 Pipeline construction.
VAD Construction of roads
Management 18,964 Construction of roads in the North-West district.
Mosmetrostroy Construction of metro
Management 15,395 Large contractor for construction of the Moscow metro.
Mostootryad-19 Construction of roads and bridges
Management 15,351 Construction of roads and bridges in the North-West district. Including the Western High-Speed Diameter.
Volgomost Construction of roads and bridges
n/a 14,863 Construction of roads and bridges throughout Russia
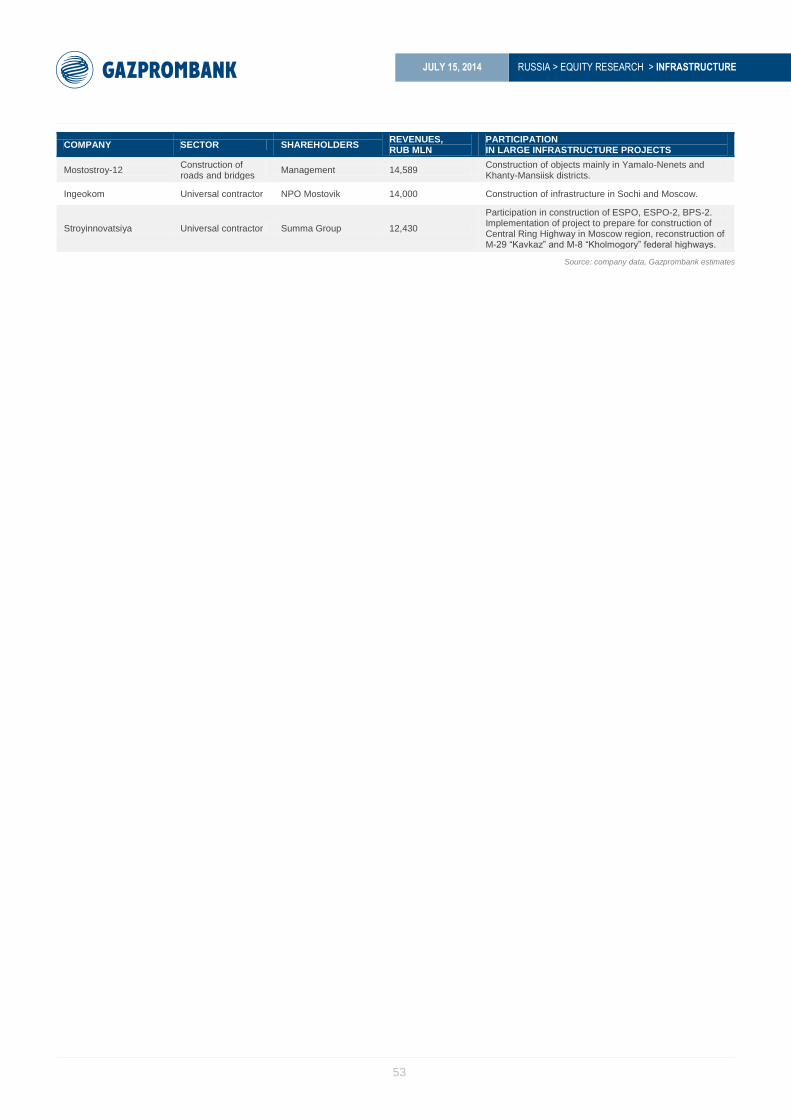
RUSSIA > EQUITY RESEARCH > INFRASTRUCTURE
JULY 15, 2014
53
COMPANY SECTOR SHAREHOLDERS REVENUES, RUB MLN
PARTICIPATION IN LARGE INFRASTRUCTURE PROJECTS
Mostostroy-12 Construction of roads and bridges
Management 14,589 Construction of objects mainly in Yamalo-Nenets and Khanty-Mansiisk districts.
Ingeokom Universal contractor NPO Mostovik 14,000 Construction of infrastructure in Sochi and Moscow.
Stroyinnovatsiya Universal contractor Summa Group 12,430
Participation in construction of ESPO, ESPO-2, BPS-2. Implementation of project to prepare for construction of Central Ring Highway in Moscow region, reconstruction of M-29 “Kavkaz” and M-8 “Kholmogory” federal highways.
Source: company data, Gazprombank estimates
HQ: 16/1 Nametkina St., Moscow 117420, Russia. Office: 7 Koroviy val St.
Copyright © 2003-2014. Gazprombank (Open Joint Stock Company). All rights reserved
This report has been prepared by the analysts of Gazprombank (Open Joint Stock Company) (hereinafter — Gazprombank) and is based on information obtained from public sources believed to be reliable, but is not guaranteed as necessarily being
accurate. With the exception of information directly pertaining to Gazprombank, the latter shall not be liable for the accuracy or completeness of any information shown herein. All opinions and judgments herein represent solely analysts’ personal opinion
regarding the events and situations described and analyzed in this report. They should not be regarded as Gazprombank’s position and are subject to change without notice, also in connection with new corporate or market events that may transpire.
Gazprombank shall be under no obligation to update, amend this report or otherwise notify anyone of any such changes. The financial instruments mentioned herein may be unsuitable for certain categories of investors. This report should not be the only
basis used when adopting an investment decision. Investors should make investment decisions at their own discretion, inviting independent consultants, if necessary, for their specific interests and objectives. The authors shall not be liable for any actions
resulting from the use of this report. Any information contained herein or in the appendices hereto shall not to be construed as a solicitation or an offer to buy or sell any securities or advertisement, unless otherwise expressly stated herein or in the
appendices hereto.
Research Department
+7 (495) 983 18 00
EQUITY SALES
+7 (495) 988 23 75
EQUITY TRADING
+7 (495) 988 24 10
FIXED INCOME SALES
+7 (495) 983 18 80
FIXED INCOME TRADING
+7 (499) 271 91 04