Embed Size (px)
Citation preview

8/6/2019 Rural Unemployment
http://slidepdf.com/reader/full/rural-unemployment 1/27
Rural Unemployment
SIR ARTHUR LEWIS INSTITUTE
OF SOCIAL AND ECONOMIC STUDIES(SALISES)
Programme: M.Sc. in Social Policy
Course Code: SALI6031
Course Name: Techniques of Applied Social Statistical Analysis
Lecturer: Dr. Godfrey St. Bernard
EDUCATION, TRAINING AND UNEMPLOYMENT INRURAL JAMAICA.
Due Date: Monday, May 30, 2011
Student’s Name: Norician Anderson
Student ID#: 05-047799
1 | P a g e
8/6/2019 Rural Unemployment
http://slidepdf.com/reader/full/rural-unemployment 2/27
Rural Unemployment
Table of Contents
I. Introduction 3
II. Background to the Study 8
III. Literature Review 9
IV. Methodology 13V. Analysis of data 15
VI. Conclusion and Recommendation 25
VII.Bibliography 27
VIII.Appendix 29
I. Introduction
Over 60% of the poorest people in Jamaica live in rural areas (Statistical Institute of Jamaica &
Planning Institute of Jamaica, 2010). The rural population is particularly vulnerable to poverty as
most are dependent on agriculture for survival. There was a slight contraction in the prevalence
of poverty in rural Jamaica between 1999-2008 (See figure 1.0). Improved agricultural
2 | P a g e
8/6/2019 Rural Unemployment
http://slidepdf.com/reader/full/rural-unemployment 3/27
Rural Unemployment
performances through the recovery from Hurricane Dean in 2007 and increased food prices (led
by the global food crisis of 2008) are factors attributed to the reduced rural poverty levels in
2008 ( Planning Institute of Jamaica 2009, Statistical Institute of Jamaica & Planning Institute of
Jamaica, 2010).
Figure 1.0: Distribution of poverty by region (per cent), 1999-2008
Source: Jamaica Survey of Living Conditions, 2008, (STATIN & PIOJ)
Nonetheless, rural neglect has been customary in many socio-economic developments and this
has adversely affected the livelihood of the rural population in Jamaica. In the pre-independence
period, sugar production was the largest employer of rural labour, the third highest contributor to
GNP and Jamaica’s chief agricultural export (Harrison, 1998). The heavy dependency on
agriculture continued up until the 1950s, and with the decline of sugar, it later involved the
cultivation and export of banana, coffee and other revenue earning commodities which provided
a means of employment for many rural residences as they engaged in peasantry or worked on
plantations (Mintz, 1985). In the presence of population growth pressures and the decline in the
employability of agriculture, during the post-independence period, there was a thrust for
economic growth in other sectors.
Economic developments were primarily concentrated in urban areas and involved the use of
foreign investment and the granting of fiscal incentives (e.g. tax holiday, duty free importation,
low rental factory space) as an “invitation” to invest in the manufacturing sector (Martinussen
1997); however this afforded minimal employment opportunities for the rural populous.
Noteworthy is the theory that the widening of Jamaica’s economic base beyond the agricultural
sector through foreign investment in another sector (i.e. manufacturing sector) would absorb the
surplus labour evidenced through high unemployment and underemployment (Martinussen
1997). However, in actuality, Benn (1987) noted that the foreseen level of job creation was
3 | P a g e
8/6/2019 Rural Unemployment
http://slidepdf.com/reader/full/rural-unemployment 4/27
Rural Unemployment
below expectation and that unemployment increased from 6% to 14% between 1956 and 1966.
Robotham (1995) also noted that there had been a marked increase in the levels of inequality.
Currently, the structure of the Jamaican economy has rendered the agriculture sector (and by
extension the rural populous) relatively inferior and obsolete to the higher revenue generating
services sector which contributed to 81.7% of the gross domestic product (GDP) in 2009
(Planning Institute of Jamaica, 2009). Furthermore, the Labour force survey shows that the
unemployment rate was more prevalent among elementary occupations (15.5%), service workers
and shop and market sales workers (12.7%), clerks (10.7%), and craft and related trade workers
(9%), and less prevalent among professionals, senior officials and technicians (3.6%), plant and
machine operators and assemblers (7.9%) and skilled agricultural and fishery workers (1.3%)
(Statistical Institute of Jamaica, 2008). Consequently, less skilled and trained workers may be
more vulnerable to unemployment.
Rural communities had also been neglected with respect to education and training developments.
Educational reforms in the 1970s which involved universally free secondary and college
education was a means of redressing social inequalities by enabling persons to have the ability to
access government jobs which typically required a secondary school diploma (Meditz &
Hanratty, 1987). However, this free education reform created other social problems such as
overcrowded classrooms, lowered quality of education, and low school attendance (especially at
the secondary level) and the reform was later abandoned during the years of structural
adjustment. Furthermore, social inequalities persisted especially through the structure of the
education system which was comprised of different types or “class” of schools; at the secondary
level these were namely the traditional high schools, the vocational institutes and the technical
high schools and the comprehensive high schools; at the primary level there were the preparatory
schools (private primary schools), the public primary schools and the “all age” or elementary
schools and at the tertiary level there were the University of the West Indies, the College of Arts,
4 | P a g e

8/6/2019 Rural Unemployment
http://slidepdf.com/reader/full/rural-unemployment 5/27
Rural Unemployment
Science, and Technology (CAST), the College of Agriculture, various teachers colleges and
community colleges (many of which are also socially stratified, typically located in urban
communities and of which approximately 5% of the Jamaican population attend) (Meditz &
Hanratty, 1987).
In recent years, the Economic and Social Survey of Jamaica has indicated an increase in the level
of investment in education and training in Jamaica especially in the area of infrastructural
development, maintaining school relief; providing nutritional and educational material support
and improving quality of teacher education (Planning Institute of Jamaica, 2009). Records have
also shown that a school was built in Westmoreland in 2009 in the bid to increase the number of
space within existing schools (Planning Institute of Jamaica, 2009). Notwithstanding this,
Bullock (2010) underscored that the fragility of rural existence has engendered a significant
rural-urban population drift of a largely uncertified and untrained rural population, "in search of
a better life". In addition, Bullock (2010) asserted that rural urban migration generated a
catalogue of problems such as squatter communities, substandard housing, substandard sanitation
and public health, and crime.
This study presumes that regardless of the increased expenditure on education and training,
socio-economic investments continue to be unevenly distributed and as such, there is still a high
prevalence of rural unemployment, as majority of the rural population remains largely
uncertified and untrained. The purpose of this study is to investigate the likelihood of there
being a difference in the education and training levels of unemployed persons based on their area
of residence.
The objective of this study is to test the following hypothesis:
Research hypothesis:
5 | P a g e
8/6/2019 Rural Unemployment
http://slidepdf.com/reader/full/rural-unemployment 6/27
Rural Unemployment
Null hypothesis: There is no difference in the likelihood of unemployed persons having higher
levels of education and training in rural areas when compared with the Kingston Metropolitan
Area or Other Towns.
Alternative hypothesis: The likelihood of unemployed persons having higher levels of education
and training is lower in rural areas when compared with the Kingston Metropolitan Area or
Other Towns.
The specific objective is:
i. To determine the odds of unemployed persons receiving vocational training with
certificate, technical or professional training with certificate, apprenticeship, on the job
training or no training with respect to “KMA”, “Other Towns” or “Rural Areas”.
ii. To determine the odds of unemployed persons having passed “none”, “less than 3 CXC”,
“More than 3 CXC”, “CAPE” or “DEGREE” examination/s in KMA, Other Towns or
Rural Areas.
6 | P a g e
8/6/2019 Rural Unemployment
http://slidepdf.com/reader/full/rural-unemployment 7/27
Rural Unemployment
I. Background
The International Labour Organization (1982) defines unemployed as comprising all persons
above a specified age who during the reference period were without work (i.e. were not in paid
employment or self-employment) and currently available for work (i.e. were available for paid
employment or self-employment during the reference period) and seeking work (i.e. had taken
specific steps in a specified recent period to seek paid employment or self-employment).
Likewise, the Statistical Institute of Jamaica (2008) refers to unemployed as individuals who are
“looking for work” and “wanting work, available for work” .
Jamaica can be classified into three geographical planes (Cornwall, Middlesex and Surrey) wherein
Cornwall (western region) includes parishes such as Westmoreland, Hanover, St. James, St.
Elizabeth, Middlesex (middle region) includes the parishes such as Clarendon and St. Catherine
and Surrey (eastern region) with parishes such as Kingston, St. Thomas and Portland. Another
classification is the division into fourteen parishes. Bourne, Eldemire-Shearer, McGrowder,
Crawford (2002) noted another classification in 2007 of cities (urban areas) which constitute
27.3% of the population, peri-urban 30.2% and rural areas, 42.5%. For the purpose of this study,
Jamaica will be classified into “KMA” areas which constitute Kingston and St. Andrew, Spanish
Town and Portmore, “Other Towns” which constitute urbanized areas outside of the KMA
7 | P a g e
8/6/2019 Rural Unemployment
http://slidepdf.com/reader/full/rural-unemployment 8/27
Rural Unemployment
region such as Mandeville in Manchester or May Pen in Clarendon and the “Rural” areas will be
comprised of the non- urbanized areas outside of the KMA region and Other Towns. As such,
rural unemployment refers to persons from the rural areas of Jamaica who are looking for work,
want work and are available for work.
Characteristic of Rural Unemployment
Approximately 47% (617,800) of the labour force population were in rural region of
Jamaica in October 2008. The unemployment rate for the rural region of Jamaica has increased
from 9.9% in October 2007 to 11% in October 2008. The unemployment rate is 6.4 percentage
points higher for females (13.8%) than males (7.4%) in 2008 and particularly severe among
persons aged 14-19 (39.9%) and 20-24 (22.0%) in 2008. The unemployment rate was more
prevalent among elementary occupations (15.5%), service workers and shop and market sales
workers (12.7%), clerks (10.7%) and craft and related trade workers (9%) and less prevalent
among professionals, senior officials and technicians (3.6%), plant and machine operators and
assemblers (7.9%) and skilled agricultural and fishery workers (1.3%). It is important to
underscore that the unemployment rate for gender, age, and occupation was not necessarily
related to the rural region but could be used to infer the characteristic of rural unemployment.
II. Literature Review
The differences in education and training among unemployed persons in Jamaica may be
explained by George Beckford’s theory of structural underdevelopment conditioned by the slave
plantation system. Beckford (1972) argued that the plantation, as a total institution, fashioned the
whole environment in which the people of the Third World had inherited. Consequently,
individuals (especially peasants) were less inclined to undertake wage work on the plantation
because of the legacy of slavery; and would typically work on the plantation in situations where
8 | P a g e

8/6/2019 Rural Unemployment
http://slidepdf.com/reader/full/rural-unemployment 9/27
Rural Unemployment
there was no other ways of making a living (Beckford, 1972: 19). Beckford (1972) then
explained that plantation economy, as the dominant force in many third world societies,
generally benefitted from better quality of land and the availability of the resources needed for
production whilst the subsistence of the peasants was marginalized. Beckford (1972) further
explained that despite attempts by the government to provide assistance to peasantry,
incremental resources generally flow towards the plantation sector and the peasantry has
increasingly been forced to seek possibilities for advancement through migration and or wage
work on the plantation.
With respect to education and training, Beckford (1972) explains that the educational system was
a metropolitan creation and as such black people who passed through the system assimilated
their culture and essentially became black Europeans. These “black Europeans” are the ones
who later became the political leaders and the trade unionist who were intent on transferring the
constitutional power from Europeans Crown to the colonies but inadvertently, for the most,
helped to maintain the status quo of social hierarchies that limit the potential of marginalized
groups.
A study to determine the factors associated with the difference in academic performance among
third and fourth grade primary school students found that teacher’s perceptions of a child’s
academic ability and teacher characteristics affected academic performance. The results showed
that each additional score point in which teachers attribute student achievement to student ability
corresponded to a 21.01 point increase in Language achievement and a 21.59 point increase in
Mathematics scores (Casassus, Cusato, Froemel & Palafox 2002). In addition, teachers who did
not have a/n additional job/s, who believed that they were being adequately paid and that they
were not over-burdened and who had some post-secondary training had students who performed
better based on their test scores (Casassus, Cusato, Froemel & Palafox 2002).
9 | P a g e
8/6/2019 Rural Unemployment
http://slidepdf.com/reader/full/rural-unemployment 10/27
Rural Unemployment
There was also a gender differential for educational performance wherein girls outscored boys in
Language and boys outscored girls in Mathematics. The socio-economic level of the school, as
perceived by the Principal of the school, was related to an increase of 5.64 points in student
Language achievement and of 5.88 points in Mathematics. Other school characteristics such as
the size of the school library, the quantity of instructional materials and the student teacher ratio
had a positive effect on academic achievement (Casassus, Cusato, Froemel & Palafox 2002).
Parent characteristics such as education and parental involvement were positively related to
academic performance (Casassus, Cusato, Froemel & Palafox 2002). The results showed that the
education of parents or guardians, defined as the mean value of the number of years of schooling
of parents and guardians, increase Language scores of child/ren by 0.97 points and by 0.81 points
in Mathematics scores per year for education. Parental involvement in the child/ren education also
played an important role in academic performance whereby children with parents that read to
them every day scored 5.88 more points in Language and 4.31 more points in Mathematics than
the children of those parents or guardians who did not (Casassus, Cusato, Froemel & Palafox
2002).
Household characteristics also affected performance, as children living in households with 10 or
more books scored 4.54 points higher in Language and 5.20 points higher in Mathematics than for
those from households not having this number of books (Casassus, Cusato, Froemel & Palafox
2002). Overall, the results from the Casassus et. al study underscored the importance of having
positive social, infrastructural and physiological investment in children during the early years of
education. It also showed the potential impact of generational deprivation wherein less educated
parents also had children who also underperformed.
Zilvere (2002) noted that there was evidence of regional disparities in terms of development,
employment opportunities and education in Lativa. The social realities in the rural areas of
10 | P a g e

8/6/2019 Rural Unemployment
http://slidepdf.com/reader/full/rural-unemployment 11/27
Rural Unemployment
Lativa were generally characterized by high levels of unemployment and widespread poverty
(Zilvere, 2002). Zilvere (2002) highlighted that the limited number of affordable households,
poor road infrastructure, high transportation cost, low wages, stereotypes and the difference in
social values of rural inhabitants were generally obstacles to their mobility as it defined their
ability to access jobs in their profession.
Zilvere (2002) further explained that some regions of the country had an undeveloped
infrastructure which made it more difficult to attract investments and as such unemployment
increased. In addition, the chances of residents to acquire high-quality education also differed
and as such talented intellectuals generally leave the economically undeveloped regions to move
to more developed regions, thereby exacerbating the economic backwardness of undeveloped
regions.
Zilvere (2002) also noted that the decline in unemployment was bolstered by structural changes
in the economy which involved retraining courses for unemployed people, most of which had
little education. Individuals who were less willing to be re-trained often faced periods of long-
term unemployment likewise women who were involved in child care also faced period of long
term employment as they loss their professional skills and relations with their previous employer.
Revenga (2002) noted, in reference in Slovak Republic, that traditional safety nets create a
culture of dependency wherein persons were less likely to seek employment while receiving
government benefits however when benefits were terminated they searched and usually found a
job. Revenga (2002) explains the social benefits system in Slovak Republic is designed in such a
way that there is little incentive for an individual to seek a job especially if the person is
unskilled and market wages are low, as these persons will lose their entitlements once they get a
job.
11 | P a g e

8/6/2019 Rural Unemployment
http://slidepdf.com/reader/full/rural-unemployment 12/27
Rural Unemployment
III.Methodology
i. Sampling Procedure
The sampling for the labour force survey was based on a two-stage stratified random sampling
design, where there was a Primary Sampling Unit (PSU) and a selection of dwelling from the
primary units. The PSU is an Enumeration District (ED), which constitutes a minimum of 100
dwellings in rural areas and 150 in urban areas. An ED is an independent geographic unit that
shares a common boundary. This means that the country was grouped into strata of equal size
based on dwellings (EDs). Based on the PSUs, a listing of all the dwellings was made and this
became the sampling frame from which a master sample of dwelling was compiled which
provided the sampling frame for the labor force
The labour force (or the economically active population) is comprised of all persons 14 years and
over of either sex who engage in the supply of labour for the production of economic goods and
services for a particular reference week of the survey. For the purpose of this study, the sample
of unemployed respondents (1041 individuals) was selected from the labour force sample (7,500
individuals). The labour force surveys were undertaken by the Statistical Institute of Jamaica on
a quarterly basis (January, April, July and October) however the survey utilized for this study
was done in April 2009.
ii. Data Collection
The 2009 Labour Force Survey dataset from the Derek Gordon Databank, Sir Authur Lewis
Institute & Economic Studies, UWI, Jamaica was used for this study. The general contents of the
survey include the socio-economic and demographic characteristics, components and
characteristics of the labour force, characteristics of the employed labour force including level of
training, characteristics of the unemployed labour force including level of training and
characteristics of those outside the labour force. However, the specific area of the survey
12 | P a g e

8/6/2019 Rural Unemployment
http://slidepdf.com/reader/full/rural-unemployment 13/27
Rural Unemployment
analyzed for this study, looked at the characteristics of the unemployed labour force relating to
level of training and highest academic examination passed (See appendix for questionnaire).
iii. Method of Measurement
Training will be measured by the type of training received which will include vocational with
certificate, professional or technical with certificate, apprenticeship, on the job training or no
training. Education will be measured by the highest academic examination passed which will
include none, Less than 3 CXC’s, More than 3 CXCs, CAPE or Degree. Regions of Jamaica will
be measured as “KMA”, “Other Towns” and “Rural” areas.
I. Analysis of Data
Demographic characteristics of sampled population
13 | P a g e
8/6/2019 Rural Unemployment
http://slidepdf.com/reader/full/rural-unemployment 14/27
Rural Unemployment
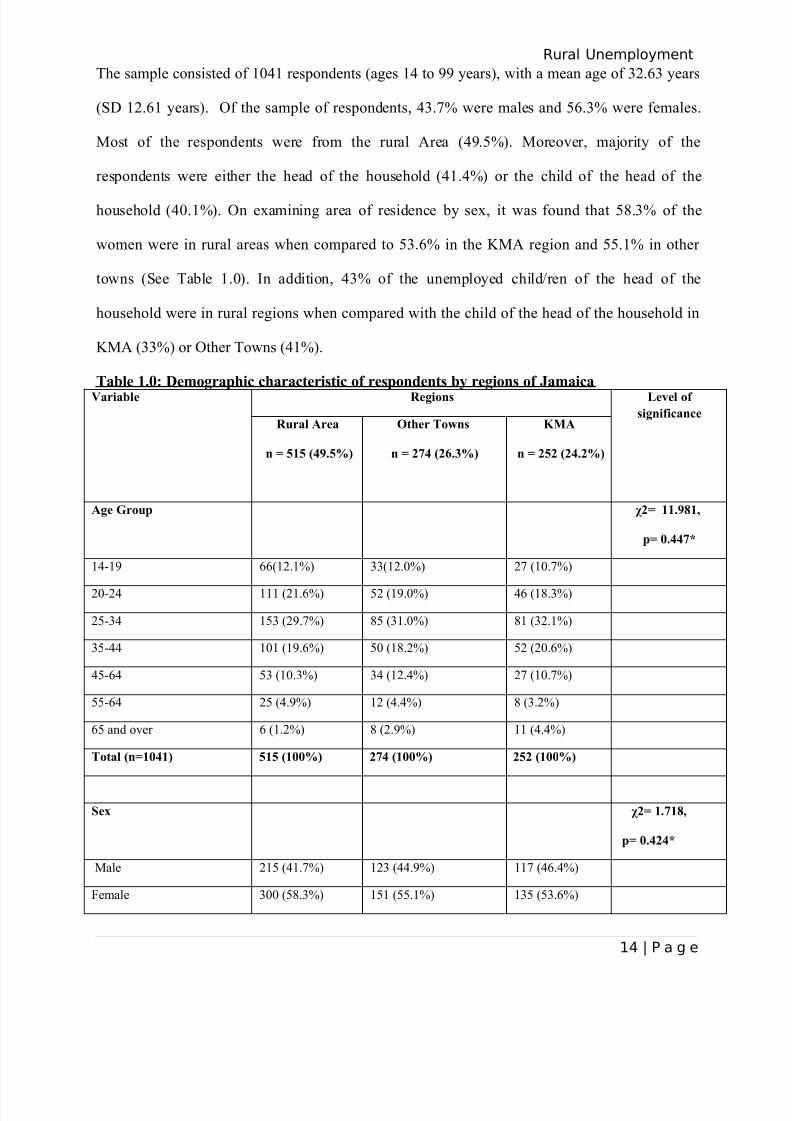
The sample consisted of 1041 respondents (ages 14 to 99 years), with a mean age of 32.63 years
(SD 12.61 years). Of the sample of respondents, 43.7% were males and 56.3% were females.
Most of the respondents were from the rural Area (49.5%). Moreover, majority of the
respondents were either the head of the household (41.4%) or the child of the head of the
household (40.1%). On examining area of residence by sex, it was found that 58.3% of the
women were in rural areas when compared to 53.6% in the KMA region and 55.1% in other
towns (See Table 1.0). In addition, 43% of the unemployed child/ren of the head of the
household were in rural regions when compared with the child of the head of the household in
KMA (33%) or Other Towns (41%).
Table 1.0: Demographic characteristic of respondents by regions of JamaicaVariable Regions Level of
significanceRural Area
n = 515 (49.5%)
Other Towns
n = 274 (26.3%)
KMA
n = 252 (24.2%)
Age Group χ2= 11.981,
p= 0.447*
14-19 66(12.1%) 33(12.0%) 27 (10.7%)
20-24 111 (21.6%) 52 (19.0%) 46 (18.3%)
25-34 153 (29.7%) 85 (31.0%) 81 (32.1%)
35-44 101 (19.6%) 50 (18.2%) 52 (20.6%)
45-64 53 (10.3%) 34 (12.4%) 27 (10.7%)
55-64 25 (4.9%) 12 (4.4%) 8 (3.2%)
65 and over 6 (1.2%) 8 (2.9%) 11 (4.4%)
Total (n=1041) 515 (100%) 274 (100%) 252 (100%)
Sex χ2= 1.718,
p= 0.424*
Male 215 (41.7%) 123 (44.9%) 117 (46.4%)
Female 300 (58.3%) 151 (55.1%) 135 (53.6%)
14 | P a g e

8/6/2019 Rural Unemployment
http://slidepdf.com/reader/full/rural-unemployment 15/27
Rural UnemploymentTotal (n=1041) 515 (100%) 274 (100%) 252 (100%
Relationship to Head of
Household
χ2 = 7.676,
p =0.104*
Head 168 (39.1%) 88 (38.6%) 103 (49%)
Spouse 78 (18.1%) 46 (20.2%) 37 (17.6%)
Child 184 (42.8%) 94 (41.2%) 70 (33.3%)
Total (n= 868) 430 (100%) 228 (100%) 210 (100%)
* The p-value is for each variable by area of residence (i.e. rural, other towns and KMA).
An examination of the explanatory variables in the study showed that the percentage share of
respondents who had received no training (68.7%) and had passed no academic examination
(80.5%) was greatest in rural areas (See Table 2.0).
Table 2 .0: D istribution of Level of Training and Highest Academic Examination passed of respondents by regions of Jamaica .
Explanatory Variables Rural Area Other Towns KMA
Level of
significance
Level of Training χ2 = 40.499
p =0.000
None 333 (68.7%) 163 (61.7%) 130 (52.8%)
Vocational with certificate 86 (17.7%) 39 (14.8%) 42 (17.1%)
Professional/ technical with
certificate
5 (1.0%) 10 (3.8%) 17 (6.9%)
Apprenticeship 50 (10.3%) 46 (17.4%) 44 (17.9%)
On the job training 11 (2.3%) 6 (2.3%) 13 (5.3%)
Total (n=995) 485 (100%) 264 (100%) 246 (100%)
Highest Academic Examination
Passed
χ2 = 28.304
p =0.000
None 392 (80.5%) 191 (75.5%) 164 (71.6%)
15 | P a g e
8/6/2019 Rural Unemployment
http://slidepdf.com/reader/full/rural-unemployment 16/27
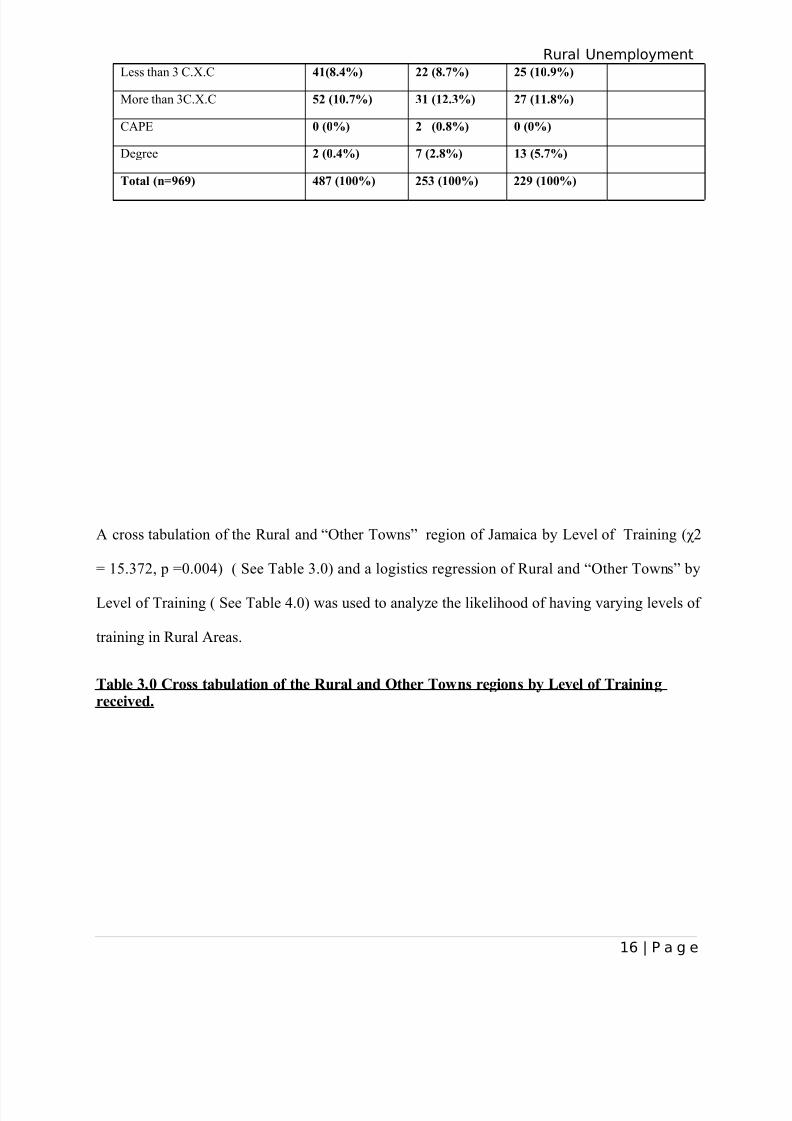
Rural UnemploymentLess than 3 C.X.C 41(8.4%) 22 (8.7%) 25 (10.9%)
More than 3C.X.C 52 (10.7%) 31 (12.3%) 27 (11.8%)
CAPE 0 (0%) 2 (0.8%) 0 (0%)
Degree 2 (0.4%) 7 (2.8%) 13 (5.7%)
Total (n=969) 487 (100%) 253 (100%) 229 (100%)
A cross tabulation of the Rural and “Other Towns” region of Jamaica by Level of Training (χ2
= 15.372, p =0.004) ( See Table 3.0) and a logistics regression of Rural and “Other Towns” by
Level of Training ( See Table 4.0) was used to analyze the likelihood of having varying levels of
training in Rural Areas.
Table 3.0 Cross tabulation of the R ural and Other Towns regions by Level of Trainingreceived.
16 | P a g e

8/6/2019 Rural Unemployment
http://slidepdf.com/reader/full/rural-unemployment 17/27
Rural Unemployment
Regions
TotalRural AreasOther Towns
Areas
Training Vocational with certificate Count 86 39 125
% within Training 68.8% 31.2% 100.0%
% of Total 11.5% 5.2% 16.7%
Professional/Technical withcertificate
Count 5 10 15
% within Training 33.3% 66.7% 100.0%
% of Total .7% 1.3% 2.0%
Apprenticeship Count 50 46 96
% within Training 52.1% 47.9% 100.0%
% of Total 6.7% 6.1% 12.8%
On the job training Count 11 6 17
% within Training 64.7% 35.3% 100.0%
% of Total 1.5% .8% 2.3%
None Count 333 163 496
% within Training 67.1% 32.9% 100.0%
% of Total 44.5% 21.8% 66.2%
Total Count 485 264 749
% within Training 64.8% 35.2% 100.0%
% of Total 64.8% 35.2% 100.0%
Table 4.0: Logistic regression of unemployment in rural areas co mpared with Other Townareas by training
BStandard
Error Wald df Sig.OddsRatio
95% C.I.for Odds Ratio
Lower Upper
Vocational with certificate -0.076 0.215 0.126 1 0.723 0.926 0.607 1.413
Professional/Technical withcertificate
1.408 0.556 6.409 1 0.011 4.086 1.374 12.149
Apprenticeship 0.631 0.226 7.826 1 0.005 1.88 1.208 2.924
On the job training 0.108 0.516 0.044 1 0.834 1.114 0.405 3.066
None 1.360
17 | P a g e

8/6/2019 Rural Unemployment
http://slidepdf.com/reader/full/rural-unemployment 18/27
Rural Unemployment
The results showed that the odds of having vocational training with certificate are 7.4% lower for
Other Towns when compared to Rural Areas (OR= 0.926). The odds of having professional or
technical training with certificate were four times better in other towns when compared with
rural areas (OR= 4.086). The odds of having apprenticeship training were 88% high for Other
Towns when compared to Rural Areas (OR= 1.88). The odds of having on the job training were
11% higher for Other Towns when compared to Rural Areas (OR= 1.114). The odds of having
no training was 36% higher for Rural Areas when compared to Other Towns (OR= 1.360).
The difference in the odds of having apprenticeship training is statistically significant for Rural
Areas and Other Towns (p =0.005).
A cross tabulation of the Rural and Other Towns region of Jamaica by highest academic
Examination Passed (χ2 = 12.361, p =0.015) ( See Table 5.0) and a logistics regression of Rural
and “Other Towns” by highest academic examination Passed ( See Table 6.0) was used to
analyze the likelihood of having passed varying levels of examinations in Rural Areas.
Table 5 .0 Cross tabulation of the R ural and Other Towns regions by Highest AcademicExamination Passed.
Region
Total
RuralOther
Towns
Highest academic None Count 392 191 583
18 | P a g e

8/6/2019 Rural Unemployment
http://slidepdf.com/reader/full/rural-unemployment 19/27
Rural Unemploymentexamination passed % within
Exampassed
67.2% 32.8% 100.0%
% of Total 53.0% 25.8% 78.8%
Lessthan 3CXC
Count 41 22 63
% withinExampassed
65.1% 34.9% 100.0%
% of Total 5.5% 3.0% 8.5%
Morethan 3CXC
Count 52 31 83
% withinExampassed
62.7% 37.3% 100.0%
% of Total 7.0% 4.2% 11.2%
CAPE Count 0 2 2
% withinExampassed
.0% 100.0% 100.0%
% of Total .0% .3% .3%
Degree Count 2 7 9
% withinExampassed
22.2% 77.8% 100.0%
% of Total .3% .9% 1.2%
Total Count 487 253 740
% withinExampassed
65.8% 34.2% 100.0%
% of Total 65.8% 34.2% 100.0%
Table 6 .0: Logistic regression of unemployment in rural areas compared with Other Townareas by highest academic examination passed
B S.E. Wald df Sig.OddsRatio
95% C.I.for Odds Ratio
Lower Upper
Less than 3 CXC .096 .279 .120 1 .729 1.101 .638 1
More than 3 CXC .202 .243 .687 1 .407 1.224 .759 1
CAPE 21.922 28420.722
5.950E-07
1 .999 3.316E+09
.000
Degree 1.972 .807 5.975 1 .015 7.183 1.478 34None 1.341
The results showed that the odds of having passed Less than 3 CXCs are 10% higher for Other
Towns when compared to Rural Areas (OR= 1.101). The odds of having passed more than 3
19 | P a g e

8/6/2019 Rural Unemployment
http://slidepdf.com/reader/full/rural-unemployment 20/27
Rural Unemployment
CXCs are 22% higher in Other Towns when compared to rural areas (OR= 1.224). The odds of
having passed CAPE is significantly higher in Other Towns when compared to Rural Areas
(OR= 3.316E+09). The odds of having passed an academic examination for a Degree is seven
times higher for Other Towns when compared to Rural Areas (OR=7.183 ). The odds of having
passed no exam is 34% higher for Rural Areas when compared to Other Towns (OR= 1.341).
A cross tabulation of the Rural and KMA region of Jamaica by level of Training (χ2 = 37.043, p
=0.000) (See Table 7.0) and a logistics regression of Rural and KMA by levels of training ( See
Table 8.0) was used to analyze the likelihood of having varying levels of training in Rural Areas.
Table 7 .0 Cross tabulation of the R ural and KMA regions by Level of Training
20 | P a g e

8/6/2019 Rural Unemployment
http://slidepdf.com/reader/full/rural-unemployment 21/27
Rural Unemployment
Regions
TotalRural Areas KMA
Training Vocational with certificate Count 86 42 128
% within Training 67.2% 32.8% 100.0%
% of Total 11.8% 5.7% 17.5%
Professional/Technical with
certificate
Count 5 17 22
% within Training 22.7% 77.3% 100.0%
% of Total .7% 2.3% 3.0%
Apprenticeship Count 50 44 94
% within Training 53.2% 46.8% 100.0%
% of Total 6.8% 6.0% 12.9%
On the job training Count 11 13 24
% within Training 45.8% 54.2% 100.0%
% of Total 1.5% 1.8% 3.3%
None Count 333 130 463
% within Training 71.9% 28.1% 100.0%
% of Total 45.6% 17.8% 63.3%
Total Count 485 246 731
% within Training 66.3% 33.7% 100.0%
% of Total 66.3% 33.7% 100.0%
Table 8.0: Logistic regression of unemployment in rural areas compared with KMA byLevel of Training
B S.E. Wald df Sig.OddsRatio
95% C.I.for Odds Ratio
Lower Upper
Vocational withcertificate
.224 .215 1.087 1 .297 1.251 .821 1.90
21 | P a g e

8/6/2019 Rural Unemployment
http://slidepdf.com/reader/full/rural-unemployment 22/27
Rural UnemploymentProfessional/Technicalwith certificate
2.164 .519 17.381 1 .000 8.709 3.148 24.09
Apprenticeship .813 .231 12.366 1 .000 2.254 1.433 3.54
On the job training 1.108 .423 6.872 1 .009 3.027 1.323 6.93
None .000 0.507
The results showed that the odds of having vocational training with certificate are 25% higher for
KMA when compared to Rural Areas (OR= 1.251). The odds of having professional or technical
training with certificate were eight times better in KMA when compared with rural areas (OR=
8.709). The odds of having apprenticeship training were two times better for KMA when
compared to Rural Areas (OR= 2.254). The odds of having on the job training were 3 times
better for KMA when compared to Rural Areas (OR= 3.027). The odds of having no training
was 51% higher for Rural Areas when compared to KMA (OR= 0.507).
The difference in the odds of having professional training with certificate, apprenticeship
training or no training are statistically significant for Rural Areas and KMA (p =0.000).
Table 9 .0 Cross tabulation of the R ural and KMA regions by Highest AcademicExamination Passed.
Regions
Total Rural
Areas KMA
Exam passed None Count 392 164 556
22 | P a g e
8/6/2019 Rural Unemployment
http://slidepdf.com/reader/full/rural-unemployment 23/27
Rural Unemployment% within Exampassed
70.5% 29.5% 100.0%
% of Total 54.7% 22.9% 77.7%
Lessthan 3CXC
Count 41 25 66
% within Exampassed
62.1% 37.9% 100.0%
% of Total 5.7% 3.5% 9.2%
Morethan 3CXC
Count 52 27 79% within Exampassed
65.8% 34.2% 100.0%
% of Total 7.3% 3.8% 11.0%
Degree Count 2 13 15
% within Exampassed
13.3% 86.7% 100.0%
% of Total .3% 1.8% 2.1%
Total Count 487 229 716
% within Exampassed
68.0% 32.0% 100.0%
% of Total 68.0% 32.0% 100.0%
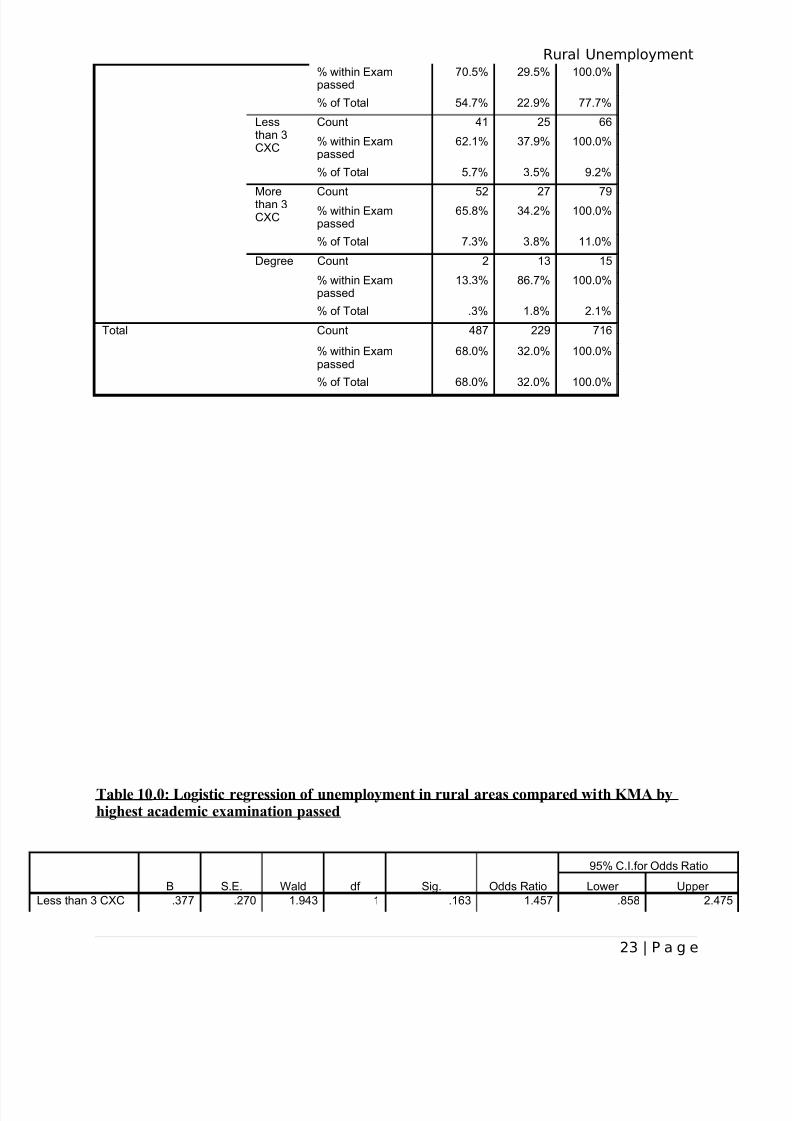
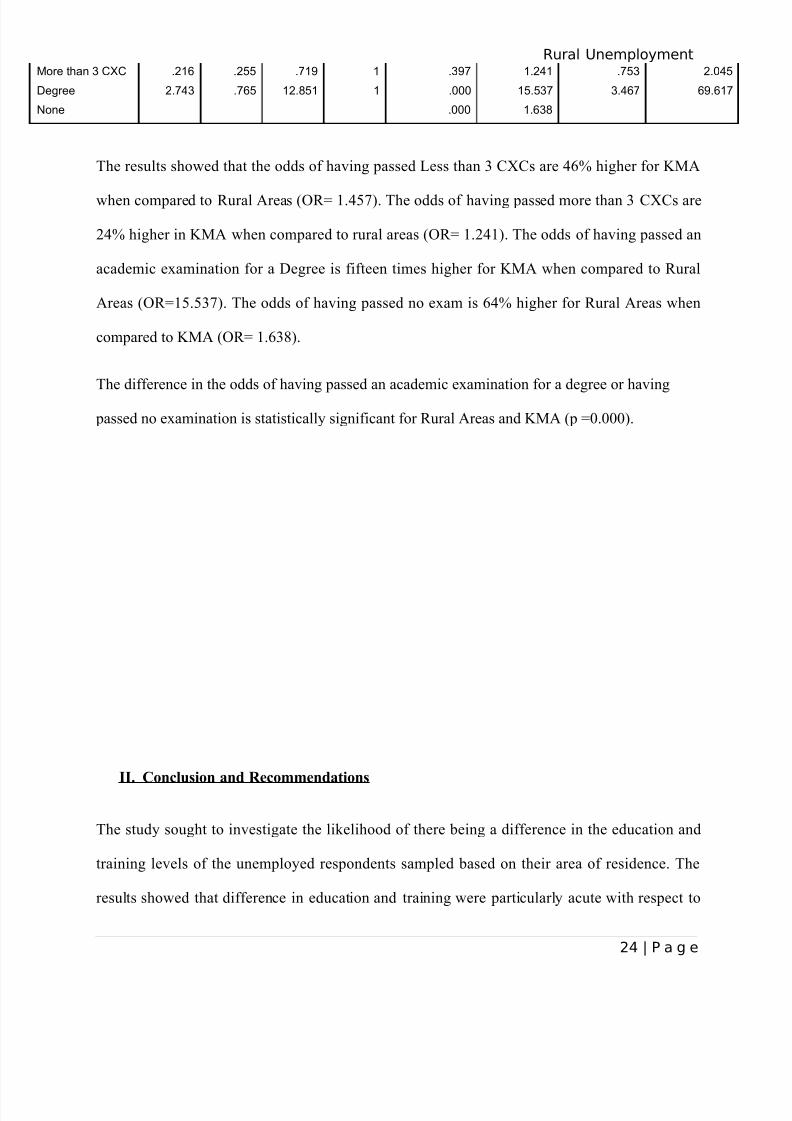
Table 10 .0: Logistic regression of unemployment in rural areas compared with KMA byhighest academic examination passed
B S.E. Wald df Sig. Odds Ratio
95% C.I.for Odds Ratio
Lower Upper
Less than 3 CXC .377 .270 1.943 1 .163 1.457 .858 2.475
23 | P a g e
8/6/2019 Rural Unemployment
http://slidepdf.com/reader/full/rural-unemployment 24/27
Rural UnemploymentMore than 3 CXC .216 .255 .719 1 .397 1.241 .753 2.045
Degree 2.743 .765 12.851 1 .000 15.537 3.467 69.617
None .000 1.638
The results showed that the odds of having passed Less than 3 CXCs are 46% higher for KMA
when compared to Rural Areas (OR= 1.457). The odds of having passed more than 3 CXCs are
24% higher in KMA when compared to rural areas (OR= 1.241). The odds of having passed an
academic examination for a Degree is fifteen times higher for KMA when compared to Rural
Areas (OR=15.537). The odds of having passed no exam is 64% higher for Rural Areas when
compared to KMA (OR= 1.638).
The difference in the odds of having passed an academic examination for a degree or having
passed no examination is statistically significant for Rural Areas and KMA (p =0.000).
II. Conclusion and Recommendations
The study sought to investigate the likelihood of there being a difference in the education and
training levels of the unemployed respondents sampled based on their area of residence. The
results showed that difference in education and training were particularly acute with respect to
24 | P a g e

8/6/2019 Rural Unemployment
http://slidepdf.com/reader/full/rural-unemployment 25/27
Rural Unemployment
KMA and Rural areas and less so with respect to Other Towns and Rural Areas. A review of the
statistically significant results showed that the odds of having passed an academic examination
for a Degree was fifteen (15) times better in KMA and seven (7) times better in Other Towns
when compared with Rural areas. The odds of having passed no examination 64% higher in rural
areas when compared with KMA and 34% higher in rural areas when compared to Other Towns.
The odds of having professional training was eight (8) times better in KMA and four (4) times
better in Other Towns when compared to Rural Areas. The odds of having apprenticeship
training is two (2) times better in KMA when compared to Rural Areas and 88% higher in Other
Towns when compared to rural areas. The odds of having no training is 51% higher in Rural
Areas when compared with KMA and 36% higher in rural areas when compared with Other
Towns.
It is possible, that the odds of the level of training received and the highest academic
examination passed for rural areas with respect to KMA is indicative of an uneven distribution of
resources as is reminiscent in the late Professor George Beckford’s theory of persistent poverty.
From a social policy perspective, this uneven distribution of resources would necessitate
increased level of social investment in the rural areas of Jamaica. This social investment should
not necessarily take the form of additional infrastructural resources (e.g. better roads which
would lower transportation cost, more educational and training institutions which would lower
overcrowding) more so capacity building initiative (e.g. remedial training to increase academic
proficiency or training in new areas ( as noted in Zilvere, 2002) , educational loans and grants to
buy uniform, food etc, parenting programmes that will help to orient parents on the value of
education and training and providing the requisite positive psycho-social environment). In
25 | P a g e

8/6/2019 Rural Unemployment
http://slidepdf.com/reader/full/rural-unemployment 26/27
Rural Unemployment
addition, there is a need for the diversification of the educational and training options and the
types of employment opportunities available.
Bearing in mind financial limitation, social policy initiatives aimed at the diversification of the
educational and training options and employment opportunities should consider alternative usage
of natural resources such as eco-tourism, health tourism, more ecologically intensive agriculture
and the building of the professional and service delivery capacity in these areas.
III. B ibliography
Beckford, George W (1972): Persistent Poverty: Underdevelopment in Plantation. Economies of
the Third World: Oxford University Press
Benn, Dennis. The growth and development of political ideas in the Caribbean 1774-1983.
Kingston: Institute of Social and Economic Research, 1987.
Bourne PA, Eldemire-Shearer D, McGrowder D, Crawford T. Examining Health Status of
Women in Rural, Peri-urban and Urban Areas in Jamaica . North Am J Med Sci 2009;
1: 256-271.
Bullock, C. (2010). Agriculture, Rural Poverty & Public Policy. Retrieved on May 26, 2011 from
http://jamaica-gleaner.com/gleaner/20100711/focus/focus1.html
26 | P a g e

8/6/2019 Rural Unemployment
http://slidepdf.com/reader/full/rural-unemployment 27/27
Rural Unemployment
Casassus J, Cusato S, Froemel J E, Palafox J C. (2002) First International ComparativeStudy of language, mathematics, and associated factors for students in the third andfourth years of primary school (two reports) Santiago, LLECE
Harrison, M. (1998). Living with the sugar legacy: International Policy Change and Local level
Impact in Rural Jamaica. In D. McGregor, Resource Sustainability and Caribbean
Development (pp. 232-253). Kingston: The Press University of the West Indies.
International Labour Organization: Resolution concerning statistics of the economically active
population, employment, unemployment and underemployment, adopted by the
Thirteenth International Conference of Labour Statisticians (October 1982); see page 4;
accessed May 26, 2011
Jamaica, Statistical Institute of. The Labour Force Survey. Kingston: Statistical Institute of
Jamaica, 2009.
Martinussen, John. Society, State & Market. London: Zed Books Ltd., 1997.
Mintz, Sidney. (1985). From Plantations to Peasantries in the Caribbean. In M. Sidney, & S.Price, Caribbean Contours (pp. 127-153). Baltimore: The John Hopkins University Press
Planning Institute of Jamaica (2009). Economic and social survey of Jamaica 2008. Kingston:
Planning Institute of Jamaica
Planning Institute of Jamaica & The Statistical Institute of Jamaica (2010). Jamaica Survey of
Living Conditions 2008. Kingston: Planning Institute of Jamaica & The Statistical
Institute of Jamaica.
Revenga, A (2002). "Unemployment, Poverty, and Social Exclusion in Central and Eastern
Europe," Chapter 29 in Bernard Funck and Lodovico Pizzati, eds., Labor, Employment,and Social Policies in the EU Enlargement Process, The World Bank, Washington, D.C.,
2002, 337-342.
Robotham, Don. "Social and Economic Policy: Starting Gates and End States." Kingston
University of the West Indies, 1995. 1-7.
Sandra W. Meditz and Dennis M. Hanratty, editors. Caribbean Islands: A Country Study.
Washington: GPO for the Library of Congress, 1987.
Zilvere, R (2002). "Searching for solutions to reduce social exclusion in Lativa" Chapter 30 in
Bernard Funck and Lodovico Pizzati, eds., Labor, Employment, and Social Policies in theEU Enlargement Process, The World Bank, Washington, D.C., 2002, 343-354.