Embed Size (px)
Citation preview

THE ROYAL SOCIETY FOR THE PREVENTION OF ACCIDENTS RoSPA
RURAL ROAD ENVIRONMENT
POLICY PAPER
AUGUST 2010

The Royal Society for the Prevention of Accidents Rural Road Environment Policy Paper: August 2010
1
CONTENTS 1. INTRODUCTION
1.1 Defining Rural Roads 1.2 How The Road Environment Can Prevent Accidents
2. MANAGING THE ROADS 2.1 Local Transport Plans (LTPs) 2.2 Standards 2.3 Road Safety Audit 3. ROAD CASUALTY TRENDS ON RURAL AND URBAN ROADS 3.1 Number of Accidents 3.2 Casualty Rates on Urban and Rural Roads 3.3 Accidents by Road User Group
4. GUIDANCE DOCUMENTS 4.1 IHT Guidelines 4.2 Rural Speed Management
5. SAFETY INTERVENTIONS ON RURAL ROADS 5.1 Self Explaining Roads 5.1.1 Centre line markings 5.1.2 Speed Reducers 5.2 Forgiving Road Sides 5.3 Vehicle Activated Signs (VAS) 5.4 Quiet Lanes 5.5 Junction Design 5.6 Bend Design
6. SAFETY INTERVENTIONS IN RURAL SETTLEMENTS 6.1 Village Speed Limits 6.2 Countdown Signs 6.3 Village Gateways 6.4 Psychological Traffic Calming In Villages
7. DEPARTMENT FOR TRANSPORT RURAL ROAD SAFETY DEMONSTRATION PROJECT 7.1 Rural Demonstration Project Norfolk 7.2 Rightracks Project: A Rural Demonstration Project for Northamptonshire 7.3 Lincolnshire Rural Demonstration Project 7.4 The Devon Rural ‟Country Mile‟ Project 7.5 B3157 Jurassic Coast & Village Speed Management treatment
8. CONCLUSION
9. REFERENCES

The Royal Society for the Prevention of Accidents Rural Road Environment Policy Paper: August 2010
2
1 INTRODUCTION Crashes and casualties are not evenly spread across the road network, but are more likely to occur in certain areas and locations than in others. They are caused by a variety of factors, broadly grouped into: Human: Human behaviour contributes to almost all road accidents, and is the prime cause in around three-quarters of them. Environment: Environmental factors, including the road environment, are the prime cause in 2% - 3%, but in combination with human and vehicle factors, contribute to around 18% of crashes. Vehicle: Vehicle factors are the prime cause in 2% - 3% and in combination with human and environmental factors, contribute to around 5% of crashes. This Policy Paper concentrates on the Rural Road Environment. Its purpose is to: a) explore the influence of the road environment on the likelihood and severity of road crashes and road casualties in rural areas b) promote good practice in the management of the rural road environment c) develop RoSPA‟s policy positions in relation to the rural road environment.
1.1 Defining a Rural Road In 1977, the Department of Transport defined a non-built up road as having a speed limit over 40 mph (excluding motorways), and this definition was used to differentiate between rural and urban areas. However, this definition did not take into account whether the road was in an urban or rural area and excluded rural villages with lower speed limits. More recently, the Department for Transport defined rural roads as major roads and minor roads outside urban areas and having a population of less than 10 thousand. Again, motorways are excluded from the definition of rural roads. This encompasses three distinct categories of road - main roads, villages and country lanes.

The Royal Society for the Prevention of Accidents Rural Road Environment Policy Paper: August 2010
3
1.2 How the Road Environment can Prevent Accidents
The road environment gives road users instruction, warning and information about the safest way to use the road. This information is provided by road signs, traffic lights and road markings (for example, a speed limit sign instructs drivers and riders they that must drive no faster than the limit shown). However, the nature of a road, and the environment through which it runs, also gives road users clues about how they can use it. Sometimes, these clues support the information given by the road (for example, a school on a 20 mph road), but sometimes it can seem to contradict it (for example, a dual carriageway with a 40 mph limit). In the later case, this can contribute to poor road user behaviour and so increase the chances of crashes and casualties. Drivers‟ and riders‟ choice of speed is partly dependent on the characteristics of the road on which they are travelling. Their perception of what is a safe speed on a particular road can often differ from that of other road users, such as pedestrians, pedal cyclists and horse riders, and will often under-estimate the actual level of risk. For example, wide straight roads tend to encourage higher speeds, and thereby increase the likelihood of collisions and their severity. This can be exacerbated by insufficient, poorly maintained or mis-leading road markings and signs, poor road surfaces and street furniture. Other factors, such as weather conditions, light levels and whether the road surface is wet, dry or icy all have a significant effect on risk levels.
It is crucial, therefore, that the road environment provides appropriate visual information to the people using it.

The Royal Society for the Prevention of Accidents Rural Road Environment Policy Paper: August 2010
4
2 MANAGING THE ROADS
Overall responsibility for managing our roads, including road safety policy, rests with the Government: the Department for Transport, the Scottish Executive, the Welsh Assembly Government and the Northern Ireland Assembly. The Highways Agency is responsible for managing motorways and all-purpose trunk roads in England, as is Transport Scotland in Scotland and Transport Wales in Wales. In Northern Ireland all roads are managed by the Roads Service. In London, the strategic road network is managed by Transport for London (TfL). Local roads (all roads except motorways and trunk roads) form around 85% of road miles in Britain, and most casualties occur on these roads. They are the responsibility of local Highway Authorities: the County, District, Borough or City Unitary authority. All Highway Authorities are required by law to ensure that their roads are designed, constructed and maintained so that they are safe and fit for purpose. Their statutory duties are contained in several Acts of Parliament, including:
Highways Act 1980: duty to maintain the highway
Roads (Scotland) Act 1984: similar duty
Road Traffic Act 1988: duty to study road accidents and take steps both to reduce and prevent accidents
Traffic Management Act 2004: duty to ensure efficient traffic movement
Transport Act 2000: duty to produce Local Transport Plans
Transport (Scotland) Act 2001: various road safety duties 2.1 Local Transport Plans (LTPs) Local highways authorities in England (excluding London) and Wales are required to produce five year Local Transport Plans (LTPs), and in Scotland, Roads Authorities are required to produce local transport strategies. These outline the local transport strategy, including road safety measures and priorities. Government Guidance1 states that a good Local Transport Plan will:
include a road safety strategy reflecting the needs of all road users, and be set in the context of strategies for safer communities, regeneration, danger reduction, and accessibility;
reflect national targets for casualty reduction, but tailored to local circumstances;
identify the most important local road safety issues, and solutions that may make use of revenue as well as capital expenditure;
consider particular issues of disadvantage and child casualties; and
contain evidence of successful working with other agencies e.g. police, education, Highways Agency.

The Royal Society for the Prevention of Accidents Rural Road Environment Policy Paper: August 2010
5
2.2 Standards The Department for Transport publishes advice notes and guidelines for the design, construction and maintenance of roads and for traffic management and road safety engineering measures. Although, Highway Authorities are not legally required to follow these, in most cases they do. Other guidelines are produced by professional bodies, such as the Institution of Highways and Transportation, often with the support of the Department for Transport.
These guidelines set out good practice in the design of roads and their components, and the strategic approach to, and the different techniques of, preventing and reducing casualties on them. There are four main approaches:
Single site: treating a specific location, such as a junction or short length of road.
Mass action: treating several different locations in an area with similar problems.
Route action: treating a whole route or section of a route with a higher than expected number of collisions.
Area-wide action: treating a whole area with different problems resulting in a higher than expected number of collisions.
These strategic approaches all depend upon the ability to identify sites, roads or areas with higher than expected casualties, so that those with the worst casualty records can be treated first. This approach is often criticised by members of the public on the grounds that it requires someone, and probably several people, to be killed or injured before any action is taken. However, highway authorities have limited resources (qualified staff and finance) and, therefore, need to prioritise how and where these resources are targeted. Road safety resources should be targeted according to casualty data because the presence of higher numbers of casualties indicates a particular problem(s) at the site(s), route or area identified and because those casualties will continue to occur unless the problem is treated. However, it is often possible for highway authorities to respond to calls for action at places where the casualty record does not justify the use of road safety resources by ensuring that road safety measures are incorporated into other schemes, such as regeneration and urban renewal schemes. 2.3 Road Safety Audit In addition to taking a remedial approach, it is also vital to design out the likelihood of accidents from the beginning when creating new roads or when making improvements on existing ones. Road Safety Audits are designed to ensure that any aspects of a road design or improvement scheme that are likely to increase the likelihood or severity of collisions are identified and eliminated before the road is built, and that the road includes all appropriate measures to reduce collisions and casualties. They must consider the safety of all road users – especially vulnerable road users, such as pedestrians and cyclists. Road Safety Audits are mandatory for new roads and improvement schemes on trunk roads and motorways. While not a mandatory requirement for other roads, it is good practice and most local Highway Authorities carry them out.
The Royal Society for the Prevention of Accidents Rural Road Environment Policy Paper: August 2010
6
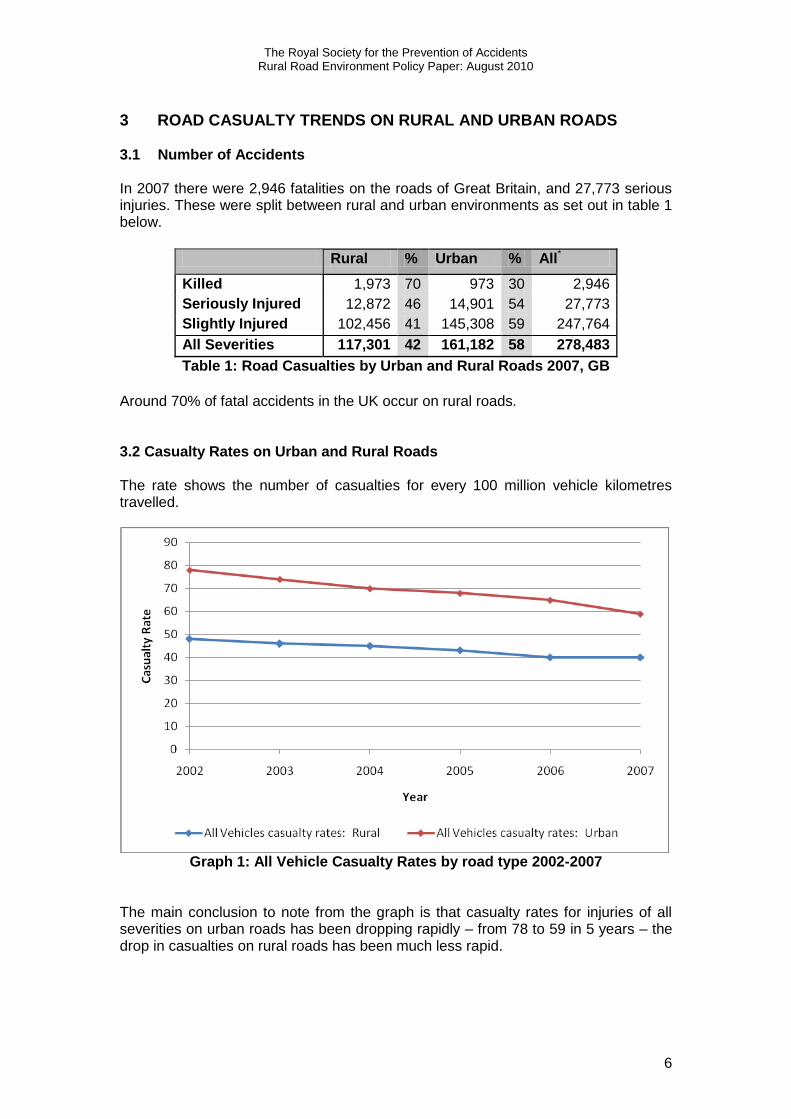
3 ROAD CASUALTY TRENDS ON RURAL AND URBAN ROADS 3.1 Number of Accidents In 2007 there were 2,946 fatalities on the roads of Great Britain, and 27,773 serious injuries. These were split between rural and urban environments as set out in table 1 below.
Rural % Urban % All*
Killed 1,973 70 973 30 2,946
Seriously Injured 12,872 46 14,901 54 27,773
Slightly Injured 102,456 41 145,308 59 247,764
All Severities 117,301 42 161,182 58 278,483
Table 1: Road Casualties by Urban and Rural Roads 2007, GB
Around 70% of fatal accidents in the UK occur on rural roads. 3.2 Casualty Rates on Urban and Rural Roads
The rate shows the number of casualties for every 100 million vehicle kilometres travelled.
Graph 1: All Vehicle Casualty Rates by road type 2002-2007
The main conclusion to note from the graph is that casualty rates for injuries of all severities on urban roads has been dropping rapidly – from 78 to 59 in 5 years – the drop in casualties on rural roads has been much less rapid.

The Royal Society for the Prevention of Accidents Rural Road Environment Policy Paper: August 2010
7
3.3 Accidents by Road User Group
Rural % Urban %
Fatal 219 34 427 66
Pedestrians KSI 1,205 17 5,719 83
All 4,374 14 25,814 86
Fatal 66 49 70 51
Pedal Cycles KSI 687 27 1,870 63
All 2,984 18 13,210 82
Fatal 414 70 174 30
Motorcycle KSI 3,314 49 3,422 51
All 8,637 37 14,819 63
Fatal 1,151 80 281 20
Car User KSI 8,739 67 4,228 33
All 79,300 49 82,127 51
Fatal 35 63 21 37
Other Vehicles KSI 189 48 208 52
All 1,557 40 2,377 60
Table 2: Road User type casualties by Urban and Rural Roads 2007, GB The figures are shown separated into different road user groups to give an understanding of who is most at risk on urban and rural roads.

The Royal Society for the Prevention of Accidents Rural Road Environment Policy Paper: August 2010
8
Pedestrian Injuries Around one third of pedestrian fatalities occur on rural roads and the other two thirds on urban. Pedestrian injuries in rural areas are more likely to be fatal however, and the figures from table 2 show that 5% of all recorded pedestrian injuries resulting in a fatality, compared with urban areas where fatal casualties are 1.5% of pedestrian casualties. Pedal Cyclists There are a similar number of cyclist fatalities on rural and urban roads although, similar to the trend for pedestrians, many more of all severities occur on urban roads which tend to be used by a greater number of cyclists. Pedal cyclist casualties on rural roads also tend to be more severe than urban areas, with fatal or serious injuries representing around 1 in 4 of all casualties in rural areas and 1 in 7 in urban ones. Motorcyclists Although around 63% of motorcyclist injuries result from accidents in urban areas, around two and a half times more motorcyclists are killed on rural roads than on urban ones. Motorcycle accidents in rural areas are much more likely to result in a serious injury. Car User
In 2007, there were more car occupants killed on the roads than all other road user groups put together, and car occupants represented the largest casualty group on the roads. Although car user injuries of all severities are split evenly between rural and urban areas, severe injuries are more common in rural areas. Twice as many car occupant fatal and serious injuries and four times as many fatalities occur on rural roads than on urban ones. Other Vehicles Casualties in the other vehicles category are mainly LGV and HGV users, although the category also includes occupants of buses and coaches as well as other vehicles which may be using the road. Injuries are roughly split between urban and rural roads, and although slightly more KSI injuries occur in urban areas. Slightly more fatalities occur in rural areas.
The Royal Society for the Prevention of Accidents Rural Road Environment Policy Paper: August 2010
9
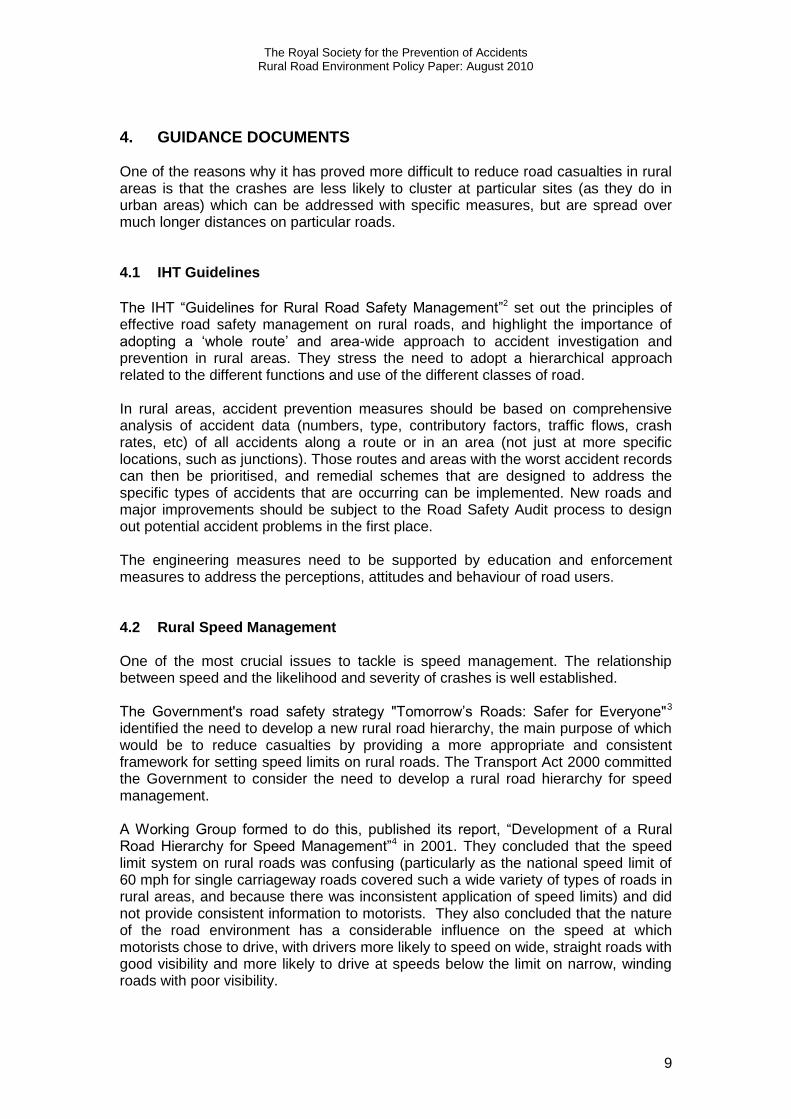
4. GUIDANCE DOCUMENTS One of the reasons why it has proved more difficult to reduce road casualties in rural areas is that the crashes are less likely to cluster at particular sites (as they do in urban areas) which can be addressed with specific measures, but are spread over much longer distances on particular roads. 4.1 IHT Guidelines
The IHT “Guidelines for Rural Road Safety Management”2 set out the principles of effective road safety management on rural roads, and highlight the importance of adopting a „whole route‟ and area-wide approach to accident investigation and prevention in rural areas. They stress the need to adopt a hierarchical approach related to the different functions and use of the different classes of road. In rural areas, accident prevention measures should be based on comprehensive analysis of accident data (numbers, type, contributory factors, traffic flows, crash rates, etc) of all accidents along a route or in an area (not just at more specific locations, such as junctions). Those routes and areas with the worst accident records can then be prioritised, and remedial schemes that are designed to address the specific types of accidents that are occurring can be implemented. New roads and major improvements should be subject to the Road Safety Audit process to design out potential accident problems in the first place. The engineering measures need to be supported by education and enforcement measures to address the perceptions, attitudes and behaviour of road users. 4.2 Rural Speed Management One of the most crucial issues to tackle is speed management. The relationship between speed and the likelihood and severity of crashes is well established. The Government's road safety strategy "Tomorrow‟s Roads: Safer for Everyone"3 identified the need to develop a new rural road hierarchy, the main purpose of which would be to reduce casualties by providing a more appropriate and consistent framework for setting speed limits on rural roads. The Transport Act 2000 committed the Government to consider the need to develop a rural road hierarchy for speed management. A Working Group formed to do this, published its report, “Development of a Rural Road Hierarchy for Speed Management”4 in 2001. They concluded that the speed limit system on rural roads was confusing (particularly as the national speed limit of 60 mph for single carriageway roads covered such a wide variety of types of roads in rural areas, and because there was inconsistent application of speed limits) and did not provide consistent information to motorists. They also concluded that the nature of the road environment has a considerable influence on the speed at which motorists chose to drive, with drivers more likely to speed on wide, straight roads with good visibility and more likely to drive at speeds below the limit on narrow, winding roads with poor visibility.
The Royal Society for the Prevention of Accidents Rural Road Environment Policy Paper: August 2010
10
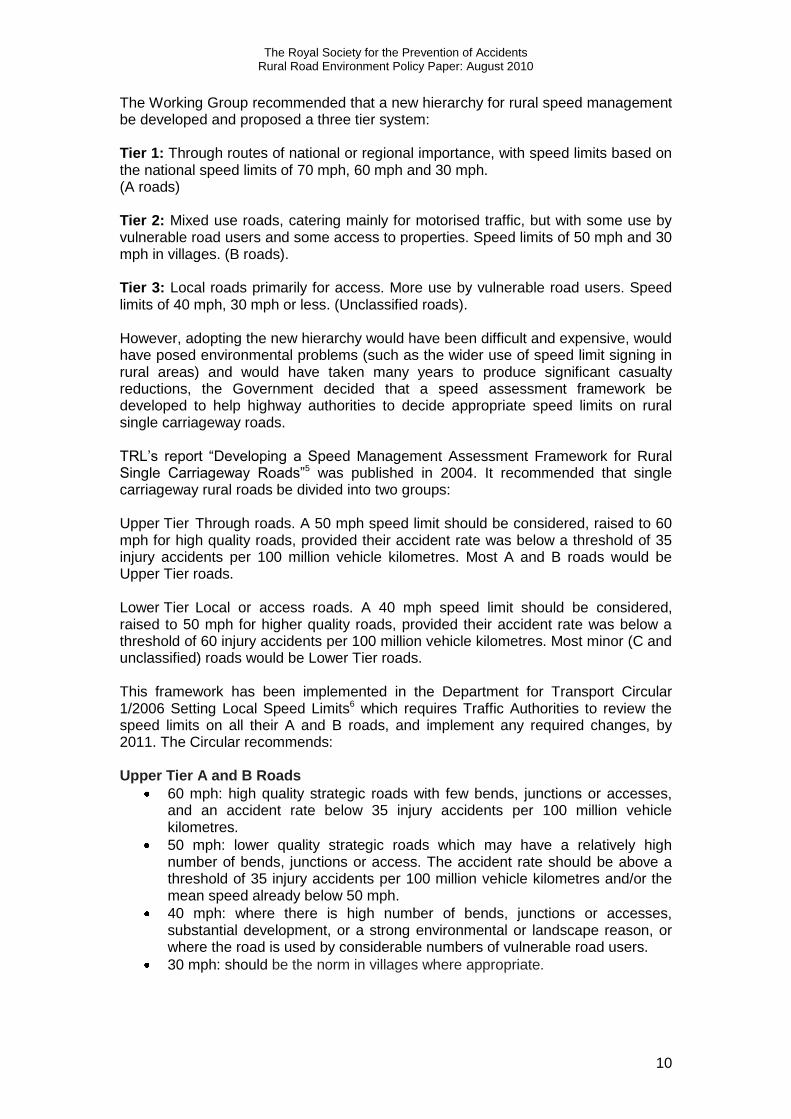
The Working Group recommended that a new hierarchy for rural speed management be developed and proposed a three tier system: Tier 1: Through routes of national or regional importance, with speed limits based on the national speed limits of 70 mph, 60 mph and 30 mph. (A roads) Tier 2: Mixed use roads, catering mainly for motorised traffic, but with some use by vulnerable road users and some access to properties. Speed limits of 50 mph and 30 mph in villages. (B roads). Tier 3: Local roads primarily for access. More use by vulnerable road users. Speed limits of 40 mph, 30 mph or less. (Unclassified roads). However, adopting the new hierarchy would have been difficult and expensive, would have posed environmental problems (such as the wider use of speed limit signing in rural areas) and would have taken many years to produce significant casualty reductions, the Government decided that a speed assessment framework be developed to help highway authorities to decide appropriate speed limits on rural single carriageway roads. TRL‟s report “Developing a Speed Management Assessment Framework for Rural Single Carriageway Roads”5 was published in 2004. It recommended that single carriageway rural roads be divided into two groups: Upper Tier Through roads. A 50 mph speed limit should be considered, raised to 60 mph for high quality roads, provided their accident rate was below a threshold of 35 injury accidents per 100 million vehicle kilometres. Most A and B roads would be Upper Tier roads. Lower Tier Local or access roads. A 40 mph speed limit should be considered, raised to 50 mph for higher quality roads, provided their accident rate was below a threshold of 60 injury accidents per 100 million vehicle kilometres. Most minor (C and unclassified) roads would be Lower Tier roads. This framework has been implemented in the Department for Transport Circular 1/2006 Setting Local Speed Limits6 which requires Traffic Authorities to review the speed limits on all their A and B roads, and implement any required changes, by 2011. The Circular recommends: Upper Tier A and B Roads
60 mph: high quality strategic roads with few bends, junctions or accesses, and an accident rate below 35 injury accidents per 100 million vehicle kilometres.
50 mph: lower quality strategic roads which may have a relatively high number of bends, junctions or access. The accident rate should be above a threshold of 35 injury accidents per 100 million vehicle kilometres and/or the mean speed already below 50 mph.
40 mph: where there is high number of bends, junctions or accesses, substantial development, or a strong environmental or landscape reason, or where the road is used by considerable numbers of vulnerable road users.
30 mph: should be the norm in villages where appropriate.
The Royal Society for the Prevention of Accidents Rural Road Environment Policy Paper: August 2010
11
Lower Tier C and Unclassified Roads
60 mph: only the best quality roads with a mixed function (i.e. partial traffic flow and local access) with few bends, junctions or accesses (in the longer term these roads should be assessed using the upper tier criteria).
50 mph: lower quality roads with a mixed function where there are a relatively high number of bends, junctions or accesses, and an accident rate below 60 injury accidents per 100 million vehicle kilometres.
40 mph: roads with a predominantly local, access or recreational function, or where the road forms part of a recommended route for vulnerable road users. The accident rate should be above 60 injury accidents per 100 million vehicle kilometres.
30 mph: should be the norm in villages where appropriate. Although the Circular does not cover dual carriageways, it states that those with segregated junctions and facilities for vulnerable roads users should be suitable for a 70 mph limit, although a lower limit may be appropriate if, for example, the road accident history indicates that this is too high. Setting speed limits is, of course, only one part of speed management. Motorists are much more likely to adhere to speed limits if they believe that they are appropriate for the road and they understand the reason why they are lower than, for example, the national speed limit. Traffic calming measures are unsuitable for high speed rural roads (although they can be appropriate in towns and villages). Speed limit signs are essential – motorists need to know what limit they should be obeying. Other signs and road markings can also be effective in encouraging drivers to slow down by alerting them to approaching hazards (a bend, for example) or by creating the perception that, for example, the road is narrower than it is. In rural areas, it is important that this sort of treatment is used consistently along a route, including if necessary at locations that do not have an accident problem in order to maintain consistency.

The Royal Society for the Prevention of Accidents Rural Road Environment Policy Paper: August 2010
12
5. SAFETY INTERVENTIONS ON RURAL ROADS
This chapter looks at several different types of road engineering which can be used on rural roads to help to prevent accidents, either on their own or as part of a larger treatment.
5.1 Self Explaining Roads The aim of a self explaining road is create a simple and clear road environment, rather than one which may be complex or ambiguous. One author7 describes self explaining roads as, “simple and unambiguous, clear and understandable, readable and recognisable traffic situation – easy to handle for the road users – without too many distractions and overload – and leaving no doubt about the reasonable speed level, the give way situation, location and movement of other road users around” One of the aims of a self-explaining road is to make the actions of road users more predictable. In order to achieve this, the design of self explaining roads requires understanding between the fields of traffic psychology and roads engineering. There have been simulator studies examining what effect „predictable‟ roads have on driver behaviour. One study8 found that predictable roads resulted in drivers adopting a more uniform distance away from the side of the road. The „predictable‟ road designs also resulted in slower speeds. There are several examples of Self Explaining Roads, many of which were compiled in a Catalogue of Ideas by the Danish Road Directorate in 20039. The rest of this section will describe the sort of safety measures which can be provided by self explaining roads. 5.1.1 Centre line markings Centre line markings can influence driver and rider behaviour, depending on the nature of the road, the layout of the markings, and the type of accidents along a stretch – amongst other criteria. Increasing or decreasing the length of the centre lines could be used to influence a driver‟s speed choice. Reducing the distance and spacing of the central markings on roads with lower speed limits may encourage road users to slow down. Increasing the width of the centre line or creating a hatched section encourages drivers to stay away from the middle of the road. This also affects a driver‟s speed choice by decreasing the perceived width of the carriageway, and increasing a vehicle‟s proximity to the road side. This approach can also be combined with painting to create a 3d effect when observed from a driver‟s or rider‟s point of view. One Australian paper10 looked at the effects of wide centre markings with painted hatching, and found that they reduced speeds. The researchers set out that the marking created an enhanced peripheral visual speed perception, leading to drivers estimating that they were travelling at higher speeds, and therefore slow down.

The Royal Society for the Prevention of Accidents Rural Road Environment Policy Paper: August 2010
13
Rumble strips, also referred to as rib markings, can alert drivers if they travel too close to, or onto the centre line. Whilst drivers may not perceive any change in the road which influences speed choice, they can reduce head-on collisions. Markings like this are currently used at the edge of the carriageway. Two studies on using rumble strips as a centre line have taken place in Canada and have been found to reduce the number of head-on collision and opposing-direction sideswipe crashes by 25%11,12.
Removal of the centre line can create a sense of uncertainty and encourage road users to take a slower speed in some circumstances. This can also be used in conjunction with edge lines close to the side of the road leaving a space for cyclists and pedestrians to use. An evaluation of removing the centre lines and introducing edge lines a short distance from the side of the road was undertaken in Denmark. It found that speed limits were still exceeded, but drivers did slow down as intended when vehicles were passing. It noted that no conflicts were observed in the areas where the road changed from a traditional two lane road to the new style and back, and that drivers approaching the area from a side road still gave way at the correct markings. One intervention which can be used to reduce drivers‟ speeds and improve awareness of surroundings is a stretch of grass in the middle of the road which drivers must either keep to the side of or straddle. This is primarily an intervention which would be used on roads which carry only a small amount of traffic. 5.1.2 Speed Reducers Self-explaining roads can also be designed to encourage drivers to reduce their speeds without using physical interventions in the road or speed enforcement. Introducing the perception of the road narrowing can reduce vehicle speeds, and one method of doing that is to edge the road with roadside islands or reduce the distance between roadside objects and the actual roadside Another proposed method of reducing vehicle speeds is to lay road surfaces which rock or wave a vehicle as it travels along the road. The aim of this technique is to make drivers more aware of their environment and speed by temporarily decreasing the level of driving comfort. However, this would have implications for vehicle stability, and could be dangerous. 5.2 Forgiving Road Sides A particular issue on rural roads is if vehicles leave the carriageway, there are many roadside objects such as trees and signs. Such rigid objects can significantly increase the severity of a collision. Signs The number of signs can be reduced or made safer to reduce the risk of injury from colliding vehicles. Initially the best approach is to look at whether signs can be removed all together and presenting the information on other already existing roadside furniture.

The Royal Society for the Prevention of Accidents Rural Road Environment Policy Paper: August 2010
14
This approach of amalgamating road signs can also support other initiatives to improve the rural characteristics of an area. In some situations it will be impossible to reduce or remove signs, and so it may be necessary to use passively safe sign posts which are more forgiving and less likely to cause injury when impacted. Vegetation While roadside vegetation can help to mark out the direction of the road in front, in some circumstances badly positioned vegetation where vehicles are likely to run off the road can cause severe injuries. The creation of a clear zone free of vegetation by the side of the road can have an impact in reducing the number of accidents, depending on the size of the zone. Table 3 shows some previous results on the relationship between accidents as the distance between the side of the carriageway and vegetation is increased (described in the table as „roadside recovery distance‟.
Amount of increased roadside recovery distance in metres
Reduction in related accident types (per cent)
Straight Curve
1.5 13 9
2.4 21 14
3.0 25 17
3.6 29 19
5.0 35 23
6.0 44 29
Table 3, reduction in accidents with the increase in clear space by the road side13
5.3 Vehicle Activated Signs (VAS)
Vehicle activated signs attract a driver‟s attention. They can display junction or bend warning signs, particularly on approaches to isolated hazards, such as junctions and bends in rural areas. The signs are activated when they detect vehicles travelling over a threshold speed. Department for Transport guidance14 recommends the threshold speed for VAS which display warnings should be set at the 50th percentile speed at the location prior to installation. For speed limit VAS, the threshold speed should depend on the road conditions, but a reasonable benchmark could be the ACPO guidance on enforcement – 10% above the speed limit + 2mph. One advantage of the signs is that the signs can activate at speeds below the level at which police would normally enforce the limit. Vehicle Activated Signs can also display the speed the driver is doing sometimes with warning messages such „slow down‟. This is generally known as a Speed Indicator Device (SID). A large-scale evaluation of the effectiveness of VAS was carried out by TRL15 at rural locations - in Norfolk, Wiltshire, West Sussex and Kent - where there was a previous accident problem or the concern that excessive speeds created a danger. It studied four different sign displays

The Royal Society for the Prevention of Accidents Rural Road Environment Policy Paper: August 2010
15
Speed limit roundels
Bend Warnings
Junction Warnings
Speed Camera Repeater Signs. The report also surveyed public opinion about the signs The results of the evaluation found that the speed limit roundels reduced mean speeds by between 3 mph and 9 mph across the sites, with the higher reductions being at locations where the speed limit was also reduced at the same time as installing the signs. At sites where the speed limit remained the same before and after the sign was installed the average mean speed reduction was 4 mph. Junction and bend warning signs were found to reduce the mean speeds at locations by up to 7 mph, and the speed camera repeater signs reduced mean speeds by an average of 4 mph and also gave a small decrease in the number of accidents at the site when compared to the effect of speed cameras on their own. There was a statistically significant reduction in the number of accidents at the sites where the VAS were installed in Norfolk. Importantly, there was very little indication that the signs only had a novelty effect, and their influence on speed reduction was sustained over a long period. Surveys with members of the public found that there was overwhelming approval for the VAS, and the drivers surveyed had identified that the purpose of the signs was to either slow traffic or warn drivers of an upcoming hazard. Most drivers had identified that the signs were activated if a vehicle travelled above a pre-set speed, although over half of the drivers also thought that triggering the speed camera warning signs would result in a fixed penalty. More recently, trials of Vehicle Activated Signs (specifically Speed Indicator Devices) by TfL have found that although they were effective in reducing speeds by between 0.6mph and 2.6mph on 30mph roads in London, they were only effective at doing so in the first two weeks of operation16. 5.4 Quiet Lanes Although not primarily safety interventions, the introduction of Quiet Lanes can have an influence on the way that drivers use the roads. Quiet Lanes are classified as a carriageway where the whole space is available for a variety of uses. Local traffic groups must be satisfied that the speed of the road is low enough to reflect its multifunctional nature. Improving and maintaining the quality of life for the local residents should take precedence over vehicle movement. By containing the increase in rural traffic Quiet Lanes aim to preserve the nature and character of the rural community. To achieve this there must be three facets to the scheme:
Community involvement to facilitate a change in user behaviour.
Direction signs spread over the area to discourage through traffic.
“Gateway” signage similar to those entering villages that inform users the carriageway is multifunctional.

The Royal Society for the Prevention of Accidents Rural Road Environment Policy Paper: August 2010
16
Quiet Lanes can only be minor networks with low flows of motorised traffic travelling at lower speeds. The road must be suitable for use by groups such as walkers, equestrians and cyclists to qualify. For more information, see DfT Circular 02/0617. 5.5 Junction Design A study of accidents on rural single-carriageways roads18 found that most crashes occurred on two-lane A roads with speed limits of 60 mph, and occurred away from junctions. They mostly involved two vehicles, but no pedestrian and occurred in daylight and good weather. However, single vehicle accidents accounted for almost one third of all accidents. The crashes were more likely to be severe on wider, major roads, away from junctions, in the dark and in fine weather. The design of junctions is crucial on these roads. The IHT Guidelines note that T-junctions have lower accident rates than cross roads and roundabouts, and recommend that multi-arm junctions be avoided. Junctions can be hidden by bends and undulations in the road or by overgrown vegetation, resulting in drivers approaching too fast because they are not aware a junction is ahead, and not expecting traffic to emerge onto their road, or to slow down to turn off into the junction. Good sightlines are also essential to help drivers assess when it is safe to emerge into the junction. Therefore, it is essential to make junctions as conspicuous as possible with advance warning signs and road markings, and to ensure that there are good sightlines for traffic emerging from the junction onto, or across, the A road. The concept of improving driver information about gaps in the traffic on rural roads has also been evaluated. One simulator19 study compared driver behaviour when displays that provided information about gaps in the traffic, as well as advisory information about whether it would be safe to pull out. It found that the signs which performed best and had a high level of comprehension, acceptance and usability amongst drivers were the ones which provided detailed information about time it took for the oncoming vehicle to arrive and a warning about whether the size of the gap is safe to pull in to. There are some junction specific measures which can be used to prevent accidents on high speed rural roads, for example, during the road design, the inclusion of acceleration and deceleration lanes can be used to prevent vehicles from having to change speed rapidly while in the flow of traffic.

The Royal Society for the Prevention of Accidents Rural Road Environment Policy Paper: August 2010
17
5.6 Bend Design Rural roads often have bends, many of which are sharp turns. Typically drivers are warned of bends by a warning sign and often chevrons going round the bend. Other typical measures are to put double while lines in the centre of the road to prevent overtaking, or the use of hatching to reduce the chances of a head on collision. Chevrons are a method of warning drivers about a sharp bend where there have been a large number of accidents. As well as conventional chevrons, other design options may be a single large chevron, which TRL research20 on a driving simulator found to be more effective than four smaller chevrons. The IHT guidelines recommend a consistent approach on bends along the same route, so that, for example, the most severe bends are marked and signed in the same way.

The Royal Society for the Prevention of Accidents Rural Road Environment Policy Paper: August 2010
18
6 SAFETY INTERVENTIONS IN RURAL SETTLEMENTS
6.1 Village Speed Limits
DfT Guidance21 states that a 30 mph speed limit should be the norm in villages. For some villages 20 mph zones should be considered. For the purpose of setting speed limits, the definition of a village is:
20 or more houses (on one or both sides of the road); and
a minimum length of 600 metres. If there are just fewer than 20 houses, traffic authorities should make extra allowance for any other key buildings, such as a church, shop or school. 6.2 Countdown Signs In order to manage the transition between a higher speed limit on a rural road and a 30mph village speed limit, countdown signs have been used. Countdown signs are positioned 300, 200 and 100 yards before the speed limit change, and contain information about what the new speed limit is, and diagonal bars similar to the exit count down on motorways. The signs are not contained within The Traffic Signs Regulations and General Directions (TSRGD) and require special authorisation from The Department for Transport. There have been mixed research results about the effectiveness of countdown signs, with some showing large reductions in mean speeds and other research showing no noticeable effect. One potential advantage with the countdown signs would be if visibility of the approaching speed limit sign is restricted; however alternative solutions to this problem may be to more simply move the speed limit sign forward to improve its visibility. 6.3 Village Gateways As a driver approaches a village they need to be informed that they are about to enter a different environment with different hazards. Graduating the speed limit in advance of a village is an effective way of doing this, especially if the approach road has high speeds, and/or if there are buildings before the start of the village proper. It is normally achieved by placing an intermediary limit of 40mph before the start of the 30 mph zone in the village itself. This helps drivers to reduce their speed in time for entering the village. “Village Gateways” are another way to inform drivers that they are entering an environment that is likely to include vulnerable road users and so they need to reduce their speed. They can consist of natural features (such as verges) and/or artificial features (such as chicanes). They normally include distinctive signs and road markings. “Gateways” need to be in sight of the village so the driver understands and can see why the limit is changing. Vehicle Activated Signs can also be a prominent feature.

The Royal Society for the Prevention of Accidents Rural Road Environment Policy Paper: August 2010
19
“Gateways” have only a limited effect and need to work in tandem with road safety measures within the village itself. Installing mini-roundabouts, narrowing the road and
constant signage on speed limits, can control driver speed. Stone gateways can be rigid, and there is concern that in a collision there could increase the severity of an accident. 6.4 Psychological Traffic Calming In Villages One method of improving the safety in villages without resorting to traditional physical measures to slow vehicles down is psychological traffic calming. This seeks to influence a driver‟s behaviour through the design of the environment, whilst preserving the characteristics of the village. A psychological traffic-calming scheme was trialled in the village of Latton in Wiltshire22 (which is just off a main, dual carriageway, A-road), and was intended to reinforce a speed limit change from 40 to 30 miles per hour. Stone gateways were constructed to create a well-defined entrance to the village and speed limit signs were mounted upon them. The gateways were built out by one metre into the road to reduce its width. Throughout the village itself, the central white line was removed, and build-outs with parking bays were used to reduce the width of the road. A buff surfacing was used in one part of the village to create a difference in road texture, and the lighting columns were reduced in height – as a tall light suggests to the driver that the road has a high speed limit. Speeds were measured before and after the scheme. The percentage of drivers exceeding 30mph dropped from around 85% to 50% and the percentage exceeding 40mph dropped from 50% to around 10%. The speeds were measured 7 months after the scheme was implemented which suggests that the effects were not due to a transient novelty effect. Pedestrian safety in the village was considered. Footways provide a safe place for people to walk and help to control driver speed because the width of the road will have to be narrowed to make room for the footways; a width of two metres is recommended. Off-carriageway parking spaces that are easily seen, well lit and well positioned help to keep the carriageway itself clear, but clearly depend upon sufficient space being available.
The Royal Society for the Prevention of Accidents Rural Road Environment Policy Paper: August 2010
20
7 SAMPLE SCHEMES
The Rural Road Safety Demonstration Project is being carried out by the DfT with four local authorities - Devon, Lincolnshire, Norfolk, and Northamptonshire County Councils. These Local Authorities were selected due to their awards of Beacon Road Safety status. Each of the four local authorities is carrying out a range of interventions designed to reduce accidents in their area, and the interventions include education and enforcement measures, as well as road engineering. They are therefore good examples of how local authorities can design and implement an overall strategy to tackle the particular issues of rural road safety in their areas. The local projects will be evaluated to identify what new knowledge has been gained and good practice guidance will be developed and disseminated. Data Sources All of the schemes were underpinned by a strong use of data by the Local Authority before introducing the safety measures. Although each authority had unique issues, several common themes emerged. Motorcyclists and young drivers were road users commonly involved in accidents in the project areas, and key causation factors were speeding, wet conditions and limited visibility due to a variety of factors such as maintenance, dark conditions, or bends in the road. As well as the STATS 19 Data, Lincolnshire and Norfolk used PCT data to gather more in depth information about the injury severity and enhance data coverage. Lincolnshire and Northamptonshire also used data from the Fire and Rescue service. Data was collected on the road network characteristics and how vehicles used it. Speed data was collected by all four authorities as a way to monitor and track road user behaviour. Road Safety Audits were also used to identify specific network conditions by some of the authorities. The public were consulted by all four of the Local Authorities, often to understand public opinion and views of roads in the project area. Methods of doing this varied between Local Authorities, with some running focus groups and public meetings, and others consulted with local elected members and Parish Councils. These helped to inform the strategy development in some of the Local Authorities, as well as identifying areas of public concern that were not necessarily the site of accident clusters. Devon carried out human factors research along two of the routes, with a view to change road user behaviour rather than the road network. Many of the Authorities also looked at some levels of socio-economic data. Postcode data was used to target ETP initiatives that accompanied the engineering work by one authority and another used a depravation study to inform the strategy. The local road safety partnership in Lincolnshire have developed a database called „Wings‟ to help inform road safety activities, and this includes data such as; travel to work zones, social depravation, collision and casualty data, road user data and speed data. Finally, all of the Local Authorities collected maintenance data, often including foliage surveys.

The Royal Society for the Prevention of Accidents Rural Road Environment Policy Paper: August 2010
21
7.1 Rural Demonstration Project Norfolk Norfolk was awarded road safety beacon status following a reduction in the number of KSI‟s in the county by almost half since the mid to late 1990s. The demonstration area chosen was in the North East of Norfolk, around the market towns of North Walsham, Aylsham and Stalham. The Norfolk Rural Road Safety Demonstration Project is mainly based around an engineering approach, and focuses on the design of roads to encourage safer use or provide a safer road side environment. The most dangerous roads where interventions were required within the demonstration area were identified using the EuroRAP principles. The main targets for the interventions are rural A-roads in non-built up areas. Accident rates on Norfolk A-Roads are roughly similar to the national average, however, one of the main issues that the interventions are designed to address is that the accident severities are higher. An analysis of where accidents were occurring in Norfolk found that around 60% of the county‟s KSI‟s, and 74% of the fatal casualties were occurring on this type of road. Almost half of the fatalities in Norfolk involved a vehicle leaving the road and striking a roadside object. Interventions There are a few general measures proposed for the whole area. Vegetation around the roadside was identified as a hazard to vehicles leaving the carriageway, and also as having the potential to obstruct roadside signs. Within the area of the project, vegetation and problem trees will be removed. Signs within the area will also be rationalised, with unnecessary signs being removed Where signs are used, they will be mounted on passively safe posts in order to reduce the risk of injury if a vehicle struck them. There are several smaller interventions within the project area, mainly aimed at individual routes or settlements. As a method of preventing vehicles from leaving the road and striking an object, recovery strips and paved recovery zones are to be implemented on the A140 between Aylsham and Roughton. This will provide a system of warning drivers that they are leaving the carriageway, as well as providing the time and space for them to regain control of the vehicle and return it to the main carriageway should they veer off. There are some examples of self-explaining areas in the project, which aim to give an identity and sense of place to the area, which will have an impact on driver behaviour. The A1062 tourist route has been identified as a location for a self-explaining route. The road itself has been the site for 17 casualties, including 8 fatal or seriously injured over the last 3 years.

The Royal Society for the Prevention of Accidents Rural Road Environment Policy Paper: August 2010
22
The village of Hemsby will also be transformed into a self-explaining village, and the removal of signs and introduction of relevant psychological traffic calming will also help to maintain the unique character of the village. The Project also encompasses Education and Enforcement measures. The role of publicity is vital with many of these changes to explain what they mean, why they‟re being done, and their advantages. It is intended that average speed cameras will be used on the A149, which has a history of casualty accidents, and a camera vehicle will also be used to detect speeding. Community Speedwatch programs will also be run in villages throughout the area, and activities will be linked with short term roadside speed reduction measures, such as campaign publicity and Vehicle Activated Signs.

The Royal Society for the Prevention of Accidents Rural Road Environment Policy Paper: August 2010
23
7.2 Rightracks Project: A Rural Road Safety Strategy for Northamptonshire Northamptonshire is a county in the East Midlands, and due to its position in the centre of the country, the county has several major transport links running through it and is a location for the distribution and logistics industry. The population of Northamptonshire is set to increase. The south west of the county was chosen as the area of the Rightracks project. A detailed analysis was conducted on the zone using the collision data from three years between 2005 and 2007, and from this, the eight most dangerous routes were identified as the primary roads for the project‟s focus. Interventions The Rightracks Project uses a Toolkit that lists potential solutions to preventing road accidents, split between the categories of education, engineering and enforcement. Each intervention of the tool kit is identified as being most effective when used to address a specific problem. Main causes of accidents on the eight most dangerous roads in the project have been identified, and these have been matched with potential interventions from the toolkit. As the project moves into the next phase, analysis of available data will identify the most relevant engineering measures for the roads. This will also be used to identify the groups of road users most at risk so a comprehensive education program can be put together. The enforcement interventions will be intelligence led and their overall objective will be to provide visible policing to encourage road users to slow down. The Fire and Rescue Service is also a member of the road safety partnership, and are producing a „time line‟ analysis of the KSI collisions they attend. This can be used to evaluate how response times can be improved. Local communities will also be engaged and kept up to date with the progress of the project via a programme of village road shows.

The Royal Society for the Prevention of Accidents Rural Road Environment Policy Paper: August 2010
24
7.3 Lincolnshire Rural Demonstration Project Lincolnshire is a predominantly rural county, and the fourth largest in the UK. This means that the rural road network is extensive and contains around 8893km of roads, the vast majority being single carriageway with the A46 and A1 accounting for most of the stretches of dual carriageway. The population of Lincolnshire is growing, with the majority of people migrating there being around retirement age. 74% of the Killed and Seriously Injured road users in the county occur on the rural road network, and 52% occur on unrestricted A & B roads meaning they are vastly over represented. The area identified for the Lincolnshire Rural Demonstration Project is in the South East, and encompasses much of the fenland area in the county. Several issues were identified as most likely to occur within the Rural Demonstration Project area.
Working with Foreign National Communities
Agricultural Vehicles
Collisions on the A17
Road Side Hazards Interventions The A17 was identified as having a high collision rate, despite reductions in recent years. The top twenty collision causes were identified, and several could be reduced by better speed management and speed choices along the road. Several sections of the road with a high accident rate were also identified for treatment. One method of reducing vehicle speeds will be to reduce the width of the lanes by putting a 800mm wide „ladder‟ marking in the centre of the single carriageway road, reducing the size of the lanes from 5m to 3.65m. The edge line will have a raised rib profile to give an audible warning for drivers if they drift into the middle. It is expected that this intervention will reduce the frequency of collisions by 0.3 per year and also reduce the severity of those that still occur. It is also intended to implement average speed cameras on a dangerous 2.2km stretch of the A17 with the aim of reducing the number of accidents and improving traffic flows. It is also hoped that the cameras will reduce the incidence of over-taking on double white lines. The A52 has also been identified for engineering treatment, with the aim of reducing collisions by 20% and average speeds by 4 mph. The engineering measures will consist of speed limit repeater signs, hazard warning signs, Speed Indicator Signs, and camera enforcement. Some of the signage will be vehicle activated. There were several general issues identified in the area, which were due to the rural nature of the environment. Mud on the road was identified as contributing to 9 KSI and 98 slight injury accidents, and both the County Council and the Police had received calls about mud on the road from concerned members of public.

The Royal Society for the Prevention of Accidents Rural Road Environment Policy Paper: August 2010
25
Roadside hazards were again identified as an issue, with 46% of fatal collisions in Lincolnshire involving a vehicle colliding with an object after leaving the carriageway. Although the area of the demonstration project is not heavily wooded, trees and ditches were common alongside roads. A detailed analysis of the data will lead to the filling or protection of ditches and the felling of roadside trees where necessary. Consideration will be given to the re-siting of signs or the introduction of passively safe signposts and lighting. To prevent injuries to riders of motorbikes, engineering measures will be implemented on the 12 high-risk motorcycle routes. Measures will include the relocation of existing road side furniture, the replacement of existing signs with collapsible signs and the introduction of protective “skirts” underneath safety barriers. Analysis of the routes will determine where the work will be best carried out. High visibility posters supplied by the Shiny Side Up Partnership will also be erected on the routes between April and October. To prevent night time collisions, high visibility lines will be introduced on some class B rural roads where there is an over representation in the number of night time accidents. Enforcement measures are a key part of the Lincolnshire Rural Demonstration Project, with several police operations running concurrently. Vehicle Activated signs at Mobile Speed Enforcement sites will also be used. Communities will also be involved in speed watch programmes. Finally, the changing demographic of the county and within the project area was identified as an area of investigation due to anecdotal evidence that the number of foreign nationals involved in collisions has increased. The project will establish whether there is an emerging problem by collecting accident data, and will identify accident causation factors and areas for further study. As part of the investigation, the Lincolnshire Road Safety partnership will translate its traffic law and road safety guide into 11 languages, which will be distributed to employers and made available at popular retail and leisure outlets.

The Royal Society for the Prevention of Accidents Rural Road Environment Policy Paper: August 2010
26
7.4 The Devon Rural Road Safety Demonstration Project Devon is a large county in the south west of England, with the largest rural road network of any county in the UK. The area chosen for the Demonstration Project in Devon is between Exeter and Barnstaple and mainly includes unclassified roads, notable for their narrow lanes and high hedgebanks which can restrict visibility. The area also contains a proportion of A roads. Interventions A communications strategy will be run, which will incorporate delivering the messages directly to businesses and individuals via households. This will be backed up with a publicity campaign through the media. There is a training aspect to the communications campaign also, and Devon County Council will work with other agencies to provide training, especially to traditionally hard-to-reach groups such as younger drivers and migrant workers. The council will also try and raise safety awareness with motorcyclists, especially about the danger of the A377. This communication strategy linked in with the high degree of consultation in the Devon demonstration project, and it is hoped that this approach would lead to a higher level of public support for the interventions. This is central to the strategy. The A361 is a former trunk road, identified for improvements, with common accident types causes being negligent manoeuvres, distraction, fatigue and close following. A mix of interventions will be employed for the route. The road design will be looked at to identify ways to mitigate the effects of vehicles leaving the carriageway, with roadside objects being identified as an issue, and junction improvements will be explored. Awareness will be raised of the speed limit changes from 70mph to 60mph on the A361. A program to raise safety awareness of regular uses of the route, at-work drivers and tourists will also be implemented. There will also be some provision of practical driver training to businesses and residents which will be focussed on rural roads especially the A361. Enforcement will also be used on the route with police presence being used as deterrent with the provision of observational platforms. A route enforcement strategy will be implemented with fixed and mobile speed cameras, and the police will work with Devon County Council to target unlicensed and illegal road users. Other routes have been identified for treatment – the A377, the A396 and the A3072 - and the engineering will be supported by education and training, mainly targeted at local road users. The roads will be improved by the creation of consistent signing along the route to improve readability of the road in both the day and night time. Visibility will also be addressed by design and the removal of intrusive foliage.

The Royal Society for the Prevention of Accidents Rural Road Environment Policy Paper: August 2010
27
An innovative bend treatment called „Where You Look Is Where You Go‟ (WYLIWYG) will be introduced to assist motorcyclists and other road users. Finally, the potential for treating villages along the route to reduce average speeds through them will be investigated. On other rural roads in the area, especially B, C and U Class, there are several safety issues, including poor visibility due to hedge banks, mud on the road from agricultural vehicles, and a mix of traffic types, including recreational users such as pedestrians, horse riders and cyclists. Low cost treatment will be used to address collision clusters, and the views of local residents will be sought when planning winter maintenance and foliage removal.

The Royal Society for the Prevention of Accidents Rural Road Environment Policy Paper: August 2010
28
7.5 B3157 Jurassic Coast & Village Speed Management treatment In April 2008, Dorset County Council published a new Rural Roads Protocol for the county23. This document set out the vision for rural road engineering in the county, and how it was to be implemented. The Vision set out in the Protocol was,
“All decisions affecting the highway environment in Dorset will ensure the conservation and enhancement of the outstanding quality of its landscape and settlements, while delivering a safe and convenient network for all modes of
movement” The protocol also sets out a series of principals. Several of the principals refer to safety. The principal of balancing the needs of safety, accessibility and information provision with those of environmental protection and enhancing the landscape and bio diversity is set out in the document. In order to do this, the amount of signage and un-required roadside furniture will be reduced – while still ensuring safety is not compromised. Some items of street furniture will be re-designed to be more appropriate to the environment. In settlements, the principals set out that the sense of place should be maintained through the use of local materials and locally distinctive streetscapes should be preserved, enhanced and used as references when designing changes to the highway. Importantly, the principals highlight that opportunities to test innovative road safety engineering measures in rural areas, such as psychological traffic calming. One specific early scheme that these principals will be applied to is the B3157 route between Chickerell and Bridport, which runs alongside World Heritage Coast and some coastal villages designated as areas of natural beauty. The section of the B3157 being treated is around 20 miles long and carries around 10000 cars per day during the peak summer period. The route will be addressed as whole rather than just addressing sections of it. This is designed to give a consistent approach to hazards and signage along the length of the road. Signage along the route will be assessed to identify signs which can be kept, removed, and need to be risk assessed before potential removal. The route will be designed to contain some psychological traffic calming with some centre lines removed. There has also been a detailed environmental report conducted on the verges along the route so that the wildlife and diversity can be considered when implementing changes. There are four village centres on the route and these are potential location for calming and measures within communities to enhance pedestrian safety and access to services. Again, the treatments will be sympathetic to the history and character of the villages. The scheme incorporates training measures, and local residents are being offered refresher driver of rider training along the route. As a pilot route, it is likely that the evaluation of the treatment can be used to design safety measures along other routes in the county.

The Royal Society for the Prevention of Accidents Rural Road Environment Policy Paper: August 2010
29
8 CONCLUSIONS
Environmental factors, including the road environment are the prime cause in 2-3% of accidents and contribute to around 18% of road accidents in total. However, altering and redesigning the road environment can have a much greater influence on preventing accidents. The road environment gives road users instruction, warning and information about the safest way to use the road, it is crucial that the road environment therefore provides appropriate information to the people using it. However, the nature of a road, and the environment through which it runs, also gives road users clues about how they can use it. Sometimes these clues can be complex and contradictory, or ambiguous. In 2007 there were 2,946 fatalities on the roads of Great Britain, and 27,773 serious injuries. Around 70% of fatal accidents in the UK occur on rural roads.
Whilst casualty rates on both urban and rural roads have been dropping, the fall in casualty rates on rural roads has been much less rapid.
Engineering the rural road environment may be one of the best ways to bring the rural casualty rates down further. In rural areas, engineering that targets whole routes or wide areas may be the best strategy. This can create consistency along the length of commonly used routes, or add to the character of the area. Self explaining roads can create a simple and clear road environment, rather than one which is complex or contradictory. Some methods to do this may be to alter the perceived road width with markings or roadside islands or changing or removing the centre line. Forgiving road sides can reduce the risk of injury if a vehicle leaves the road, and moving badly positioned signage and vegetation can address this issue. As a driver approaches a village they need to be informed that they are about to enter a different environment with different hazards. Village gateways can be used to clearly mark the entry to a village and can be used in tandem with other road safety engineering initiatives within the village itself. Recently there have been rural road safety demonstration projects in Devon, Lincolnshire, Norfolk and Northamptonshire. These have all demonstrated aspects of good practice. All of the schemes were underpinned by the strong use of data by the Local Authority before introducing the safety measures, and as well as Stats 19, data from the PCT and Fire and Rescue service was used. The public were consulted by all four of the Local Authorities to understand public opinion and views of roads in the project area. It is essential that this should be done before any scheme, rather than during it. All of the projects highlighted the importance of augmenting road engineering with education and information campaigns.
The Royal Society for the Prevention of Accidents Rural Road Environment Policy Paper: August 2010
30
9 REFERENCES 1 “Full guidance on Local Transport Plans: Second edition”, Department for Transport, 2006
2 “Guidelines for Rural Road Safety Management”, Institution of Highways and
Transportation, 1999 3 Tomorrow's roads: safer for everyone
http://www.dft.gov.uk/pgr/roadsafety/strategytargetsperformance/tomorrowsroadssaferforeveryone 4 Development of a rural road hierarchy for speed management
http://www.dft.gov.uk/pgr/roadsafety/speedmanagement/developmentofaruralroadhiera4798 5 “Developing a Speed Management Assessment Framework for Rural Single Carriageway
Roads”, D Lynam et at, TRL, 2004 6 “Setting Local Speed Limits” DfT Circular 01/2006
7 Herrstedt, L. Making Our Roads Safer – A Vision for the Future Safe Infrastructure. 1
st
Annual European Energy and Transport Conference. Barcelona. October 2001 8 Behavioural effects of predictable rural road layout: a driving simulator study, L.T. Aarts R.J.
Davidse, SWOV Institute for Road Safety Research 2007 9 http://www.trafitec.dk/pub/arrb2006.pdf
10 Perceptual lane width, wide perceptual road centre markings and driving speeds. Godley
ST, Triggs TJ, Fildes BN. Ergonomics 2004; 47(3): 237-56. 11
Centerline Rumble Strips Cut Accident Rates Stidger RW. Better Roads 2006; 76(9): 30-31. 12
Crash reduction following installation of centerline rumble strips on rural two-lane roads. Persaud BN, Retting RA, Lyon CA. Accid Anal Prev 2004; 36(6): 1073-9. 13
Safer Roads: A Guide to Road Safety Engineering, K.W. Ogden, ISBN 0 291 39829 4 Avebury Technical, England, 1996 14
http://www.dft.gov.uk/pgr/roads/tpm/tal/signsandsignals/vehicleactivatedsigns 15
“Vehicle-activated Signs – A Large Scale Evaluation, Report No. TRL548, M Winnett and A Wheeler, 2002 16
Effectiveness of Speed Indicator Devices on reducing vehicle speeds in London by LK Walter and J Knowles PPR 314 http://www.tfl.gov.uk/assets/downloads/effectiveness-of-SIDs.pdf 17
http://www.dft.gov.uk/pgr/sustainable/homezones/ular22006thequietlanesan5740.pdf 18
“Injury Accidents on Rural Single-Carriageway Roads, 1994-95: An Analysis of STATS19 data”, J Barker et al, TRL Report 304, 1998 19
Concept evaluation of intersection decision support (IDS) system interfaces to support drivers' gap acceptance decisions at rural stop-controlled intersections. Creaser JI, Rakauskas ME, Ward NJ, Laberge JC, Donath M. Transp Res F Traffic Psychol Behav 2007; 10(3): 208-228. 20
Taylor MC, Crinson LF and Osborn RE (2002b). An assessment of traffic calming for trunk roads using the TRL driving simulator. TRL Report 539. Crowthorne: TRL Limited 21
Traffic Advisory Leaflet 1/04, DfT, 2004 22
'Psychological' traffic calming J Kennedy et al, 2005 TRL641 23
The Dorset Rural Roads Protocol http://www.dorsetforyou.com/media/pdf/j/l/Rural_Roads_Protocol__April_2008.pdf