Embed Size (px)
Citation preview
Kang Chandararot and Dannet L iv
Cambodia Inst itute of Development Study
October 2013
Country Off ice for Thai land, Cambodia
and Lao People’s Democrat ic Republ ic
I LO As ia-Pac i f ic Work ing Paper Se r ies
Rural development and employment opportunit ies
in Cambodia: How can a national employment
pol icy contribute towards real ization of decent
work in rural areas?

Country Office for Thailand, Cambodia
and Lao People’s Democratic Republic
ILO Asia-Pacific Working Paper Series
Rural development and employment
opportunities in Cambodia: How can a national
employment policy contribute towards realization
of decent work in rural areas?
Kang Chandararot and Dannet Liv
Cambodia Institute of Development Study
October 2013

Copyright © International Labour Organization 2013 First published 2013
Publications of the International Labour Office enjoy copyright under Protocol 2 of the Universal Copyright Convention. Nevertheless, short excerpts from them may be reproduced without authorization, on condition that the source is indicated. For rights of reproduction or translation, application should be made to ILO Publications (Rights and Permissions), International Labour Office, CH-1211 Geneva 22, Switzerland, or by email: [email protected]. The International Labour Office welcomes such applications.
Libraries, institutions and other users registered with reproduction rights organizations may make copies in accordance with the licences issued to them for this purpose. Visit www.ifrro.org to find the reproduction rights organization in your country.
Chandararot, Kang; Liv, Dannet Rural development and employment opportunities in Cambodia : how can a national employment policy contribute towards realization of decent work in rural areas? / Kang Chandararot and Dannet Liv ; ILO Country Office for Thailand, Cambodia and Lao People’s Democratic Republic. - Bangkok: ILO, 2013 xiv, 42 p. ILO Asia-Pacific working paper series; ISSN: 2227-4391 (print); 2227-4405 (web pdf) ILO Country Office for Thailand, Cambodia and Lao People’s Democratic Republic rural employment / rural development / employment policy / agricultural employment / employment opportunity / role of ILO / Cambodia 13.01.3
ILO Cataloguing in Publication Data
The designations employed in ILO publications, which are in conformity with United Nations practice, and the presentation of material therein do not imply the expression of any opinion whatsoever on the part of the International Labour Office concerning the legal status of any country, area or territory or of its authorities, or concerning the delimitation of its frontiers.
The responsibility for opinions expressed in signed articles, studies and other contributions rests solely with their authors, and publication does not constitute an endorsement by the International Labour Office of the opinions expressed in them.
Reference to names of firms and commercial products and processes does not imply their endorsement by the International Labour Office, and any failure to mention a particular firm, commercial product or process is not a sign of disapproval.
ILO publications and electronic products can be obtained through major booksellers or ILO local offices in many countries, or direct from ILO Publications, International Labour Office, CH-1211 Geneva 22, Switzerland, or ILO Regional Office for Asia and the Pacific, 11th Floor, United Nations Building, Rajdamnern Nok Avenue, Bangkok 10200, Thailand, or by email: [email protected]. Catalogues or lists of new publications are available free of charge from the above address, or by email: [email protected]
Visit our website: www.ilo.org/publns or www.ilo.org/asia
Printed in Thailand

Country Office for Thailand, Cambodia and Lao People’s Democratic Republic iii
Preface
“To address the labour market challenges, the Royal Government will further deepen reforms of policy, and regulatory and institutional frameworks to ensure that all the components of the labour
market are collectively consistent, responsive and reinforcing each other […] to boost economic
growth, create jobs and promote livelihoods.”
Rectangular Strategy Phase III (2013-2018), Royal Government of Cambodia, paragraph 107
The International Labour Organization’s tripartite constituents in Asia and the Pacific - governments, employers’ and workers’ organizations - have committed themselves to an “Asia-Pacific Decent Work Decade 2006-2015”. In doing so they reaffirmed their commitment to achieving full, productive and decent employment for their people. The commitment shown by the Royal Government of Cambodia in developing a national employment policy with a focus on young women and men forms part of the policy efforts toward attaining the goals of Cambodia to consolidate its future development path, as well as those of Asia-Pacific Decent Work Decade 2006-2015.
Cambodia has grown at a remarkable average annual rate of over nine per cent during the decade prior to the onset of global financial crisis in 2008. Since then, the economy has recovered well, albeit more modestly than in the pre-crisis period, with the economy growing at little less than seven per cent on average between 2010 and 2012. While a decade of rapid growth has notably improved the livelihoods of the Cambodian people, with the headcount poverty rate falling from 39 per cent in 1994 to 30 per cent in 2007, poverty remained pervasive in the rural areas at 35 per cent in 2007. At the same time, employment has grown at 4 per cent per year between 1998 and 2008, but much of this growth has been in the rural areas and in the informal segments of the economy. Furthermore, productivity, as measured by output per worker, has been one of the lowest in the region and grew only modestly in the late 2000s. In 2010, output per worker in Cambodia was less than 4,000 in constant purchasing power parity dollars; this was two-third that of Viet Nam and less than one-fifth of Malaysia’s. As Cambodia grows into a middle income country, as envisaged by statements made in relation to Cambodia’s Vision 2030, there is a recognized need to diversify its economic base and to undertake higher value-added activities. Attaining such aspiration requires strategic policy approach, including an employment policy, to enhance productivity of and returns to work in the existing economic activities and to adequately skill and mobilize workers, particularly those currently engaged in vulnerable forms of employment, toward emerging sectors. This would ensure that the growth process is more equitable, generated through broad-based participation and empowerment of the Cambodian people.
To support the Government in developing an employment policy, the ILO has responded by providing policy advice. This first led to a generation of background analyses in areas that are pertinent to employment outcomes and employment policymaking. The ILO has also supported consultation meetings on the background analyses and their policy recommendations in 2012 and 2013, with active participation of the national stakeholders.
In this regard, we are grateful to the financial support provided by the Sweden-ILO Partnership (2009-2013) that has been contributing to the attainment of ILO’s outcome: More women and men have access to productive employment, decent work and income opportunities. It is also closely related to the work envisaged by the ILO on the areas of critical importance included in the programme and budget for the next biennium (2014-2015), namely promoting more and better jobs for inclusive
iv Country Office for Thailand, Cambodia and Lao People’s Democratic Republic
growth and jobs and skills for youth. In conducting this background research, we are also grateful to the strong commitment and support provided by the Employment Policy Department, ILO Geneva.
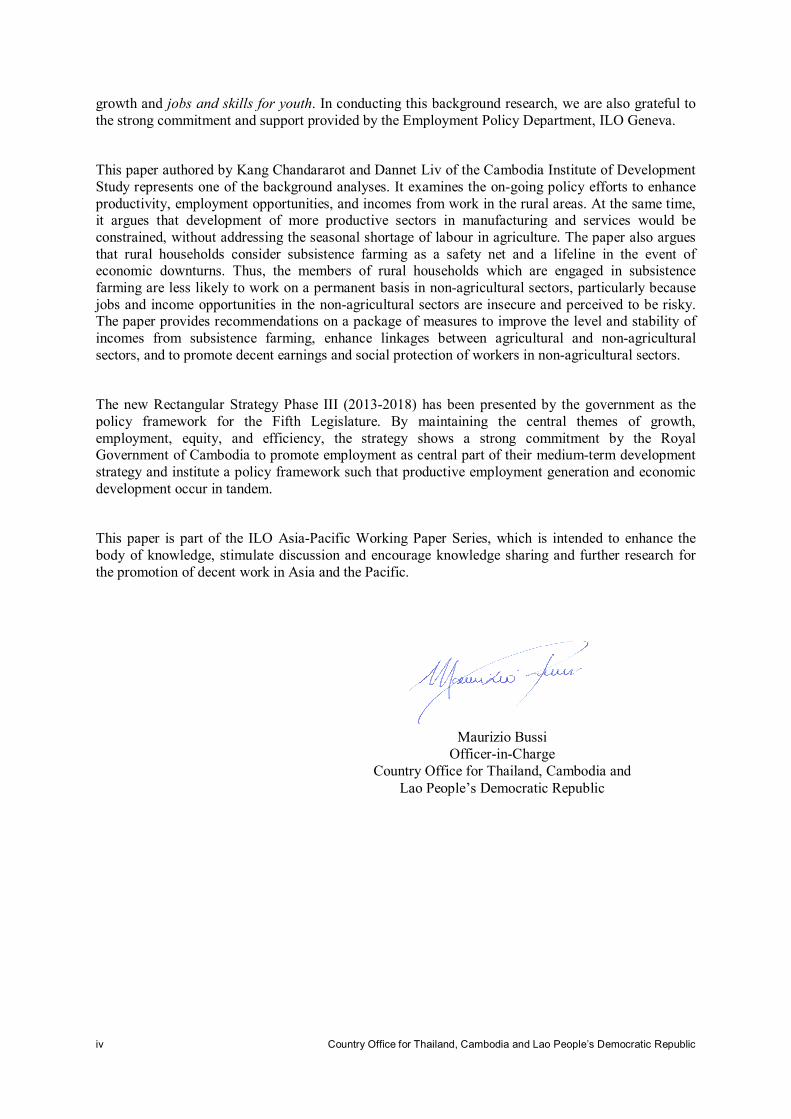
This paper authored by Kang Chandararot and Dannet Liv of the Cambodia Institute of Development Study represents one of the background analyses. It examines the on-going policy efforts to enhance productivity, employment opportunities, and incomes from work in the rural areas. At the same time, it argues that development of more productive sectors in manufacturing and services would be constrained, without addressing the seasonal shortage of labour in agriculture. The paper also argues that rural households consider subsistence farming as a safety net and a lifeline in the event of economic downturns. Thus, the members of rural households which are engaged in subsistence farming are less likely to work on a permanent basis in non-agricultural sectors, particularly because jobs and income opportunities in the non-agricultural sectors are insecure and perceived to be risky. The paper provides recommendations on a package of measures to improve the level and stability of incomes from subsistence farming, enhance linkages between agricultural and non-agricultural sectors, and to promote decent earnings and social protection of workers in non-agricultural sectors.
The new Rectangular Strategy Phase III (2013-2018) has been presented by the government as the policy framework for the Fifth Legislature. By maintaining the central themes of growth, employment, equity, and efficiency, the strategy shows a strong commitment by the Royal Government of Cambodia to promote employment as central part of their medium-term development strategy and institute a policy framework such that productive employment generation and economic development occur in tandem.
This paper is part of the ILO Asia-Pacific Working Paper Series, which is intended to enhance the body of knowledge, stimulate discussion and encourage knowledge sharing and further research for the promotion of decent work in Asia and the Pacific.
Maurizio Bussi Officer-in-Charge
Country Office for Thailand, Cambodia and
Lao People’s Democratic Republic
Country Office for Thailand, Cambodia and Lao People’s Democratic Republic v
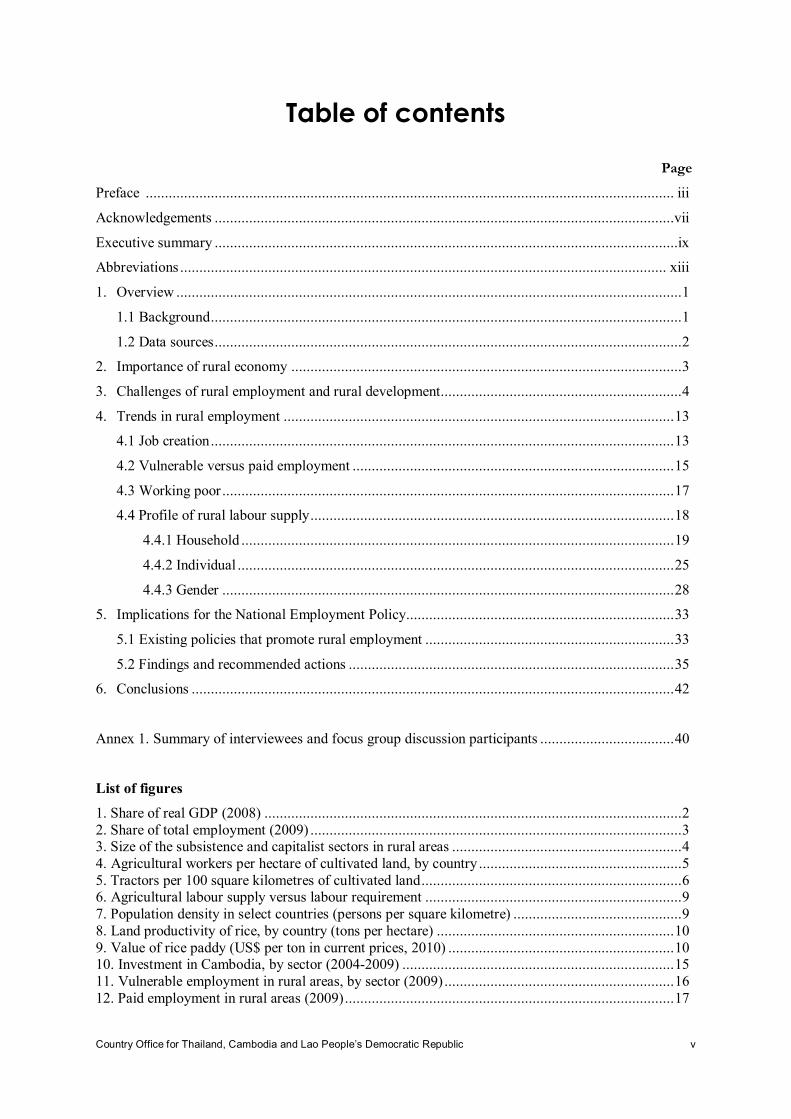
Table of contents
Page
Preface .......................................................................................................................................... iii
Acknowledgements ........................................................................................................................vii
Executive summary .........................................................................................................................ix
Abbreviations ............................................................................................................................... xiii
1. Overview .................................................................................................................................... 1
1.1 Background ........................................................................................................................... 1
1.2 Data sources .......................................................................................................................... 2
2. Importance of rural economy ...................................................................................................... 3
3. Challenges of rural employment and rural development............................................................... 4
4. Trends in rural employment ...................................................................................................... 13
4.1 Job creation ......................................................................................................................... 13
4.2 Vulnerable versus paid employment .................................................................................... 15
4.3 Working poor ...................................................................................................................... 17
4.4 Profile of rural labour supply ............................................................................................... 18
4.4.1 Household ................................................................................................................. 19
4.4.2 Individual .................................................................................................................. 25
4.4.3 Gender ...................................................................................................................... 28
5. Implications for the National Employment Policy...................................................................... 33
5.1 Existing policies that promote rural employment ................................................................. 33
5.2 Findings and recommended actions ..................................................................................... 35
6. Conclusions .............................................................................................................................. 42
Annex 1. Summary of interviewees and focus group discussion participants ................................... 40
List of figures
1. Share of real GDP (2008) ............................................................................................................. 2 2. Share of total employment (2009) ................................................................................................. 3 3. Size of the subsistence and capitalist sectors in rural areas ............................................................ 4 4. Agricultural workers per hectare of cultivated land, by country ..................................................... 5 5. Tractors per 100 square kilometres of cultivated land .................................................................... 6 6. Agricultural labour supply versus labour requirement ................................................................... 9 7. Population density in select countries (persons per square kilometre) ............................................ 9 8. Land productivity of rice, by country (tons per hectare) .............................................................. 10 9. Value of rice paddy (US$ per ton in current prices, 2010) ........................................................... 10 10. Investment in Cambodia, by sector (2004-2009) ....................................................................... 15 11. Vulnerable employment in rural areas, by sector (2009) ............................................................ 16 12. Paid employment in rural areas (2009) ...................................................................................... 17
vi Country Office for Thailand, Cambodia and Lao People’s Democratic Republic
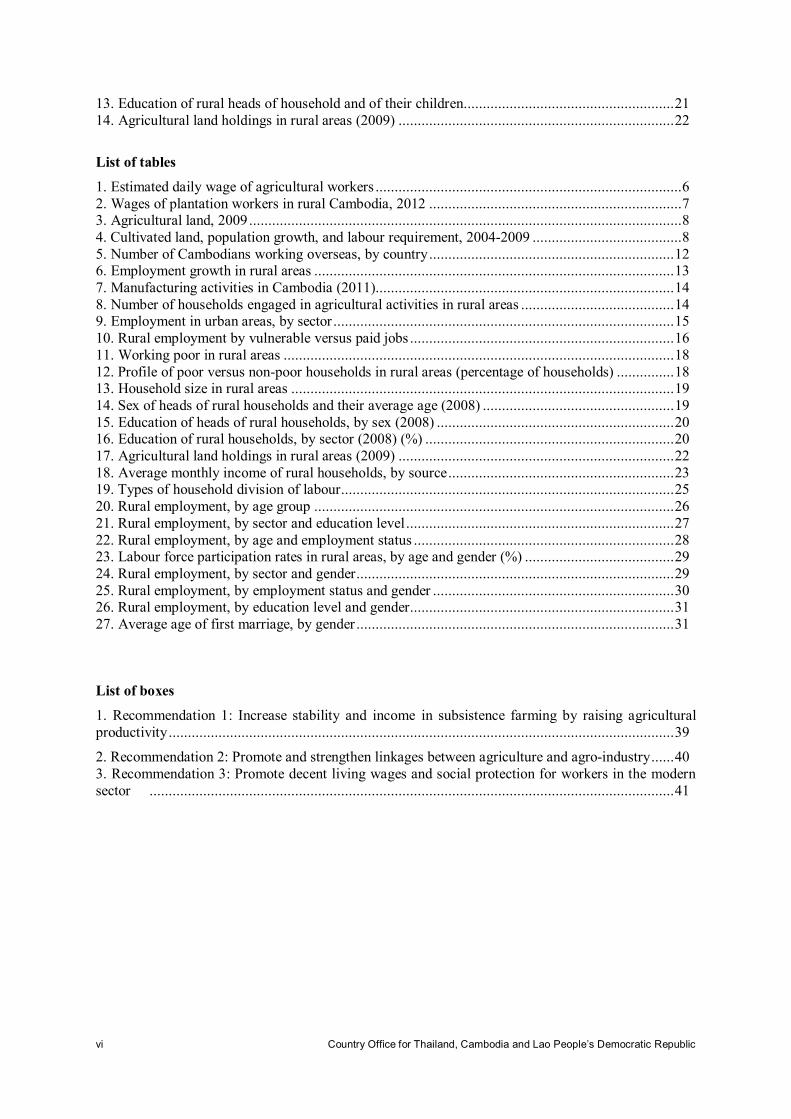
13. Education of rural heads of household and of their children....................................................... 21 14. Agricultural land holdings in rural areas (2009) ........................................................................ 22
List of tables
1. Estimated daily wage of agricultural workers ................................................................................ 6 2. Wages of plantation workers in rural Cambodia, 2012 .................................................................. 7 3. Agricultural land, 2009 ................................................................................................................. 8 4. Cultivated land, population growth, and labour requirement, 2004-2009 ....................................... 8 5. Number of Cambodians working overseas, by country ................................................................ 12 6. Employment growth in rural areas .............................................................................................. 13 7. Manufacturing activities in Cambodia (2011).............................................................................. 14 8. Number of households engaged in agricultural activities in rural areas ........................................ 14 9. Employment in urban areas, by sector ......................................................................................... 15 10. Rural employment by vulnerable versus paid jobs ..................................................................... 16 11. Working poor in rural areas ...................................................................................................... 18 12. Profile of poor versus non-poor households in rural areas (percentage of households) ............... 18 13. Household size in rural areas .................................................................................................... 19 14. Sex of heads of rural households and their average age (2008) .................................................. 19 15. Education of heads of rural households, by sex (2008) .............................................................. 20 16. Education of rural households, by sector (2008) (%) ................................................................. 20 17. Agricultural land holdings in rural areas (2009) ........................................................................ 22 18. Average monthly income of rural households, by source ........................................................... 23 19. Types of household division of labour ....................................................................................... 25 20. Rural employment, by age group .............................................................................................. 26 21. Rural employment, by sector and education level ...................................................................... 27 22. Rural employment, by age and employment status .................................................................... 28 23. Labour force participation rates in rural areas, by age and gender (%) ....................................... 29 24. Rural employment, by sector and gender ................................................................................... 29 25. Rural employment, by employment status and gender ............................................................... 30 26. Rural employment, by education level and gender..................................................................... 31 27. Average age of first marriage, by gender ................................................................................... 31
List of boxes
1. Recommendation 1: Increase stability and income in subsistence farming by raising agricultural productivity .................................................................................................................................... 39
2. Recommendation 2: Promote and strengthen linkages between agriculture and agro-industry ...... 40 3. Recommendation 3: Promote decent living wages and social protection for workers in the modern sector ......................................................................................................................................... 41

Country Office for Thailand, Cambodia and Lao People’s Democratic Republic vii
Acknowledgements
We would especially like to thank Sukti Dasgupta Makiko Matsumoto and Kazutoshi Chatani at the ILO for reviewing the report and providing interesting feedback to the authors. Thanks also to Muhammed Muqtada for contributing his valuable time to peer review the report.
We would also like to thank the numerous rural households, migrant workers, business people, and local authorities who openly shared their perspectives on rural employment issues with us, and helped form as well as strengthen the analysis.
Last but not least, we give special thanks to the staff at the Cambodia Institute of Development Study (CIDS) for all their hard work behind the scenes and dedication in helping to realize this project within a short period of time.

viii Country Office for Thailand, Cambodia and Lao People’s Democratic Republic
Country Office for Thailand, Cambodia and Lao People’s Democratic Republic ix
Executive summary
Background
Over the past two decades, the Cambodian economy has grown at a momentous average rate of 7.8 per cent per year from 1994 to 2010.1 Much of the growth over the past decade has been driven by four sectors: garments and footwear, hotels and restaurants, construction, and agriculture. Amongst these four sectors, agriculture grew the slowest, at an average rate of 5 per cent per year. This growth in agriculture has mainly been characterized by the expanded use of inputs as against intensive improvement in productivity. This is reflected in the slow growth in “value added” per worker, at 1.3 per cent per year between 1998 and 2008.2 At the same time, the agricultural sector – comprising agriculture, hunting and forestry, and fishing – employed about 72 per cent of Cambodian workers in 2008.
Against this backdrop, the Royal Government of Cambodia has requested the ILO’s support in formulating a National Employment Policy (NEP). Given the current employment pattern, understanding and enhancing employment opportunities in rural areas would most likely form one important backbone of the NEP.
Challenges in rural employment and rural development
Finding 1. No unlimited supply of labour in the agricultural sector.
The core finding of this research is that there is no unlimited supply of labour in rural areas, or more precisely the agricultural sector. The amount of labour currently available in the agricultural sector as a whole is already at a very low level (just 1.6 workers per hectare), which is almost as low as in countries with high agricultural mechanization such as Thailand and the Republic of Korea. This suggests that drawing labour out of the agricultural sector could negatively affect agricultural production. However, the data suggests that it may be possible to draw labour from the subsistence agriculture sector to propel growth in the modern, capitalist agriculture sector. Labour availability in the subsistence sector is 2.8 workers per hectare.
The responsibility for opinions expressed in articles, studies and other contributions
rests solely with their authors, and publication does not constitute an endorsement by the International Labour Office of the opinions expressed in them, or of any products,
processes or geographical designations mentioned.
1 CDRI: Annual development review 2011–2012. 2 NIS: Labour and social trends in Cambodia 2009.
About the authors
Dr. Kang Chandararot is the Director of the Cambodia Institute of Development Study and Ms. Dannet Liv is a researcher in the Cambodia Institute of Development Study.

x Country Office for Thailand, Cambodia and Lao People’s Democratic Republic
Finding 2. Rural households are tied to their land and will not part from it permanently.
Subsistence farming represents a safety net and ultimate security. Indeed, interviews with garment workers during the global financial crisis revealed the importance of subsistence farming during times of crisis.3 Garment workers said that in order to cope with the fall in their wage earnings due to reduced overtime opportunities, they relied heavily on rice from their parents’ farms to cut costs and stay afloat. Therefore, the decision to release working-age family members into the modern sector permanently is dictated by the potential effects this can have on subsistence activities. Even when family members are released into paid employment, there are always some other family members remaining in the village to engage in subsistence farming. When there are no other alternatives, migrant workers are often called back home to help.
Finding 3. Some rural labourers have moved out of the agricultural sector and into the non-agricultural sector.
The increase in rural to urban migration, as well as migration abroad, can mislead one to think that there is a labour surplus in rural areas. Statistics and interviews with farmers tell us this is not the case and that there is a shortage of workers in the agricultural sector. In reality, migrant workers tend to come from households with surplus labour or households with little or no land for farming. They represent a surplus at the household level, but not at the aggregate level. Consequently, their movement out of agriculture has put pressure on wages in the sector.
Finding 4: Agricultural wages have increased.
The increase in wages affects not only the wage bill for large-scale commercial plantations, but also the subsistence farmer, who must hire extra workers at planting and harvesting times. This situation is good for hired agricultural workers because they can earn more money. But at the same time, this is bad for subsistence farmers because the higher costs cut into their production, resulting in less available for household consumption. If agricultural wages continue to rise, subsistence farmers will have even less for household consumption, and they will fall possibly below subsistence level. Consequently, subsistence farmers will have to decide between letting go of their land and giving up farming to become wage earners in the modern sector, or to continue to live with continuous shortage. If they decide on the former option, they increase their risks in the sense that they have no safety net to fall back on in the event of rising unemployment or inflation. If they decide to continue in subsistence farming, they will be stuck in poverty.
Trends in rural employment
The vast majority of workers – who are a critical productive resource for economic development and poverty reduction – are located in rural areas. Rural employment still dominates the national employment scenario in Cambodia, representing 81 per cent of the workforce in 2009 (approximately 6 million persons). However, most of this employment is in vulnerable jobs (77 per cent). The number of vulnerable jobs increased by 18 per cent from 3.9 million jobs in 2004 to 4.6 million in 2009. On the other hand, the number of paid jobs, while still making up a small share in rural employment, have increased rapidly (by 40 per cent) from 1 million jobs in 2004 to 1.3 million in 2009. From 2004 to 2009, the industrial sector created jobs at the fastest pace, followed by the agricultural sector, while service-sector jobs declined.
Between 2004 and 2009, the number of working poor in rural areas increased by 13 per cent, from 1.8 million people to 2 million people. Contrary to the general belief that the poor are mostly landless, the
3 ILO: Rapid assessment.

Country Office for Thailand, Cambodia and Lao People’s Democratic Republic xi
data shows that a higher percentage of poor households own land compared to non-poor households (58 per cent versus 46 per cent). Households where the head of the family is primarily engaged in agriculture have a higher poverty incidence. Households where the family head is an own-account worker or self-employed (typically a farmer) also tend to be poor.
Implications and recommended actions
How can the NEP mitigate these impacts and contribute towards realization of decent work in rural areas? Based on the research findings, the NEP needs to focus on two issues: (1) increasing the stability of subsistence farming; and (2) reducing the risks that households are exposed to during the transition from subsistence farming to working in the modern sector. Some recommendations aimed at addressing these two issues are as follows in boxes 1, 2, and 3:
Box 1
Recommendation 1: Increase stability and incomes from subsistence farming by raising agricultural productivity.
Actions:
1. Improve the access of farmers to modern inputs, technology, and credit, so that they may increase agricultural yields.
2. Construct irrigation facilities. 3. A concerted government effort to mobilize farmers to produce high-value rice strains that
can fetch higher prices in global markets. 4. Increase the supply of agricultural machinery through subsidies, financing, and setting
quality standards. 5. Set up joint utilization systems for agricultural machinery to allow farmers to lease machines
on demand, thus reducing investment costs, and set up pilot farms to demonstrate and promote the use of machines.
6. Develop a domestic agro-industry and small and medium-sized enterprises (SMEs) to absorb agricultural output and stimulate growth.
Box 2
Recommendation 2: Promote and strengthen linkages between agriculture and agro-industry.
Actions:
1. Set up mechanisms and facilitation services to efficiently coordinate the flow of agricultural labour between subsistence and commercial agriculture. For instance, commune councils can play a vital role in disseminating information and mobilizing labour exchange across communes.
2. Subsidize the investment costs of rural households in developing skills required in the modern sector.
3. Provide credit facilitation for enterprises and rural households. 4. Provide incentives for rural enterprises to invest in physical and human capital. 5. Develop skills that are required in the modern sector. 6. Subsidize the investment costs of developing skills required in the modern sector. 7. Provide social protection such as public works, income support, and agricultural extension
services.

xii Country Office for Thailand, Cambodia and Lao People’s Democratic Republic
Conclusions
Under the NEP, actions to promote rural employment and development will need to pay attention to the challenges caused by the labour shortage in the agricultural sector, and how to draw the rural labour supply into the modern sector or paid employment. Labour flexibility depends upon household decisions. As long as rural households feel that their subsistence is at risk, they will not fully engage in providing workers to the modern sector. Therefore, in addition to placing efforts on labour demand, it is recommended that the policy consider actions to reduce the risk on households so that they can provide a steady supply of workers to support the industrialization process.
Box 3
Recommendation 3: Promote decent living wages and social protection for workers in the modern sector.
Actions:
1. Promote decent living wages. 2. Set up social protection programmes such as unemployment insurance, among others.
Country Office for Thailand, Cambodia and Lao People’s Democratic Republic xiii
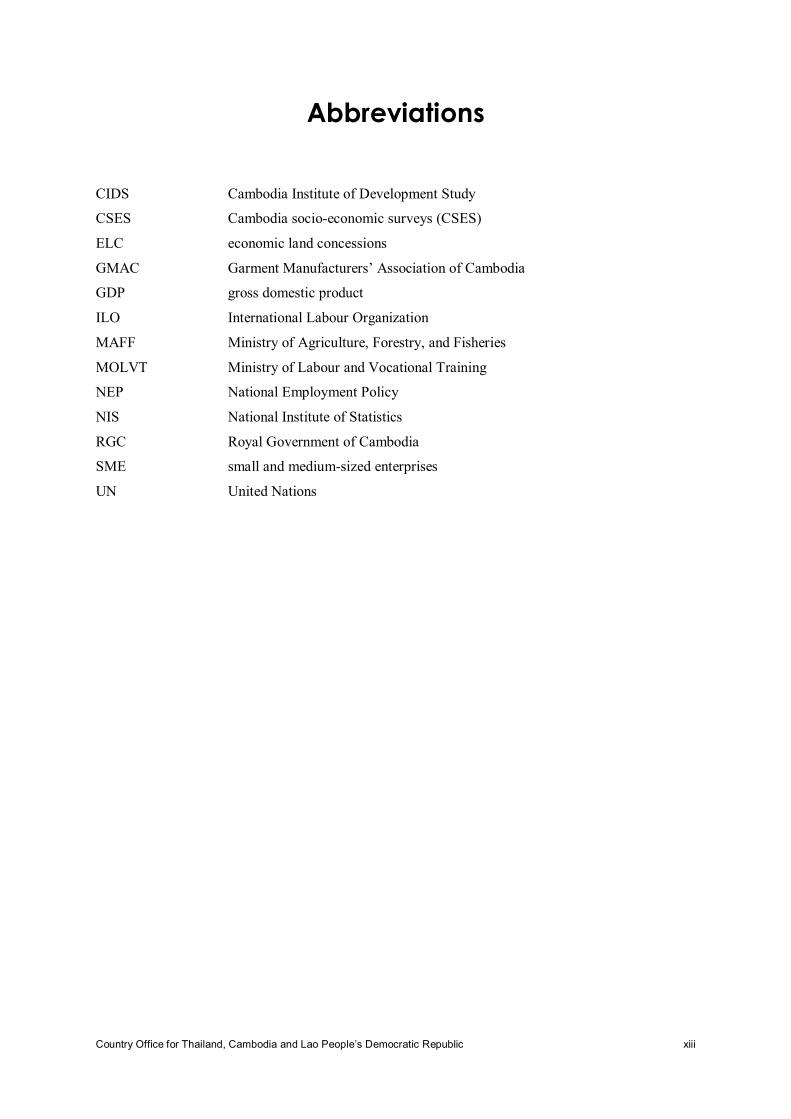
Abbreviations
CIDS Cambodia Institute of Development Study
CSES Cambodia socio-economic surveys (CSES)
ELC economic land concessions
GMAC Garment Manufacturers’ Association of Cambodia
GDP gross domestic product
ILO International Labour Organization
MAFF Ministry of Agriculture, Forestry, and Fisheries
MOLVT Ministry of Labour and Vocational Training
NEP National Employment Policy
NIS National Institute of Statistics
RGC Royal Government of Cambodia
SME small and medium-sized enterprises
UN United Nations

xiv Country Office for Thailand, Cambodia and Lao People’s Democratic Republic

Country Office for Thailand, Cambodia and Lao People’s Democratic Republic 1
1. Overview
1.1 Background
Over the past two decades, the Cambodian economy has grown at a momentous rate of 7.8 per cent per year, from 1994 to 2010.4 Much of the growth over the past decade has been driven by four sectors: garments and footwear, hotels and restaurants, construction, and agriculture. Among the four sectors, agriculture grew the slowest, at an average rate of 5 per cent per year. This growth in agriculture has mainly been characterized by the extensive use of inputs as against intensive productivity growth. Such process is reflected in slow growth in value added per worker at 1.3 per cent per annum between 1998 and 2008.5 At the same time, the agricultural sector – comprising agriculture, hunting and forestry, and fishing – employed about 72 per cent of Cambodian workers in 2008.
Against this backdrop, the Royal Government of Cambodia (RGC) has requested the International Labour Organization’s (ILO) support in formulating a National Employment Policy (NEP). Given the current employment pattern, understanding and enhancing employment opportunities in rural areas would most likely form one important element of such Policy.
The NEP is not only about creating jobs. It is about how to draw upon the most important production resource of an economy – its labour force – and allocate it to the most productive use that can create the highest amount of sustained value added. The economy is a system, and labour is one of the key resources of that system. We cannot development an employment strategy in isolation without considering the implications it will have on the overall economy and the process of structural change. It is with this in mind that we embark upon this study.
To inform Cambodia’s employment strategy, this paper will explore the challenges of rural employment and rural development. It will also search for areas of possible growth in the rural sector, both in agriculture and non-agriculture, and in areas of possible sustainable income generation. The specific objectives of this study are comprised of two main tasks:
1. An in-depth analysis of the past trend in rural-based employment, by the workers’ key socio-economic attributes (youth, gender, and education, among others), and an analysis of the nature of the links within different activities across the agricultural sectors (rice, rubber, and fishing, among others), between agricultural and non-agricultural activities in the rural areas, and between the rural-urban labour markets.
2. A policy review of existing and proposed strategies for agricultural and rural development, in order to identify areas where employment is likely to be generated and areas where strengthening the labour market institutions (e.g. training) can contribute towards the realization of better employment and labour market outcomes, particularly with regard to rural non-farming employment opportunities.
4 CDRI: Annual Development Review2011-2012. 5 NIS: Labour and social trends in Cambodia 2009.

2 Country Office for Thailand, Cambodia and Lao People’s Democratic Republic
1.2 Data sources
The analyses in this study are based primarily on official statistics from government sources such as the Cambodia socio-economic surveys (CSES), national accounts, the Economic Census 2011, and agricultural statistics of the Ministry of Agriculture, Forestry, and Fisheries (MAFF). The trend analysis covers mostly the period from 2004 to 2009 because the most comprehensive and recent official dataset on employment are the CSES 2004 and CSES 2009.
Where government data was unavailable, data from other sources such as the World Bank and recent surveys carried out by Cambodia Institute of Development Study (CIDS), such as the Wage Survey 2011 and the Decent Work Survey on Plantation Workers, were used.
In addition, the team interviewed members of rural households to understand their division of labour, job searching strategies, job selection criteria, push and pull factors for entering the labour market, job expectations and aspirations, and preferences for working in or near the home village or migration (both domestic and international). The average rural household has five family members, of which two or three contribute to income generation of the household. The head of the household is usually around 45 years old, male, and married. The main source of household income is from agriculture, specifically rice farming. We also interviewed a number of young migrant workers currently employed in the garment industry to get their perspectives and to investigate if there are any generational differences. A few rural entrepreneurs were also interviewed. Focus group discussions were also carried out with rural workers and rural enterprises in Kampong Chhnang province.

Country Office for Thailand, Cambodia and Lao People’s Democratic Republic 3
2. Importance of rural economy
Cambodia is still predominantly a rural, subsistence economy. The vast majority of the population (82 per cent) lives in rural areas. Seven-tenths of real gross domestic product (GDP) is derived from the rural economy (figure 1). In terms of employment, 81 per cent of the labour supply is in rural employment (figure 2). A huge amount of Cambodia’s productive resources – labour, land, and other natural resources – are located in rural areas and are still unused or underutilized. Tapping into these resources and drawing them into productive uses is the key to unlocking sustainable, broad-based economic growth and development. In short, the rural economy is important.
Figure 1. Share of real GDP (2008)
Source: NIS.
Figure 2. Share of total employment (2009)
Source: CSES 2009.

4 Country Office for Thailand, Cambodia and Lao People’s Democratic Republic
3. Challenges of rural employment and rural
development
Cambodia’s rural economy is characterized as a dual-sector economy, of which the subsistence sector overshadows the capitalist or modern sector. The traditional definition of the subsistence sector is “that part of the economy which is not using reproducible capital”. It is often referred to as the traditional sector for the main purpose of subsistence, and is essentially the agricultural sector. While the bulk of subsistence farming in Cambodia relies on unpaid family members, farmers also hire labourers for short periods at planting and harvesting time. The capitalist sector is defined as “that part of the economy which uses reproducible capital and pays capitalists thereof”. Unlike the subsistence sector, the capitalist sector hires workers on a longer-term basis. This sector includes manufacturing, plantations, and mines, among others. It is often referred to as the modern sector.
In terms of employment, we can further define the subsistence sector as consisting of own-account and unpaid family workers. The capitalist sector then, is the sector that provides regular paid employment. Based on data from the CSES 2004 and CSES 2009 conducted by the National Institute of Statistics (NIS), figure 3 shows that more than three-quarters of employment in rural areas is in the subsistence sector and less than one-quarter is in the capitalist sector. It also highlights the fact that there has been little structural change between the two sectors over the five-year period, with the capital sector increasing to just 24 per cent of employment in 2009, from 22 per cent in 2004.
Figure 3. Size of the subsistence and capitalist sectors in rural areas
Note: “Rural” refers to all areas outside the capital, Phnom Penh. “Capitalist” refers to paid employment. Own-account and unpaid family workers fall into the subsistence group.
Source: CSES 2004, CSES 2009.
The normal process of structural change is that surplus unproductive labour in the agricultural sector is transferred to the capitalist, modern sector. The subsistence agricultural sector is characterized by an abundance of labour, low wages, and low productivity. Growth in the manufacturing sector is expected to absorb the surplus labour in the agricultural sector over time, promote industrialization, and stimulate sustained development.

Country Office for Thailand, Cambodia and Lao People’s Democratic Republic 5
Most economists define unproductive labour or a labour surplus as the condition that exists when a portion of the labour force can be removed without causing a reduction in output.6 For instance, if there are four workers on a plot of land, and if taking one worker off the land produces the same amount of output as with the worker, then this means that the worker was unproductive and did not contribute to value added.
An investigation into rural employment using data primarily from the CSES 2004 and CSES 2009 reveals that labour surplus in the agricultural sector is only seasonal. This finding is obviously not a new revelation, as Cambodia is still a predominately agrarian economy, and seasonality is a natural characteristic of rural economies. However, this study shows that this single feature of the economy creates a number of challenges for promoting rural employment, which may need to be addressed in the forthcoming NEP. It is a premise upon which the policy should be based.
On the flip side of our premise that unemployment in rural areas is only seasonal, is the argument that labour supply is short during agricultural peak seasons. The first fact that indicates this point is the low level of employment per hectare of cultivated land. Government data reveals that total employment per hectare of cultivated land in Cambodia is only around 1.6 persons, significantly lower than other rice-producing, developing countries such as Bangladesh, China, and Vietnam (figure 4). This level is comparable to those in the leading industrialized Asian countries that have high agricultural mechanization (figure 5), such as the Republic of Korea and Thailand (both of which employ 1.04 workers per hectare). This finding means that even if Cambodia’s agricultural sector becomes mechanized, the number of workers per hectare will likely not decrease significantly and thus, this level is probably very close to the minimum labour required for agricultural production.
Figure 4. Agricultural workers per hectare of cultivated land, by country
Sources: Cambodia data based on statistics from MAFF and CSES 2009; other countries based on World Bank indicators.
6 F. Kwan: Agricultural labour and the incidence of surplus labour: Experience from China during reform, Discussion paper 33 (University of Nottingham Jubilee Campus, 2008).

6 Country Office for Thailand, Cambodia and Lao People’s Democratic Republic
Figure 5. Tractors per 100 square kilometres of cultivated land
Sources: Cambodia data based on statistics from MAFF and CSES 2009; other countries based on World Bank indicators.
According to in-depth interviews with farmers, the estimated labour requirement for rice farming is two or three workers per hectare. This information is consistent with the calculations from government statistics. Even more, it suggests a labour shortage of one person per hectare during the peak, wet season. Anecdotally, farmers commonly complain that it is difficult to find extra workers during the peak farming seasons.
If labour is really short during the agricultural peak seasons, this would put pressure on agricultural wages, and we would see an increase in wages over time. Data shows that real agricultural wages increased threefold between 2004 and 2009. Using the CSES data for 2004 and 2009, the estimated real daily wage for an agricultural worker rose to 13,839 riels (KHR), equivalent to US$3.46, in 2009, up from just KHR2,677 ($0.67) in 2004, as shown in table 1.
Table 1. Estimated daily wage of agricultural workers
2004 2009
Cost of labour per season, KHR (million) 36 696.16 216 000.00
Paid agricultural employees, workers 432 620.49 523 407.63
Cost per worker per season, KHR 84 822.97 412 680.26
Estimated working days per season per worker* 30.00 30.00
Daily wage per worker, KHR (nominal) 2 827 13 756
Daily wage per worker, US$ (nominal) 0.71 3.44
Daily wage per worker, KHR (real) 2 677.08 13 839.03
Daily wage per worker, US$ (real) 0.67 3.46
Note:* Based on local informants.
A recent wage survey carried out by CIDS on plantation workers in rural Cambodia verifies the accuracy of the wage level estimated above using CSES data. The study found that a plantation worker earned KHR12,692 ($3.17) per day on average in 2012 in real terms, as shown in table 2. The survey was conducted in Kampong Speu, Kampong Cham, and Pursat provinces with a sample of 238 workers in cassava, rubber, and sugar cane plantations.

Country Office for Thailand, Cambodia and Lao People’s Democratic Republic 7
Table 2. Wages of plantation workers in rural Cambodia, 2012
Nominal Real
KHR per day US$ per day KHR per day US$ per day
Average 13 136 3.28 12 692 3.17
Median 15 000 3.75 14 493 3.62
Maximum 33 333 8.33 32 206 8.05
Source: CIDS (2012).
A third fact that indicates that agriculture labour is not in abundant supply is the common practice of migrant workers returning to help on the farm during peak seasons. In all of their decision-making, whether economic, social, or political, there is one condition that rural households rarely break: that their subsistence farming must be safeguarded. The decision to send a family member into paid employment is a temporary household coping strategy to overcome cash shortages during the slack period, which usually runs from January to April. It is during this period that surplus agricultural workers engage in non-agricultural activities or migrate to find work in different parts of Cambodia or abroad. However, since rice farming is the lifeline of rural households and makes up their safety net, rural people tend not to stray too far (or at least not for too long) from the farm. If they release family members into the paid labour market, they do so only if they know that they can find and afford to replace the missing hands with hired help during planting and harvesting time, or that the migrant family members will be able to return to help when needed.
The phenomenon of circular migration was confirmed during in-depth interviews with agro-industrial plantation workers. “When it is planting or harvesting season, I return to my family farm to help my wife plant and harvest rice. Rice farming is my most important economic activity because it helps reduce food expenses, and when we have a surplus, I can also sell rice to cover other household expenses,” said Bi Thong, a 34-year-old migrant worker employed on a cassava plantation. “Like other people in my village, I have to leave to find work when it isn’t the rice planting season because there are no job opportunities in the village. But we always come back to plant rice.”
This custom is not unique to migrant workers in the agricultural sector; it is common in all sectors that draw labour from rural areas, such as the garment and construction sectors. One migrant worker from Kampong Cham province working in a garment factory in Phnom Penh, said: “My family doesn’t have land to produce rice, so my parents never call me to help with farm work. But the parents of other garment workers call them back during planting and harvesting seasons because they don’t have money to hire someone else to do the work. Most of the garment workers go back home to help. They ask for permission from the factory. When they leave, the factory deducts their wages, but their job is saved for them.” Indeed, the Garment Manufacturers’ Association of Cambodia (GMAC) reports that the garment industry sees up to 20 per cent of its workforce (about 80,000 workers) head home to farms unannounced during the peak agricultural seasons. The industry as a whole sees up to 15 per cent annual turnover in workers.7
Nor is this practice a rural-urban phenomenon. During focus group discussions with rural enterprises, participants also complained about the challenges in finding sufficient workers during the farming seasons. Despite offering higher wages, some workers still leave their non-agricultural work to help on the farm because it is their obligation. “There’s nothing we can do about it. Rural people are tied to their land. It is the way things work in rural areas,” said one brick manufacturer. Consequently, enterprises have to reduce their production during such periods of labour shortage.
7 Don Weinland and Chanvetey Vann: “Workers ditch factories for fields”, Phnom Penh Post (24 July 2012).

8 Country Office for Thailand, Cambodia and Lao People’s Democratic Republic
Another common view is that agricultural land has been exhausted, and therefore population growth in rural areas adds more workers to the fixed land resources, causing a labour surplus. In Cambodia, the facts show that agricultural land is still in abundance. According to World Bank indicators, there are over 5 million hectares of land suitable for farming in Cambodia. As of 2009, only 3.8 million hectares had been put to use for rice and other crop production. This means that 30 per cent of land suitable for agriculture, up to 1.6 million hectares, is still unused (table 3).
Table 3. Agricultural land, 2009
Land indicators8 2009
Agricultural land (hectares) 5 455 000
Cultivated land (hectares) 3 800 000
Cultivated land (% of agricultural land) 70
Agricultural land available for cultivation 1 655 000
Source: World Bank.
Growth of land input continues to outpace the rate of rural population growth, another factor suggesting that labour is not excessive during the peak farming seasons. Land resources used for agriculture grow every year, and this expansion absorbs the new population. This extensive productivity growth has been the driving force behind the increase in agricultural output over the past decade. According to statistics from the MAFF, the cultivated area for rice paddy grew by 3 per cent per annum on average between 2004 and 2009. During this same period, the rural population grew by just 0.4 per cent per annum. With the increased use of agricultural land on the one hand, and low population growth on the other, these facts suggest that there is not a labour surplus in the agricultural sector and that unemployment in rural areas is seasonal, as shown in table 4.
Table 4. Cultivated land, population growth, and labour requirement, 2004-2009
2004 2005 2006 2007 2008 2009
Cultivated areas (hectares) 2 374 175 2 443 530 2 541 433 2 585 905 2 615 741 2 719 080
Growth in cultivated area (%) 3.0 2.9 4.0 1.7 1.2 4.0
Rural population growth (%) 0.61 0.54 0.40 0.35 0.32 0.32
Sources: MAFF, World Bank.
Figure 6 shows agricultural labour supply versus the labour requirement. The labour requirement is assumed to be 1.59 workers per hectare, which was the average amount of labour used for agricultural production between 2004 and 2009, and as mentioned previously, likely represents the minimum amount of labour required for production. If technology remains unchanged in the agricultural sector and expansion in land input continues at the same pace of around 3 per cent per year on average, Cambodia will eventually run into a situation of labour shortage, indicated by the widening gap between labour supply and labour requirement. This finding highlights the need for mechanization in agriculture in order to release agricultural workers into non-agricultural sectors. At the same time, in order for mechanization to be profitable, farmers need to achieve economies of scale and thus, need a
8 The World Bank defines “agricultural land” as land area that is arable, under permanent crops, or under permanent pastures.

Country Office for Thailand, Cambodia and Lao People’s Democratic Republic 9
market for their commodities. Development of the agro-industry is, therefore, crucial to this realization.
Figure 6. Agricultural labour supply versus labour requirement
Sources: CSES 2004, CSES 2009, MAFF, and extrapolation by CIDS.
The lack of an unlimited supply of labour is partly because of Cambodia’s history of internal conflict, which upset the demographic balance. The population density in Cambodia is 75 persons per square kilometre, which is much lower than in most neighbouring countries (Thailand, 128 persons/km2; Viet Nam, 265 persons/km2) and the larger transition economies of China (141 persons/km2) and India (382 persons/km2), as shown in figure 7. Interestingly, when Japan was at the peak of its industrialization in the 1960s and 1970s, the population density there (261 persons/km2 on average) was also much higher than in present-day Cambodia.
Figure 7. Population density in select countries (persons per square kilometre)
Source: National population censuses.
The fact that labour availability in the agricultural sector is likely close to the required amount of labour for production implies that shifting agricultural labour may adversely reduce agricultural production. Therefore, the source of agricultural productivity growth (and income improvements)

10 Country Office for Thailand, Cambodia and Lao People’s Democratic Republic
needs to come from land. Rice yield in Cambodia is 3 tons per hectare, which is relatively lower than in other rice-producing countries (figure 8).
Figure 8. Land productivity of rice, by country (tons per hectare)
Source: Data for Cambodia from the MAFF as of 2010; other countries from the FAO based on most recent data.
Not only is yield lower in Cambodia than in other countries; the value of crops is between 23 per cent and 43 per cent lower. As shown in figure 9, farmers in Cambodia received $222 per ton for rice paddy in 2010, much lower than farmers in Viet Nam ($290), China ($297), Thailand ($366), and India ($386). Thailand is in a unique position: its yield is low, but its value is high. The most produced strain of rice in Thailand is jasmine rice, which has a significantly lower yield than other varieties of rice, but fetches more than double the price of other strains on the global market.9
Figure 9. Value of rice paddy (US$ per ton in current prices, 2010)
Source: FAOSTAT, (October 2012).
Agricultural productivity, and therefore agricultural incomes, can be improved through three channels:
First, the use of existing land in cultivation needs to be intensified. Various studies have noted that improvements in agricultural productivity can be achieved with the increased use of fertilizer and
9 “Rice strain is cause of comparatively low productivity”, The Nation (Thailand, 16 April 2008).

Country Office for Thailand, Cambodia and Lao People’s Democratic Republic 11
irrigation. A study by Yu et al. (2008), found that application of fertilizer is the largest contributor to yield increases in agricultural production. The study also found that irrigation is another key determinant affecting yield.10
Second, the number of crops per year needs to be increased. Most Cambodian farmers cultivate paddy rice only once per year during the rainy season, while farmers in Viet Nam’s Delta region cultivate 3.5 times.11 The common farming system in Cambodia is low productivity, terraced rain-fed, undertaken by around 70 per cent of the rural population, representing 80 per cent of the rice cropping area and 70 per cent of paddy production.12 A lack of irrigation facilities restricts the majority of producers to a single crop per year, and makes them dependent on rain-fed conditions.
Third, given the lack of an unlimited labour supply in the agricultural sector, it would be beneficial for Cambodia to implement a strategy similar to Thailand that focuses on high-value strains of rice. In doing so, farmers could earn higher incomes without having to commit additional labour to work. As presented in previous figures, Thailand commits a relatively low amount of labour into its agricultural sector (about one person per hectare), and even though rice yields are low (at just 2.7 tons per hectare), Thai farmers can fetch higher prices and thus higher incomes than farmers in other countries.
Another challenge that may need to be considered in the NEP is the increasing trend of international migration, which can increase wage pressures in the agricultural and non-agricultural sectors. In light of the finding that the agricultural labour supply is short during the peak farming seasons, the opening of borders for international migration may constrain agricultural and rural development in Cambodia. The increasing number of Cambodians migrating abroad, including to work on farms in Thailand, could intensify the labour shortage and push up agricultural wages at home. Higher wages in agriculture will put pressure on wages in non-agricultural sectors and could halt the industrialization process prematurely. According to the official registry of the Ministry of Labour and Vocational Training (MOLVT), the number of workers migrating abroad was 14,928 in 2009, double the number of the previous year, as shown in table 5. The government will need to consider the paradoxes in allowing an open border for labour mobility with its aim of utilizing labour for industrialization within the country.
10 Yu et al., (2008). 11 SNEC: Policy document on the promotion of paddy rice production and export of milled rice, (2010). 12 AusAid: Cambodia agricultural sector diagnostic report, (2006).

12 Country Office for Thailand, Cambodia and Lao People’s Democratic Republic
Table 5. Number of Cambodians working overseas, by country
Year 2005 2006 2007 2008 2009 2010 2011
Total 2 244 3 636 9 476 7 340 14 928 n/a n/a
Male 899 1 798 4 611 3 616 4 292 n/a n/a
Female 1 345 1 838 4 865 3 724 10 636 n/a n/a
Thailand - 445 5 670 2 116 3 543 11 224 14 645
Male - 226 3 935 1 425 1 968 n/a n/a
Female - 219 1 735 691 1 575 n/a n/a
Malaysia 1 776 1 690 3 219 2 654 9 682 n/a n/a
Male 467 231 174 53 876 n/a n/a
Female 1 309 1 459 3 045 2 601 8 806 n/a n/a
Japan - - 3 39 16 n/a n/a
Male - - 3 13 10 n/a n/a
Female - - - 26 6 n/a n/a
Korea, Rep. of 468 1 501 584 2 531 1 687 n/a n/a
Male 432 1 341 499 2 125 1 438 n/a n/a
Female 36 160 85 406 249 n/a n/a
Source: Department of Employment and Manpower, MOLVT.
All of these facts indicate that there is no unlimited, abundant supply of unproductive labour in the agricultural sector that can be easily shifted into other sectors without negatively affecting agricultural output. It also reveals the trade-offs that need to be considered in the design of the NEP. In other words, Cambodia needs to move away from the “low-wage platform” and should not design employment and industrialization policies around the assumption of abundant, low-cost labour and labour-intensive industries, as this cannot be the source of competitive advantage for much longer.

Country Office for Thailand, Cambodia and Lao People’s Democratic Republic 13
4. Trends in rural employment
The previous chapter presented the challenges in promoting rural employment. In order to navigate towards where we want or need to be, we also need to understand where we are now. This section reviews the trends in rural employment between 2004 and 2009.
4.1 Job creation
Agricultural and industrial shares in total rural employment increased between 2004 and 2009, while that of services fell. The agricultural sector remains the main source of employment for rural people, providing 68 per cent of jobs in rural areas (over 4 million people in 2009). Its share slightly increased between 2004 and 2009. The share of jobs provided by the industrial sector also slightly increased, from 14 per cent in 2004 to 15 per cent in 2009, employing 907,200 people. On the other hand, the share of service jobs fell from 21 per cent in 2004 to 17 per cent in 2009, with employment of just over 1 million people (table 6).
The industrial sector led in job creation in rural areas. Although its share in total employment remains low, the industrial sector created 162,736 jobs between 2004 and 2009. This represents a growth of 22 per cent over the period, or about 4 per cent per year on average, as shown in table 6. The main industrial jobs in rural enterprises include manufacturing in grain mills, manufacturing of sugar, manufacturing of apparel and footwear, weaving textiles, manufacturing of structural metal products, and distilling and blending of spirits (table 7).13 Industrial jobs represented 15 per cent of the total employment in rural areas in 2009, a one percentage-point increase from 2004.
Table 6. Employment growth in rural areas
Sector Persons Share of employment (%)
2004 2009 % change (2004–2009)
% change per year
2004 2009
Agriculture 3 558 100 4 112 640 16 3 65 68
Industry 744 464 907 200 22 4 14 15
Services 1 171 436 1 028 160 -12 -2 21 17
Total 5 474 000 6 048 000 10 2 100 100
Source: CSES 2004, CSES 2009.
13 The NIS is still cleaning the provincial data at present and therefore we are unable to disaggregate the data on manufacturing activities. However, the national-level data can give an indication on the types of activities that exist.

14 Country Office for Thailand, Cambodia and Lao People’s Democratic Republic
Table 7. Manufacturing activities in Cambodia (2011)
Establishments Persons engaged
All manufacturing 75 031 539 134
Manufacturer of wearing apparel, except fur 15 798 278 483
Manufacture of grain mill products 19 554 41 263
Weaving of textiles 8 471 31 790
Manufacture of sugar 6 152 15 570
Manufacture of structural metal products 3 015 10 087
Distilling, rectifying and blending of spirits 3 657 7 698
Source: Economic Census 2012.
During the same five-year period, rural employment in the agricultural sector grew by 16 per cent, creating 554,540 new jobs. Rice production remains the main agricultural activity undertaken by rural households, with the number of households engaged in rice production increasing by 13 per cent over the same period. There was also a significant increase in the number of households growing tubers and leguminous plants (64 per cent), although this is from a very low base. Households also picked up on planting industrial temporary crops such as cassava and maize, which increased 9 per cent over the period (table 8).
Table 8. Number of households engaged in agricultural activities in rural areas
Agricultural activities Households (in thousands) Per cent change
2004 2009 2004–2009 Per year
Total households in rural Cambodia 2 113 2 410 14 3
Crop production
Cereal harvested for grain (rice paddy) 1 748 1 969 13 3
Tubers and leguminous plants 94 154 64 13
Industrial temporary crops 99 108 9 2
Vegetables 149 117 -21 -4
Fruits and nuts 244 296 21 4
Industrial permanent crops 92 73 -21 -4
Other crops not classified elsewhere 26 1 -96 -19
Livestock and poultry n/a 2 086 n/a n/a
Fish cultivation and fisheries n/a 1 646 n/a n/a
Forestry and hunting n/a 2 259 n/a n/a
Sources: CSES 2004, CSES 2009.
Rural areas lost around 143,276 service jobs over the five-year period, a decline of about 2 per cent per year on average. Looking at urban employment, the data reveals that rural employment in the service sector was shifted to urban areas. Urban employment in the service sector grew by 10 per cent between 2004 and 2009 (table 9). Significant investment in the service sector in urban areas during the respective period (representing 78 per cent of total investment in Cambodia, inclusive of domestic and foreign investment) was the driving force behind this transition from rural to urban (figure 10).

Country Office for Thailand, Cambodia and Lao People’s Democratic Republic 15
Table 9. Employment in urban areas, by sector
Sector 2004 2009 Per cent change (2004–2009)
Per cent change per year
Total 1 331 405 1 421 000 7 1
Agriculture 271 723 189 434 -30 -6
Industry 186 953 276 262 48 10
Service 872 729 956 039 10 2
Source: CSES 2004, CSES 2009.
Figure 10. Investment in Cambodia, by sector (2004-2009)
Source: Council for the Development of Cambodia.
4.2 Vulnerable versus paid employment
The end objective of the NEP is not only to create productive work, but also decent work. According to the ILO, decent work is the availability of employment in conditions of freedom, equity, human security, and dignity. It involves:
1. opportunities for work that is productive and delivers a fair income;
2. security in the workplace and social protection for families;
3. better prospects for personal development and social integration;
4. freedom for people to express their concerns, organize and participate in the decisions that affect their lives; and
5. equality of opportunity and treatment for all women and men.
Based on these criteria of decent work, is it is clear that paid employment is a necessary condition for decent work, although not a sufficient condition. To better understand the trend in decent work in rural areas, we need to start with a look at the trend in paid employment and vulnerable employment. “Vulnerable employment” refers to workers employed in precarious conditions and includes workers classified as own-account workers and unpaid family workers. These workers tend not to have any social protection, standards for occupational health and safety, or regular wages, thus making them vulnerable. “Paid employment” includes workers and employers.

16 Country Office for Thailand, Cambodia and Lao People’s Democratic Republic
The vast majority of rural employment is in vulnerable jobs (77 per cent in 2009), affecting roughly 4.6 million people, as shown in Table 10. However, its share in total rural employment has declined slightly from 2004, when it was 80 per cent. Between 2004 and 2009, 720,989 vulnerable jobs were created in rural areas. The bulk of vulnerable employment is in the agricultural sector (72 per cent), with 20 per cent in the service sector and 8 per cent in the industrial sector (figure 11).
Table 10. Rural employment by vulnerable versus paid jobs
Rural employment 2004 2009 Change (2004–2009)
Persons % share Persons % share Persons % change
Vulnerable jobs 3 927 616 80 4 648 605 77 720 989 18
Paid jobs 1 000 384 20 1 396 395 23 396 011 40
Total 4 928 000 100 6 045 000 100 1 117 000 23
Source: CSES 2004, CSES 2009.
Figure 11. Vulnerable employment in rural areas, by sector (2009)
Source: Estimated from CSES 2009.
While the share of paid jobs is still small in rural employment (23 per cent in 2009), it grew at a rapid pace of 40 per cent between 2004 and 2009. Paid jobs in rural areas increased by 396,011 over this period, bringing total paid employment to 1.3 million people in 2009. As shown in figure 12, most paid employment is split between the service sector (38 per cent of paid jobs in rural areas) and the industrial sector (36 per cent). Roughly 26 per cent of paid employment is provided by the agricultural sector.

Country Office for Thailand, Cambodia and Lao People’s Democratic Republic 17
Figure 12. Paid employment in rural areas (2009)
Source: Estimated from CSES 2009.
Paid employment in agriculture is a reflection of the gradual commercialization of the agricultural sector, mostly on plantations or large-scale farms, and not so much on smallholder family farms (although households do hire some workers during the peak farming seasons). The government has been offering incentives for investment in the agricultural sector through economic land concessions, special economic zones, tax breaks, and other incentives on large projects (such as plantations for sugar cane, rubber, cassava, as well as mining). These findings suggest that such policies have taken effect.
4.3 Working poor
Working poverty gives an indication of the lack of decent work. If a person’s work does not provide an income high enough to lift them and their family out of poverty, then that job does not fulfill the income component of decent work and therefore likely does not satisfy other components. Within the development process, the desirable outcome is for the number of working poor to decrease.
The formula recommended by the United Nations (UN) for estimating the number of working poor is: working poor = poverty rate x labour force aged 15 years and above. Government and World Bank indicators show that the percentage of rural households living under the poverty line decreased from 37.8 per cent in 2004 to 34.7 per cent in 2009. During this same period, the number of employed people in rural Cambodia, inclusive of paid, own-account, and unpaid workers, increased from 4.9 million to 6.0 million. Applying the UN formula, the calculations show that the number of working poor in rural areas has increased by 13 per cent over the five-year period between 2004 and 2009, from 1.8 million people to 2.1 million people, as shown in table 11.

18 Country Office for Thailand, Cambodia and Lao People’s Democratic Republic
Table 11. Working poor in rural areas
2004 2009
Poverty rate in rural Cambodia (%) 37.8 34.7
Employed population in rural Cambodia 4 928 000 6 045 000
Estimated working poor 1 862 784 2 097 615
Change in number of working poor (%) - 13
Source: NSPD 2009-2013 Update; World Bank; CSES 2004, CSES 2009.
Table 12 compares the profile of poor rural households with non-poor households, where poor is defined as living under the national poverty line. Contrary to the general belief that the poor are mostly landless, the data shows that a higher percentage of poor households own land compared to non-poor households (58 per cent versus 46 per cent). There is no significant difference between non-poor and poor average household sizes: 4.7 persons for non-poor versus 4.8 for poor. Households where the head of the family is primarily engaged in agriculture have a higher poverty incidence. Households where the head of the family is an own-account worker or self-employed (typically a farmer) also tend to be poor.
Table 12. Profile of poor versus non-poor households in rural areas (percentage of households)
Profile Non-Poor Poor All
Own land (%) 46 58 50
Average household size (persons) 4.7 4.8 4.8
Economic activity of family head (%)
Agriculture 42 54 46
Manufacturing 11 9 10
Services 34 24 30
Employment status of family head (%)
Employer 0 0 0
Other 0 0 0
Own-account 57 63 59
Paid employee 26 22 25
Unpaid family 3 2 3
Source: NIS.
4.4 Profile of rural labour supply
It is crucial to reiterate and underscore that the decision of rural people to enter into paid employment is a household decision, not an individual decision. This means that in order for employment policies to effectively attract rural workers into paid employment, and specifically into non-agricultural sectors, it is imperative to focus upon households and respond to the way they behave.
For this reason, our analysis of the rural labour supply will start by understanding the socio-economic characteristics and dynamics of rural households, specifically how they divide household labour.

Country Office for Thailand, Cambodia and Lao People’s Democratic Republic 19
Then, we look at the characteristics of the working-age population in rural areas to identify possible unique features that may need to be addressed within the policy.
4.4.1 Household
The average rural household
According to the most recent General Population Census 2008, there are 2.3 million households in rural Cambodia. The majority of rural households (52 per cent) have up to four members, and 47 per cent have between five and nine members, as shown in table 13. On average, there are 2.8 family members of working age in rural households.14
Table 13. Household size in rural areas
Number of household members Count of households Per cent
0–4 persons 1 197 674 52
5–9 persons 1 079 197 47
10–14 persons 40 756 2
15 or more persons* 2 560 0
Total 2 320 187 100
Note: * includes institutional households living in boarding houses or lodgings. Source: General Population Census 2008.
Three out of four rural households are male-headed, with the average age of the head of family being 43 years old (table 14). One out of four households are female-headed, where the average age of the head of family is 47 years old. The majority of rural household heads have less than a primary school education (66 per cent of all rural households). Female heads of household tend to have lower educational attainment than male counterparts, with 47 per cent of female heads of households having no education at all, compared with 22 per cent of male heads of households (table 15).
Table 14. Sex of heads of rural households and their average age (2008)
Gender of head of household Count of households Per cent Average age
Male 1 734 741 75 43
Female 585 446 25 47
Total 2 320 187 100 44
Source: General Population Census 2008.
14 Estimate based on CSES 2009 data on the number of rural households and number of rural working-age people (15–64 years old).

20 Country Office for Thailand, Cambodia and Lao People’s Democratic Republic
Table 15. Education of heads of rural households, by sex (2008)
Education level of the head of household
Gender of the head of household (number of households)
Per cent share (number of households)
Male Female Total Male Female Total
No education 378 146 276 264 654 410 22 47 28
Primary not completed 666 777 208 462 875 239 38 36 38
Primary school 427 912 66 717 494 629 25 11 21
Lower secondary 237 481 31 894 269 375 14 5 12
Secondary/technical diploma 7 605 563 8 168 0 0 0
Beyond secondary 15 571 1 356 16 927 1 0 1
Other education 1 185 169 1 354 0 0 0
Total 1 734 677 585 425 2 320 102 100 100 100
Source: General Population Census 2008.
Regardless of the education level, the main occupation of the head of the household tends to be in the agricultural sector. As shown in table 16, 66 per cent of all heads of household are employed in agriculture. Cross-tabulation by level of educational attainment shows little changes in this percentage.
Table 16. Education of heads of rural households, by sector (2008) (%)
Education level of the head of household Agriculture Manufacturing Services Total
No education 66 11 23 100
Primary not completed 64 12 24 100
Primary school 66 13 21 100
Lower secondary 67 14 19 100
Secondary/technical diploma 66 10 24 100
Beyond secondary 83 8 9 100
Other education 67 0 33 100
Total 66 12 22 100
Source: NIS.
On average, the heads of rural households have up to a fifth grade education. Similarly, children of heads of households who are over 18 years of age have, on average, up to a fifth grade education. In households where the heads have less than a fifth grade education, the children have a higher education than their parent, on average (figure 13). However, in households where the heads have higher than a fifth-grade education, the children’s education is lower than their parent and hovers around the fourth to ninth grades. The data suggest that the younger generations are very much constrained by their parents’ educational attainment. This may present a much greater challenge in shifting the younger generations into other sectors, and highlights the need for skills development.

Country Office for Thailand, Cambodia and Lao People’s Democratic Republic 21
Figure 13. Education of rural heads of household and of their children
Note: * Children of household head who are 18 years and above.
Source: NIS. *Children over 18 years old of head of household.
At the household level, data reveals that there are, on average, 2.8 people employed on a hectare of agricultural land. This level is much higher than the finding at the macro level, which revealed only 1.6 workers per hectare. Does this figure contradict our finding that labour surplus in agriculture is only seasonal? No, but it reveals a structural issue. The size of landholdings at the household likely remained unchanged at around one hectare per household, but the expansion in land input is derived from plantations and large-scale agricultural projects.
At the macro level, the supply of labour in agriculture is short during the peak farming seasons, but at the household level there may be some surplus labour. There are pockets in rural areas where labour is in surplus even during the peak seasons because land plots may be small, or there may be higher incidences of landlessness or larger family sizes. There are also pockets in rural areas where labour is in shortage during the peak seasons. Traditionally, unproductive or surplus labour will shift around within the village or to nearby villages to help families who need additional workers. This custom in rural Cambodia is called “borrowing hands”. However, it is getting harder for farmers to find “borrowed hands” because many more people have migrated to work in the cities or abroad. “It is so hard to find labourers to help me during the planting and harvest seasons now. They’re all gone. And when I do finally find some help, I have to pay them twice as much as before,” said one rice farmer in Kampong Chhnang province.
Higher wages in the agricultural sector has put pressure on subsistence farmers by increasing the cost of their production, thus reducing the amount of product they have left for household consumption. If this continues, farmers will feel that their safety net lines are unraveling, and will more often call back family members working in the modern sector to return home and help. Most migrant workers will return because of the deep cultural importance of family obligations and reciprocity. They may continue to work in the modern sector during off-peak seasons, but will return home to help on the farm.

22 Country Office for Thailand, Cambodia and Lao People’s Democratic Republic
In addition to labour, another important productive resource of rural households – which can also influence their decision to send family members into paid employment – is land. Based on the CSES 2009, the data suggests that 13 per cent of rural households are landless (about 324,000 households, as shown in figure 14), while 87 per cent own land (2,086,000 households). Most rural households (47 per cent) own less than one hectare of agricultural land. Roughly 28 per cent have 1–1.99 hectares of land for cultivation (table 17). Unfortunately, these data were not collected in the CSES 2004, and therefore we are unable to verify if the levels of landlessness and land holding have changed over that period.
Figure 14. Agricultural land ownership in rural areas (2009)
Source: CSES 2009.
Table 17. Agricultural land holdings in rural areas (2009)
Land size (hectares)
Households (thousands)
Per cent
Less than 1 ha 973 47
1 ha–1.99 ha 578 28
2–2.99 ha 242 12
3–3.99 ha 122 6
4–4.99 ha 62 3
5–9.99 ha 87 4
10 ha and over 22 1
Total 2 086 100
Source: CSES 2009.
While the proportion of the rural population living under the national poverty has declined over the years, it was still high at 34.7 per cent in 2009. On average, rural households generated KHR554,000 (about $135) of income per month in 2009. This translates into a monthly income of KHR121,000 ($30) per person. The main source of income for rural households is self-employment (68 per cent of income), mostly from agricultural activities (34 per cent of income) but also from non-agricultural activities (27 per cent of income). Data reveal that the salary component of rural household income has significantly increased over time, from 7 per cent in 1994 to 30 per cent in 2009. This reflects increased paid employment opportunities in rural areas (table 18).

Country Office for Thailand, Cambodia and Lao People’s Democratic Republic 23
Table 18. Average monthly income of rural households, by source
Sources of income 1994 2009
Riels (thousands)
US$ % share Riels (thousands)
US$ % share
Primary income 128 32 98 550 134 98
Salary 9 2 7 167 41 30
Self-employment 120 30 91 382 93 68
Income from agriculture 57 14 44 189 46 34
Income from non-agriculture 53 13 41 152 37 27
Income own house 8 2 6 41 10 7
Other 1 - 1 0 0 0
Property income n/a n/a n/a 2 0 0
Transfers received 3 01 2 13 3 2
Total income 131 33 100 563 137 100
Transfers paid/ negative income n/a n/a n/a 10 2 2
Disposable income 131 33 100 554 135 98
Source: NIS: Statistical Yearbook of Cambodia 2011, CSES 2009.
The importance of land and subsistence farming for rural households
In his classic book The Great Transformation, Karl Polanyi makes the point that economic behaviour in peasant societies is not based on the logic of rational action and decision-making where all alternative uses of limited resources are weighted. Economic decision-making in such societies and places is not so much based on individual choice, but rather on social relationships, cultural values, moral concerns, politics, religion, or fear instilled by authoritarian leadership. Production in most peasant societies is for the producers (“production for use” or subsistence), as opposed to “production for exchange”, which has profit maximization as its chief aim. Polanyi explains that the economy in peasant societies is embedded in economic and non-economic institutions, rather than being a separate and distinct sphere. Socio-cultural obligations, norms, and values play a significant role in people’s livelihood strategies. Reciprocity – that is, the mutual exchange of goods or services as part of long-term relationships – influences the behaviour of peasants more than profit.
Polanyi’s model of the economic workings in peasant societies fits with the context in rural Cambodia. The catalyst that binds and webs the economic, social, cultural, and political ties in rural Cambodia is land. First and foremost, in the perspective of rural households, land and subsistence rice farming is their lifeline. It is their source of sustenance. It is their security, even if all else fails. It is their only safety net in the event of economic and financial crisis. For this reason, the most important economic task is to secure subsistence farming activities. The decision on whether to send a household member into paid employment, especially non-agricultural work that is far from home, is heavily dependent on the potential effect it could have on the household’s subsistence activities. If they release family members into the paid labour market, they do so only if they know that they can find and afford to replace the missing hands with hired help during planting and harvesting time, or that the migrant family worker will be able to return to help when needed.
But the value of land to a rural household goes beyond economics. Land is their foundation of life. It is what keeps farmers in their community and links them with their neighbours. It is their identity, their family lineage, and their heritage. Even when rural people migrate to work in other locations, it

24 Country Office for Thailand, Cambodia and Lao People’s Democratic Republic
is their intention to return home once they have a strong financial basis. One such migrant worker is 22-year-old Srey Neang, who left her hometown in Kampong Cham province for a garment factory in Phnom Penh, where she has worked for five years. “I plan to return to my village to live and work on the farm because my parents are getting old. Other garment workers think like me too, and will eventually go back to their villages, especially when they get married or when they cannot endure the physical work in the factory anymore.” Another migrant worker, 32-year-old Chin Seung Heng, expressed similar sentiments. “I plan to return to live in the village because I only came to work in Phnom Penh to get money.” She has been employed in the garment industry for 11 years. A fellow garment worker, 22-year-old Chorn Chanthon, from Prey Veng province, feels the same way. “I will return to live in the village because I want to live near my relatives. After I save money from working here, I will use the money to open a business in my village.”
Even with large-scale commercial agriculture emerging in Cambodia, the close link of rural households to land will not change (at least not in this generation). Farmers will likely not part from their land but rather design or adapt their livelihood strategies to keep safe their only source of security. It is not a matter of choice for them, but a necessity. Land is not only their safety net, but also the centre of their social, cultural, and political life. Only when there is a strong and proven public social security system in place, as in the developed countries, will the strong bond between rural households and land gradually loosen.
Division of labour
Table 19 summarizes some of the findings from in-depth interviews with members of rural households and provides a typology of various patterns of household division of labour. Again, it illustrates the importance of land and subsistence farming for rural households, and how they allocate their labour resources within the framework of protecting their subsistence farming.
Household 1 represents a typical rural household with five family members. The head of the household is the father, and his main occupation is rice farming. He and his wife stay in the village and take care of the subsistence agricultural activities. The children, two sons and one daughter, are of working age. To help support the family, the children migrate outside the village to work. The two sons migrate together and work in a casino. The daughter migrates with other female relatives and neighbours, and currently works in a garment factory in Phnom Penh. Since their farm is small, around 0.5 hectares, the parents can handle the rice farming on their own. The children send money every month or few months to help support their parents and finance the subsistence activities. It was mentioned that the daughter will likely return to the village in a couple of years as the parents are ageing and will soon need help at home.
Household 2 is another typical rural household. In this six-person family, the head of the household is both a wage-earner (teacher) and farmer. His wife is also a farmer. The children are all of working age. All but one of them migrates to work outside the village. Remittances are sent home regularly to help support the family members in the village and the subsistence activities. The parents do not call the children back during peak agriculture seasons because they can afford to hire workers with the remittances.
The third household, which also represents a common rural household structure, is a young family of a husband, wife, and child. The husband migrates to work on a rubber plantation during the off-peak seasons, while his wife and child remain in the village. Rice farming is a very important activity for
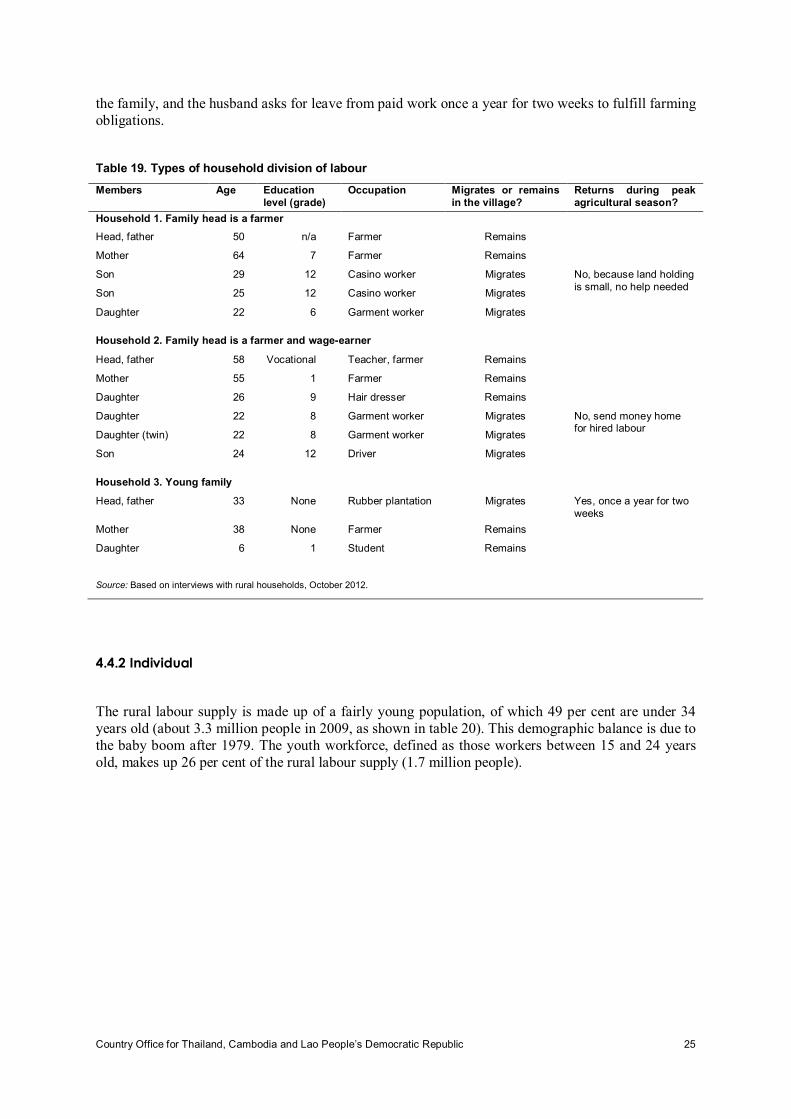
Country Office for Thailand, Cambodia and Lao People’s Democratic Republic 25
the family, and the husband asks for leave from paid work once a year for two weeks to fulfill farming obligations.
Table 19. Types of household division of labour
Members Age Education level (grade)
Occupation Migrates or remains in the village?
Returns during peak agricultural season?
Household 1. Family head is a farmer
Head, father 50 n/a Farmer Remains
Mother 64 7 Farmer Remains
Son 29 12 Casino worker Migrates No, because land holding is small, no help needed
Son 25 12 Casino worker Migrates
Daughter 22 6 Garment worker Migrates
Household 2. Family head is a farmer and wage-earner
Head, father 58 Vocational Teacher, farmer Remains
Mother 55 1 Farmer Remains
Daughter 26 9 Hair dresser Remains
Daughter 22 8 Garment worker Migrates No, send money home for hired labour
Daughter (twin) 22 8 Garment worker Migrates
Son 24 12 Driver Migrates
Household 3. Young family
Head, father 33 None Rubber plantation Migrates Yes, once a year for two weeks
Mother 38 None Farmer Remains
Daughter 6 1 Student Remains
Source: Based on interviews with rural households, October 2012.
4.4.2 Individual
The rural labour supply is made up of a fairly young population, of which 49 per cent are under 34 years old (about 3.3 million people in 2009, as shown in table 20). This demographic balance is due to the baby boom after 1979. The youth workforce, defined as those workers between 15 and 24 years old, makes up 26 per cent of the rural labour supply (1.7 million people).

26 Country Office for Thailand, Cambodia and Lao People’s Democratic Republic
Table 20. Rural employment, by age group
Age group 2004 2009
Jobs (thousands)
% share Jobs (thousands)
% share
15-64 5 274 100 6 685 100
15-19 961 18 940 14
20-24 907 17 825 12
25-34 1 215 23 1 560 23
35-44 1 095 21 1 590 24
45-54 720 14 1 140 17
55-64 374 7 630 9
Youth (15-24) 1 868 35 1 765 26
Source: CSES 2004, CSES 2009, as published in the Statistical Yearbook of Cambodia 2011.
The majority of rural workers, 87 per cent, have only a primary school education or less, of which 23 per cent have no education at all (table 21). An interesting finding, however, is that individuals with higher education tend to go into the service sector, while those with lower education remain in agriculture. The data shows that 18 per cent of the employed rural workers who completed primary education went into the service sector. This percentage increased to 28 per cent of those who completed lower secondary school, 49 per cent of those who completed upper secondary school, and 77 per cent of those who completed post-secondary education. This is likely a natural progression, given that service-sector jobs usually require higher technical and vocational skills than agricultural jobs.
The situation is reversed in the agricultural sector, with 78 per cent of those with little or no education employed in agriculture. This percentage continues to fall as the individual attains higher education, all the way down to 19 per cent of those with post-secondary education. The correlation between education and sector of work is less apparent.

Country Office for Thailand, Cambodia and Lao People’s Democratic Republic 27
Table 21. Rural employment, by sector and education level
Education level 2004 2009
Agriculture Industry Service Agriculture Industry Service
Employment (in thousands)
Total 3 424 740 1 078 4 114 909 1 026
Little or no education 1 026 160 198 1 099 147 155
Primary not completed 1 414 305 380 1 621 339 326
Primary completed 712 206 282 989 291 275
Lower secondary completed 203 54 133 343 108 169
Upper secondary completed 43 11 66 62 20 79
Post-secondary education 5 1 9 5 1 20
Other education 21 4 10 4 1 2
Education level (percentage across sectors)
Little or no education 74 12 14 78 10 11
Primary not completed 67 15 18 71 15 14
Primary completed 59 17 24 64 19 18
Lower secondary completed 52 14 34 55 18 28
Upper secondary completed 36 9 55 39 12 49
Post-secondary education 33 7 60 19 4 77
Other education 60 11 29 57 14 29
Source: CSES 2004, CSES 2009, as published in the Statistical Yearbook of Cambodia 2011.
It is important to note that rural households are more likely to release family members between the ages of 20 and 34 into the paid labour force. Household members between the ages of 20 and 34 have a higher rate of entrance into paid employment than other age groups, as shown in table 22. Individuals over 35 years of age tend to be the head of the household and therefore usually stay in the village to work the farm, while those younger than 20 are deemed by parents to be too young to be without a guardian and are thus kept at home as unpaid family workers. However, with increasing paid employment opportunities, such as on agricultural plantations, some older household members (including heads of household) also undertake casual work to supplement the household income. However, they will return home during the peak farming seasons.

28 Country Office for Thailand, Cambodia and Lao People’s Democratic Republic
Table 22. Rural employment, by age and employment status
Age group 2004 2009
Paid jobs Vulnerable jobs
Total jobs Paid jobs Vulnerable jobs
Total jobs
Employment (in thousands)
15-64 years 1 001 4 273 5 274 2 670 4 015 6 685
15-19 165 796 961 290 650 940
20-24 235 672 907 550 275 825
25-34 259 956 1 215 800 760 1 560
35-44 192 903 1 095 560 1 030 1 590
45-54 106 614 720 320 820 1 140
55-64 44 330 374 150 480 630
Per cent by age group
15-64 years 19 81 100 40 60 100
15-19 17 83 100 31 69 100
20-24 26 74 100 67 33 100
25-34 21 79 100 51 49 100
35-44 18 82 100 35 65 100
45-54 15 85 100 28 72 100
55-64 12 88 100 24 76 100
Source: CSES 2004, CSES 2009, as published in the Statistical Yearbook of Cambodia 2011.
4.4.3 Gender
Women have traditionally played a vital role in the rural household’s productive activities simultaneous to their primary responsibility as homemaker. Their role as the homemaker and protector of the household’s honour and finances automatically ties them up with the subsistence economy, and places limits on where and when they can engage in other productive work. However, changing socio-economic conditions are slowly altering these gender norms. Women are increasingly likely to work outside the household, and to travel away from home to earn a living. Similarly, girls also participate more in education, where they attend classes alongside boys.15
Women now make up 50 per cent of rural workers, with a total of around 3 million women in 2009. Between 2004 and 2009, the labour-force participation of rural women increased from 80.0 per cent to 84.3 per cent. With the exception of women in the 15–19 age group, the labour-force participation rates of all other age groups increased during the five-year period. The highest increase was for women in the 55–64 age group at 9 percentage points. The possible explanation for the increase in labour force participation of older women is widowhood. For men, the change over the five-year period was less noticeable, but this is because the labour-force participation rate was already high to start with in all age groups (table 23).
15 MWA: A fair share for women: Cambodia gender assessment, (2008).

Country Office for Thailand, Cambodia and Lao People’s Democratic Republic 29
Table 23. Labour force participation rates in rural areas, by age and gender (%)
Age group 2004 2009 Difference (2004-2009)
Female Male Female Male Female Male
15-64 80.0 90.1 84.3 91.3 4.3 1.2
15-19 77.8 78.9 75.3 77.4 -2.5 -1.5
20-24 80.4 90.8 83.5 91.1 3.1 0.3
25-34 82.0 95.8 87.3 97.4 5.3 1.6
35-44 83.4 95.8 90.0 97.7 6.6 1.9
45-54 82.1 93.0 88.8 95.8 6.7 2.8
55-64 67.7 85.3 76.8 88.5 9.1 3.2
Youth (15-24) 79.0 84.2 79.1 83.5 0.1 -0.7
Source: CSES 2004, CSES 2009.
Regardless of gender, the majority of rural workers work in the agricultural sector. Employment in agriculture increased between 2004 and 2009 for both genders. The share of employment in the industrial sector is roughly the same for both men and women (14.8 per cent of women versus 15.2 per cent of men in 2009). The employment-gender breakdown in the service sector is also the same (17 per cent for both men and women in 2009). These findings, as shown in table 24, suggest little industrial or sectoral segregation by gender. However, the situation may be different in terms of occupation.
Table 24. Rural employment, by sector and gender
Sector 2004 2009
Female Male Female Male
Employment in persons
Agriculture 169 672 1 862 993 2 052 240 2 060 400
Industry 373 227 370 337 458 736 448 440
Service 577 046 593 670 504 006 521 160
Total 2 647 000 2 827 000 3 014 982 3 030 000
Percentage share of gender across sectors
Agriculture 64 66 68 68
Industry 14 13 15 15
Service 22 21 17 17
Total 100 100 100 100
Percentage share of gender by sectors
Agriculture 48 52 50 50
Industry 50 50 51 49
Service 49 51 49 51
Total 48 52 50 50
Source: CSES 2004, CSES 2009.
The data suggest that men are more likely to work away from the family farm than women. A higher percentage of employed men are in paid employment compared to women (26.0 per cent of men versus 19.5 per cent of women in 2009, as shown in table 25), although the change in women’s share in paid employment has increased much more than men’s over the five-year period. Increasing job

30 Country Office for Thailand, Cambodia and Lao People’s Democratic Republic
opportunities for women in the garment sector, as well as in service- and tourism-related activities, is the main factor behind the growth in women’s share in paid employment. However, as previously mentioned, both men and women tend to return to the family farm during peak agricultural seasons, unless the household can cope through other means such as hiring replacement labour.
In 2009, 80 per cent of rural employed women worked in a vulnerable job, down from 84 per cent in 2004, but still much higher than men (at 74 per cent). The dramatic decline of women as unpaid family workers and their increase in own-account work between 2004 and 2009 was due to reclassification by the NIS, rather than a change in the actual employment conditions. As explained in the CSES 2009: “In CSES 2009, persons who currently worked the past seven days in contribution for their own household, that is operating her or his own enterprises (e.g. farmers cultivating their own land, small shopkeeper or small restaurant) without payment or income of any kind are classified as own-account worker or self-employed. … Concerning the new classification in CSES 2009 of own-account workers/self-employed, the share of women in this employment status has increased greatly from 2004 (34 per cent) to 2009 (52 per cent).”16
Table 25. Rural employment, by employment status and gender
Employment status 2004 2009
Female Male Female Male
Persons
Total 2 461 000 2 467 000 3 016 000 3 029 000
Paid employee 403 604 592 080 588 120 790 569
Employer 2 461 2 467 9 048 12 116
Own-account worker 841 662 1 260 637 1 646 736 1 481 181
Unpaid family worker 1 213 273 611 816 772 096 745 134
Per cent by employment status
Total 100.0 100.0 100.0 100.0
Paid employee 16.4 24.0 19.5 26.1
Employer 0.1 0.1 0.3 0.4
Own-account worker 34.2 51.1 54.6 48.9
Unpaid family worker 49.3 24.8 25.6 24.6
Source: CSES 2004, CSES 2009.
Data reveal that there was an increase in the education level of both male and female rural workers between 2004 and 2009, albeit still low. A higher percentage of both women and men completed primary education and lower secondary education in 2009 compared to 2004, as shown in table 26. Nevertheless, women tend to have lower education than men: 30 per cent of employed women have little or no education compared to 17 per cent of employed men.
16 CSES 2009, p. 64.

Country Office for Thailand, Cambodia and Lao People’s Democratic Republic 31
Table 26. Rural employment, by education level and gender
Education level 2004 2009
Female Male Total Female Male Total
Employment (in thousands)
Total 2 575 2 666 5 241 3 018 3 030 6 048
Little or no education 893 491 1 384 893 508 1 401
Primary not completed 1 071 1 027 2 098 1 198 1 089 2 287
Primary completed 441 759 1 200 660 895 1 555
Lower secondary completed 126 263 389 216 396 612
Upper secondary completed 24 95 119 41 119 160
Post-secondary completed 3 12 15 8 19 27
Other education 14 20 34 4 4 8
Per cent by education
Total 100 100 100 100 100 100
Little or no education 35 18 26 30 17 23
Primary not completed 42 39 40 40 36 38
Primary completed 17 28 23 22 30 26
Lower secondary completed 5 10 7 7 13 10
Upper secondary completed 1 4 2 1 4 3
Post-secondary completed 0 0 0 0 1 0
Other education 1 1 1 0 0 0
Note: figures may not add up due to rounding. Source: CSES 2004, CSES 2009, as published in the Statistical Yearbook of Cambodia 2011.
Marital status is another factor that can influence labour force participation, especially for women. According to the National Population Census 2008, both women and men are getting married at an older age than a decade ago. In 1998, the average age for women getting married was 22.5 years; this increased to 23.3 in 2008, as shown in table 27. For men, the average age at marriage increased from 24.2 in 1998 to 25.6 in 2008. However, there appears to be little change for women in rural areas, where the average age at marriage is 22.5. During interviews with female migrant workers, many pointed out that when a women gets married, she usually has to return to her home village to raise a family. But there are exceptions to this custom. If the situation permits, the wife will sometimes migrate with her husband to work.
Table 27. Average age of first marriage, by gender
Residence Year Women Men
Total 1998 22.5 24.2
2008 23.3 25.6
Urban 1998 23.8 26.8
2008 25.5 28.0
Rural 1998 22.1 23.5
2008 22.5 24.8
Source: National Population Census 2008.
32 Country Office for Thailand, Cambodia and Lao People’s Democratic Republic
In sum, traditional gender roles still influence the division of labour in rural households, although changing socio-economic trends are slowing altering what is considered the norm. Women, as homemakers and being responsible for taking care of the family, are more tied to the subsistence economy than men. It is their responsibility to protect the household’s safety net. This relationship means that they must devote their labour to agriculture during the peak farming seasons, and can engage in other income-generating activities or work in non-agricultural sectors only during the slack periods. For women, the preference is to engage in productive activities near home so that they can also fulfill their household responsibilities and stay close to the farm. This indicates that training provision within or near the village would likely increase outreach and women’s access to skills development.

Country Office for Thailand, Cambodia and Lao People’s Democratic Republic 33
5. Implications for the National Employment
Policy
5.1 Existing policies that promote rural employment
Over the past decade, the focus of employment promotion has been on creating jobs. Specifically, the Government has tried to bring jobs to rural people through policies aimed at creating labour demand such as investment policies, infrastructure policies, economic land concessions, and special economic zones. The underlying premise of the existing policies and strategies is that labour is abundant in rural areas. Policies on the side of labour supply have therefore focused on increasing the employability of individuals and have been mostly limited to skills development and vocational training.
Some of the key Government policies to promote rural development and rural employment are:
1. the Agriculture Development Plan; 2. irrigation system development and management; 3. the Rice Policy; and 4. economic land concessions.
Agriculture Development Plan
The objectives of the Agriculture Development Plan 2009-2013 are: (1) to enlarge the base of, and help sustain, economic growth; and (2) to accelerate poverty reduction. To achieve these objectives, the Government will focus on four key areas, as follows:
1. Improving agricultural productivity and diversification
a) Improve soil fertility, conduct soil classification for crop zoning, and formulate land use plans;
b) strengthen research on, and development of, crop seeds and crop production technologies; c) mainstream the use of high-quality and high-yielding crop varieties and seeds; d) promote crop intensification and diversification; e) improve knowledge on crop protection; f) improve the quality of agricultural produce; and g) strengthen inspection capacity and services for quality and safety of agricultural products.
2. Land reform and clearing of mines
a) Organize the implementation of the land reform programme through a sector-wide approach; b) improve land registration in order to confer property rights and other rights for all immobile
properties (state and private), transfer tenure rights for those properties, as well as prevent and resolve land disputes, aiming at strengthening safety in land tenure and ensuring the effectiveness of, and confidence in, the land market; and
c) collaborate with institutions involved in providing social land concessions in promoting partnerships between smallholder farmers and owners of crop plantations and other agricultural production corporations, and between economic land concessions and social land
34 Country Office for Thailand, Cambodia and Lao People’s Democratic Republic
concessions, aiming at encouraging poor families in agricultural production, and in job and market creation for people living in those localities.
3. Fisheries reform
a) The Government has distributed fishing lots, and has established 469 fishing communities, both marine and freshwater.
b) The Government will continue to attach priority to helping and encouraging fishing communities to participate in the preparation of plans for, and the management of, natural resources, by providing guidance and technical training in order to ensure sustainable management of fishery resources based on technical standards.
c) In order to ensure that the price of fish reflects true economic value, the Government will establish an effective fish market mechanism.
d) The Government will further strengthen national resource conservation, especially promoting the linkage of conservation to eco-tourism.
4. Forestry reform
a) The Government has established protected and biodiversity conservation forest areas, undertaken reforestation, formed forestry communities, and undertaken proper boundary demarcation and strict measures to prevent, reduce, and eradicate illegal encroachments and occupation of forest land by private individuals.
b) The Government will continue to monitor forest concessions to ensure that they comply with international standards, by seeking external technical and financial assistance and by active and appropriate participation of civil society in monitoring.
Irrigation system development and management
Functioning physical infrastructures, especially irrigation systems, are a prerequisite for agricultural development and, therefore, poverty reduction. Rehabilitating existing irrigation networks and constructing new ones is a key policy priority of the Government. These infrastructure investments are necessary to maximize the full potential of the agricultural sector. The Government plans to continue with rehabilitation, construction, maintenance, and efficient management of irrigation infrastructure, water reservoirs, canals, pipes, drainage systems, flood and sea protection levees, and water pumping stations to increase irrigated areas and boost agricultural production. The Government will enhance efficient management of the irrigation system by strengthening the institutional capacity of concerned ministries and agencies.
Rice policy
In 2010, the Government launched the Promotion of Paddy Production and Rice Export Policy (the Rice Policy) with the aim of further strengthening the foundation for economic growth, accelerating poverty reduction, and improving the living standards of the Cambodian people. The objectives of the Rice Policy are to transform Cambodia into a “rice basket” and key milled rice-exporting country in the global market. The Government has set the year 2015 as the target year to: 1) reach a paddy rice surplus of more than 4 million tons and achieve milled-rice exports of at least 1 million tons; and (2) ensure the quality of Cambodian rice is internationally recognized.17
17 SNEC: Policy document on the promotion of paddy rice production and export of milled rice, (2010).

Country Office for Thailand, Cambodia and Lao People’s Democratic Republic 35
Some of the key measures that will be implemented to achieve the targets are:
a) To increase paddy rice productivity by using high-yield seed and modern farming techniques; b) to continue to expand irrigation networks; c) to continue to build and maintain rural roads; d) to promote microcredit for agriculture; e) to improve productivity and crop intensification, and enhance water management, which is a
key to crop productivity and intensification; f) to promote implementation of the National Policy on Rural Electrification; g) to promote and establish a Farmers’ Organization; and h) to promote and encourage the implementation of policies on the sustainable use of
agricultural land.
In order to encourage the participation of the private sector in the Rice Policy, the Government will:
a) Continue financing for paddy rice collection; b) provide support to strengthen the Rice Millers’ Association; c) create new financial instruments and leverage mechanisms for financing; d) consider establishing an Agricultural Development Bank to support and promote agriculture
both in terms of production and processing; and e) reduce electricity prices and extend coverage areas.
Economic land concessions
The Policy on Economic Land Concessions (ELC) was introduced to encourage investments to establish large-scale agriculture and agro-processing enterprises in rural areas, raise productivity, and diversify the agricultural sector. Ultimately, land concessions are granted with the purpose of increasing employment in rural areas. An ELC is a long-term lease that allows the beneficiary to clear land in order to develop industrial agriculture. To date, ELCs have been granted for various activities, including large-scale plantations to grow crops such as rubber, sugar, cassava, palm, cashews, and acacia, raising animals, and building factories to process agricultural products. According to the Sub-Decree on Economic Land Concessions, the MAFF is authorized to grant ELCs with a total investment value of KHR10 million or more, or a total ELC area of 1,000 hectares or more. The relevant provincial or municipal governor is authorized to grant ELCs with a total investment value of less than KHR10 million, or a total ELC area of less than 1,000 hectares. To date, the Government has cancelled 85 ELCs for violation of, or non-fulfilment of, contracts, with a total land area of 956,690 hectares in 16 provinces. To date, the provincial authorities in nine provinces have granted 47 companies ELCs of less than 1,000 hectares. There are currently nine ELC companies with land areas of more than 10,000 hectares.18
5.2 Findings and recommended actions
Below, we summarize the core findings of this research, highlighting the challenges in creating rural employment; analyze the potential socio-economic effects of these challenges on future rural employment; and provide recommendations on how to mitigate these challenges and effects.
18 MAFF.

36 Country Office for Thailand, Cambodia and Lao People’s Democratic Republic
Finding 1. No unlimited supply of labour in the agricultural sector
The core finding of this research is that there is no unlimited supply of labour in rural areas, or more precisely the agricultural sector. The amount of labour currently available in the agricultural sector is already at a very low level (just 1.6 workers per hectare) – almost as low as in countries with high agricultural mechanization such as Thailand and the Republic of Korea. This suggests that drawing labour out of the agricultural sector could negatively affect agricultural production. However, the data suggest that it may be possible to draw labour from the subsistence-agriculture sector to propel growth in the modern, capitalist agricultural sector. Labour availability in the subsistence sector is 2.8 workers per hectare.
Finding 2. Rural households are tied to their land and will not part from it permanently
Subsistence farming represents a safety net and ultimate security. Indeed, interviews with garment workers during the global financial crisis revealed the importance of subsistence farming during times of crisis.19 Garment workers said that in order to cope with the fall in wages due to reduced overtime, they relied heavily on rice from their parents to cut costs and stay afloat. The decision to release working-age family members into the modern sector permanently is dictated by the potential effects it can have on the family’s subsistence activities. Even when members are released into paid employment, there are always some family members remaining in the village to carry on subsistence farming activities. When there are no other alternatives, migrant workers are called back home to help.
Finding 3. Some rural workers have moved out of the agricultural sector and into the non-
agricultural sector
The increase in rural to urban migration, as well as in overseas migration, can mislead one to think that there is a labour surplus in rural areas. Statistics and interviews with farmers tell us this is not the case, and that there are shortages of workers in the agricultural sector. In reality, migrant workers tend to come from households with surplus labour or households with little or no land for farming. They represent surplus at the household level, but not at the aggregate level. Consequently, their movement out of the agricultural sector has intensified the labour shortage problem, and has put pressure on wages in the agricultural sector.
Finding 4. Agricultural wages have increase
The wage increase affects not only the labour costs for large-scale commercial plantations, but also subsistence farmers, who also hire workers at planting and harvesting times. This situation is good for hired agricultural workers because they can earn higher incomes. But at the same time, this situation is bad for subsistence farmers because the higher costs cut into their production, resulting in less produce – primarily rice – left over for household consumption. If wages continue to increase, subsistence farmers will have less and less for household consumption and will possibly fall below subsistence level. Consequently, subsistence farmers will have to decide between letting go of their subsistence activities to become wage earners in the modern sector, or to continue to live with constant shortages. If they decide to let go, they increase their risks in the sense that they have no
19 ILO: Rapid assessment.

Country Office for Thailand, Cambodia and Lao People’s Democratic Republic 37
safety net to fall back on if there is a broader crisis in such areas as unemployment or inflation. If they decide to not let go, they will be stuck in poverty.
Potential social impacts
Based on the findings summarized above, if policies do not address the challenge of limited labour supply in rural areas, and specifically the agricultural sector, this will affect subsistence agriculture and could have dire socio-economic consequences for rural households.
Given the crucial function of the subsistence economy as a safety net, households will try to avoid giving up farming at all costs. They may try to cut the cost of production by replacing hired workers with family members. This will likely involve children under the working age because the eventual cost of using working-age family members will be higher (as they can earn more by working in paid employment). Thus, the social consequence is that some families will have to take their children out of school or reduce school attendance so that they can help on the farm. Indeed, this will undermine the human capital base for future employment and growth.
Households that cannot endure conditions in a shrinking subsistence economy may be forced to sell their land and migrate to find work. It is possible that they can earn higher incomes as paid, rather than own-account, workers, but with a resulting loss of social capital. When households leave their land and communities, a part of the social fabric is destroyed. They lose the sense of connection and solidarity that they once had in their close-knit rural community.
The most severe social impact is the erosion of their safety net. Given the absence of a national social protection system, rural households are dependent on subsistence farming. The subsistence economy protects not only family members that stay in the village, but also those who migrate out to work in the modern, non-agricultural sector. As our interviews with garment workers in Phnom Penh revealed, these migrant workers sometimes depend on rice and food from the family farm to reduce their living costs when their paid incomes are reduced due to various economic factors, such as the recent financial crisis. They may not survive without support from subsistence agriculture.
Recommendations
How can the NEP mitigate these effects and contribute towards the realization of decent work in rural areas? Based on the research findings, the NEP needs to focus on two issues: (1) increase the stability and sustainability of subsistence farming; and (2) reduce the risks that rural households are exposed to during transitions from the subsistence economy to the modern economy. Some recommendations aimed at addressing these two issues are as follows.
Recommendation 1. Increase the stability and incomes from subsistence farming by raising
agricultural productivity.
As mentioned, the decision to release working-age family members into paid employment is typically a household decision, not an individual one, and is dictated by its possible impact on the household’s subsistence activities. The constraint now is that subsistence agriculture is characterized by low productivity and low income. If households perceive that their subsistence economy (rice farming) is

38 Country Office for Thailand, Cambodia and Lao People’s Democratic Republic
secured for the long term, they will be more willing to release family members into paid employment permanently.
There are three possible strategies to raise agricultural productivity and incomes. First, intensification of existing land in cultivation to improve yields could help increase farmers’ incomes. This requires access to modern inputs, technology, irrigation, credit, and skills improvement for farmers. Second, increase the number of crops per year. Most Cambodian farmers cultivate rice only once per year during the rainy season, while farmers in Vietnam’s Delta region cultivate 3.5 times.20 In order for this to happen, there is a need for functioning irrigation facilities. A third strategy to increase agricultural incomes, given the lack of an unlimited labour supply in the agricultural sector, would be for Cambodia to implement a strategy similar to Thailand that focuses on high-value strains of rice. This could mean that farmers are able to earn higher incomes without having to find additional workers.
In this context, the government’s existing agriculture development strategy, as described previously, fits well and should help to relieve the stress of releasing family members into non-agricultural sectors. These efforts will also help reduce seasonal unemployment in agriculture and in rural areas by increasing the number of crop plantings per year.
Furthermore, the research revealed the necessity of agricultural mechanization in order to release workers into non-agricultural sectors and sustain production at the same time. In this area, lessons can be learned from the Republic of Korea, which underwent a successful mechanization process in its agricultural sector. In 1978, the government of the Republic of Korea passed the Agricultural Mechanization Promotion Law in response to the decrease in the number of farm labourers. Their initiatives focused on:21
1) increasing the supply of agricultural machinery through subsidies, financing and setting quality standards; and
2) setting up joint utilization systems for agricultural machinery.
Because farm sizes in the Republic of Korea were generally small at the time (1.5 hectares per farm, on average), investment in machinery by individual farms and farmers was too expensive. To reduce the cost, agricultural associations were established to lease machines on demand to farmers. In addition, pilot farms operated by these agricultural associations were organized to demonstrate and promote the use of machines.
Another important policy action related to raising agricultural productivity and incomes is market connection. In order to move beyond a subsistence economy, attention must also be given to expanding markets for agricultural commodities, especially higher-value markets. Raising productivity alone is not sufficient to sustain growth in the agricultural sector. In this regard, development of a domestic agro-industry can play a central role in absorbing agricultural output and stimulating growth. This is the current viewpoint of the Government, and a number of existing policies aim to incentivize investment in agro-processing industries such as rice milling.
20 SNEC: Policy document on the promotion of paddy rice production and export of milled rice, (2010). 21 Kyu-Hong Choi and Sukwon Kang: Agricultural mechanization and post-harvest technology in Korea.

Country Office for Thailand, Cambodia and Lao People’s Democratic Republic 39
Recommendation 2. Promote and strengthen linkages between the agriculture and agro-
industry.
As outlined in the National Strategic Development Plan Update 2009–2013, the government recognizes that it is necessary to diversify the economic base in order to increase the resilience of the economy to economic shocks and to sustain growth and development. The government has chosen a balanced growth path in which both the agricultural and non-agricultural sectors are to be promoted, and growth in each sector is expected to feed back into the other.
Indeed, development of the agro-industrial sector is vital for rural development and rural employment for two reasons. First, as mentioned, the agro-industrial sector can play a strategic role in absorbing output from the agricultural sector, and therefore can have a powerful effect on improving the incomes and livelihoods of rural households. Second, the agro-industrial sector can provide jobs to rural households during the slack agriculture seasons, and help solve the problem of irregular incomes. Existing government policies already focus on these issues.
The challenge that confronts policy-makers, and which is currently missing in the policy focus, is how to draw the rural labour supply into the wage labour market permanently (that is, year-round). Having a steady supply of workers is crucial for the industrialization process, including in large-scale plantations as well as agro-processing factories. This can affect the wage level, the stability of production, and the ability of firms to achieve greater specialization from the division of labour and productivity, all of which affect profitability. Clearly, instability in the labour supply creates a barrier for broad-based economic development and growth.
As mentioned, the current labour supply in the agricultural sector is already at a low level. This means that it is not an ideal strategy to draw workers out of agriculture, as this could reduce farm production. Rather, the focus needs to be on how to effectively use the available labour in the agricultural sector, specifically how to shift some workers in subsistence farming into large-scale commercial farming. There is a need for mechanisms and facilitation services to efficiently coordinate the flow of agricultural workers between subsistence and commercial agriculture. For instance, the commune councils can play a vital role in disseminating information and mobilizing labour exchange across communities.
Box 1
Recommendation 1: Increase stability and incomes from subsistence farming by raising agricultural productivity
Actions:
1. Improve the access of farmers to modern inputs, technology, and credit, so that they may increase agricultural yields.
2. Construct irrigation facilities. 3. A concerted government effort to mobilize farmers to produce high-value rice strains that
can fetch higher prices in global markets. 4. Increase the supply of agricultural machinery through subsidies, financing, and setting
quality standards. 5. Set up joint utilization systems for agricultural machinery to allow farmers to lease
machines on demand, thus reducing investment costs, and set up pilot farms to demonstrate and promote the use of machines.
6. Develop a domestic agro-industry and small and medium-sized enterprises (SMEs) to absorb agricultural output and stimulate growth.

40 Country Office for Thailand, Cambodia and Lao People’s Democratic Republic
Moreover, since labour in rural areas is not unlimited, the development and industrialization strategy needs to focus on physical and human capital accumulation. This requires actions to promote investment in rural enterprises and in the education and skills development of rural workers to match enterprise needs, and to provide incentives for rural households to develop skills and permanently move into other sectors (e.g. social protection).
Overall, policy intervention needs to focus not only on helping rural farmers protect and improve their subsistence agriculture, but also on reducing the risks they face in moving away from the traditional economy and in releasing some family members into the modern sector. Some possible actions would be to:
a) Subsidize investment costs in developing skills required in the modern sector; b) subsidize investment in replacing family members during peak farming seasons, which is
needed to avoid a fall in output (such as the cost of hiring workers and the purchase of machines, among others);
c) ensure that wages in the modern sector are sufficient to compensate for the loss of labour for subsistence farming activities; and
d) provide social protection such as public works, income support, and agriculture extension services.
Recommendation 3. Promote decent living wages and social protection for workers in the
modern sector.
One way to reduce the dependence of workers on the subsistence economy (which also means to reduce the risk of entering paid employment) is to ensure that wages are sufficient not only to cover subsistence expenses, but also to allow workers to accumulate some savings for the future and to deal with crises. The general sentiment among migrant workers and rural households is that employment in the modern sector is unpredictable. Workers never know when they might be dismissed, or whether the factory will go bankrupt. Given the absence of social security provisions such as unemployment insurance and income support, unemployed workers must rely on the subsistence economy.
The lack of a minimum living wage – defined as a wage that is sufficient to cover bare subsistence living and perhaps some small savings – is one of the reasons behind the increasing number of
Box 2
Recommendation 2: Promote and strengthen linkages between agriculture and agro-industry Actions:
1. Set up mechanisms and facilitation services to efficiently coordinate the flow of agricultural labor between subsistence and commercial agriculture. For instance, commune councils can play a vital role in disseminating information and mobilizing labor exchange across communes.
2. Subsidize the investment costs of rural households in developing skills required in the modern sector.
3. Provide credit facilitation for enterprises and rural households. 4. Provide incentives for rural enterprises to invest in physical and human capital. 5. Develop skills that are required in the modern sector. 6. Subsidize the investment costs of developing skills required in the modern sectors. 7. Provide social protection such as public works, income support, and agricultural extension
services.
Country Office for Thailand, Cambodia and Lao People’s Democratic Republic 41
workers’ strikes in the garment industry. When migrant workers enter the modern sector, their expectations (as well as their households’ expectations) are that they will be able to accumulate savings and return to their villages with a stronger financial foundation. When these expectations are not realized, workers feel disillusioned, and this may spark labour unrest. As one garment worker commented: “I’ve worked in the factory for five years, but I never have any money left over. With my wage, I can only afford to cover my living costs. I see no point in working here anymore. It’s better if I go back home to work on the farm.”
6. Conclusions
The key finding of this study is that there is no unlimited supply of labour in rural areas, or more precisely in the agricultural sector. The amount of labour currently available in the agricultural sector as a whole is already at a very low level (just 1.6 workers per hectare), almost as low as in countries with high agricultural mechanization such as Thailand and the Republic of Korea. This suggests that drawing labour out of the agricultural sector could negatively affect agricultural production.
In the forthcoming NEP, actions to promote rural employment and development will need to pay attention to the challenges caused by the lack of workers in agriculture and how to draw the rural labour supply into the modern sector or paid employment. Labour flexibility depends upon the decisions made by rural households. As long as rural households feel that their subsistence is at risk, they will not fully engage in providing workers to paid jobs in the modern sector. Therefore, in addition to placing efforts on labour demand, it is recommended that policy-makers consider actions to reduce the risks on rural households so that they can provide a steady supply of workers to support the industrialization process.
Box 3
Recommendation 3: Promote decent living wages and social protection for workers in the modern sector
Actions:
1. Promote decent living wages. 2. Set up social protection programmes such as unemployment insurance, among others.

42 Country Office for Thailand, Cambodia and Lao People’s Democratic Republic
Annex 1. Summary of interviewees and focus
group discussion participants
In-depth interviews
Type of interviewee Age Gender Household size (persons)
Education Occupation
1. Farmer 28 Male 3 Grade 2 Plantation worker
2. Farmer 33 Male 3 None Plantation worker
3. Farmer 47 Male 4 Grade 7 Plantation worker
4. Farmer 34 Male 4 Grade 5 Plantation worker
5. Garment worker 22 Female 5 Grade 6 Worked in garment factory for five years
6. Garment worker 32 Female 7 Grade 5 Worked in garment factory for 11 years
7. Garment worker 22 Female 6 Grade 8 Worked in garment factory for three years
8. Garment worker 26 Female 6 Grade 11 Worked in garment factory for four years
9. Brick manufacturer 50 Male 5 Grade 12 Business owner
10. Window glass manufacturer
40 Male 4 Grade 9 Business owner
Focus group discussions
• Total of six participants: three male and three female.
• Location: Thma Keo Village, Svay Chrum Commune, Rolea B’ier District.
• Ages: 35–45.
• Economic activity: All depend on subsistence agriculture (rice farming) as their main occupation. One male participant also has paid employment as a teacher. One male and one female also work as daily casual labourers on a plantation.

Regional Office for Asia and the Pacific 1
ILO Country Office for Thailand, Cambodia, and Lao People’s Democratic Republic
ILO Regional Office for Asia and the Pacific United Nations Building, 11th Floor Rajdamnern Nok Avenue, Bangkok 10200, Thailand
Tel.: +66 2288 1234, Fax.: +66 2288 3062 Email: [email protected]
www.ilo.org/asia
ISSN: 2227-4391 (print) 2227-4405 (web pdf)
Rural development and employment opportunities in Cambodia:
How can a national employment policy contribute towards
realization of decent work in rural areas?
The paper describes the challenges of rural development and prospects for economic development of non-agricultural sectors are magnified by seasonally tight labour supply in the agricultural sector. At the same time, the paucity or lack of social safety nets in the non-agricultural sectors tie
rural households to their land. Farming represents safety and security vis-à-vis the uncertain income prospects in both agricultural and non-agricultural sectors. To enhance the livelihoods and prospects of both
agricultural and non-agricultural employment, this paper recommends the following areas for consideration as part of the national employment policy: (1) increase stability and incomes from subsistence farming by
raising agricultural productivity; (2) promote and strengthen linkages between agriculture and agro-industry; and (3) promote decent living
wages and social protection for workers in the modern sector.