Embed Size (px)
Citation preview

1
Running Head: Metabolite profiling of transgenic tomato Corresponding author:
Autar K. Mattoo
Sustainable Agricultural Systems Laboratory
Bldg. 001, Room 119
USDA-ARS, Beltsville Agricultural Research Center
10300 Baltimore Ave.
Beltsville, Maryland 20705-2350
Tel. 301 504-6622; Fax. 301 504-6491; E-mail: [email protected]
Research category: Systems biology, molecular biology, and gene regulation
Plant Physiology Preview. Published on October 13, 2006, as DOI:10.1104/pp.106.084400
Copyright 2006 by the American Society of Plant Biologists
www.plantphysiol.orgon May 24, 2018 - Published by Downloaded from Copyright © 2006 American Society of Plant Biologists. All rights reserved.

2
NMR Spectroscopy Based Metabolite Profiling of Transgenic Tomato
Fruit Engineered to Accumulate Spermidine and Spermine Reveals
Enhanced Anabolic and Nitrogen-Carbon Interactions1
Autar K. Mattoo*, Anatoli P. Sobolev, Anil Neelam2, Ravinder K. Goyal2,3, Avtar K.
Handa and Anna L. Segre
The Henry A. Wallace Beltsville Agricultural Research Center, United States Department
of Agriculture, Agricultural Research Service, Sustainable Agricultural Systems
Laboratory, Building 001, Beltsville, MD 20705-2350 (A.K.M., A.N., R.K.G); Institute
of Chemical Methodologies, CNR, Monterotondo Stazione, Rome, Italy (A.P.S., A.L.S.);
and Department of Horticulture and Landscape Architecture, Purdue University, W.
Lafayette, IN 47907 (A.K.H.)
*Corresponding author: Fax. 301 504-6491; E-mail: [email protected]
www.plantphysiol.orgon May 24, 2018 - Published by Downloaded from Copyright © 2006 American Society of Plant Biologists. All rights reserved.

3
Footnotes:
1 This study was supported in part by Israel-US Binational Agricultural Research
Development (BARD) grant IS-3441-03 (to A.K.M. and A.K.H.), Società Italiana di
Spettrochimica e Spettrofisica (to A.P.S. and A.L.S.) and a DBT Fellowship, Government
of India (to R.K.G.). 2These authors contributed equally to this manuscript 3Present address: University of Victoria, B.C., Canada
Abbreviations: 556AZ, azygous control line 556; 556HO, transgenic line 556
homozygous for ySAM decarboxylase; 579HO, transgenic line 579 homozygous for
ySAM decarboxylase; ANOVA, analysis of variance; C, carbon; ICDHc, cytosolic
isocitrate dehydrogenase; LDA, linear discriminant analysis; N, nitrogen; PCA, principal
component analysis; PEP, phosphoenolpyruvate; SAM, S-adenosylmethionine; SMD,
Mahalanobis distance; Spd, spermidine; Spm, spermine; TCA, tree clustering analysis;
TSP, 3-(trimethylsilyl)-1-propanesulfonic acid sodium salt.
www.plantphysiol.orgon May 24, 2018 - Published by Downloaded from Copyright © 2006 American Society of Plant Biologists. All rights reserved.

4
Polyamines are ubiquitous aliphatic amines that have been implicated in myriad
processes but their precise biochemical roles are not fully understood. We have carried
out metabolite profiling analyses of transgenic tomato fruit engineered to accumulate
higher polyamines, spermidine (Spd) and spermine (Spm) to bring an insight into the
metabolic processes that Spd/Spm regulate in plants. NMR spectroscopic analysis
revealed distinct metabolite trends in the transgenic and wild-type/azygous fruits ripened
off the vine. Distinct metabolites accumulated (Gln, Asn, choline, citrate, fumarate,
malate and an unidentified compound A) in the red transgenic fruit while the levels of
Val, Asp, sucrose and glucose were significantly lower as compared to the control (wild-
type and azygous) red fruit. The levels of Ile, Glu, GABA, Phe and fructose remained
similar in the non-transgenic and transgenic fruits. Statistical treatment of the metabolite
variables distinguished the control fruits from the transgenic fruit and provided credence
to the pronounced, differential metabolite profiles seen during ripening of the transgenic
fruits. The pathways involved in the nitrogen sensing/signaling and carbon metabolism
seem preferentially activated in the high Spd/Spm transgenics. The metabolite profiling
analysis suggest that Spd/Spm are perceived as nitrogenous metabolites by the fruit cells,
which in turn results in the stimulation of carbon sequestration. This is seen manifested in
higher respiratory activity and up-regulation of PEP carboxylase and NADP-dependent
isocitrate dehydrogenase transcripts in the transgenic fruit compared to controls
indicating high metabolic status of the transgenics even late in fruit ripening.
www.plantphysiol.orgon May 24, 2018 - Published by Downloaded from Copyright © 2006 American Society of Plant Biologists. All rights reserved.

5
Polyamines represent a class of aliphatic nitrogenous compounds that are ubiquitous
in nature with essential functions in living organisms (Tabor and Tabor, 1984; Slocum
and Flores, 1991; Cohen, 1998). In eukaryotes, the most prevalent are the diamine
putrescine, triamine spermidine (Spd)1 and the tetramine spermine (Spm). Polyamines
have been implicated in myriad biological processes including cell proliferation, cell
division and differentiation, apoptosis, homeostasis, gene expression, protein and DNA
synthesis (Tabor and Tabor, 1984; Slocum and Flores, 1991; Cohen, 1998; Igarashi and
Kashiwagi, 2000; Wallace et al., 2003; Janne et al., 2004). The list gets longer when
processes implicated in plants are considered: embryogenesis, root formation, floral
initiation and development, fruit development and ripening, pollen tube growth and
senescence and biotic and abiotic stress responses (Slocum and Flores, 1991; Cohen,
1998; Cassol and Mattoo, 2003; Kaur-Sawhney et al., 2003). Polyamines have been
shown to induce DNA conformational transitions from the right-handed to a left-handed
Z-DNA, and to an alternative form of right-handed helix, A-DNA (Ouameur and Tajmir-
Riahi, 2004). Based on immunocytochemical studies it has been reported that Spd and
Spm are associated with highly compacted mitotic chromosomes (Igarashi and
Kashiwagi, 2000), inducing stabilizing rather than a regulating effect on the chromatin
structure during the cell cycle (Sauve et al., 1999). By their characteristic property of
binding to nucleic acids, polyamines have also been implicated in providing protection to
cells from oxidative damage or external agents such as radiation damage (Tabor and
Tabor, 1984; Drohlert et al., 1986; Ha et al., 1998; Janne et al., 2004). In vitro studies
have indicated that Spd and Spm have the ability to inhibit senescence and ripening in a
number of plant tissues (Cassol and Mattoo, 2003). In spite of significant progress made
in understanding aspects of polyamine metabolism and transport, we know little about the
in vivo role(s) of polyamines in cellular metabolism (Cohen, 1998; Igarashi and
Kashiwagi, 2000; Cassol and Mattoo, 2003; Kaur-Sawhney et al., 2003; Uemura et al.,
2005). Interestingly, polyamine catabolism has the potential to provide defense against
biotic and abiotic stresses, particularly because the oxidation products include signaling
molecules such as H2O2 (Paschalidis and Roubelakis-Angelakis, 2005; Cona et al., 2006).
In an effort to gain insight into the role of polyamines in growth and development,
several studies have succeeded in altering endogenous polyamines in animals and plant
www.plantphysiol.orgon May 24, 2018 - Published by Downloaded from Copyright © 2006 American Society of Plant Biologists. All rights reserved.

6
cells by over-expression and knock-out of genes of polyamine biosynthesis. However, in
some cases, the elevated polyamine levels resulted in abnormal phenotypes, including
stunting (Noh and Minocha, 1994; Kumar et al., 1996). We developed transgenic tomato
fruit lines homozygous for the introduced yeast SAM decarboxylase (SAMdc) gene fused
to a ripening-specific promoter (Mehta et al., 2002). Since a fruit ripening-specific
promoter was used to drive the expression of SAMdc, the introduced gene had no
significant effect on normal growth and development. Fruits from transgenic plants
accumulated higher polyamines in a ripening-specific manner and the phenotypes showed
increased antioxidant capacity and enhanced fruit processing quality. These transgenic
tomato plants afford an excellent model system to analyze effects of polyamines,
especially Spd /Spm, on metabolism and also to understand how plants regulate cellular
processes. Importantly, harvested mature green fruit of these transgenics can be ripened
on the bench thus allowing evaluation of the effects of high levels of Spd/Spm in the
absence of any perturbation from the parent plant. Profiling of metabolites and
engineering their pathways are avenues to understand how plants regulate cellular
processes and to reveal intracellular networks (Whitfield et al., 2004; Fernie et al., 2004;
Ratcliffe and Shachar-Hill, 2001; Alba et al. 2005).
Nuclear Magnetic Resonance (NMR) spectroscopy is a powerful tool to analyze and
quantify metabolite levels in cell extracts, in solution and/or on semi-wet samples,
requiring minimum preparation or handling of the tissue and no derivatization (Ratcliffe
and Shachar-Hill, 2001; Sobolev et al., 2003). When high-resolution NMR methods are
coupled to multivariate statistical analysis, the resulting partitions give unambiguous
information about influences of nutritional and genetic backgrounds (Ratcliffe and
Shachar-Hill, 2001; Mannina et al., 2003: Amato et al., 2004: Krishnan et al., 2005).
Metabolite profiling, metabolomics, offers a powerful approach to monitor complexity of
genetically modified crops and document any unintended consequences of a modified
gene introduced in crops (Kuiper et al., 2001: Sumner et al., 2003: Tretheway, 2004;
Mungur et al., 2005). We have used high-resolution NMR methods to generate an
analysis of the principal, soluble constituents of wild type and polyamines-accumulating
transgenic tomato. Here, we show that the same metabolites present in wild-type or
azygous control tomatoes are also present in the higher polyamines-accumulating,
www.plantphysiol.orgon May 24, 2018 - Published by Downloaded from Copyright © 2006 American Society of Plant Biologists. All rights reserved.

7
transgenic tomato fruit. However, accumulation of Spd/Spm in transgenic fruit results in
differential metabolite content as compared to the controls. The synthesis of the data
presented suggests that Spd/Spm are sensed as ‘regulatory’ amines/ organic-N, which, in
turn, signal carbon metabolism. These results show, to our knowledge, for the first time
that Spd and Spm have profound effects on cellular metabolism, likely via regulation of
distinct biochemical pathways.
RESULTS
A typical 1H NMR spectrum of tomato fruit powder in D2O buffer solution is shown
in Fig.1, illustrating the spectral assignment corresponding to a few important
compounds. Almost all resonances corresponded to known compounds. The chemical
shifts corresponding with known metabolites are listed in Table I. Resonances labeled
‘A’, ‘B’ and ‘C’ could not be assigned because they remained unidentified; however, ‘A’
gave a spectral pattern identical to that of citrate and may therefore be a complex of
citrate with a small molecule, ‘B’ is an unidentified multiplet, and ‘C’ a singlet, possibly
a choline derivative. These resonances were present in all samples. The values
corresponding to the resonances were used to determine the profiles of the identified
metabolites in wild-type/azygous controls and the two transgenic lines, 556HO and
579HO.
Profile of Amino Acids
The profiles of nine amino acids and GABA during ripening of wild type (WT), non-
transgenic azygous (556AZ), and two transgenic (556HO and 579HO) tomato fruits are
shown in Fig. 2 (see also Supplemental Table I). The levels of Ile, Val, Thr, Ala and
GABA in WT and 556AZ control fruit decreased during ripening. For most part, similar
trend was apparent in 556HO and 579HO fruits except for Val, whose level was
significantly lower at the late stages of ripening compared to the control fruits and so was
the case for Ala in the pink transgenic fruit (Fig. 2A). Phe levels declined during later
stages of ripening in both non-transgenic controls (WT, 556AZ) as well as in the 556HO
www.plantphysiol.orgon May 24, 2018 - Published by Downloaded from Copyright © 2006 American Society of Plant Biologists. All rights reserved.

8
and 579HO transgenics; however, Phe levels in red fruit of 579HO plant were lowest
than the rest of them. The levels of Gln and Asn decreased in the red fruit from WT and
556AZ plants. However, in the two high-polyamine transgenics, both Gln and Asn
distinctly accumulated in the red fruit as compared to the two controls. Both Asp and Glu
dramatically increased as ripening progressed in the WT and 556AZ fruit. In the two
transgenics, the rise in Asp level was less as compared to the controls, a trend exactly
opposite to that seen with Glu (Fig. 2). These profiles suggest that the increased levels of
Spd/Spm in the transgenic tomato fruit have a ripening-related effect on the levels of
Asp, Asn, Gln, and Val.
Profile of Organic Acids and Sugars
Two major organic acid constituents of fruits are citrate and malate (Mattoo et al.,
1975; Tucker, 1993). Profiles of organic acids - citrate, fumarate and malate - in the WT
and 556AZ non-transgenic fruits indicate considerable decrease in their levels after the
breaker stage as ripening progressed. However, citrate content remained significantly
higher in the red fruit from both the high-polyamine transgenic lines (556HO and
659HO). Although the levels of malate and fumarate declined during ripening of the fruit
from both the transgenics, their levels in the red fruit were also significantly higher than
in the azygous/WT controls (Fig. 3A and Supplemental Table I).
The contents of glucose and fructose remained more or less similar until breaker stage
in fruit from WT and 556AZ plants but slightly declined at the pink and red ripening
stages. In the transgenic fruits, glucose levels progressively declined from the green to
ripe stage while the fructose level remained similar to the controls (Fig. 3A). The higher
levels of citrate, malate and fumarate were associated with a decreased glucose content in
the red ripe transgenic fruits. Sucrose levels, on the other hand, decreased during ripening
in the fruit from all the genotypes tested but faster decline was apparent in fruit from both
the transgenic lines (Fig. 3A and Supplemental Table I).
Compound ‘A’, likely a citrate complex, increased as ripening progressed in
transgenic fruits while in the two non-transgenic control fruits their levels decreased (Fig.
3C). Changes in the levels of compound ‘B’ were apparent among most of the genotypes
www.plantphysiol.orgon May 24, 2018 - Published by Downloaded from Copyright © 2006 American Society of Plant Biologists. All rights reserved.

9
examined here but differences between the transgenics and non-transgenics were not
significant.
One consequence of these data is that the transgenic red fruit have significantly
higher fructose/glucose (Fig. 4A) and acid [citrate+malate]/sugar
[glucose+fructose+sucrose] (Fig. 4B) ratios based on integrals (see Supplemental Table
II), consistent with higher fruit juice and nutritional quality reported in the two
transgenics (Mehta et al., 2002). These higher ratios of typical fruit metabolites are
attributes favorably considered as higher quality in tomato breeding programs.
Polyamines Enhance the Accumulation of Choline
Like Asn and hexose profiles, choline levels mostly remain similar throughout
ripening of WT and 556AZ fruits (Fig. 3C). However, in the Spd/Spm-accumulating
transgenic fruits (556HO and 579HO), choline significantly accumulated as ripening
progressed, particularly in the red ripe fruit, as was the case for the profiles of Asn, Gln,
and compound A (Figs. 2 and 3). Compound C (Fig. 2C), a singlet and possibly a choline
derivative, showed a trend towards accumulation during ripening of fruit in the four
genotypes but the content at the ripe stage of ripening was slightly higher in 579HO
transgenic (Fig. 3C). These data together with those described above suggest that higher
Spd/Spm levels effect the Glu/Gln and choline signaling networks.
Statistical Analysis Accentuates the Differences in the Metabolite Variables Between
the Transgenic and Non-transgenic Tomato Fruits
Tree clustering analysis (TCA), linear discriminant analysis (LDA), principal
component analysis (PCA) and analysis of variance (ANOVA) were used to treat the data
in order to perform a partition to classify them and determine the variables with
maximum discrimination for use in cluster analysis. Under the experimental conditions
used (uniform concentration, buffered solvent leading to constant pH, constant
temperature, etc.), α and β isomeric forms of glucose are in equilibrium and their
concentration was therefore not considered independently. This was also true for β-
www.plantphysiol.orgon May 24, 2018 - Published by Downloaded from Copyright © 2006 American Society of Plant Biologists. All rights reserved.

10
fructofuranose and β-fructopyranose. The sum of the corresponding line intensities were
introduced as data in the statistical analysis omitting the values of individual variables,
which resulted in a list of variables shown in Table I.
The cluster analysis of NMR data obtained from 16 fruit samples (Supplemental Fig.
1) showed a clear partition between the stages of ripeness. LDA of these data, taking into
account three classes, i.e. red, pink and green+breaker, generated a map shown in Fig.
5A, while their Principal Component Analysis (PCA) map was striking (Fig. 5B). In this
map all green samples were clearly grouped, and so were the breaker samples. The pink
and ripe samples grouped in a particular manner, with clear distinction between the
transgenic (556HO and 579HO) and the controls (WT and 556AZ). This clear distinction
was again observed for pink and ripe fruits when the sample size was doubled to 32
samples (data not shown). It was noteworthy that the first PC (PC1) was responsible for
separating samples based on their stage of ripeness while the second PC (PC2) provided a
separation based on the genotypic differences, i.e., control (WT and 556AZ) versus
transgenic (556HO and 579HO) fruits.
Major variations of the data, due to different ripening stages of tomatoes, associated
with PC1 involved variables Ile, Val, Ala, Glu, GABA, glucose and compound C while
the variation arising from the introduction of the engineered gene represents mostly the
variables Gln, Asn, and choline. Some variables that changed both during the ripening as
well as a function of the introduced transgene are, for instance, variables Thr and citrate.
They contributed to both PC1 and PC2. Thus, changes in the concentration of metabolites
during ripening may mask the greater differences due to the transgene. To eliminate this
interference and clarify the distinction between control and transgenic tomatoes, we
sought statistical analysis on samples from two separated sets, one corresponding to pink
and the other to red samples. Analysis of variance (ANOVA) was used to select
individual variables able to discriminate between control and transgenic tomatoes (LDA
for pink and ripe samples; Table II). In all these sets, WT and transgenic samples did not
superimpose, showing no ambiguity of separation. The degree of separation was
evaluated using the squared Mahalanobis distance, SMD (Brereton, 2003). The
probability that a sample belongs to a particular group is basically proportional to the
SMD from each centroid group. Therefore, the larger the SMD between the centroids of
www.plantphysiol.orgon May 24, 2018 - Published by Downloaded from Copyright © 2006 American Society of Plant Biologists. All rights reserved.

11
two groups, the better is the separation. SMD values thus obtained were: Pink samples =
29; Red samples = 709. Thus, the degree of separation obtained between transgenics and
WT samples followed the sequence: red > pink. This is not surprising since the transgene
is activated in a fruit ripening-specific promoter, and therefore major changes in the
metabolite content would be significant only at and/or after the breaker stage of ripening,
i.e., after transcription, translation and posttranslational processes are coordinated.
Sustained, Higher Respiration Rate in Transgenic Fruit During Ripening
The analysis of the NMR profiles of amino acids, sugars and organic acids in the
Spd/Spm-accumulating, transgenic fruits indicated that polyamines may regulate
respiratory and carbon metabolism in fruits. We, therefore, monitored carbon dioxide
evolution in the fruits harvested at the mature green stage and during their ripening
development for a period of two weeks at 250C (Fig. 6). As surmised, higher rates of
respiration were found in both the transgenic fruit, particularly at the red stage and
thereafter as compared to non-transgenic, control fruit. Higher rates of respiration in the
transgenic fruits throughout the ripening phase is indicative of enhanced carbohydrate
catabolism for generating energy, signifying enhanced metabolic activity in these fruit.
This conclusion is consistent with the differential trends in the profiles of amino acids,
citrate and glucose/sucrose, as shown above.
Higher Transcript Levels for PEPC2 and NADP+-ICDHc Genes
Several key enzymes link carbon metabolism and N sensing. Integration of glycolysis
with nitrogen assimilation is likely linked with phosphoenolpyruvate carboxylase
(PEPC), which provides carbon skeletons (Huppe and Turpin, 1994; Foyer and Noctor,
2002; Rademacher et al., 2002), and cytosolic isocitrate dehydrogenase (ICDHc), which
obviously functions in supplying NADPH for reductive biogenesis. We, therefore,
quantified transcript levels of PEPC and ICDHc genes during ripening of azygous
(556AZ) and transgenic (556HO) fruit using real time RT-PCR. The data on transcript
levels are summarized in Fig. 7. In the control (556AZ) fruit, both PEPC and ICDHc
www.plantphysiol.orgon May 24, 2018 - Published by Downloaded from Copyright © 2006 American Society of Plant Biologists. All rights reserved.

12
levels increased early during fruit ripening and precipitously decreased after reaching
highest levels at the breaker stage (Fig. 7). Similar trend was apparent for PEPC
transcripts in the transgenic (556HO) fruit but, in contrast to the control fruit, the
decreases in the transcript levels at pink (PK) and red (RD) stages were less dramatic
(Fig. 7A). This is more apparent when the ratio of PEPC transcripts in the transgenic fruit
to azygous fruit (i.e., 556HO/556AZ) is compared at pink and red stages, which were
168.9 and 3.7, respectively (see also inset in Fig. 7A). The ICDHc transcripts
accumulated throughout ripening in the transgenic (556HO) fruit, in contrast to the
azygous control fruit, reaching highest level at the red stage (Fig. 7B). The ICDHc
transcript levels at pink and red stages of the fruit were, respectively, 12.7- and 6.7-fold
higher in transgenic fruit compared to the azygous fruit.
DISCUSSION
Higher Polyamines May Control Multiple Sites in Cellular Metabolism
Metabolite profiling analysis presented here indicates that Spd/Spm influence
multiple cellular pathways in tomato fruit during ripening. Significant changes were
found in the levels of choline, Gln, Asp, Asn, Val, citrate, fumarate, malate, glucose, and
unidentified compound ‘A’ in the transgenic tomatoes during ripening compared to the
wild-type/azygous controls. Because these metabolites are known to be synthesized in
specific subcellular compartments as well as transported across cells, these data indicate
that Spd/Spm accumulation in the tomato fruit is associated with previously unknown
facets such as N:C interdependent signaling involving processes that take place in diverse
subcellular compartments, reminiscent of multiple processes that are associated with
another plant growth regulator, the plant hormone ethylene (Mattoo and Suttle, 1991;
Abeles et al., 1992; Alba et al., 2005). These results provide a basic framework to further
investigate how these processes are interlinked, consequences thereof on the nutritional
attributes and the ripening behavior of fruit. The observed changes in the cellular
metabolism in the transgenic tomato fruit are obviously not a result of a single mode of
www.plantphysiol.orgon May 24, 2018 - Published by Downloaded from Copyright © 2006 American Society of Plant Biologists. All rights reserved.

13
action. However, it is likely that transcription/translation of a number of genes is
coordinated with Spd/Spm-mediated changes in the metabolite profiles in the transgenic
tomato fruit. In animal cells, higher polyamines regulate transcription by acting as a
switch between different coactivators without altering the state of the chromatin (Maeda
et al., 2002) or by affecting histone acetylation/deacetylation (Hobbs and Gilmour, 2000).
Also, a posttranscriptional role for polyamines has been shown in down-regulating
animal genes (Li et al., 2001) while a certain group of Escherichia coli genes is
controlled by the diamine putrescine at the translational level (Yoshida et al., 2004). In
the latter case, it was suggested that putrescine enhances transcription of a group of genes
by increasing the level of transcription factors. Polyamine-mediated modulation of
protein synthesis may involve, among other things, structural changes in RNA,
stimulation of 30S ribosomal assembly, or tRNA formation (Igarashi and Kashiwagi,
2000). Regulation of gene expression by polyamines can occur via an effect on the
structure of eIF5A or oligomerization of nucleosomal arrays.
Interestingly, NMR spectroscopic analysis presented here shows that resonances
present in the genetically engineered tomato fruit samples were not different than those in
the fruit from wild-type/azygous plants. Thus, the introduction of the yeast SAM
decarboxylase gene into tomato plants, which subsequently leads to the accumulation of
Spd/Spm at the cost of putrescine (Mehta et al., 2002), does not lead to unusual
resonances. Statistical analysis validated the changes in the levels of the indicated
metabolites, certain variables were active at particular stage while others were active at
another phase of fruit ripening. For example: Asn, Gln and choline were active
throughout ripening whereas citrate, fumarate and glucose, likely indicators of changing
source of carbon, were active only during the later phase of fruit ripening. The trends in
some of the metabolites in tomato fruit during ripening seen here are similar to previous
reports, including fruits other than tomatoes (Mattoo et al., 1975; Biale and Young, 1981;
Tucker, 1993). Therefore, it will be of future interest to test if Spd/Spm similarly affect
the metabolism of other fruits as shown here with tomatoes.
www.plantphysiol.orgon May 24, 2018 - Published by Downloaded from Copyright © 2006 American Society of Plant Biologists. All rights reserved.

14
Are Polyamines Sensed as Organic-N That Signals Carbon Metabolism in the Fruit?
Fig. 8 illustrates the metabolic pathways linking the identified metabolites that show
regulated expression and pathways linked through S-adenosylmethionine (SAM).
Specific changes in cellular metabolites emphasize polyamine-mediated effects on N and
C metabolism in a ripening fruit. How the polyamine circuitry integrates with N:C
signaling pathway is unclear. It is noted here that these data provide only a steady state
picture but since they were followed at four ripening stages, these studies offer a
foundation for future experiments dedicated to metabolite fluxes. Nonetheless, we
provide a synthesis of this information vis a vis other data presented here as well as the
findings in the literature.
Glu, Gln and Asn are the major N-forms in plant leaves (Corruzi and Zhou, 2001;
Glass et al., 2002; Stitt et al., 2002). Asn to Gln ratio has been predicted as a sensor of N-
status in maize, part of a signal transduction pathway involving aspartate
aminotransferase, Gln synthetase and Asn synthetase as indicators of plant N status
during kernel development (Seebauer et al., 2004). Gln (Glass et al., 2002) and other
amino acids (Stitt et al., 2002) have been suggested as sensors of nitrogen status. From
these observations, it is possible that the transgenic fruit senses Spd and Spm as N-forms,
which correspondingly leads to increases in the other N forms such as Gln and Asn. Such
a response to higher polyamines is reminiscent of how plant roots and leaves sense and
signal N availability (Foyer and Noctor, 2002), as is also the case with the response of
trees to exogenous chronic additions of N to a formerly N limited forest (Rennenberg et
al., 1998; Bauer et al., 2004). Thus, a reproductive organ, such as the transgenic fruit in
this study, appears to house and likely maintains an organic-N (here Spd/Spm) sensing
machinery at the late ripening phase. The N:C interactions revealed imply that the
skeletons and moieties for most of the building blocks of biomolecules are more available
in the transgenic fruit as compared to the control fruits, indicating a higher anabolic
activity in these transgenics. It is particularly important to note that these metabolic
shifts occur in a fruit-specific manner without any interaction with the rest of the parent
plant because the fruits analyzed here were ripened off the vine and on the shelf,
therefore emphasizing transgene-activated responses.
www.plantphysiol.orgon May 24, 2018 - Published by Downloaded from Copyright © 2006 American Society of Plant Biologists. All rights reserved.

15
If the transgenic fruit follows N regulatory aspects, similar to roots or leaves (Corruzi
and Zhou, 2001; Foyer and Noctor, 2002), it would demand a coordinated signaling of
the carbon metabolism in such fruit to optimize C-N budgets. Indeed, this is precisely
indicated by other data in this study, namely, the level of glucose decreased while that of
citrate, malate and fumarate remained higher in the red ripe transgenic fruit (Figs. 3 and
8). Glucose metabolism through the Krebs cycle would yield more citrate, which can
generate more 2-oxoglutarate (2-OG) that, in turn, would become a substrate to produce
glutamate family of amino acids (Fig. 8). Accumulation of citrate, malate and fumarate in
red ripe transgenic tomatoes in comparison to non-transgenic fruit is suggestive of a more
active metabolic status of the transgenic fruit. This together with the overall trend in
metabolites is consistent with the increased respiratory activity in the transgenic tomatoes
as compared to wild-type/azygous tomatoes (Fig. 6). In fruits, organic acid metabolism
and respiration is highly dynamic and fruit-type dependent (Mattoo et al., 1975; Biale and
Young, 1981). The differential carbohydrate accumulation may also indicate that cell
wall metabolism is altered to sustain the supply of carbon for respiration, which is
consistent with the higher juice quality of these transgenic fruit (Mehta et al., 2002). The
high respiratory activity in the transgenics reveals an in vivo role of polyamines in
mitochondrial metabolic regulation, consistent with a previous proposal for spermine
function in rat liver mitochondria (Chaffee et al., 1979).
Are genes that encode enzymes implicated in linking C metabolism with N sensing
up-regulated in the Spd/Spm accumulating, transgenic tomatoes? In leaves, carbon
skeletons in response to N assimilation are provided through the activity of PEPC and
Krebs cycle enzymes or cytosolic forms of aconitase and ICDH (Foyer and Noctor,
2002). In tobacco leaves, C3-type PEPC and ICDHc are activated for organic acid
metabolism in response to N assimilation (Scheible et al., 1997, 2000). Studies on over-
expression of PEPC in transgenic potato plants showed that the flux of soluble sugars and
starch is directed to organic acids such as malate and amino acids glutamate and
glutamine (Rademacher et al., 2002). We surmised that a fruit such as tomato may also
use similar mechanism, i.e., to up-regulate PEPC and ICDHc transcripts in response to
Spd/Spm sensing in the transgenic fruit. Indeed, real time-PCR quantification of the
transcripts for the two genes showed them to be markedly higher in the transgenic tomato
www.plantphysiol.orgon May 24, 2018 - Published by Downloaded from Copyright © 2006 American Society of Plant Biologists. All rights reserved.

16
fruit in comparison to the control fruit (Fig. 7). These data point out the conservation of
the sensing/signaling mechanism and gene players involved in N assimilation and carbon
metabolism in different organs of a plant. Importantly, by inference, we suggest that N
assimilation signaling in plants may also be linked to a certain threshold of higher
polyamines, Spd/Spm.
The steady accumulation of choline during ripening of the transgenic fruit would
imply that flux towards choline biosynthesis is enhanced in the transgenics. This is of
particular significance in case of tomato because this plant is not able to effectively
metabolize choline to glycine betaine (Weretilnyk et al., 1989). Although we have not
studied the particular biosynthesis pathway of choline in tomato fruit, one of the reasons
for choline accumulation may be the release of choline from membrane phospholipids by
phospholipase D. In support of the latter possibility, our premilinary data show that
phospholipase D transcripts are indeed up-regulated in the transgenic fruits, which may
be a consequence of higher lipid turnover in the high polyamine accumulating fruits. The
accumulation of choline in these transgenic tomato fruit during ripening is significant.
Choline has been classified as a ‘vital amine’ for human health and has an essential role
as a micronutrient required for brain development (Blusztajn, 1998; Zeisel, 2000). It is
the precursor of membrane phospholipids, intracellular messengers diacylglycerol and
ceramide, signaling lipids platelet-activating factor and sphingosylphosphorylcholine,
and neurotransmitter acetylcholine (Kent, 1995; Blusztajn, 1998). Also, another methyl
donor betaine and an osmoprotectant glycine betaine are synthesized from choline
(Rhodes and Hanson, 1993; McNeil et al., 2001). In plants, glycine betaine has been
reported to confer tolerance to environmental stresses such as salinity and drought
(Rhodes and Hanson, 1993; Sakamoto and Murata, 2000). Interestingly, in transgenic
rice, activation of SAM decarboxylase results in higher levels of Spd/Spm and the plants
exhibit drought-stress response (Capell et al., 2004). Taken together, these results
suggest that polyamine-regulated stress responses may occur via an effect on the
biosynthesis of choline (McNeil et al., 2001).
www.plantphysiol.orgon May 24, 2018 - Published by Downloaded from Copyright © 2006 American Society of Plant Biologists. All rights reserved.

17
MATERIALS AND METHODS
Plant Materials
A chimeric gene construct containing the yeast SAM decarboxylase gene fused to the
ripening-regulated E8 promoter was introduced into tomato plants through Agrobacterium-based
transformation as previously described (Mehta et al., 2002). Transgenic (homozygous: 556HO
and 579HO), azygous (556AZ) and the parental processing cultivar (Ohio 8245; WT) of tomato
(Solanum lycopersicum) were grown in the fields at the Beltsville Agricultural Research Center
Farms, Maryland as previously described (Mehta et al., 2002). Fruits were harvested at mature
green (full size and firm) stage and ripened at 250C in the laboratory. Ripening stages of fruit
were selected as: mature green (full size, firm and green; GR), breaker (orange color on <10% of
blossom end of fruit; BR), pink (pink on 30 to 70% of fruit surface; PK), and red (red color on
>90% of fruit surface; RD). They were rinsed with distilled water, air-dried, deseeded, weighed,
and pericarp tissue without the skin immediately frozen in liquid nitrogen and freeze-dried. Each
sample represents an analysis of a minimum of three fruits at each stage of ripening.
NMR Spectroscopy
Spectral assignment and identification of specific metabolites was established using several
2D NMR techniques (COSY, TOCSY, 1H-13C HSQC and HMBC). Taking advantage of the
spread of complex resonances in the extra dimension, an unambiguous assignment was
accomplished as previously described (Sobolev et al., 2003). Further confirmation was obtained
by addition of an authentic standard to each sample. Dry powder (25 mg) from each sample was
rapidly dissolved in 1 ml of 0.4 M sodium phosphate buffer prepared in D2O containing known
amounts of an authentic standard, 3-(trimethylsilyl)-1-propanesulfonic acid sodium salt (TSP),
pH 6.5, and EDTA (10-5 M; to avoid citric acid from complexing). The solution was centrifuged
at 10,000 rpm for 7 min and the supernatant filtered to remove any insoluble material. The
resulting transparent soluble fraction was subjected to spectral analysis at 600.13 MHz on a
Bruker Avance 600 AQS spectrometer as previously described (Mannina et al., 2003). Proton
spectra were referenced to the TSP signal (δ = 0.00 ppm). Proton signals were acquired at 300K
by co-adding 512 transients with a recycle delay of 3 s. The strong water signal was suppressed
www.plantphysiol.orgon May 24, 2018 - Published by Downloaded from Copyright © 2006 American Society of Plant Biologists. All rights reserved.

18
by using a NOESY-presat scheme with solvent pre-saturation during relaxation delay and mixing
time. The 1D spectra were run using 90° flip angle pulses of 10.5 µs, 32 K data points and a 2 s
relaxation delay. 1H, 1H gradient selected COSY-45 (Braun et al., 1998) was acquired in the
following conditions: water pre-saturation during relaxation delay, spectral width 6000 Hz in
both dimensions, 1 k data points in ƒ2, 512 increments in ƒ1, unshifted sinusoidal window
function in both dimensions. 1H, 1H TOCSY (Croasmun and Carlson, 1994) was registered in
TPPI phase-sensitive mode, with water pre-saturation during relaxation delay, a spectral width of
6000 Hz in both dimensions, 2 s of relaxation delay, 80 ms of mixing time, 1 k data points in ƒ2,
512 increments in ƒ1. Zero filling in ƒ1 to 1 k real data points, and unshifted sinusoidal window
functions in both dimensions were applied before Fourier transformation. The 1H-13C gradient-
selected HSQC spectrum (Schleucher et al., 1994) was registered in the echo-antiecho phase
selective mode with the following parameters: 12 µs 90° 13C hard pulse and 80 µs for GARP 13C-decoupling, 6000 Hz and 18000 Hz spectral widths in proton and carbon dimensions
respectively, 1 k data points in ƒ2, 256 increments in ƒ1. Linear prediction up to 512 point
followed by zero filling to 1 k real data points was applied in ƒ1 dimension before Fourier
transformation. Unshifted squared cosine window functions were also applied in both
dimensions. The 1H-13C HMBC spectrum (Schleucher et al., 1994) was obtained with 2 s
relaxation delay, 90° pulse of 10.5 µs for 1H and 12.6 µs for 13C, 6000 Hz and 30000 Hz spectral
widths in proton and carbon dimensions, respectively, 2 k data points in ƒ2, 256 increments in ƒ1,
linear prediction up to 512 points and zero filling in ƒ1 to 1 k real data points, processed with use
of unshifted sinusoidal window functions in both dimensions. The base line correction was
performed as previously described (Mannina and Segre, 2002). The intensity of all signals was
referenced to the intensity of an internal standard, i.e. the methyl group resonance of TSP at 0.00
ppm whose intensity was set equal to 10.0.
Measurement of Respiration
Mature, green fruits, harvested from field-grown azygous (556AZ) and transgenic (556HO
and 579HO) plants were transferred to a temperature-controlled room at 25 0C. Respiration (CO2
evolution) was measured with eight fruits, with six replications, in glass jars attached to a gas
www.plantphysiol.orgon May 24, 2018 - Published by Downloaded from Copyright © 2006 American Society of Plant Biologists. All rights reserved.

19
chromatograph (Corel) housed with alumina column and equipped with a computer control. CO2
levels were automatically measured at 12-hour intervals for 14 days while the fruits ripened.
Visual assessments of changes in fruit color as fruits ripened were recorded on a daily basis. The
system was programmed to inject and quantify authentic CO2 prior to each measurement of the
experimental samples. CO2 levels were automatically computed from the standards.
RNA Extraction and Quantification of Transcripts by Real Time (RT)-PCR
Total RNA was extracted from pericarps of azygous (556AZ) and transgenic (556HO) fruit
at different stages of fruit ripening (GR, BR, PK and RD) as described (Mehta et al., 2002).
Transcript expression analysis of phosphoenolpyruvate carboxylase (PEPC2) and NADP+-
dependent, cytosolic isocitrate dehydrogenase (ICDHc) genes was conducted by real-time (RT)-
PCR analysis. PCR primers for tomato PEPC2 gene were designed (GenBank accession #
AJ313434) (Guillet et al., 2002) and the amplicon included 144 bp of 3’UTR region and a 39 bp
coding sequence; the forward and reverse primers were: 5’atgaaaggtattgctgctgga3’
(LePEPC2RTF) and 5’tcgagaagctactaaacaaagagg3’ (LePEPC2RTR), respectively. PCR primers
for tomato NADP+-ICDH gene were designed (TIGR tomato gene index # TC164449) and the
ICDH amplicon included 98 bp of 3’UTR region and a 63 bp of coding sequence; the forward
and reverse primers were: 5’ggagagttcatcgatgctga3’ (LeICDHRTF) and
5’tctgacaccttaatcccaaaca3’ (LeICDHRTR), respectively. Tomato 18S primers were designed
from rRNA gene sequence (accession number X51576) to amplify a product of 160bp in size.
The forward and reverse 18S primers were: 5’gcccgggtaatctttgaaat3’ (Le18SRTF) and
5’cggatcattcaatcggtagg3’ (Le18SRTR), respectively. First strand cDNA was synthesized from
total RNA (100 ng) samples using ImProm II reverse transcriptase enzyme at 42oC according to
manufacturer’s protocol (Promega). Aliquots of first strand cDNA samples were subjected to
RT-PCR with 10 pmol each of either LePEPC2 or LeICDHc and with Le18S primers in iCycler
with iQ SYBR green supermix (Biorad) and the fluorescence was detected at 490 nm. Real time
PCR conditions were as follows: 95oC for 30 s, 65oC for 20 s and 72oC for 10 s. A comparative
CT method using 2-∆∆CT formula was used to obtain relative quantitative levels of PEPC and
ICDHc transcripts in control and transgenic fruit as described (Livak and Schmittgen, 2001). The
amount of the target was normalized to 18S rRNA reference. The relative efficiency of LePEPC2
www.plantphysiol.orgon May 24, 2018 - Published by Downloaded from Copyright © 2006 American Society of Plant Biologists. All rights reserved.

20
or LeICDHc in relation to Le18S amplification with respective primer sets was demonstrated to
be approximately equal after plotting the log concentrations of serial dilutions of cDNA input
amounts against the delta CT values. The slope of the plot was determined to be less than 0.1 for
the LePEPC2, LeICDH and 18S primer sets.
Statistical Methods
Data of 1H-NMR in solution were subjected to statistical analysis by using Statistica software
package for Windows (1997; edition by Statsoft, Inc.) in order to determine if and to what extent
the selected variables were able to distinguish between the different tomatoes and their ripening
stages. Analysis of variance (ANOVA), principal component analysis (PCA), tree clustering
analysis (TCA) and linear discriminant analysis (LDA) were used to treat the data (Martens and
Martens, 2001). ANOVA was applied to each data set with the aim of selecting variables with a
significant discriminant power. The F and P-level parameters were used to perform the
selection. In particular, the F value is defined as the ratio of the “between-groups variability” and
“within-group variability”. The larger the ratio, the larger is the discriminating power of the
corresponding variable. The P-level gave the probability of error involved in accepting the
result: a low p-level corresponds to a high probability that the difference between groups is
significant. Application of PCA results in a linear combination of the original variables to yield a
few principal components with the highest variance and so drastically reduces the number of
variables to analyze. The contribution of original variables to a particular principal component is
given by its factor loading. For every sample, PC scores were used instead of the original
variables. TCA, applied to the selected variables, classified samples without any a priori
hypothesis, to check how they naturally group according to an amalgamation rule. In this work,
the “complete linkage” method was used to determine when two clusters were sufficiently
similar to be joined together. LDA allowed determination if the model is capable of
distinguishing between a priori defined groups, i.e. if the formed clusters are significantly
different. Moreover, it is possible to establish by LDA which variables have significantly
different means across the groups. The discriminating power, given by the Wilks’ Lambda
factor, ranges from 0.0, which corresponds to a perfect discriminating power, to 1.0, with no
www.plantphysiol.orgon May 24, 2018 - Published by Downloaded from Copyright © 2006 American Society of Plant Biologists. All rights reserved.
21
discriminating power for the model. This technique, applied to the selected variables, was used
to rank all the samples.
ACKNOWLEDGMENTS
We thank Richard Sicher for comments on the manuscript and Chiara Leonardi for technical
support. Mention of trade names or commercial products in this article is solely for the purpose
of providing specific information and does not imply recommendation or endorsement by the
U.S. Department of Agriculture.
www.plantphysiol.orgon May 24, 2018 - Published by Downloaded from Copyright © 2006 American Society of Plant Biologists. All rights reserved.
22
LITERATURE CITED
Abeles FB, Morgan PW, Saltveit Jr ME (1992) Ethylene in Plant Biology. Academic Press
Inc, NY
Alba R, Payton P, Fei Z, McQuinn R, Debbie P, Martin GB, Tanksley SD, Giovannonin JJ
(2005) Transcriptome and selected metabolite analyses reveal multiple points of ethylene
control during tomato fruit development. Plant Cell 17: 2954-2965
Amato ME, Ansanelli G, Fisichella S, Lamanna R, Scarlata G, Sobolev AP, Segre AL
(2004) Wheat flour enzymatic amylolysis monitored by in situ 1H-NMR spectroscopy. J
Agric Food Chem 52: 823-831
Bauer GA, Bazzaz FA, Minocha R, Long S, Magill A, Aber J, Berntson GM (2004) Effects
of chronic N additions on tissue chemistry, photosynthetic capacity, and carbon sequestration
potential of a red pine (Pinus resinosa Ait.) stand in NE United States. Forest Ecol Mgmt
196: 173-186
Biale JB, Young RE (1981) Respiration and ripening in fruits – retrospect and prospect. In J
Friend, MJC Rhodes, eds, Recent Advances in the Biochemistry of Fruits and Vegetables,
pp. 103-109. Academic Press, NY
Blusztajn JK (1998) Choline, a vital amine. Science 281: 794-795
Braun S, Kalinowski H-O, Berger S (1998) 150 and More Basic NMR Experiments. Wiley-
VCH, Weinheim, Germany
Brereton RG (2003) Chemometrics: Data Analysis for the Laboratory and Chemical Plant. J
Wiley & Sons, Chichester, West Sussex, England
Capell T, Bassie L, Christou P (2004) Modulation of the polyamine biosynthetic pathway in
transgenic rice confers tolerance to drought stress. Proc Natl Acad Sci USA 101: 9909-9914
Cassol T, Mattoo AK (2003) Do polyamines and ethylene interact to regulate plant growth,
development and senescence? In P Nath, AK Mattoo, SA Ranade, JH Weil, eds, Molecular
Insight in Plant Biology, pp. 121-132. Science Publ Inc, Enfield, NH
Chaffee RRJ, Arine RM, Rochelle RH (1979) The possible role of intracellular polyamines in
mitochondrial metabolic regulation. Biochem Biophys Res Commun 86: 293-299
Cohen SS (1998) A Guide to the Polyamines, Oxford Univ. Press, NY
www.plantphysiol.orgon May 24, 2018 - Published by Downloaded from Copyright © 2006 American Society of Plant Biologists. All rights reserved.

23
Cona A, Rea G, Angelini R, Federico R, Tavladoraki P (2006) Functions of amine oxidases in
plant development and defence. Trends Plant Sci, in press
Corruzi GM, Zhou L (2001) Carbon and nitrogen sensing and signaling in plants: emerging
‘matrix effects’. Curr Opin Plant Biol 4: 247-253
Croasmun WR, Carlson RMK (1994) Two-Dimensional NMR Spectroscopy. Applications for
Chemists and Biochemists. Wiley-VCH, NY
Drohlert G, Dumbroff EB, Legge RL, Thompson JE (1986) Radical scavenging properties of
polyamines. Phytochemistry 25: 367-371
Fernie AR, Trethewey RN, Krotzky A, Willmitzer L (2004) Metabolite profiling: from
diagnostics to systems biology. Nature Rev Mol Cell Biol 5: 763-776
Foyer CH, Noctor G (2002) Photosynthetic Nitrogen Assimilation and Associated Carbon and
Respiratory Metabolism, Kluwer Acad Publ, Boston
Glass ADM, Britto DT,Kaiser BN, Kinghorn JR, Kronzucker HJ, Kumar A, Okamoto M,
Rawat S, Siddiqi MY, Unkles SE, Vidmar JJ (2002) The regulation of nitrate and
ammonium transport systems in plants. J Exp Bot 53: 855-864
Guillet C, Just D, Benard N, Destrac-Irvine A, Baldet P, Hernould M, Causse M, Raymond
P, Rothan C (2002) A fruit-specific phosphoenolpyruvate carboxylase is related to rapid
growth of tomato fruit. Planta 214: 717-726
Ha HC, Sirisoma NS, Kuppusamy P, Zweier JL, Woster PM, Casero Jr RA (1998) The
natural polyamine spermine functions directly as a free radical scavenger. Proc Natl Acad Sci
USA 95: 11140-11145
Hobbs CA, Gilmour SK (2000) High levels of intracellular polyamines promote histone
acetyltransferase activity resulting in chromatin hyperacetylation. J Cell Biochem 77: 345-
360
Huppe HC, Turpin DH (1994) Integration of carbon and nitrogen metabolism in plant and algal
cells. Annu Rev Plant Physiol Plant Mol Biol 45: 577-607
Igarashi K, Kashiwagi K (2000) Polyamines: mysterious modulators of cellular functions.
Biochem Biophys Res Commun 271: 559-564
Janne J, Alhonen L, Pietila M, Keinanen TA (2004) Genetic approaches to the cellular
functions of polyamines in mammals. Eur J Biochem 271: 877-894
www.plantphysiol.orgon May 24, 2018 - Published by Downloaded from Copyright © 2006 American Society of Plant Biologists. All rights reserved.
24
Kaur-Sawhney R, Tiburcio AF, Altabella T, Galston AW (2003) Polyamines in plants: An
overview. J Cell Mol Biol 2: 1-12
Kent C (1995) Eukaryotic phospholipid biosynthesis. Annu Rev Biochem 64: 315-343
Krishnan P, Kruger NJ, Ratcliffe GR (2005) Metabolite fingerprinting and profiling in plants
using NMR. J Exp Bot 56: 255-265
Kuiper HA, Kleter GA, Noteborn, HP, Kok EJ (2001) Assessment of the food safety issues
related to genetically modified foods. Plant J 27: 503-528
Kumar A, Taylor MA, Mad Arif SA, Davies HV (1996) Potato plants expressing antisense
and sense S-adenosylmethionine decarboxylase (SAMDC) transgenes show altered levels of
polyamines and ethylene: antisense plants display abnormal phenotypes. Plant J 9:147-158
Li L, Rao JN, Guo X, Liu L, Santora R, Bass BL, Wang J-Y (2001) Polyamine depletion
stabilizes p53 resulting in inhibition of normal intestinal epithelial cell proliferation. Am J
Physiol Cell Physiol 281: C941-C953
Livak KJ, Schmittgen TD (2001) Analysis of relative gene expression data using real-time
quantitative PCR and the 2(-Delta Delta C(T) method. Methods 25: 402-408
Maeda Y, Rachez C, Hawel III L, Byus CV, Freedman LP, Sladek FM (2002) Polyamines
modulate the interaction between nuclear receptors and DRIP205. Mol Endocrinol 16: 1502-
1510
Mannina L, Dugo G, Salvo F, Cicero L, Ansanelli G, Calcagni C, Segre AL (2003) Study of
the cultivar-composition relationship in Sicilian olive oils by GC, NMR, and statistical
methods. J Agric Food Chem 51: 126-127
Mannina L, Segre AL (2002) High resolution nuclear magnetic resonance: from chemical
structure to food authenticity. Grasas y Aceites 53: 22-33
Martens H, Martens M (2001) Multivariate Analysis of Quality. J. Wiley & Sons, Chichester,
England
Mattoo AK, Murata T, Pantastico ErB, Chachin K, Ogata K, Phan CT (1975) Chemical
changes during ripening and senescence. In EB Pantastico, ed, Postharvest Physiology,
Handling and Utilization of Tropical and Subtropical Fruits and Vegetables, pp. 104-127.
AVI Publ Co, Westport, CT
Mattoo AK, Suttle JC (1991) The Plant Hormone Ethylene. CRC Press, Boca Raton, FL
www.plantphysiol.orgon May 24, 2018 - Published by Downloaded from Copyright © 2006 American Society of Plant Biologists. All rights reserved.
25
McNeil SD, Nuccio ML, Ziemak MJ, Hanson AD (2001) Enhanced synthesis of choline and
glycine betaine in transgenic tobacco plants that overexpress phosphoethanolamine N-
methyltransferase. Proc Natl Acad Sci USA 98: 10001-10005
Mehta RA, Cassol T, Li N, Ali N, Handa AK, Mattoo AK (2002) Engineered polyamine
accumulation in tomato enhances phytonutrient content, juice quality and vine life. Nature
Biotechnol 20: 613-618
Mungur R, Glass AD, Goodenow DB, Lightfoot DA (2005) Metabolite fingerprinting in
transgenic Nicotiana tabacum altered by the Escherichia coli glutamate dehydrogenase gene.
J Biomed Biotechnol 2: 198-214
Noh EW, Minocha SC (1994) Expression of a human S-adenosylmethionine decarboxylase
cDNA in transgenic tobacco and its effects on polyamine biosynthesis. Transgenic Res 3: 26-
35
Ouameur AA, Tajmir-Riahi H-A (2004) Structural analysis of DNA interactions with biogenic
polyamines and cobalt(III)hexamine studied by fourier transform infrared and capillary
electrophoresis. J Biol Chem 279: 42041-42054
Paschalidis K, Roubelakis-Angelakis KA (2005) Sites and regulation of polyamine catabolism
in the tobacco plant. Correlations with cell division/expansion, cell cycle progression, and
vascular development. Plant Physiol 138: 2174-2184
Rademacher T, Hausler RE, Hirsch H-J, Zhang L, Lipka V, Weier D, Kreuzaler F,
Peterhansel C (2002) An engineered phosphoenolpyruvate carboxylse redirects carbon and
nitrogen flow in transgenic potato plants. Plant J 32: 25-39
Ratcliffe RG, Shachar-Hill Y (2001) Probing plant metabolism with NMR. Annu Rev Plant
Physiol Plant Mol Biol 52: 499-526
Rennenberg H, Kreutzer K, Papen H, Weber P (1998) Consequences of high loads of
nitrogen for spruce (Picea abies ) and beech (Fagus sylvatica ) forests. New Phytol 139: 71–
86
Rhodes D, Hanson AD (1993) Quaternary ammonium and tertiary sulphonium compounds in
higher plants. Annu Rev Plant Physiol Plant Mol Biol 44: 357-384
Sakamoto S, Murata N (2000) Genetic engineering of glycinebetaine synthesis in plants:
current status and implications for enhancement of stress tolerance. J Exp Bot 51: 81-88
www.plantphysiol.orgon May 24, 2018 - Published by Downloaded from Copyright © 2006 American Society of Plant Biologists. All rights reserved.

26
Sauve DM, Anderson HJ, Ray JM, James WM, Roberge M (1999) Phosphorylation-induced
rearrangement of the histone H3 NH2-terminal domain during mitotic chromosome
condensation. J Cell Biol 145: 225-235
Scheible WR, Gonzales-Fontes A, Lauerer M, Muller-Rober B, Caboche M, Stitt M (1997)
Nitrate acts as a signal to induce organic acid metabolism and repress starch metabolism in
tobacco. Plant Cell 9: 783-798
Scheible WR, Krapp A, Stitt M (2000) Reciprocal diurnal changes of phosphoenolpyruvate
carboxylase expression and cytosolic pyruvate kinase, citrate synthase and NADP-isocitrate
dehydrogenase expression regulate organic acid metabolism during nitrate assimilation in
tobacco leaves. Plant Cell Environ 22: 1155-1167
Schleucher J, Schwendinger M, Sattler M, Schmidt P, Schedletzky O, Glaser SJ, Sorensen
OW, Griesinger CJ (1994) A general enhancement scheme in heteronuclear
multidimensional NMR employing pulsed field gradients. J Biomol NMR 4: 301-306
Seebauer JR, Moose SP, Fabbri BJ, Crossland LD, Below FE (2004) Amino acid metabolism
in young maize earshoots: implications for assimilate movement and nitrogen signaling.
Plant Physiol 136: 4326-4334
Slocum RD, Flores HE (1991) Biochemistry and Physiology of Polyamines in Plants. CRC
Press, Boca Raton, FL
Sobolev AP, Segre AL, Lamanna R (2003) Proton high-field NMR study of tomato juice.
Magn Reson Chem 41: 237-245
Stitt M, Muller C, Matt P, Gibon Y, Carillo P, Morcuendo R, Scheible WR, Krapp A
(2002) Steps towards an integrated view of nitrogen metabolism. J Exp Bot 53: 959-970
Sumner LW, Mendes P, Dixon RA (2003) Plant metabolomics: large-scale phytochemistry in
the functional genomics era. Phytochemistry 62: 817-836
Tabor CW, Tabor H (1984) Polyamines. Annu Rev Biochem 53: 749-790
Tretheway RN (2004) Metabolite profiling as an aid to metabolic engineering in plants. Curr
Opin Plant Biol 7: 196-201
Tucker GA (1993) Introduction. In Biochemistry of Fruit Ripening (GB Seymour, JE Taylor,
GA Tucker, eds, pp. 3–43. Chapman and Hall, London
www.plantphysiol.orgon May 24, 2018 - Published by Downloaded from Copyright © 2006 American Society of Plant Biologists. All rights reserved.
27
Uemura T, Tachihara K, Tomitori H, Kashiwagi K, Igarashi K (2005) Characteristics of the
polyamine transporter TPO1 and regulation of its activity and cellular localization by
phosphorylation. J Biol Chem 280: 9646-9652
Wallace HM, Fraser AV, Hughes A (2003) A perspective of polyamine metabolism. Biochem
J 376: 1-14
Weretilnyk EA, Bednarek S, McCue KF, Rhodes D, Hanson AD (1989) Comparative
biochemical and immunological studies of the glycine betaine synthesis pathway in diverse
families of dicotyledons. Planta 178: 342-352
Whitfield PD, German AJ, Noble P-JM (2004) Metabolomics: an emerging post-genomic tool
for nutrition. Brit J Nutrition 92: 549-555
Yoshida M, Kashiwagi K, Shigemasa A, Taniguchi S, Yamamoto K, Makinoshima H,
Ishihama A, Igarashi K (2004) A unifying model for the role of polyamines in bacterial cell
growth, the polyamine modulon. J Biol Chem 279: 46008-46013
Zeisel SH (2000) Choline: an essential nutrient for humans. Nutrition 16: 669-671
www.plantphysiol.orgon May 24, 2018 - Published by Downloaded from Copyright © 2006 American Society of Plant Biologists. All rights reserved.

28
Table I. List of resonances and variables* used for the evaluation of the
various metabolites
Resonance
number
Chemical shift, ppm Compound Variables,
number
1 1.0046 Ile* 1
2 1.0370 Val* 2
3 1.3284 Thr* 3
4 1.4780 Ala* 4
5 2.0687 Glu* 5
6 2.2880 GABA* 6
7 2.4245 Gln* 7
8 2.5397 Citrate* 8
9 2.7807 A (citrate pattern)* 9
10 2.7903 Asp* 10
11 2.8912 Asn* 11
12 2.9615 B, doublet, unknown* 12
13 3.1920 Choline* 13
14 3.2100 C singlet, choline
derivative*
14
15 3.2564 β-Glucose*,Ψ 20
16 3.3432 MeOH* 15
17 3.5625 β-Fructofuranose*,Ψ 19
18 3.5830 β-Fructopyranose*,Ψ 19
19 4.2940 Malate* 16
20 5.2327 α-Glucose*,Ψ 20
21 5.4059 Sucrose* 17
22 7.4195 Phe* 18
ΨIn the experimental conditions used (uniform concentration, buffered solvent for constant pH, constant temperature), the α and β isomers of glucose, and those of fructose, are in equilibrium and therefore the isomers were not considered as independent.
www.plantphysiol.orgon May 24, 2018 - Published by Downloaded from Copyright © 2006 American Society of Plant Biologists. All rights reserved.

29
Table II. ANOVA results (F and p-level) for red (RD) and pink
(PK) tomato samples divided into 2 groups (WT+AZ, 556HO+579HO)
RD PK
F p-level F p-level Ile
Val 11.0 0.005 9.4 0.008 Thr Ala 22.3 0.0003 Glu GABA Gln 49.9 0.000006 5.6 0.032 Citrate 28.9 0.0001 A 42.4 0.000014 Asp 11.5 0.004 Asn 33.2 0.00005 B 5.0 0.04 Choline 24.8 0.0002 7.6 0.015 C Glucose 23.4 0.0003 Fructose Malate 17.4 0.0009 Sucrose Phe Fumarate 45.2 0.00001 The variables with p-level higher than 0.05 (5%) are not significantly different in two groups and their F values are not shown.
www.plantphysiol.orgon May 24, 2018 - Published by Downloaded from Copyright © 2006 American Society of Plant Biologists. All rights reserved.
30
Figure Legends:
Figure 1. A typical 600 MHz 1H NMR spectrum of tomato fruit powder in D2O buffer solution
and resonance for some of the indicated metabolites.
Figure 2. Profiles of amino acids and GABA in wildtype (WT), azygous (556AZ), and two
homozygous, transgenic (556HO, 579HO) tomato fruits at four stages of ripening. Shown are
relative molecular abundance based on intensities of 1H NMR signals from indicated metabolites
in tomato fruit at four different stages of ripeness (MG, mature green; BR, breaker; PK, pink;
RD, red). Data given are means ± SEM. Asterisks ** and *** denote significant differences,
respectively, at p values <0.05 and <0.005 in the levels of indicated metabolite between the
transgenic fruits and the controls (WT and 556AZ). See also Supplemental Table I.
Figure 3. Profiles of organic acids and sugars (A), and choline and other metabolites (B) in
wildtype (WT), azygous (556AZ), and two homozygous, transgenic (556HO, 579HO) tomato
fruits at four stages of ripening (MG, mature green; BR, breaker; PK, pink; RD, red). The p
values of significant differences between the transgenics versus non-transgenic controls were:
0.0001 for citrate (***), 0.001 for malate (***), 0.00001 for fumarate (***), 0.015 at PK (**)
and 0.002 at RD (***) for choline, and 0.00001 for compound A (***). All other details are the
same as given in Fig. 2 legend. See also Supplemental Table I.
Figure 4. A typical representation of ratios: (A) fructose (fruc) to glucose (gluc) and (B) acid to
sugar, in transgenic (556HO and 579HO) fruits compared to azygous (556AZ) control fruit. The
ratio of acid to sugar (B) is given as the sum of citrate (citr) and malate to that of glucose plus
fructose plus sucrose. These results were generated from data given in Fig. 2. Azygous556 (clear
bars), 556HO (grey bars) and 579HO (black bars) fruits at mature green (MG), breaker (BR),
pink (PK) and red (RD) stages of ripening are represented. Data given are means + SEM. The p
values of significant differences between the transgenic versus azygous control are indicated for
the red fruits.
www.plantphysiol.orgon May 24, 2018 - Published by Downloaded from Copyright © 2006 American Society of Plant Biologists. All rights reserved.
31
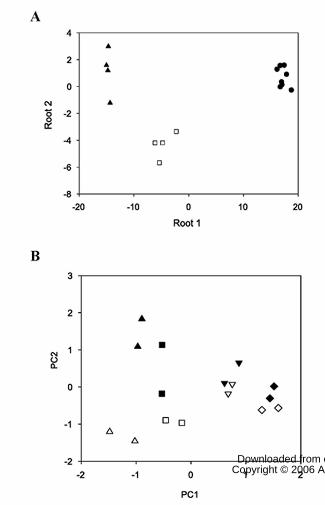
Figure 5. A. Linear discriminant analysis of sixteen tomato fruit samples. Symbols: ●, mature
green and breaker tomatoes; ❏, pink; ▲, red tomatoes. B. Principal component analysis-PCA-
map of sixteen tomato fruit samples. Symbols: ◊, mature green WT and 556AZ; ♦, mature green
556HO and 579HO; �, breaker WT and 556AZ; �, breaker 556HO and 579HO; ❏, pink WT
and 556AZ; ■, pink 556HO and 579HO; ∆, red WT and 556AZ; ▲, red 556HO and 579HO.
The following variables were included in the analysis: Glu, Val, compound A, glucose, Asp,
compound C, citrate, Asn, GABA, Ala, Phe, Thr and sucrose. ANOVA analysis provided in
Table II.
Figure 6. Rates of respiration in azygous and two transgenic fruits. Carbon dioxide evolution
from non-transgenic azygous (556AZ, ♦) and transgenic tomato fruit (556HO, ■; 579HO, ▲)
during ripening was measured in a flow-through system by gas chromatography. Ripening stages
were recorded based on color development. Data are represented as means ± SEM; for each n=8.
Figure 7. Real time PCR analysis of LePEPC2 (A) and LeICDH (B) transcript levels. The levels
of PEPC2 and ICDHc transcripts were determined relative to the calibrator azygous (556AZ, �)
at green (GR) stage. The ratio of transcript levels in transgenic fruit (556HO: filled bars) to those
in the azygous, control fruit (556AZ: open bars) at different stages (GR, BR, PK, RD) of
ripening is indicated on top of the filled bars. The range in variation is shown as error bars,
which was determined by evaluating the expression 2-∆∆CT with ∆∆CT+s and ∆∆CT–s, where s is
the standard deviation of the ∆∆CT value (n=3). The inset in A shows enlarged view of PEPC
transcript levels at PK and RD stages of 556AZ (open bars) and 556HO (filled bars) fruit.
Figure 8. An illustration of metabolic pathways for the biosynthesis of the identified
metabolites, pinpointing linkages between nitrogen and carbon metabolism in the transgenic
tomato fruits. Open arrows represent high (⇑), higher (⇑⇑), lower (⇓) or no change (⇔) in the
indicated metabolite levels in the transgenic, higher-polyamines accumulating red fruit
compared to wild-type/azygous fruit. Light-dark, stripped arrows indicate metabolites –
spermidine, spermine and ethylene - that were higher, and putrescine – that was lower, in the
transgenics than the controls (from Mehta et al., 2002). Dark arrows (��) indicate the sites of
www.plantphysiol.orgon May 24, 2018 - Published by Downloaded from Copyright © 2006 American Society of Plant Biologists. All rights reserved.

32
the reaction of the corresponding transcripts of PEPC and ICDHc whose levels were higher in
the transgenic fruit than the control fruit.
www.plantphysiol.orgon May 24, 2018 - Published by Downloaded from Copyright © 2006 American Society of Plant Biologists. All rights reserved.

www.plantphysiol.orgon May 24, 2018 - Published by Downloaded from Copyright © 2006 American Society of Plant Biologists. All rights reserved.

www.plantphysiol.orgon May 24, 2018 - Published by Downloaded from Copyright © 2006 American Society of Plant Biologists. All rights reserved.

www.plantphysiol.orgon May 24, 2018 - Published by Downloaded from Copyright © 2006 American Society of Plant Biologists. All rights reserved.

www.plantphysiol.orgon May 24, 2018 - Published by Downloaded from Copyright © 2006 American Society of Plant Biologists. All rights reserved.
www.plantphysiol.orgon May 24, 2018 - Published by Downloaded from Copyright © 2006 American Society of Plant Biologists. All rights reserved.

www.plantphysiol.orgon May 24, 2018 - Published by Downloaded from Copyright © 2006 American Society of Plant Biologists. All rights reserved.

www.plantphysiol.orgon May 24, 2018 - Published by Downloaded from Copyright © 2006 American Society of Plant Biologists. All rights reserved.

www.plantphysiol.orgon May 24, 2018 - Published by Downloaded from Copyright © 2006 American Society of Plant Biologists. All rights reserved.